Embed Size (px)
Citation preview
Concordia Bus Deutsche Bank HYB Conference
London – June 2002
2
Safe Harbour
The matters discussed in this presentation include
forward-looking statements that are subject to risks
and uncertainties including but not limited to
economic conditions, product demand, competitive
products and services, government regulation,
financial resources, certain litigation and other risks
indicated in filings with the US Securities and
Exchange commission
Frode Larsen - Chief Executive Officer
4
Corporate Purpose
TO BUILD A FOCUSSED, LEADING URBAN BUS
TRANSPORTATION COMPANY WITHIN EUROPE
THROUGH THE CREATION OF A PROFITABLE GROUP OF COMPANIES OPERATING UNDER
A STANDARD 'CONCORDIA CONCEPT' UNDER
THE VALUE BASED MANAGEMENT PHILOSOPHY FOR SUSTAINABLE VALUE GROWTH
FOR SHAREHOLDERS AND STAKEHOLDERS
5
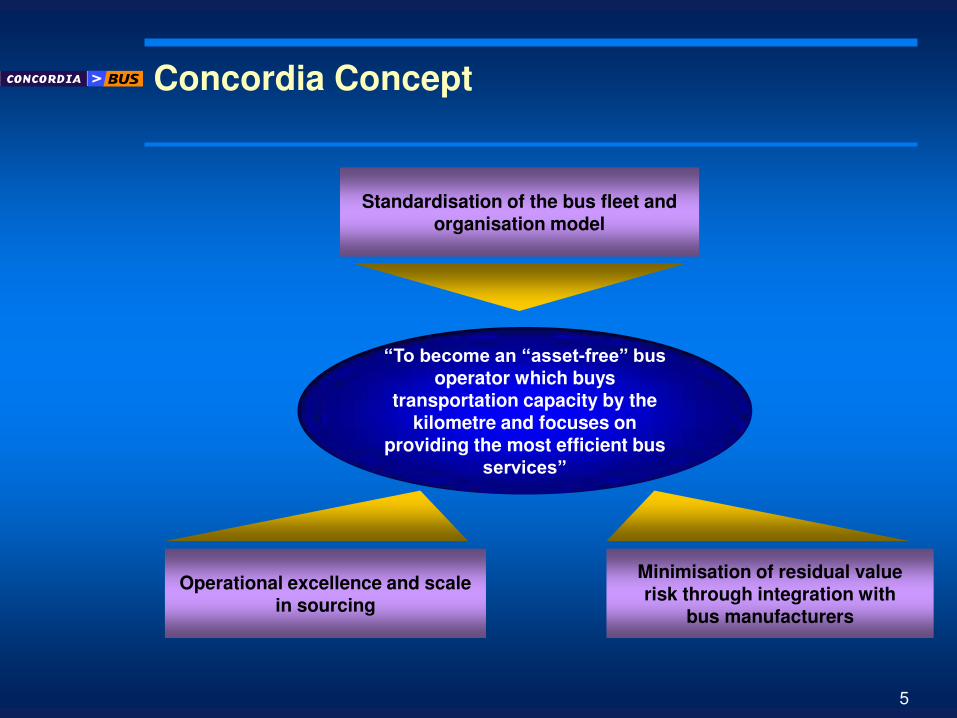
Concordia Concept
Standardisation of the bus fleet and organisation model
Minimisation of residual value risk through integration with
bus manufacturers
Operational excellence and scale in sourcing
“To become an “asset-free” bus operator which buys
transportation capacity by the kilometre and focuses on
providing the most efficient bus services”
6
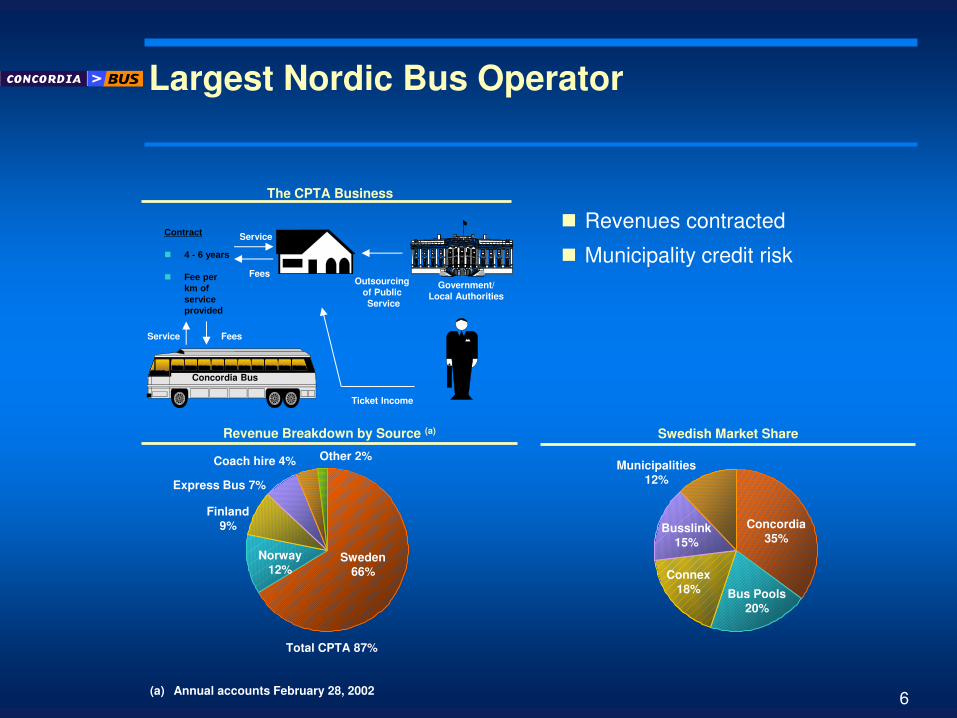
(a) Annual accounts February 28, 2002
Largest Nordic Bus Operator
Swedish Market Share
The CPTA Business
Service
Fees Outsourcing
of Public
Service
Government/
Local Authorities
Ticket Income
Concordia Bus
Contract
4 - 6 years
Fee per km of service provided
Service Fees
Concordia 35%
Bus Pools 20%
Connex 18%
Busslink 15%
Municipalities
12%
Revenue Breakdown by Source (a)
Sweden
66%
Norway
12%
Finland
9%
Express Bus 7%
Coach hire 4%
Total CPTA 87%
Other 2%
Revenues contracted
Municipality credit risk
7
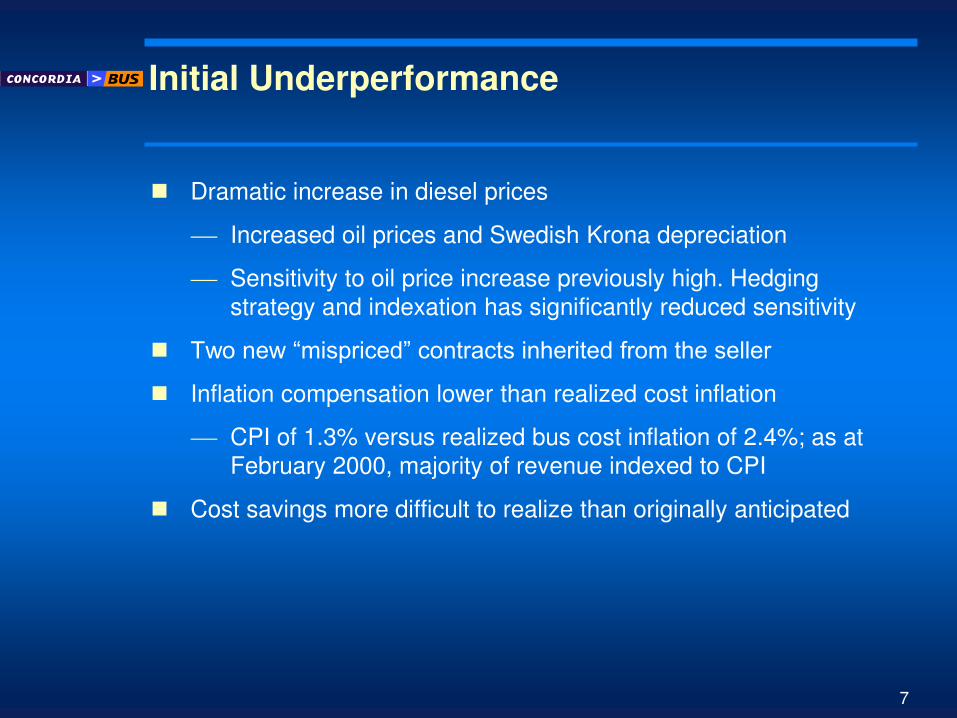
Initial Underperformance
Dramatic increase in diesel prices
Increased oil prices and Swedish Krona depreciation
Sensitivity to oil price increase previously high. Hedging
strategy and indexation has significantly reduced sensitivity
Two new “mispriced” contracts inherited from the seller
Inflation compensation lower than realized cost inflation
CPI of 1.3% versus realized bus cost inflation of 2.4%; as at
February 2000, majority of revenue indexed to CPI
Cost savings more difficult to realize than originally anticipated
8
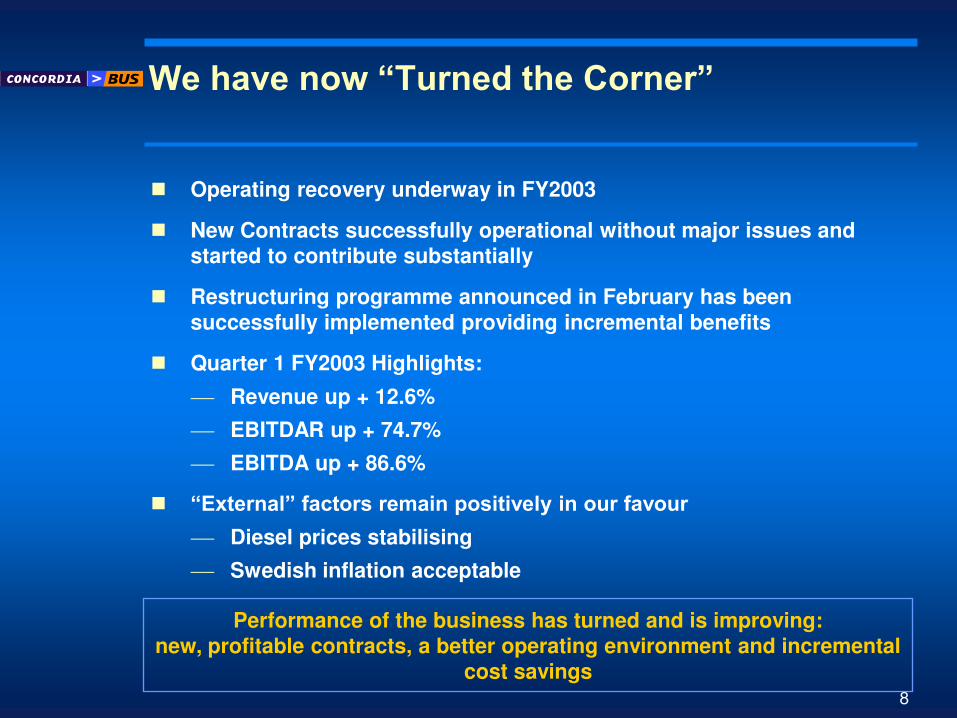
We have now “Turned the Corner”
Operating recovery underway in FY2003
New Contracts successfully operational without major issues and
started to contribute substantially
Restructuring programme announced in February has been
successfully implemented providing incremental benefits
Quarter 1 FY2003 Highlights:
Revenue up + 12.6%
EBITDAR up + 74.7%
EBITDA up + 86.6%
“External” factors remain positively in our favour Diesel prices stabilising
Swedish inflation acceptable
Performance of the business has turned and is improving:
new, profitable contracts, a better operating environment and incremental
cost savings
9
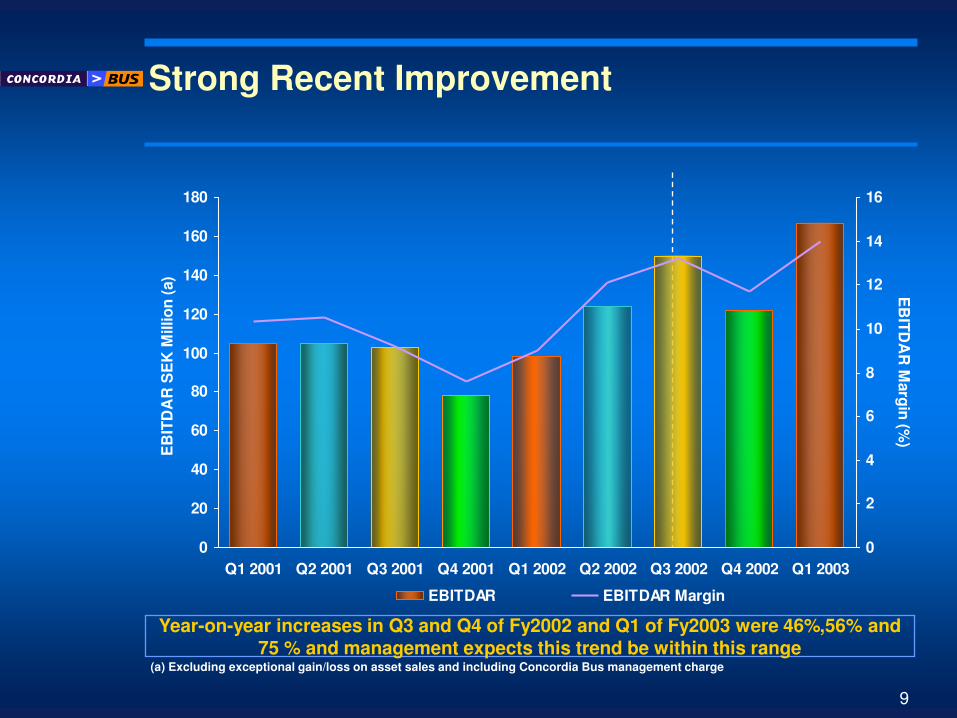
Strong Recent Improvement
Year-on-year increases in Q3 and Q4 of Fy2002 and Q1 of Fy2003 were 46%,56% and 75 % and management expects this trend be within this range
0
20
40
60
80
100
120
140
160
180
Q1 2001 Q2 2001 Q3 2001 Q4 2001 Q1 2002 Q2 2002 Q3 2002 Q4 2002 Q1 2003
EB
ITD
AR
SE
K M
illio
n (
a)
0
2
4
6
8
10
12
14
16
EB
ITD
AR
Marg
in (%
)
EBITDAR EBITDAR Margin
(a) Excluding exceptional gain/loss on asset sales and including Concordia Bus management charge
10
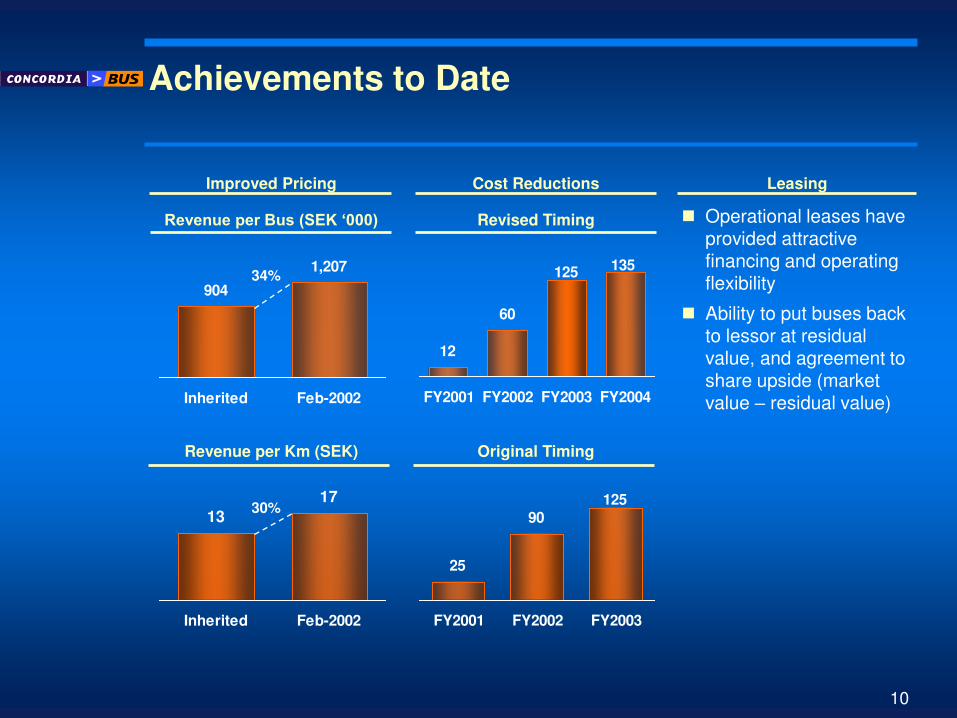
Achievements to Date
Leasing Cost Reductions
Operational leases have provided attractive financing and operating flexibility
Ability to put buses back to lessor at residual value, and agreement to share upside (market value – residual value)
Improved Pricing
904
1,207
Inherited Feb-2002
13
17
Inherited Feb-2002
34%
30%
12
60
125 135
FY2001 FY2002 FY2003 FY2004
Revenue per Bus (SEK ‘000) Revised Timing
25
90
125
FY2001 FY2002 FY2003
Revenue per Km (SEK) Original Timing
Vasant Mistry - Chief Financial Officer
12
Risks
Coverage and Management..……
13
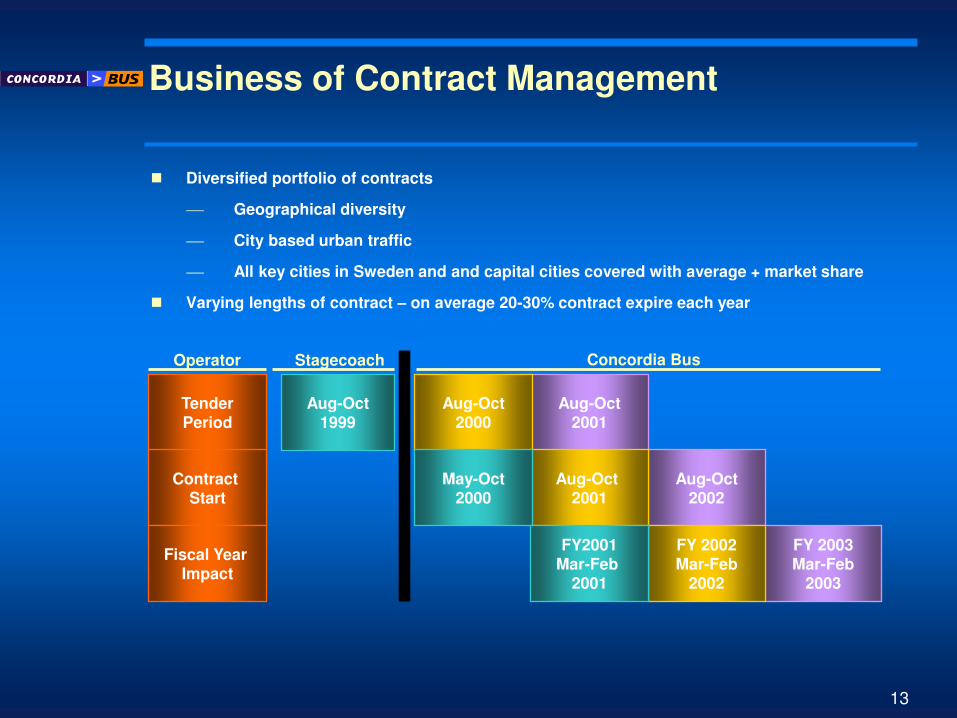
Business of Contract Management
Aug-Oct 2001
Aug-Oct 2000
Aug-Oct 1999
Tender Period
Aug-Oct 2002
Aug-Oct 2001
May-Oct 2000
Contract Start
FY 2003 Mar-Feb
2003
FY 2002 Mar-Feb
2002
FY2001 Mar-Feb
2001
Fiscal Year Impact
Operator Stagecoach Concordia Bus
Diversified portfolio of contracts
Geographical diversity
City based urban traffic
All key cities in Sweden and and capital cities covered with average + market share
Varying lengths of contract – on average 20-30% contract expire each year
14
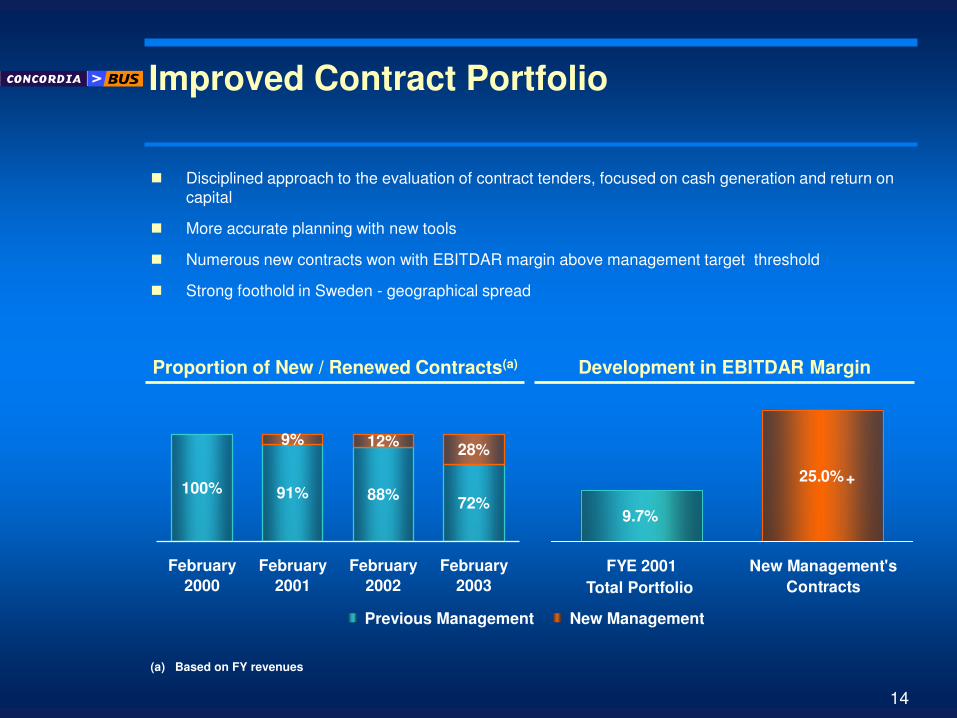
Improved Contract Portfolio
Disciplined approach to the evaluation of contract tenders, focused on cash generation and return on
capital
More accurate planning with new tools
Numerous new contracts won with EBITDAR margin above management target threshold
Strong foothold in Sweden - geographical spread
Proportion of New / Renewed Contracts(a) Development in EBITDAR Margin
Previous Management New Management
9.7%
25.0%
FYE 2001 New Management's
Contracts
100% 91% 88%72%
9% 12%28%
February
2000
February
2001
February
2002
February
2003
(a) Based on FY revenues
Total Portfolio
+
15
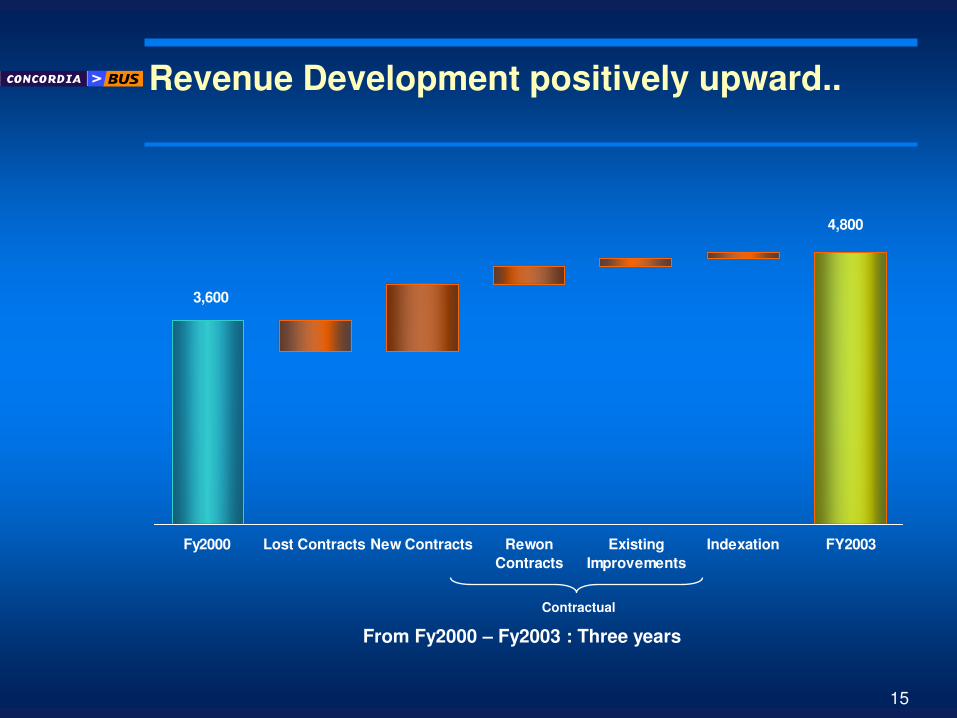
3,600
4,800
Fy2000 Lost Contracts New Contracts Rewon
Contracts
Existing
Improvements
Indexation FY2003
Revenue Development positively upward..
Contractual
From Fy2000 – Fy2003 : Three years
16
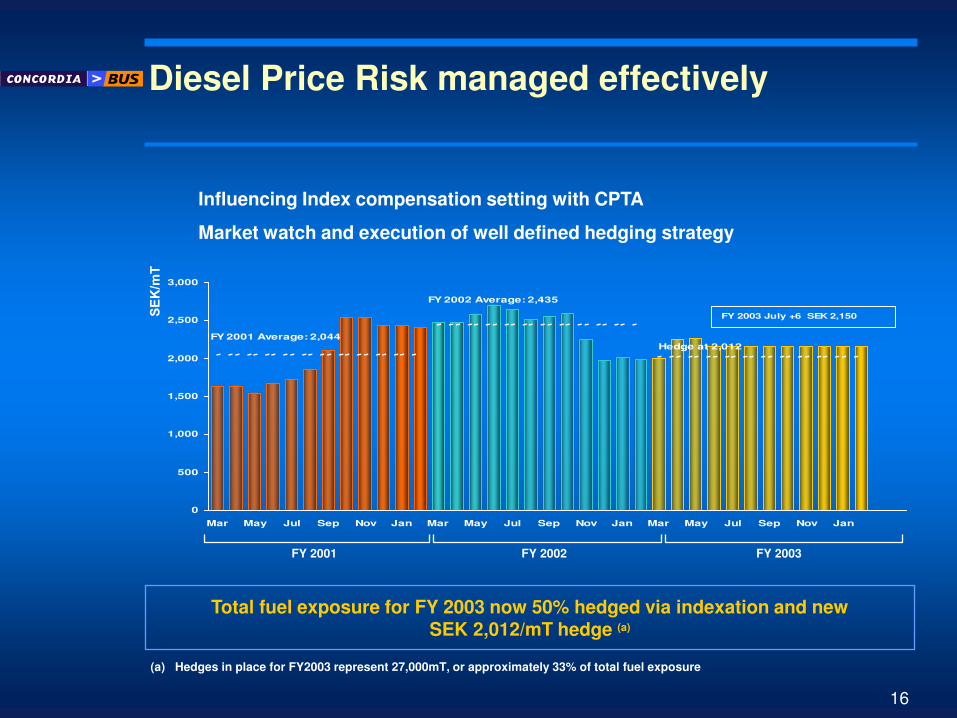
Diesel Price Risk managed effectively
FY 2001 Average: 2,044
FY 2002 Average: 2,435
Hedge at 2,012
0
500
1,000
1,500
2,000
2,500
3,000
Mar May Jul Sep Nov Jan Mar May Jul Sep Nov Jan Mar May Jul Sep Nov Jan
FY 2003 July +6 SEK 2,150
FY 2001 FY 2002 FY 2003
Total fuel exposure for FY 2003 now 50% hedged via indexation and new SEK 2,012/mT hedge (a)
(a) Hedges in place for FY2003 represent 27,000mT, or approximately 33% of total fuel exposure
Influencing Index compensation setting with CPTA
Market watch and execution of well defined hedging strategy
17
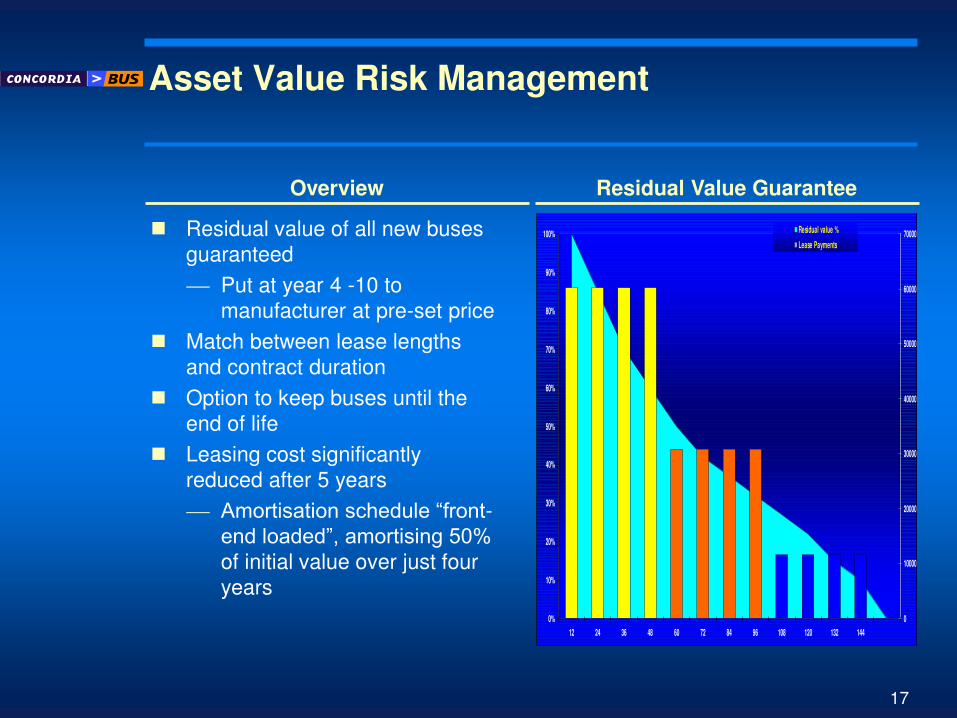
Asset Value Risk Management
Residual value of all new buses
guaranteed
Put at year 4 -10 to
manufacturer at pre-set price
Match between lease lengths
and contract duration
Option to keep buses until the
end of life
Leasing cost significantly
reduced after 5 years
Amortisation schedule “front-end loaded”, amortising 50% of initial value over just four
years
Overview Residual Value Guarantee
0%
10%
20%
30%
40%
50%
60%
70%
80%
90%
100%
12 24 36 48 60 72 84 96 108 120 132 144
0
10000
20000
30000
40000
50000
60000
70000Residual value %
Lease Payments
18
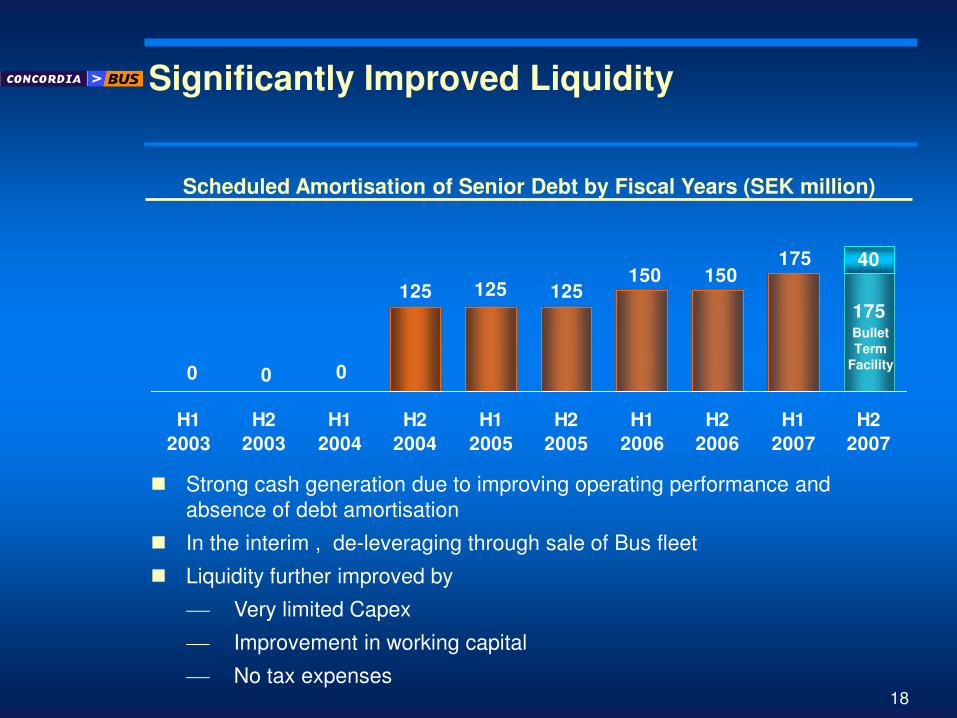
Significantly Improved Liquidity
Scheduled Amortisation of Senior Debt by Fiscal Years (SEK million)
175
175150150
125125
0 0 0
125
40
H1
2003
H2
2003
H1
2004
H2
2004
H1
2005
H2
2005
H1
2006
H2
2006
H1
2007
H2
2007
Strong cash generation due to improving operating performance and
absence of debt amortisation
In the interim , de-leveraging through sale of Bus fleet
Liquidity further improved by
Very limited Capex
Improvement in working capital
No tax expenses
Bullet
Term
Facility
19
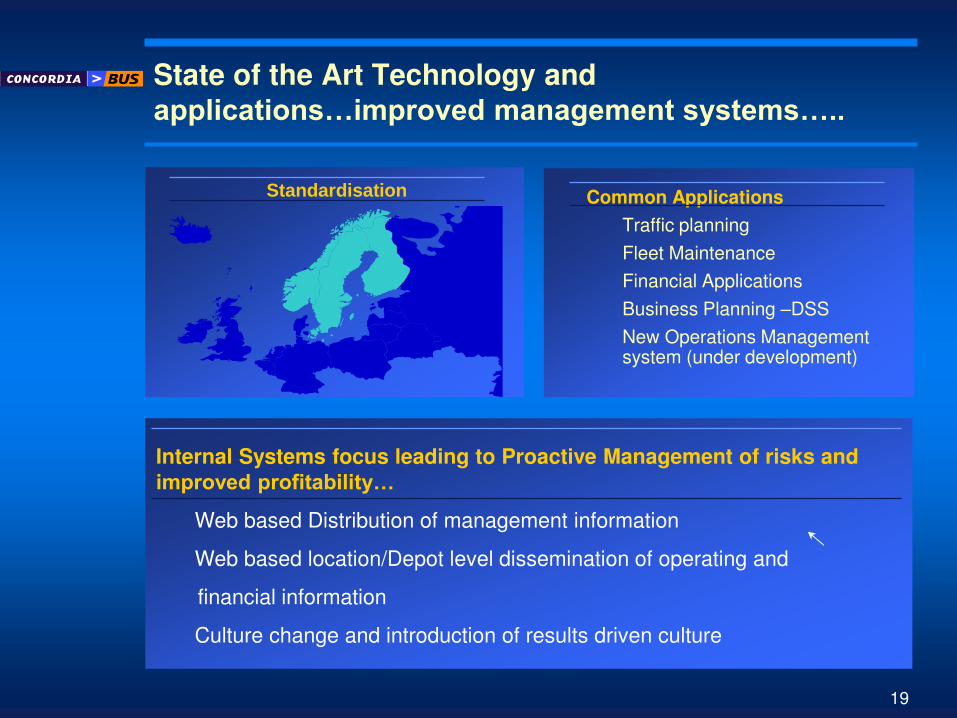
State of the Art Technology and
applications…improved management systems…..
Standardisation Common Applications
Traffic planning
Fleet Maintenance
Financial Applications
Business Planning –DSS
New Operations Management system (under development)
Internal Systems focus leading to Proactive Management of risks and
improved profitability…
Web based Distribution of management information
Web based location/Depot level dissemination of operating and
financial information
Culture change and introduction of results driven culture
20
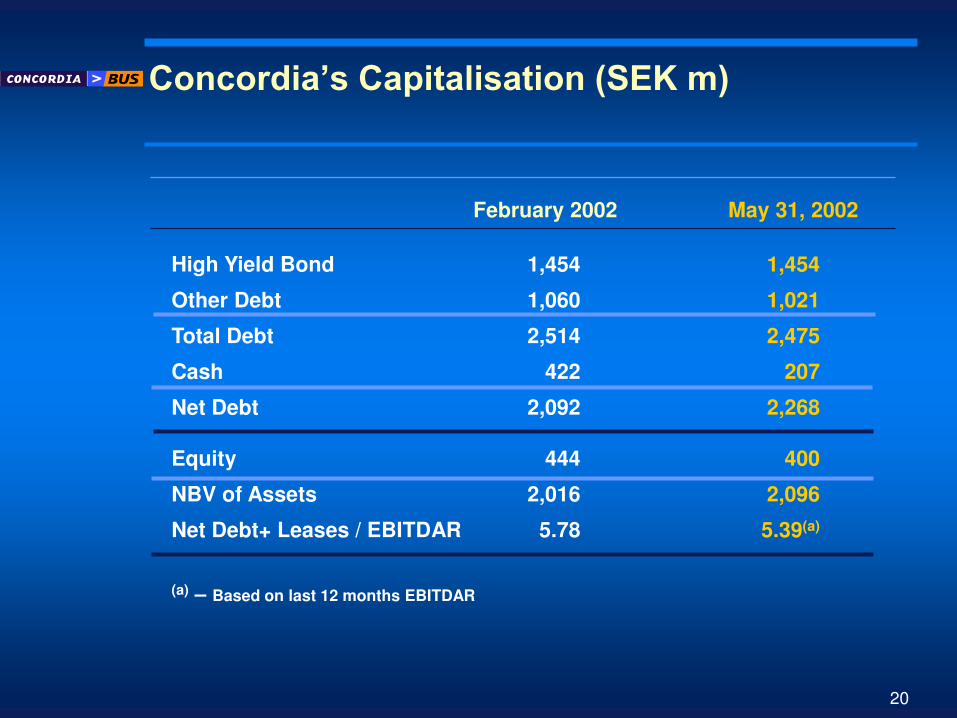
Concordia’s Capitalisation (SEK m)
May 31, 2002 February 2002
High Yield Bond 1,454 1,454
Other Debt 1,060 1,021
Total Debt 2,514 2,475
Cash 422 207
Net Debt 2,092 2,268
Equity 444 400
NBV of Assets 2,016 2,096
Net Debt+ Leases / EBITDAR 5.78 5.39(a)
(a) – Based on last 12 months EBITDAR
21
Financial Overview
Yes.. we are currently highly leveraged…but .
Top-line growth driven principally by introduction of new contracts already awarded
Vast majority of FY2003 revenues contractually agreed
EBITDAR development driven by introduction of new contracts in addition to unwinding of less profitable inherited contracts
Better Risk management and control systems
Continuing Restructuring will further enhance margin
Management incentivised to deliver financials
Strong Shareholder backing, improving credit ratios and macro and industry factors …
We are better prepared for the future than we were yesterday..
23
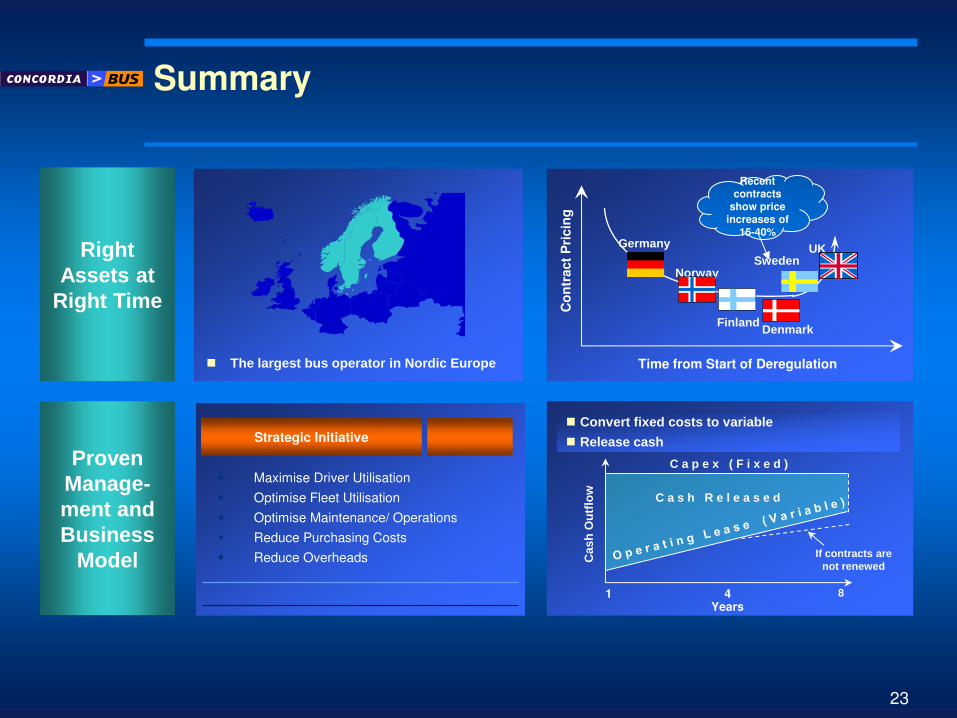
Summary
Right Assets at
Right Time
Proven Manage-ment and Business
Model
The largest bus operator in Nordic Europe
Maximise Driver Utilisation
Optimise Fleet Utilisation
Optimise Maintenance/ Operations
Reduce Purchasing Costs
Reduce Overheads
Strategic Initiative
Cas
h O
utf
low
4
If contracts are not renewed
C a s h R e l e a s e d
C a p e x ( F i x e d )
Convert fixed costs to variable
Release cash
1 8
Co
ntr
act
Pri
cin
g
Time from Start of Deregulation
Germany
Norway Sweden
Finland
UK
Recent contracts
show price increases of
15-40%
Denmark
Years
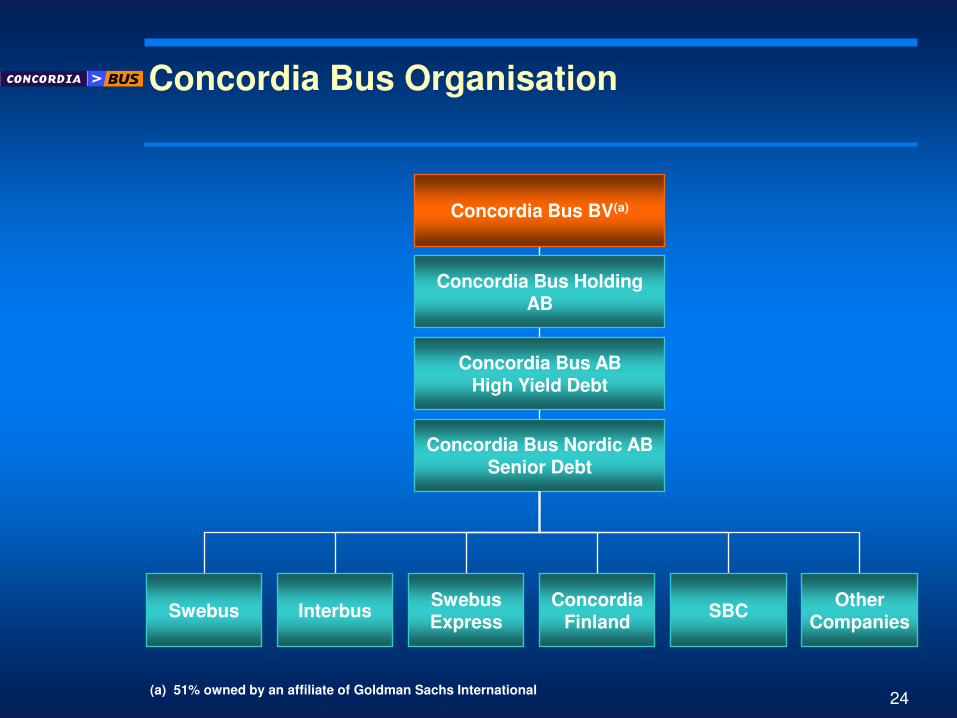
24
Concordia Bus Organisation
Concordia Bus AB High Yield Debt
Concordia Bus BV(a)
Concordia Bus Holding AB
Concordia Bus Nordic AB Senior Debt
Swebus SBC Interbus Concordia
Finland Swebus Express
Other Companies
(a) 51% owned by an affiliate of Goldman Sachs International