Embed Size (px)
Citation preview

7/28/2019 Day 2 1425 Pietro Martone Track 5
http://slidepdf.com/reader/full/day-2-1425-pietro-martone-track-5 1/15
Copyright © 2013 Accenture All rights reserved. Accenture, its logo, and High Performance Delivered are trademarks of Accenture.
100% NetworkedNetwork Analytics for LTE profitability
Accenture

7/28/2019 Day 2 1425 Pietro Martone Track 5
http://slidepdf.com/reader/full/day-2-1425-pietro-martone-track-5 2/15
7/28/2019 Day 2 1425 Pietro Martone Track 5
http://slidepdf.com/reader/full/day-2-1425-pietro-martone-track-5 3/15
Copyright © 2013 Accenture All rights reserved. 4
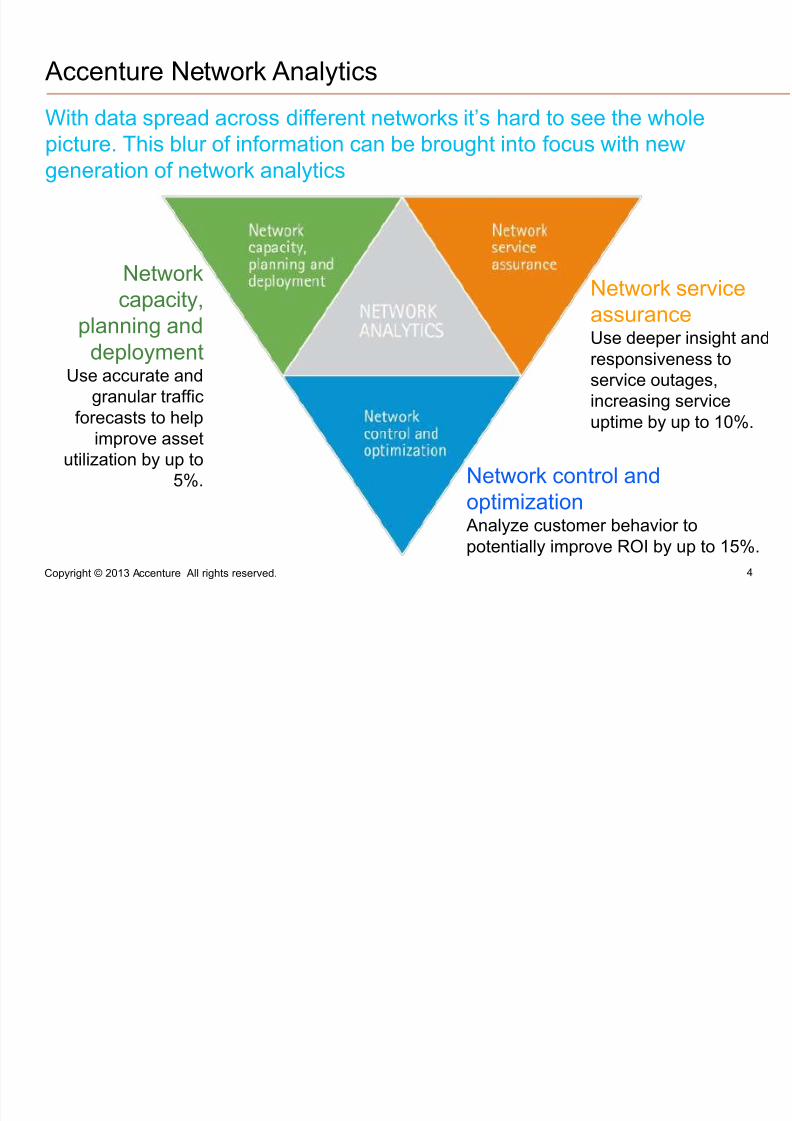
Accenture Network Analytics
Networkcapacity,
planning anddeployment
Use accurate andgranular traffic
forecasts to helpimprove asset
utilization by up to5%.
Network serviceassuranceUse deeper insight andresponsiveness toservice outages,increasing serviceuptime by up to 10%.
Network control andoptimization
Analyze customer behavior to
potentially improve ROI by up to 15%.
With data spread across different networks it’s hard to see the whole
picture. This blur of information can be brought into focus with newgeneration of network analytics
7/28/2019 Day 2 1425 Pietro Martone Track 5
http://slidepdf.com/reader/full/day-2-1425-pietro-martone-track-5 4/15
Copyright © 2013 Accenture All rights reserved. 5
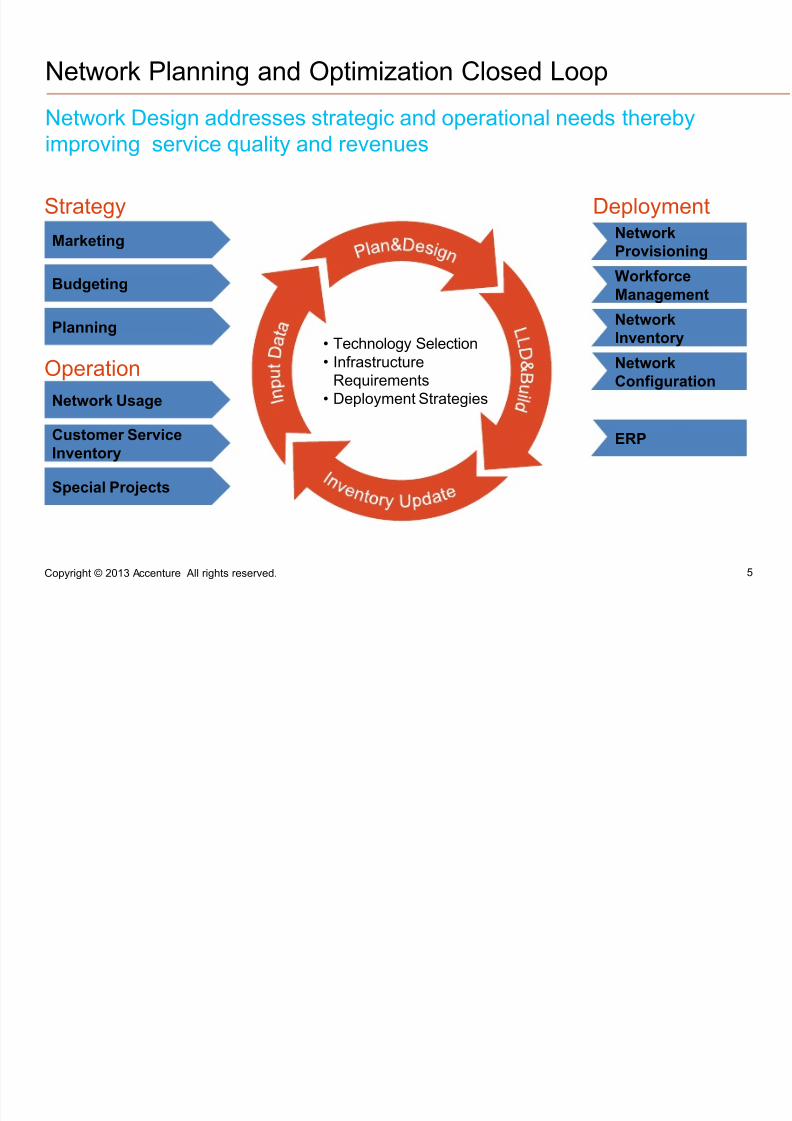
Deployment
Network Planning and Optimization Closed Loop
Strategy
Marketing
Budgeting
Planning
Operation
Network Usage
Special Projects
Customer Service
Inventory
• Technology Selection• Infrastructure
Requirements• Deployment Strategies
Network
Provisioning
WorkforceManagement
Network
Inventory
Network
Configuration
ERP
Network Design addresses strategic and operational needs thereby
improving service quality and revenues

7/28/2019 Day 2 1425 Pietro Martone Track 5
http://slidepdf.com/reader/full/day-2-1425-pietro-martone-track-5 5/15
Copyright © 2013 Accenture All rights reserved. 6
TeleCom Processes: Holistic view
Decision support model integrates commercial and technical information
Widgets
EntertainmentMRC
3 Month Avg. Bill $
Demographics
Zip Code
State
Region
Customer
Location
Credit Limit
Open to Buy
Credit Limit Hit
Late Payments
Credit
Tenure
Acct. Holder Age
Acct. Holder Sex
Lifestage Segment
HH Ownership
# of HH Residents
Max. Education
Income Level
Residency Tenure
Ethnicity
Voice
Data
Ownership
Video
Widgets
VAS
Bundles
Under Contract
Contract
RemainingMonths
STBOwnership
STBCapabilities
Devices
BHROwnership
Account
Acquisition / Churn
Voice
Product
Data
Video
Widgets
VAS
Ent. Features
Days SinceContact
Customer Support
Contacts LastWk.
Contacts YTD
ComplaintsLast Wk
Spec. Act. LastWk
ComplaintsYTD
Interaction
Last Bill Amount
Linear Plan
Pay-Per-View
VoD
Widgets
Value
EntertainmentNRC
OCC
Linear Viewership
UsageBehavior
PPV Viewership
VoD Viewership
Widget Usage
By ChannelGroup
by Genre, Day,Time
by Category,Genre
by Category,Genre
Type
Status
Classification
Devices
Dwelling Type
Customer Analytical Record (CAR *)
Network
Traffic XDR
Service Level
QoS
QoE calculation
Voice
NW counters
Network Analytics Extensions
…
…
…
…
…
2-3-4G Access
Core
Transport
Application Probes
NWtopology
User plane
Link usage
(*) CAR is Accenture’s patented methodology filed under US Patent # US 7,047,251 B2
Devices
Capabilities
Data
Radioconfig
Youtube
Backup
routes
…
Signaling
Screensize
…
Backhauling
Availability
Congestion
Data Dimensions
7/28/2019 Day 2 1425 Pietro Martone Track 5
http://slidepdf.com/reader/full/day-2-1425-pietro-martone-track-5 6/15
Copyright © 2013 Accenture All rights reserved. 7
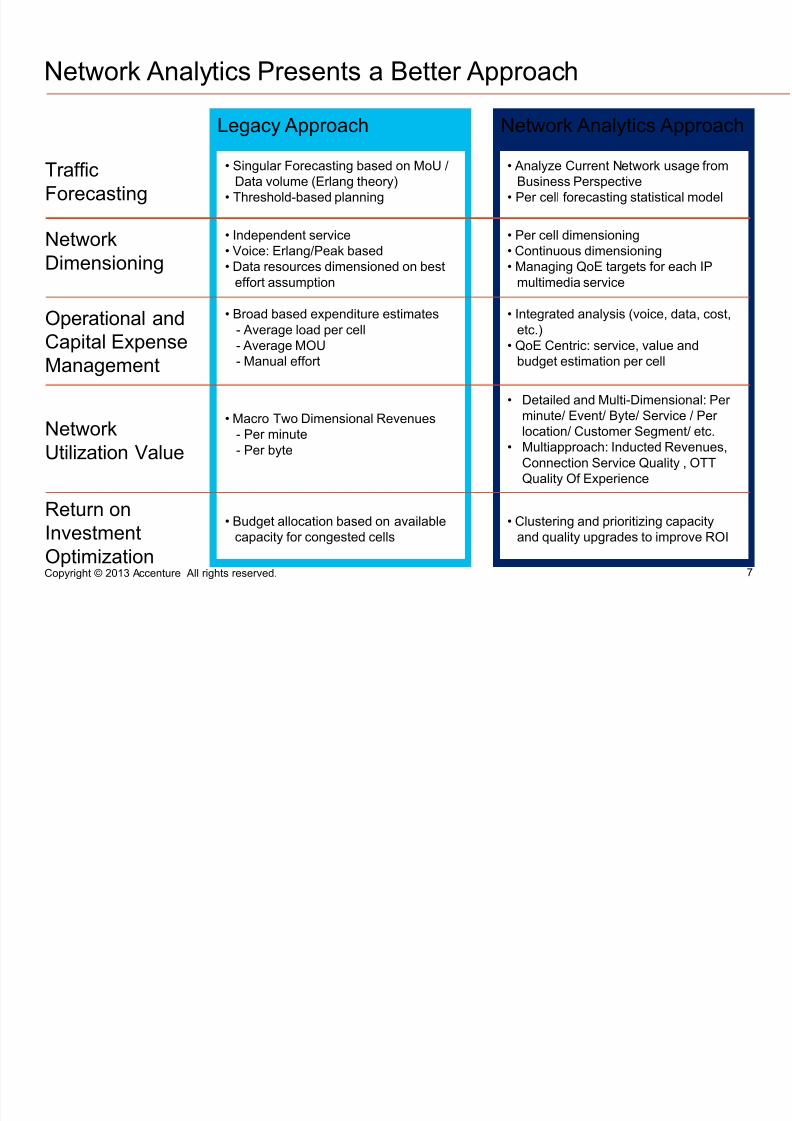
Network Analytics Presents a Better Approach
Network Analytics ApproachLegacy Approach
TrafficForecasting
NetworkDimensioning
Operational andCapital ExpenseManagement
NetworkUtilization Value
Return onInvestment
Optimization
• Singular Forecasting based on MoU /
Data volume (Erlang theory)• Threshold-based planning
• Independent service • Voice: Erlang/Peak based
• Data resources dimensioned on best
effort assumption
• Broad based expenditure estimates - Average load per cell- Average MOU- Manual effort
• Macro Two Dimensional Revenues - Per minute- Per byte
• Budget allocation based on available
capacity for congested cells
• Analyze Current Network usage fromBusiness Perspective
• Per cell forecasting statistical model
• Per cell dimensioning • Continuous dimensioning • Managing QoE targets for each IP
multimedia service
• Integrated analysis (voice, data, cost,
etc.)• QoE Centric: service, value and
budget estimation per cell
• Clustering and prioritizing capacity
and quality upgrades to improve ROI
• Detailed and Multi-Dimensional: Per
minute/ Event/ Byte/ Service / Per location/ Customer Segment/ etc.
• Multiapproach: Inducted Revenues,Connection Service Quality , OTTQuality Of Experience

7/28/2019 Day 2 1425 Pietro Martone Track 5
http://slidepdf.com/reader/full/day-2-1425-pietro-martone-track-5 7/15Copyright © 2013 Accenture All rights reserved. 8
Traffic Forecasting: Network Usage – Business PoV
Business Perspective• Market segment
geographic distributionand drill down
• Service used bycustomer type
• Device presence in thenetwork (type, models,etc.)
• Device Vendors MarketShare
• Speed of moving
• …
Geographical ARPUanalysis
Device presence in the network
7/28/2019 Day 2 1425 Pietro Martone Track 5
http://slidepdf.com/reader/full/day-2-1425-pietro-martone-track-5 8/15Copyright © 2013 Accenture All rights reserved. 9
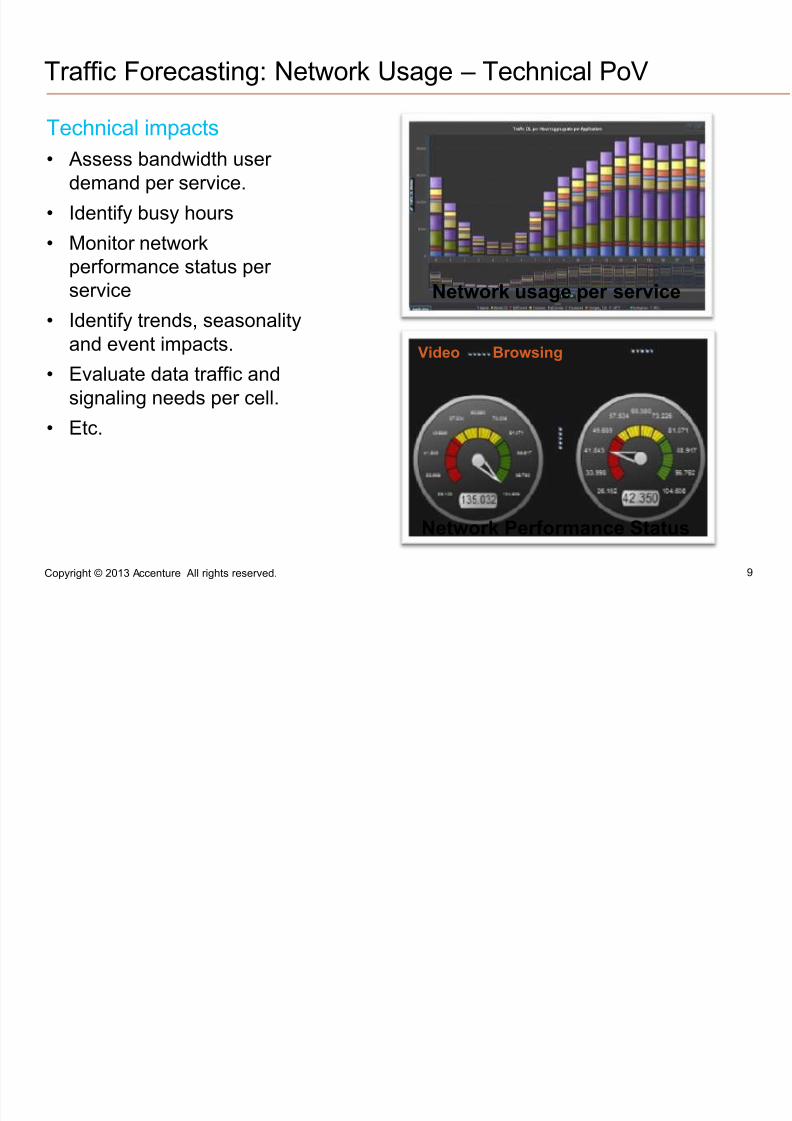
Video Browsing
Traffic Forecasting: Network Usage – Technical PoV
Technical impacts• Assess bandwidth user
demand per service.
• Identify busy hours
• Monitor network
performance status per service
• Identify trends, seasonalityand event impacts.
• Evaluate data traffic andsignaling needs per cell.
• Etc.
Network Performance Status
Network usage per service

7/28/2019 Day 2 1425 Pietro Martone Track 5
http://slidepdf.com/reader/full/day-2-1425-pietro-martone-track-5 9/15Copyright © 2013 Accenture All rights reserved. 10
Traffic Forecasting – Congestion Prediction
Advanced forecasting approach anticipates cell congestion and focuses
on clients’ quality of experience.
Sample cell congestion forecast
+9 month forecast
+6 month forecast
+ 3 month forecast
Congestion probability
Mbps

7/28/2019 Day 2 1425 Pietro Martone Track 5
http://slidepdf.com/reader/full/day-2-1425-pietro-martone-track-5 10/15Copyright © 2013 Accenture All rights reserved. 11
Continuous Dimensioning
Based on an accurate congestion, forecasting cells can be dimensioned
closer to cell traffic peak, thereby increasing network investmentsefficiency.
Inefficiency AreaCell CapacityOver Peak Dimensioning
0
10000
20000
30000
40000
50000
60000
70000
80000
90000
100000
0 5 10 15 20
7/28/2019 Day 2 1425 Pietro Martone Track 5
http://slidepdf.com/reader/full/day-2-1425-pietro-martone-track-5 11/15Copyright © 2013 Accenture All rights reserved. 12
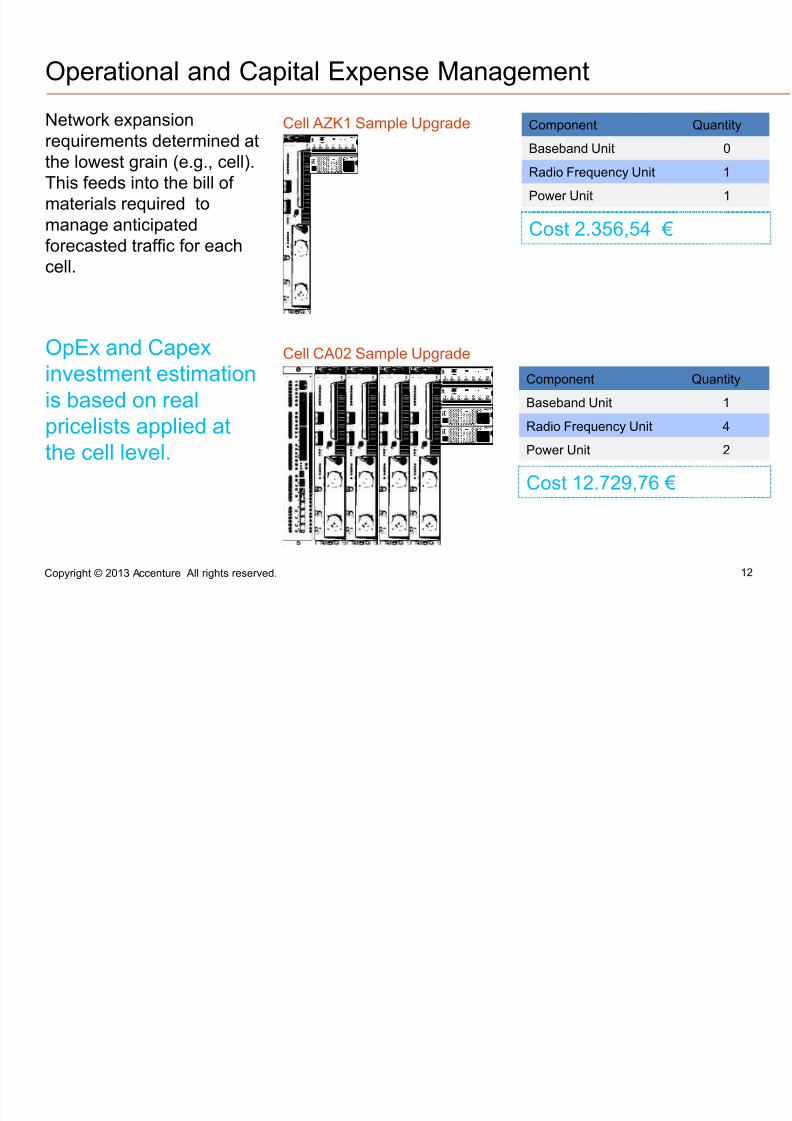
Operational and Capital Expense Management
OpEx and Capexinvestment estimationis based on realpricelists applied atthe cell level.
Cell CA02 Sample Upgrade
Component Quantity
Baseband Unit 0
Radio Frequency Unit 1
Power Unit 1
Cost 2.356,54 €
Component Quantity
Baseband Unit 1
Radio Frequency Unit 4
Power Unit 2
Cost 12.729,76 €
Cell AZK1 Sample UpgradeNetwork expansion
requirements determined atthe lowest grain (e.g., cell).This feeds into the bill of materials required tomanage anticipatedforecasted traffic for eachcell.

7/28/2019 Day 2 1425 Pietro Martone Track 5
http://slidepdf.com/reader/full/day-2-1425-pietro-martone-track-5 12/15Copyright © 2013 Accenture All rights reserved. 13
Network Usage Service Based Value
The value of traffic for cell upgrades can now be determined according
the TelCo strategy balancing tree dimensions
Upgrade of a cell attracts additional traffic
0
10000
20000
30000
40000
50000
60000
70000
80000
90000
100000
0 5 10 15 20
Inducted Traffic
InductedRevenues
ConnectionServiceQuality
OTTQuality of
Experience
Inducted traffic value dimension

7/28/2019 Day 2 1425 Pietro Martone Track 5
http://slidepdf.com/reader/full/day-2-1425-pietro-martone-track-5 13/15Copyright © 2013 Accenture All rights reserved. 14
Network Usage Service Based Value
Specific location capacity expansion value should be based on
Inducted
Revenues
Increment customer ARPU
and network usage
• ToP Spenders location• Premium Services (ex
video, music,bandwidth boost)location
• Regions where islocated under usedequipment
• …
Connection Service
Quality
Contain costs of customer
operations
• Lower Troughtputlocations
• Dropped Sessionlocations
• In house networkcoverage location
• Locations whereclaims came from
• …
OTT Quality Of
Experience
Increase appeal in the
market and loyalty
• Location with lowbandwidth for popular services: videostreaming, social
networking, etc.• Areas where popular
website register longest pagedownload time
• …
7/28/2019 Day 2 1425 Pietro Martone Track 5
http://slidepdf.com/reader/full/day-2-1425-pietro-martone-track-5 14/15Copyright © 2013 Accenture All rights reserved. 15
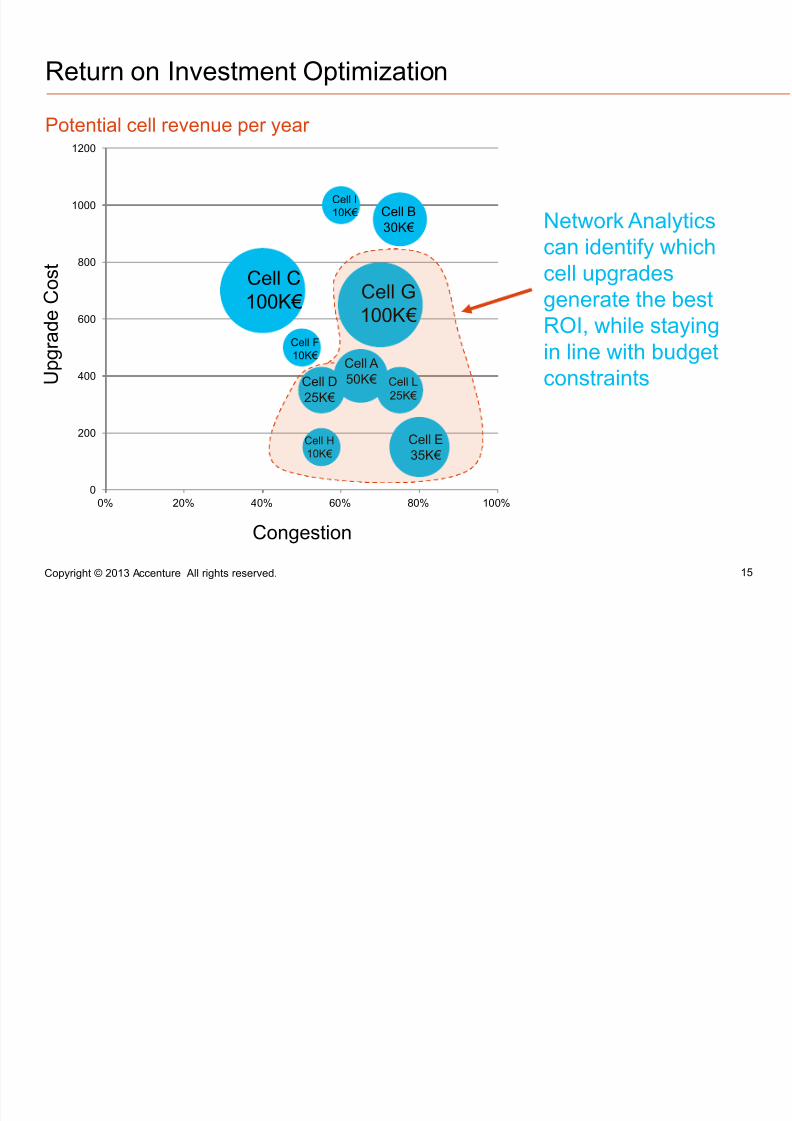
Return on Investment Optimization
0
200
400
600
800
1000
1200
0% 20% 40% 60% 80% 100%
U p g r a d e C o s
t
Congestion
Cell G100K €
Cell C100K €
Cell B30K €
Cell I10K €
Cell F10K €
Cell L25K €
Cell A50K €
Cell E35K €
Cell D25K €
Cell H10K €
Potential cell revenue per year
Network Analyticscan identify which
cell upgradesgenerate the bestROI, while stayingin line with budgetconstraints
7/28/2019 Day 2 1425 Pietro Martone Track 5
http://slidepdf.com/reader/full/day-2-1425-pietro-martone-track-5 15/15
Copyright © 2013 Accenture All rights reserved. 16
Summary
• There is a critical need to adopt an analytics-
based approach to optimize network Capexand OPEX.• Granularity of analysis and speed of
intelligence across network optimization arecritical to enhance end-customer experienceand value.
• Telecos need a flexible and scalable networkanalytics framework to handle data of ever-increasing volume, velocity and variety.
• Accenture has technical and domainknowledge to help operationalize networkanalytics insights:
– the comprehensive understanding of data andnetwork architectures
– KPIs to tell you where to extract meaningful data
– and tools and methodologies to analyze large
quantities of data
– all backed by 20,000 analytics skilled
professionals worldwide