Embed Size (px)
Citation preview

David Morgan Chief Executive OfficerDavid Clarke Group Executive Wealth ManagementPhilip Chronican Chief Financial Officer
31 October 2002

2 Full year results - 2002
A transformational year
• Earnings momentum maintained
• Business repositioned for growth
• Quality of earnings improved
3 Full year results - 2002
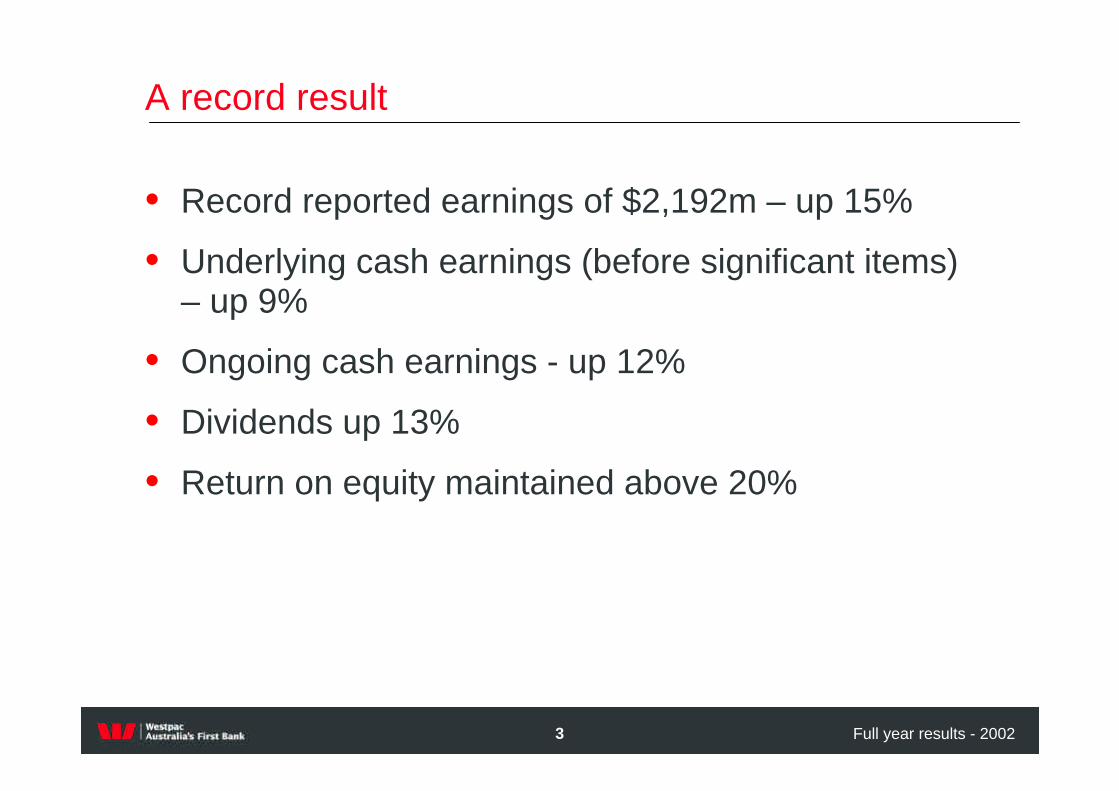
A record result
• Record reported earnings of $2,192m – up 15%
• Underlying cash earnings (before significant items) – up 9%
• Ongoing cash earnings - up 12%
• Dividends up 13%
• Return on equity maintained above 20%

4 Full year results - 2002
Reconciliation of ongoing earnings
2%
6%
98
(51)
100
(48)
Add goodwill Less distributions on other equity instruments
9%1,9012,063Underlying cash earnings
12%1,7491,957Ongoing cash earnings
(106)
2,011
(181)
2,192
2002 % Change2001
(30%)(152)Less AGC NPAT
Large(49)Less individually significant items1
8%1,854Underlying NPAT
15%1,903Reported NPAT
1. Individually significant items in 2001 includes embedded value uplift
5 Full year results - 2002
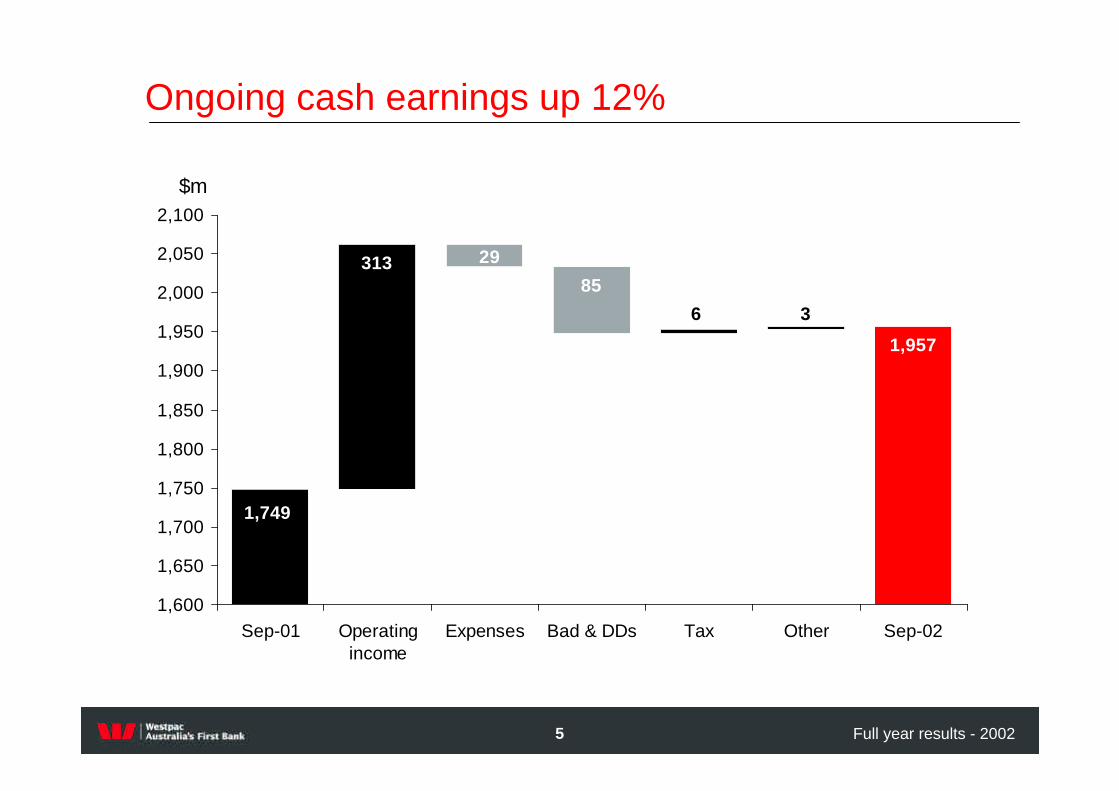
313
1,749
1,957
6
85
29
3
1,600
1,650
1,700
1,750
1,800
1,850
1,900
1,950
2,000
2,050
2,100
Sep-01 Operatingincome
Expenses Bad & DDs Tax Other Sep-02
$m
Ongoing cash earnings up 12%
6 Full year results - 2002
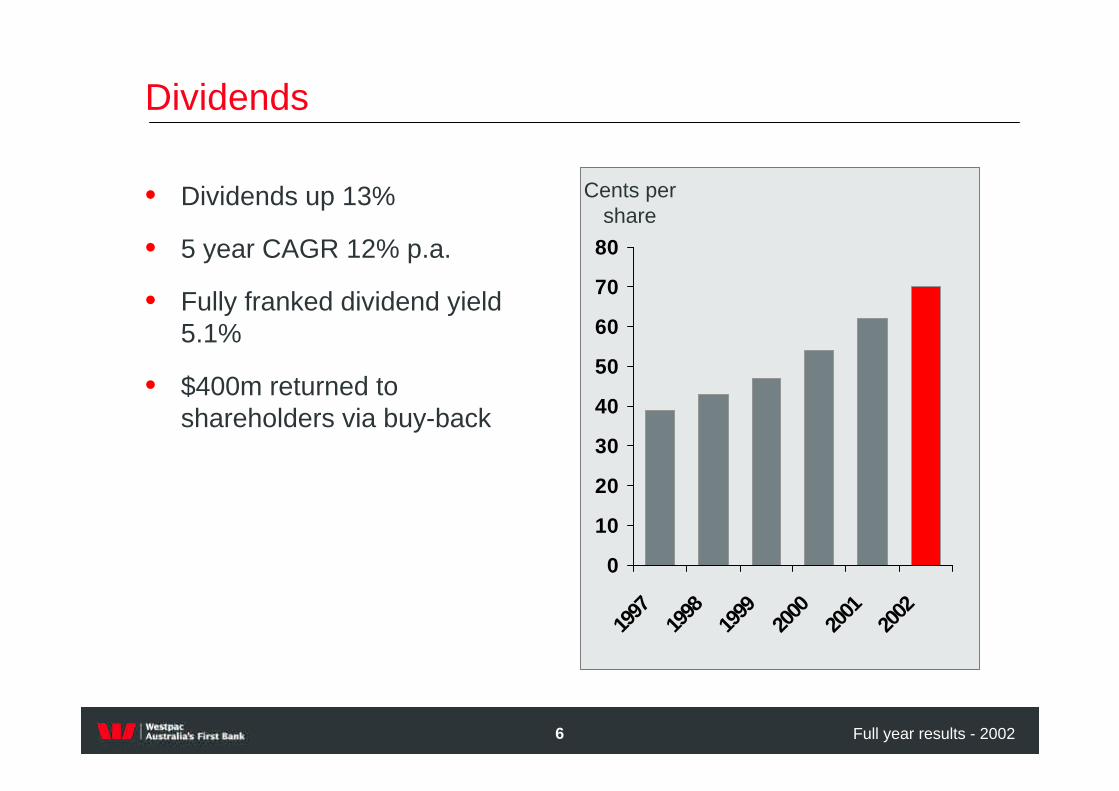
Dividends
• Dividends up 13%
• 5 year CAGR 12% p.a.
• Fully franked dividend yield 5.1%
• $400m returned to shareholders via buy-back
0
10
20
30
40
50
60
70
80
1997
1998
1999
2000
2001
2002
Cents per share

7 Full year results - 2002
Low growth/higher risk business
Rated funds & distribution
Infrastructure expertise
Product & platform capability, funds scale
AGC divestment
Rothschild acquisition
Hastings acquisition
BT Financial Group acquisition
Core strategic rationaleCorporate activity
Rebalanced business mix enhancing growth
• Near term strategic agenda complete
• Rebalancing achieved with ROE remaining above 20%

8 Full year results - 2002
Improved risk profile and reduced volatility
• Sold AGC – higher risk finance company
• Diversified income streams
• Quarantined high yield debt portfolio
• Brought significant items to account
- Removed embedded value- Better alignment of capitalised expenditure - Re-valued superannuation asset
• Improved asset quality

9 Full year results - 2002
Recognition of individually significant items
• Right time and opportunity- Major repositioning- Ongoing earnings - Greater transparency – “more relevant & reliable”- Adoption of International Accounting Standards by 2005
• Key actions- Removed embedded value- Recognised goodwill on acquisitions- Adopted IAS on superannuation- Reduced capitalised expenditure- Revalued investment portfolio- Plan to expense equity based compensation
Improve quality and sustainability of future earnings
10 Full year results - 2002
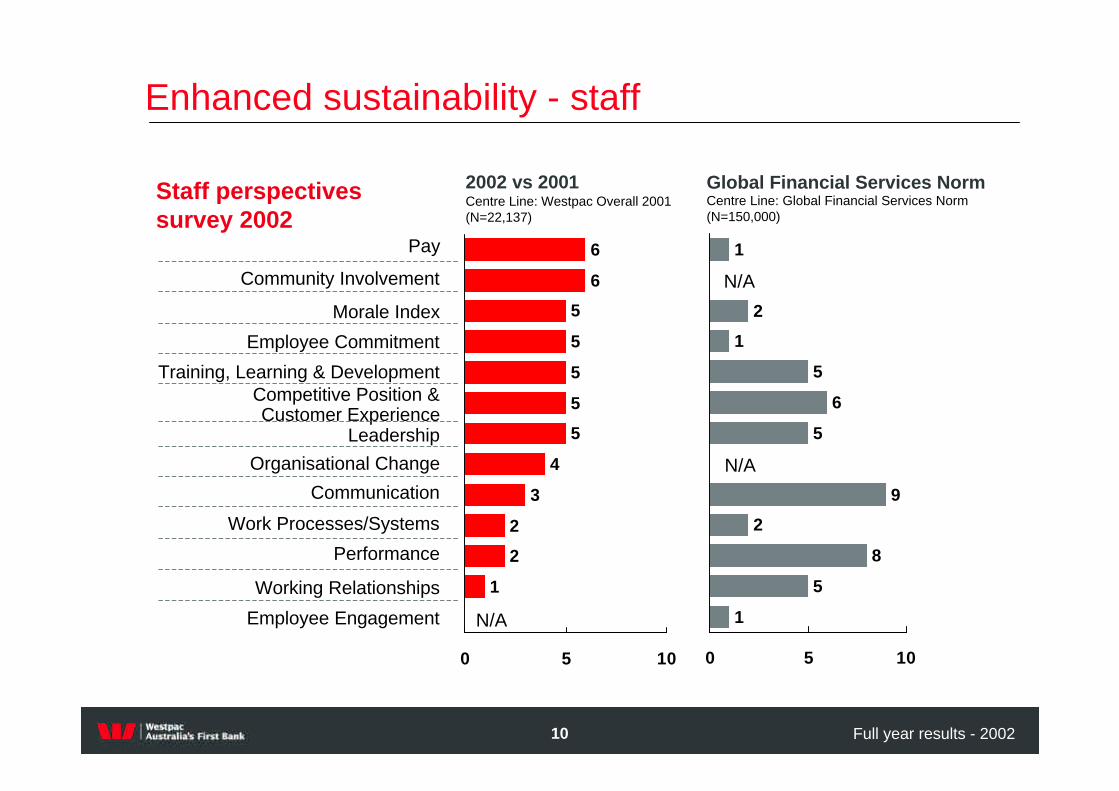
Enhanced sustainability - staff
Centre Line: Global Financial Services Norm (N=150,000)
Global Financial Services Norm
1
2
1
5
6
5
9
2
8
5
1
0 5 10
N/A
N/A
6
6
5
5
5
5
5
4
3
2
2
1
0 5 10
N/A
Community Involvement
Morale Index
Employee Commitment
Training, Learning & Development
LeadershipOrganisational Change
Communication
Performance
Working Relationships
Work Processes/Systems
Employee Engagement
Competitive Position & Customer Experience
Pay
Centre Line: Westpac Overall 2001 (N=22,137)
2002 vs 2001Staff perspectives survey 2002

11 Full year results - 2002
Enhanced sustainability - customers
0
5
10
15
20
Mar-99 Mar-02 Sep-02
%
Per
cen
t in
Seg
men
t
Economic Profit
Value Shift
Low HighCustomer Value Segments
-ve +ve
*average of other major banks
1 Source Roy Morgan Research June 2002
% of personal MFI customers very or fairly satisfied1
50
55
60
65
70
Sep-00 Dec-00 Mar-01 Jun-01 Sep-01 Dec-01 Mar-02 Jun-02
Westpac Peer average*
% of personal MFI customers very or fairly dissatisfied1
13
15
17
19
21
23
Sep-00 Dec-00 Mar-01 Jun-01 Sep-01 Dec-01 Mar-02 Jun-02
Westpac Peer average*

12 Full year results - 2002
• Number 1 SMH/Age Good Reputation Index 2002
• Number 1 bank globally in Dow Jones Sustainability Index 2002/03
• First social impact report produced
Enhanced sustainability - governance & reputation

13 Full year results - 2002
Executive compensation
• Retained and reshaped long term incentives
- All long term incentives hurdled and eligibility reduced- Hurdles tightened (no vesting at <50th percentile)- Moving from 100% options to - 50% performance
options, 50% performance share rights
• Cost of equity based compensation in 2002 $48m (pre tax)
• Will expense options when Australian accounting standard in place (expensed in US GAAP in 2002)
Philip Chronican Chief Financial Officer
31 October 2002

15 Full year results - 2002
Earnings terminology
Reported - includes everything
Underlying - removes individually significant items
Ongoing - removes individually significant items and AGC
Focus on underlying given:
• Significant items are truly non-recurring
• Provides a more appropriate starting point for 2003
• Base on which dividends are determined

16 Full year results - 2002
Underlying cash earnings
(2%)(98)(100)Goodwill
9%1,9012,063Cash earnings
6%(51)(48)Preference dividends
2%98100Goodwill
8%1,8542,011Net profit after tax
(5)
(774)
2,790
(461)
3,351
(3,452)
2,518
4,285
2002
-(5)Outside equity interests
5%(812)Tax
4%2,671Net profit before tax
(6%)(433)Bad debts
5%3,202Underlying profit
1%(3,472)Operating expenses
2%2,474Non interest income
2%4,200Net interest Income
% Change2001$ million

17 Full year results - 2002
\
Ongoing cash earnings
(2%)(98)(100)Goodwill
12%1,7491,957Cash earnings
6%(51)(48)Preference dividends
2%98100Goodwill
12%1,7021,905Net profit after tax
(5)
(710)
2,620
(360)
3,038
(3,358)
2,469
3,969
2002
-(5)Outside equity interests
1%(716)Tax
8%2,423Net profit before tax
(31%)(275)Bad debts
9%2,796Underlying profit
(1%)(3,329)Operating expenses
2%2,415Non interest income
7%3,710Net interest Income
% Change2001$ million

18 Full year results - 2002
Business unit performance
-100 0 100 200 300 400
Aust other wealth
NZ Funds Mgt
NZ life
Aust Life
Pacific Bank
Aust Funds Mgt
Business Products
Consumer Distr.
NZ Retail
Instit. Bank
Bus. & Reg. Banking
Consumer Products
8
12
13
15
63
(2)
(2)
(20)
(93)
56
(50)
69
-100 -50 0 50 100
* Ongoing businesses (excludes group items)
Net Profit Contribution to growth
$m $m
20022001

19 Full year results - 2002
Analysis of margin dynamics
3.032.993.053.11Normalised margin
2.802.702.903.11Reported margin
0.05
0.18
2002
0.09
0.20
H2 2002
-
0.15
H1 2002
-
-
2001
0.16Impact of AGC sale
0.20Impact of bill acceptance funding
2003*
* Full year impact of 2002 items
20 Full year results - 2002
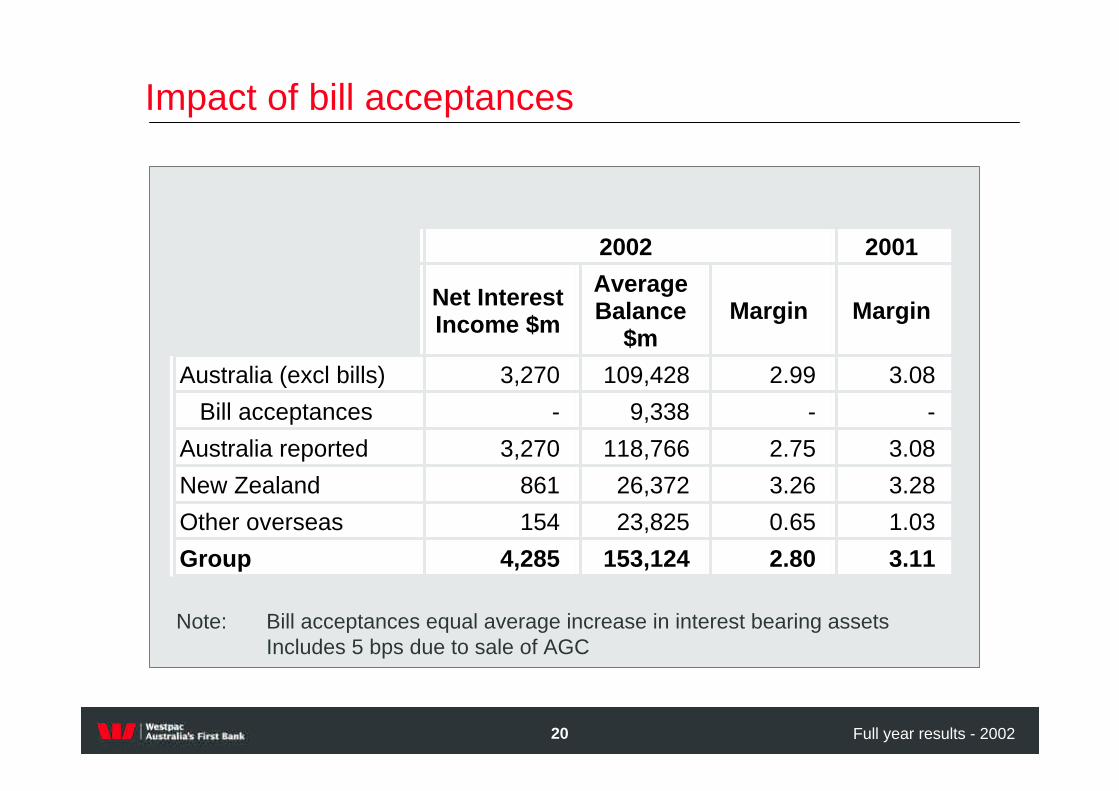
Impact of bill acceptances
--9,338-Bill acceptances
3.082.75118,7663,270Australia reported
20012002
2.80
0.65
3.26
2.99
Margin
4,285
154
861
3,270
Net Interest Income $m
3.11153,124Group
1.0323,825Other overseas
3.2826,372New Zealand
3.08109,428Australia (excl bills)
MarginAverage Balance
$m
Note: Bill acceptances equal average increase in interest bearing assetsIncludes 5 bps due to sale of AGC
21 Full year results - 2002
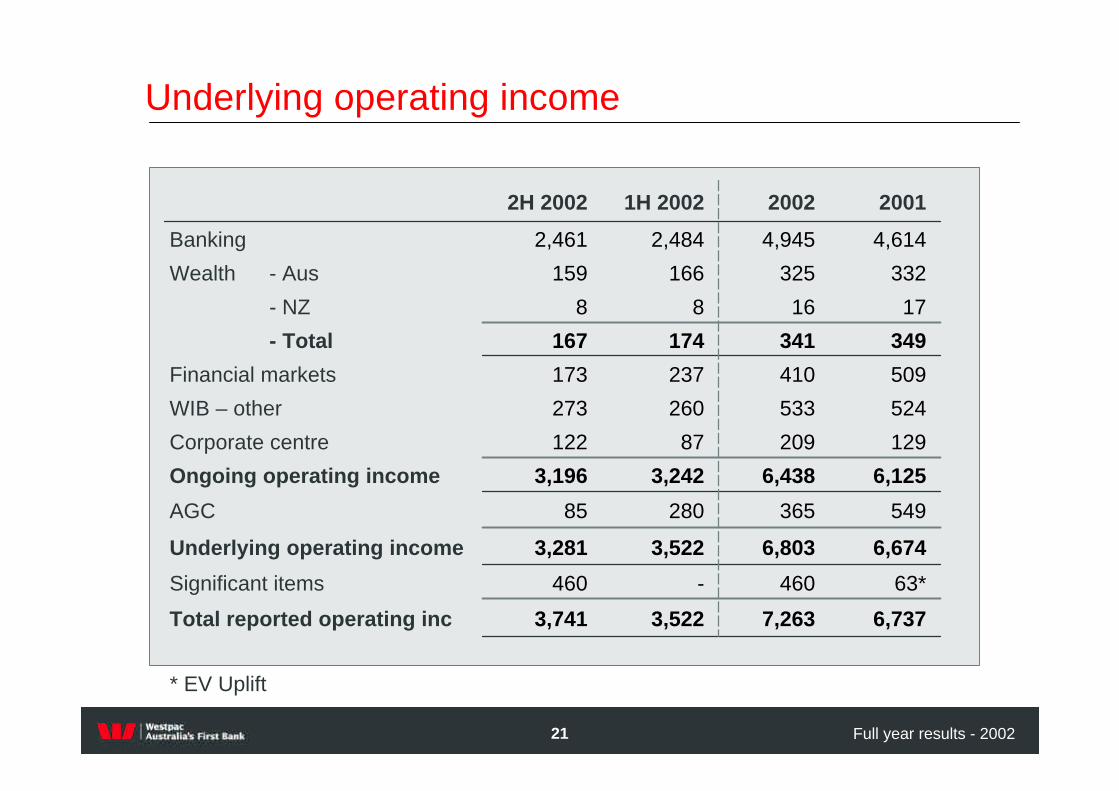
524533260273WIB – other
12920987122Corporate centre
171688- NZ
349341174167- Total
3,522
-
3,522
280
3,242
237
166
2,484
1H 2002
7,263
460
6,803
365
6,438
410
325
4,945
2002
6,7373,741Total reported operating inc
63*460Significant items
6,6743,281Underlying operating income
54985AGC
6,1253,196Ongoing operating income
509173Financial markets
332159Wealth - Aus
4,6142,461Banking
20012H 2002
Underlying operating income
* EV Uplift

22 Full year results - 2002
Wealth management business
Large282(11)1Other – one-off items (Australia)
61%3353Total life insurance
11%97108Total funds management
91%(12)(23)Other – business as usual (Australia)
89%917Life insurance and risk (New Zealand)
50%2436Life insurance and risk (Australia)
(13%)146127Total wealth management
17%118138Total before one-off items
14%92105Funds management (Australia)
(40%)53Funds management (New Zealand)
% Change20012002NPAT $ million
1 2002 write-down of Hartleys ($16m) and sale of properties Investa $5m2 2001 sale property trust $28m

23 Full year results - 2002
Expense growth better than target range
2%98100Goodwill
16%1,0801,255Other expenses
12%3,5703,995Total operating expenses
Large-443Significant items
(1%)3,4723,452Operating expenses (excl goodwill)
(8%)1,7441,608Salaries & other staff expenses
(9%)648589Equipment & occupancy
% Change20012002$ million

24 Full year results - 2002
Cost to income
• Higher ratio following sale of AGC
• AGC operations sold had low cost to income ratio
• New base equals 53.6%
%
30
35
40
45
50
55
60
1H99
2H99
1H00
2H00
1H01
2H01
1H02
2H02
2002
FY*
AGC Impact
Cost to income ratio excluding goodwill
2002 FY*– represents the full year ratio adjusted for BT, RAAM and Hastings acquisitions

25 Full year results - 2002
05
101520253035404550
1995 1996 1997 1998 1999 2000 2001 2002
bps
Bad debts
Total bad & doubtful debt charge to average loans and acceptances
Long run average 25-35 bp

26 Full year results - 2002
(5%)31.7%30.2%Normalised tax expense as a % of reported NPBT
(2%)867847Normalised Tax expense
41
-
-
47
(36)
226
Adjustments
Policy holder tax recoveriesOffshore provision not tax effected Profit on sale of AGC
26%826610Tax expense as reported
30.2%21.7%Tax expense as a % NPBT
% Change20012002$ million
Tax breakdown

27 Full year results - 2002
Summary of significant items
• Acquisition and divestment
- AGC sale - Integration expenses (RAAM/BT)
• More conservative treatments
- Embedded value and goodwill- Superannuation prepayment
• Outsourcing transition expense
• Improving risk management
- High yield investment securities

28 Full year results - 2002
AGC sale
2,594
1,737
106
751
(3)
754
4,900
284
1,038
Gross consideration
Carrying value of assetTransaction related provisions and transition costs
Net gain on sale before tax
Tax
Net gain on sale after tax
Risk assets freed up
Capital released (@5.8% TOE)
Total capital released
$m

29 Full year results - 2002
0.0
1.0
2.0
3.0
4.0
5.0
May-02 Jun-02 Sep-02 Sep-03 Sep-04
Actual re-acquisition of business bookInitial planned rate of re-acquisition
• Between Jan 02 and May 02 Westpac re-acquired $1.1bn of AGC business receivables
• Sold $4.1bn to AGC May 02
• $2.2bn re-acquired by end Sept 02
• No capital implications due to business finance indemnity
Forecast
Based on the current run-rate we expect over $4.0bn of the book will be re-acquired by Sept 03, ahead of our planned schedule
Re-acquisition of business portfolio
30 Full year results - 2002
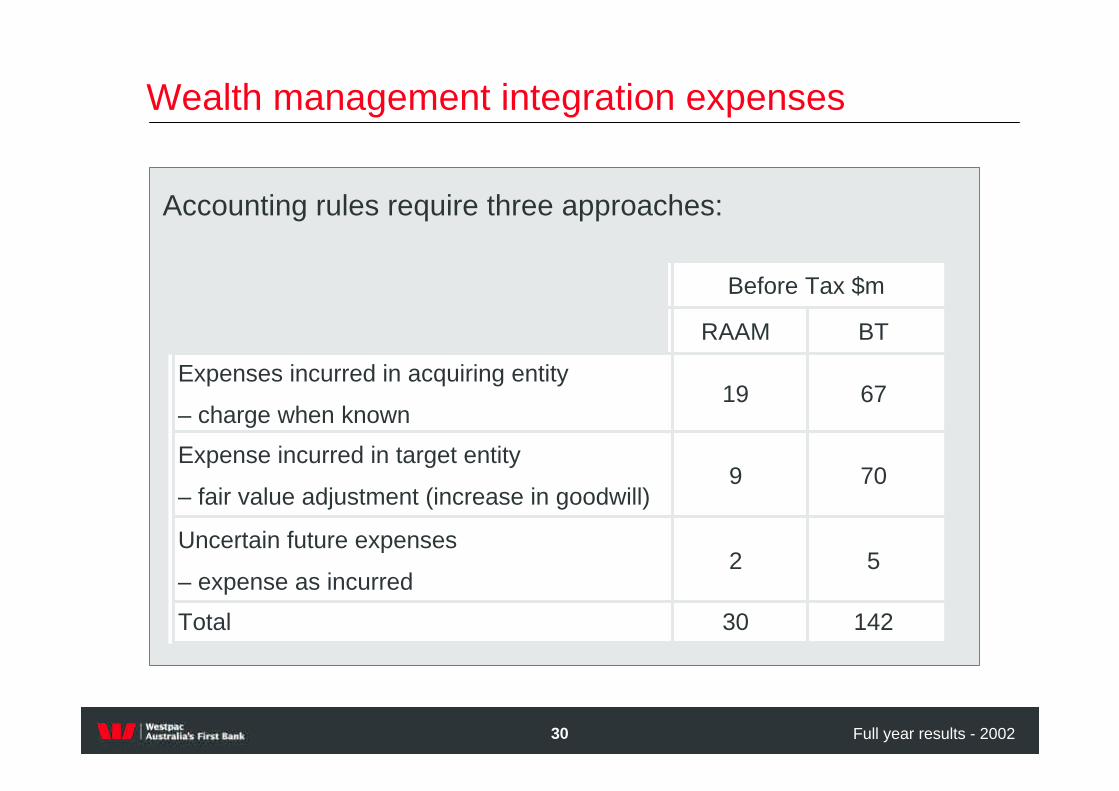
Wealth management integration expenses
Accounting rules require three approaches:
Before Tax $m
30
2
9
19
RAAM
142Total
5Uncertain future expenses
– expense as incurred
70Expense incurred in target entity
– fair value adjustment (increase in goodwill)
67Expenses incurred in acquiring entity
– charge when known
BT
31 Full year results - 2002
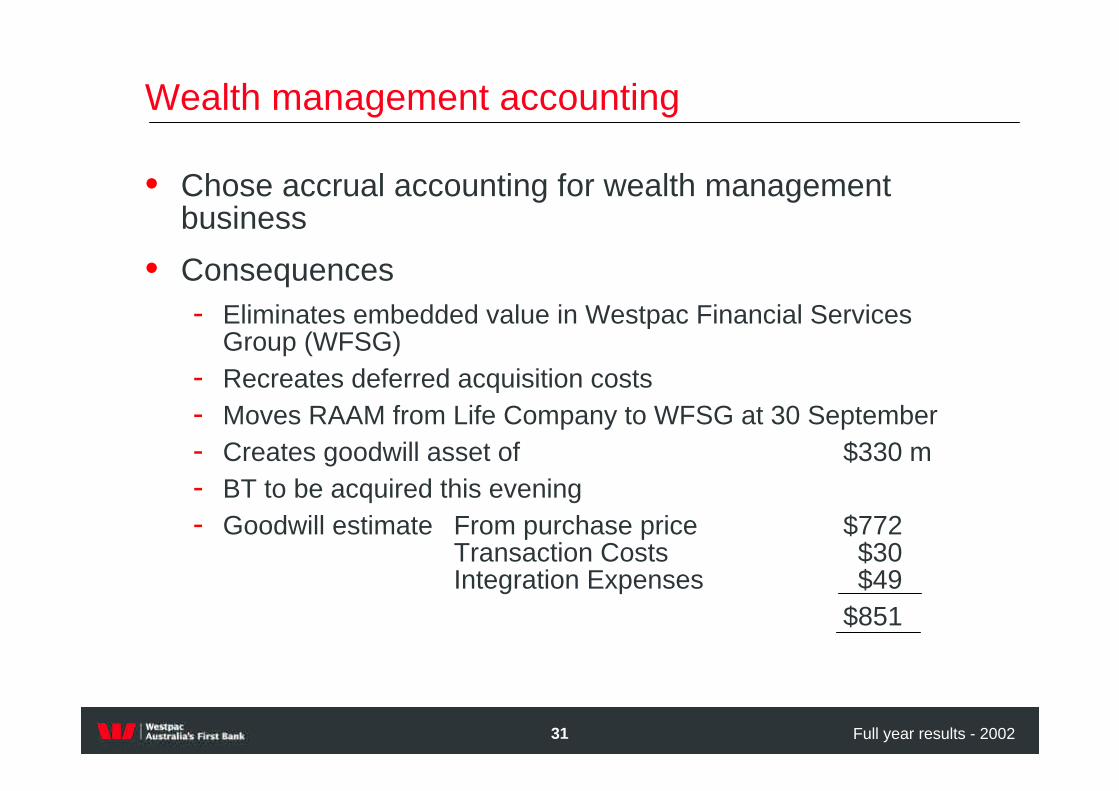
Wealth management accounting
• Chose accrual accounting for wealth management business
• Consequences- Eliminates embedded value in Westpac Financial Services
Group (WFSG)- Recreates deferred acquisition costs- Moves RAAM from Life Company to WFSG at 30 September- Creates goodwill asset of $330 m- BT to be acquired this evening- Goodwill estimate From purchase price $772
Transaction Costs $30Integration Expenses $49
$851

32 Full year results - 2002
Outsourcing transition expenses
• Reviewed all categories of deferred expenditure and decided to change the policy to write-down outsourcing transition expenses relating to: $m
- IBMGSA/Telstra 74- EDS 54- Other 8
136• Previously deferred expenses would otherwise have been charged
off as follows:
- 2003 37- 2004 37- 2005 24
• Decision improves clarity of contract costs in future operating expenses
33 Full year results - 2002
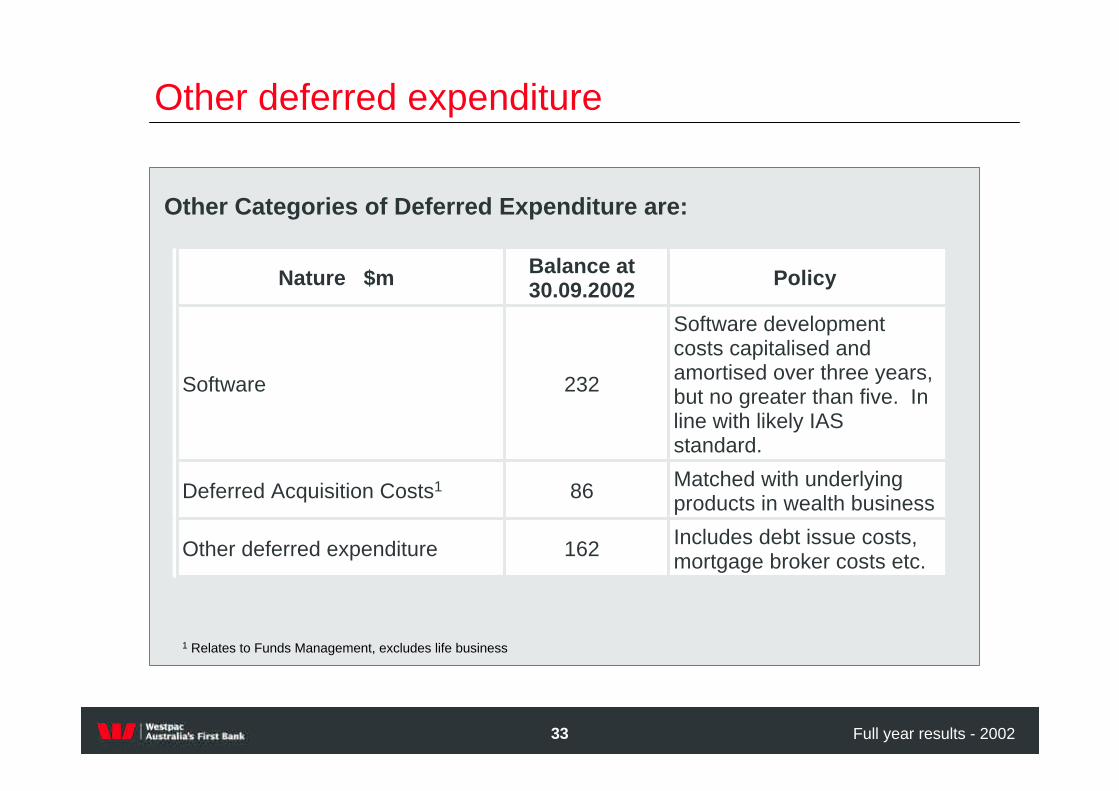
Other deferred expenditure
Other Categories of Deferred Expenditure are:
Matched with underlying products in wealth business86Deferred Acquisition Costs1
Includes debt issue costs, mortgage broker costs etc.162Other deferred expenditure
Software development costs capitalised and amortised over three years, but no greater than five. In line with likely IAS standard.
232Software
PolicyBalance at 30.09.2002Nature $m
1 Relates to Funds Management, excludes life business

34 Full year results - 2002
Superannuation prepayment
• Superannuation Fund surplus brought to account in 1991 and treated as a prepayment of superannuation expense
• Accounting policy adopted (in 1995) based on UK Standard (SSAP 24) which reduced volatility in this item
• Next year, SSAP 24 is replaced by FRS 17 which would recreate the year to year volatility experienced in 1992-94
• More sensible to adopt the International Accounting Standard (IAS 19) given Australia’s impending adoption of IAS in 2005
• Action is being taken one year earlier than required to control the impact

35 Full year results - 2002
Superannuation prepayment
Variations within 10 percent corridor amortised over life of membership
Variations amortisedover average life of membership
Changes in value recognised
Actuarially assessed using long-term bond rate (lower rate)
Actuarially assessed using discount rate equivalent to projected funds earnings
Value of liabilities
Market Value assessed each year
Actuarially assessed on a three year cycleValue of assets
IAS 19SSAP 24
36 Full year results - 2002
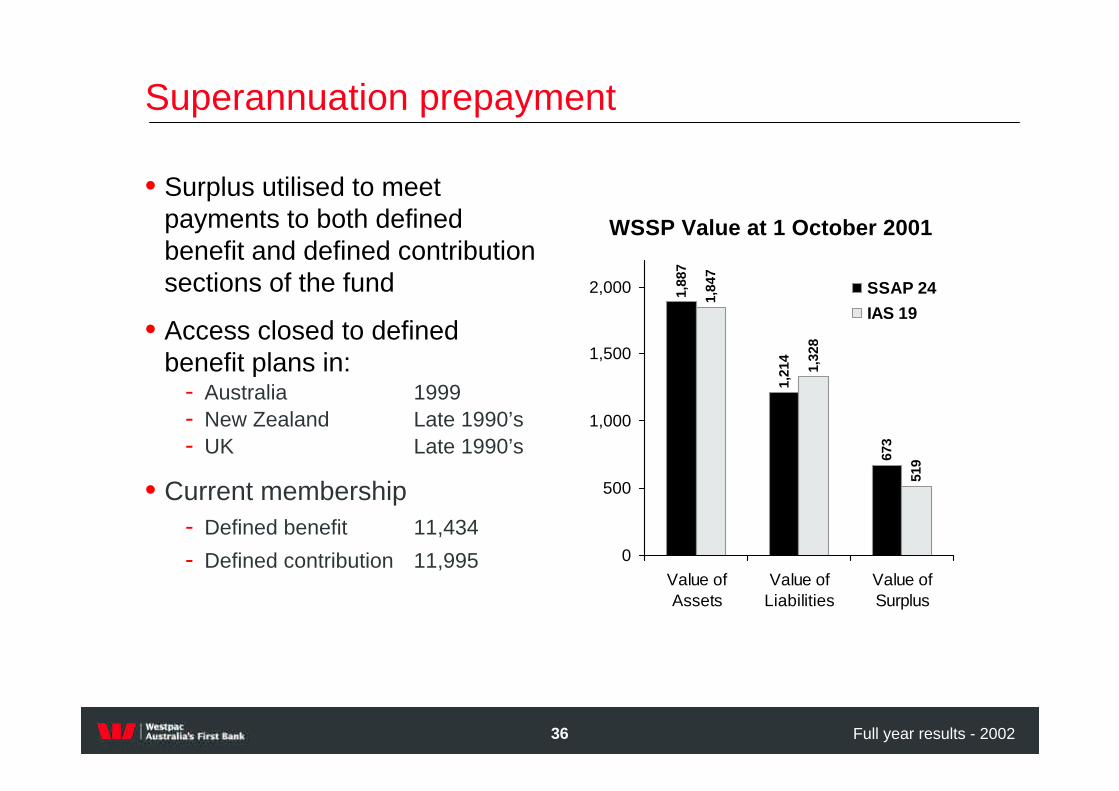
Superannuation prepayment
• Surplus utilised to meet payments to both defined benefit and defined contribution sections of the fund
• Access closed to defined benefit plans in:
- Australia 1999- New Zealand Late 1990’s- UK Late 1990’s
• Current membership- Defined benefit 11,434
- Defined contribution 11,995
1,88
7
1,21
4
673
1,84
7
1,32
8
519
0
500
1,000
1,500
2,000
Value ofAssets
Value ofLiabilities
Value ofSurplus
SSAP 24IAS 19
WSSP Value at 1 October 2001

37 Full year results - 2002
Superannuation prepayment
92
2003*
75
2002
20Super expense
2001$m
Superannuation expense is the amortisation of the surplus through time
* Estimate only

38 Full year results - 2002
Investment securities
History
• Portfolio acquired in 1997 to 1998
• Proposition was that a widely diversified portfolio of BBB and BB rated securities would perform in a predictable manner and generate reliable income to consume US and UK tax losses
• Rise in credit spreads and default rates in 1998 led to decision in 1999 to freeze portfolio at $US 800m and commence run down

39 Full year results - 2002
Investment securities
• Yield adjustments not previously realised given “hold to maturity” intention.
• Move to fair value reflects changed intention to actively manage exposure • $149 m charge is a yield adjustment (reflecting credit spreads) not an
expected credit loss• Remaining portfolio fair value US$146 m (Face Value US$255 m)
400
600
800
1000
1200
1400
Dec-
98M
ar-9
9Ju
n-99
Sep-
99De
c-99
Mar
-00
Jun-
00Se
p-00
Dec-
00M
ar-0
1Ju
n-01
Sep-
01De
c-01
Mar
-02
Jun-
02Se
p-02
Basis Points
0
5
10
Dec-
98M
ar-9
9Ju
n-99
Sep-
99De
c-99
Mar
-00
Jun-
00Se
p-00
Dec-
00M
ar-0
1Ju
n-01
Sep-
01De
c-01
Mar
-02
Jun-
02
%
S&P sub investment grade credit spread indexMoody’s sub investment grade default rates

40 Full year results - 2002
Investment securities
• We also hold an investment grade securities portfolio
$m
Face value 1,224
Dynamic provisioning
Market value 1,122
Shortfall (102)
• Continue to intend holding to maturity

41 Full year results - 2002
Credit environment
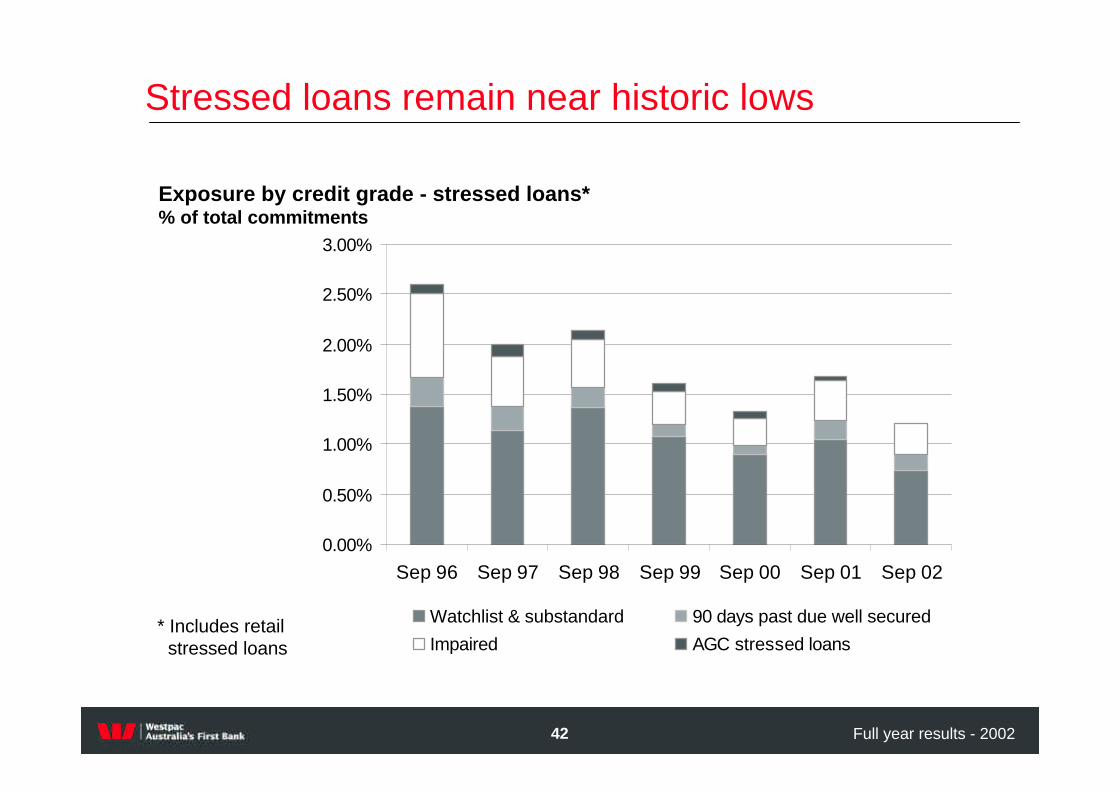
• Impaired assets down $223m on September 2001
- $95m from 2 large write-offs- $51m from sale of AGC
• Signs that the corporate downgrades and defaults are easing
• Business Banking credit quality remains strong
• Westpac maintains leading coverage ratios and asset quality
42 Full year results - 2002
Stressed loans remain near historic lows
Exposure by credit grade - stressed loans*% of total commitments
0.00%
0.50%
1.00%
1.50%
2.00%
2.50%
3.00%
Sep 96 Sep 97 Sep 98 Sep 99 Sep 00 Sep 01 Sep 02
Watchlist & substandard 90 days past due well secured
Impaired AGC stressed loans* Includes retail
stressed loans

43 Full year results - 2002
• Total portfolio exposure $33bn*
• Impaired assets ratio at historical low
• Delinquencies relatively stable
• No signs of any systemic credit problems
Business banking* portfolio quality
Impaired assets to total committed exposure%
1.91
1.28
0.63
1.471.53
0.0
0.5
1.0
1.5
2.0
2.5
1998 1999 2000 2001 2002
90 day delinquencies
2.07
0.270.37
1.80
1.01
0.51
0.71
0.0
0.5
1.0
1.5
2.0
2.5
1996 1997 1998 1999 2000 2001 2002
* Australian Business Banking portfolio
%
%

44 Full year results - 2002
Institutional banking portfolio quality
Impaired assets to total WIB committed exposure%
0.14
0.530.63
0.290.37
0.25
0.34
0.00.10.20.30.40.50.60.7
1996 1997 1998 1999 2000 2001 2002
• Increase in impaired assets in since 2000 due to small number of high profile cases
• Decline in impaired assets in 2002 related to write-down in two major impaired assets
Probability of default
0.13
0.250.29
0.15
0.29
0.19
0.21
0.00.10.10.20.20.30.30.4
1996 1997 1998 1999 2000 2001 2002
%

45 Full year results - 2002
90 day delinquencies
Consumer unsecured portfolio
• Strong growth in portfolio led to increase in bad debts
• Planned pick-up in delinquencies
1.07
1.98
0.96 1.140.9
0.630.82
0.0
0.5
1.0
1.5
2.0
2.5
1996 1997 1998 1999 2000 2001 2002
Including AGC Excluding AGC
Bad debt charge%
173
247 264
85120
182
0
50
100
150
200
250
300
2000 2001 2002Including AGC Excluding AGC
%

46 Full year results - 2002
Composition of housing portfolio
90 day delinquencies
Mortgage portfolio quality
0
10,000
20,000
30,000
40,000
50,000
60,000
70,000
80,000
2001 2002Owner occupied Investment housing Equity access loans
• Quality of the portfolio continues to improve
• Investment property performance tracks owner occupied portfolio
• Under stressed conditions, maximum loss on portfolio less than $70m
1.04
0.640.38
0.150.230.250.26
0.0
0.5
1.0
1.5
1996 1997 1998 1999 2000 2001 2002
%

47 Full year results - 2002
Specific Provisions / Impaired Assets (%)
%
20
25
30
35
40
45
50
55
60
FY98 FY99 FY00 FY01 1H02 FY02
WBC ANZ CBA NAB
General provisions / non-housing performing loans (%)
Provisioning cover
1.0
1.2
1.4
1.6
1.8
2.0
2.2
2.4
FY98 FY99 FY00 FY01 1H02 FY02
WBC ANZ CBA NAB

48 Full year results - 2002
1,434Closing balance
37Net new provisions
1,397Sub total
(95)Write-off of two major impaired assets
(165)Sold with AGC
1,657Opening balance
Reconciliation of provisioning
Reconciliation of provisioning
Provisioning Balance Movements From 31.3.02

49 Full year results - 2002
Total exposure by booking office1
1. As at 30 September 2002
2. Includes mortgages for housing, investment property loans, equity access loans and margin lending.
3. Credit cards and personal loans.
Remaining offshore sub investment grade exposures represents 0.5% of TCE.
7,41900009376,482Unsecured consumer3
217,3902362065,5705,97434,025171,380
80,187000012,35267,835Secured consumer2
2,2561361912505181,324<B+
37,26060292732776,08030,542BB+ to B+
27,2930262,0681,0434,77219,385BBB+ to BBB-
20,643352,3342,6192,70412,978A+ to A-
42,331160858031,7866,66332,833AAA to AA-
GroupJapanAsia ex JapanEuropeAmericasNZ /
PacificAustralia

50 Full year results - 2002
5.8
6.4 6.5
5.3
5.86.0
4.8
5.7 5.7*
6.16.3
4.9
6.86.7
3.5
4.5
5.5
6.5
7.5
TOE / RAA Tier 1 ratio ACE Ratio
1H01 2H01 1H02 2H02 Ex BT
%
Capital levels comfortable
* Prior to change in APRA deductions

51 Full year results - 2002
Capital impact BT and Hastings acquisitions
6.48
6.040.22
(0.68)
5.0
5.5
6.0
6.5
7.0
7.5
5.77
6.42
(0.68)
0.04
5.0
5.5
6.0
6.5
7.0
7.5
Sep-02 BT & Hastings Other Oct-02
Tier 1
Tangible Ordinary Equity
%
%

52 Full year results - 2002
Surplus capital generation
4.8%
5.8%
2.8%
12.3%
20.1%
% of avg ordinary equity
Delivers 3-4 bp increase in Tier 1 ratio per month489Growth in surplus capital
To fund 8% growth in RWA (597)Reinvested for growth
DRP participation 23%
Payout ratio 61.3%
Strong cash returns
Comments
289
(1,266)
2,063
10,269
$ million
Clawback through DRP
Dividends paid
Cash earnings
Average ordinary equity
David Clarke Group Executive Wealth Management
31 October 2002

54 Full year results - 2002
Integration approach
• Continuity of key people from pre-deal phase
• Design teams staffed by full-time representatives from all businesses – Westpac, Sagitta and BT
• Focus on rapid, implementable decisions
• Design phase completed in only 10 weeks, before completion

55 Full year results - 2002
Integration position today
• Target operating model confirmed
• Target organisational structure confirmed
• One brand, one location confirmed
• Integration synergies and costs confirmed
• Program structure/leadership confirmed

56 Full year results - 2002
Integration outcomes
1st November
Q3 ‘02 Q4 ‘02 Q1 ‘03 Q2 ‘03
Management team confirmed
Investment team confirmed
Putnam selected
BT Wrap rollout
Corporate Super rollout
Call centre consolidation
Brand approved
1st Co-Locations
Single customer view

57 Full year results - 2002
Net retail FUM against model
5,000
6,000
7,000
8,000
9,000
10,000
11,000
12,000
13,000
Sep 02 Oct 02 Dec 02 Dec 03 Dec 04 Dec 05
($'000's)
Acquisition ModelActual

58 Full year results - 2002
Funds under management
Other includes FX, currency, and asset allocation
8.64.41.62.6International equities
3.31.00.12.2Other
11.23.13.05.1Australian equities
2.61.00.61.0International fixed interest
4.00.81.61.6Property
22.8
3.8
6.5
WBC $bn
7.91.92.2Australian fixed interest
47.114.79.6Total FUM
9.52.50.5Cash and liquid assets
Total $bn
BT $bn
Rothschild $bnAsset class

59 Full year results - 2002
Brand
• BT will be name for combined business
• Rolled out in Q2 next year
• Follows research findings from Westpac marketing, BT and external parties
• Investment component of BT brand has weakened –but is strong around wrap and adviser service

60 Full year results - 2002
What are the agencies saying?
MorningstarAssirt (pre BT)vanEykAsset class
Sagitta and Putnam
5Hold (3 Star)AAFixed Income (wholesale)
1
3
4
Hold (4 star)
Hold (4 star)
Hold (2 star)
A
A
B
Australian Shares
• Australian
• Imputation
• Small Caps
3 starsHold (4 star)AInternational Shares (core)

61 Full year results - 2002
Update of BT Synergies
Implementation Costs ($m)
43 45 4259 55
21
813
6 611 10
0
20
40
60
80
100
120Increased Revenue ContributionCost Savings
5170
FY 2003 FY 2004 FY 2005
Valu
ation
A
ssum
ptio
ns
46 48
Pro
gram
T
arget
Valu
ation
A
ssum
ptio
ns
Pro
gram
T
arget
Valu
ation
A
ssum
ptio
ns
Pro
gram
T
arget
65
102
Synergies Identified ($m)
• Having completed the nine week design phase, consolidated synergies are now estimated at $102m pa in FY05 with implementation costs of ~$142m
142Total
5Future Expense
70Fair Value Adj BT
67Charged in Westpac

62 Full year results - 2002
Business model
Westpac financial planners
&
advisers
External advisers
&distributors
Business advisers
Westpac customers
Customers of external financial advisors
Business customers
Westp
acm
aster trust
Dealer m
aster tru
sts
Wrap
platfo
rmCorporate
super
Su
per
Pen
sion
Investm
ent
Risk
Clien
t services and
adm
inistratio
n
Research
team
Putnam
BlackRock
AEW
Back O
ffice
Margin lending
Principal
Grosvenor
Customers Distribution & Advice
BundlingPlatform
ProductManufacture
InvestmentManagement Back Office
Core

David Morgan Chief Executive Officer
31 October 2002

64 Full year results - 2002
Positioned for growth
• Sustainable momentum in core businesses
• Strategic repositioning completed
- Filled capability gaps - Diversified earnings streams
• Improved risk and reduced volatility in earnings base
- Removed embedded value- Recognised significant items - Improved asset quality

65 Full year results - 2002
Priorities for 2003
• Maintain momentum in ongoing businesses:
- Complete initiatives arising from NZ program review- Implement program reviews of Australian Banking and
Institutional Banking- Complete end-to-end re-engineering of lending process
• Deliver value from new acquisitions
- Complete wealth management integration- Capture value across 7.5m customer base using wrap
and corporate super

66 Full year results - 2002
Economic environment
• GDP growth in 3.0 to 3.5% range
• Housing to slow; business investment & exports up
• Unemployment remaining around 6% to 6.5%
• Underlying inflation back in 2% - 3% range
• Rise in official rates not expected near term

67 Full year results - 2002
Business expectations
• Credit growth in the 8% to 10% range
• Maintain market share momentum across core products
• Expense to income trending lower against re-based costs
• No material change in asset quality
• Net retail funds inflow to stabilise vs market
• Return to more ‘normal’ financial markets performance

68 Full year results - 2002
• Core businesses continuing to deliver
• Transformed the business underpinning medium term growth trajectory
• Lower risk and higher quality earnings
2003
7% – 9%Cash EPS expectations
(2%)Dilution of recent transactions
9%-11%Core business EPS growth
Summary and earnings expectations

David Morgan Chief Executive OfficerDavid Clarke Group Executive Wealth ManagementPhilip Chronican Chief Financial Officer
31 October 2002
31 October 2002
71 Full year results - 2002
400
800
1200
1600
1H98 2H98 1H99 2H99 1H00 2H00 1H01 2H01 1H02 2H02
000’sN
um
ber
of
Cu
sto
mer
s
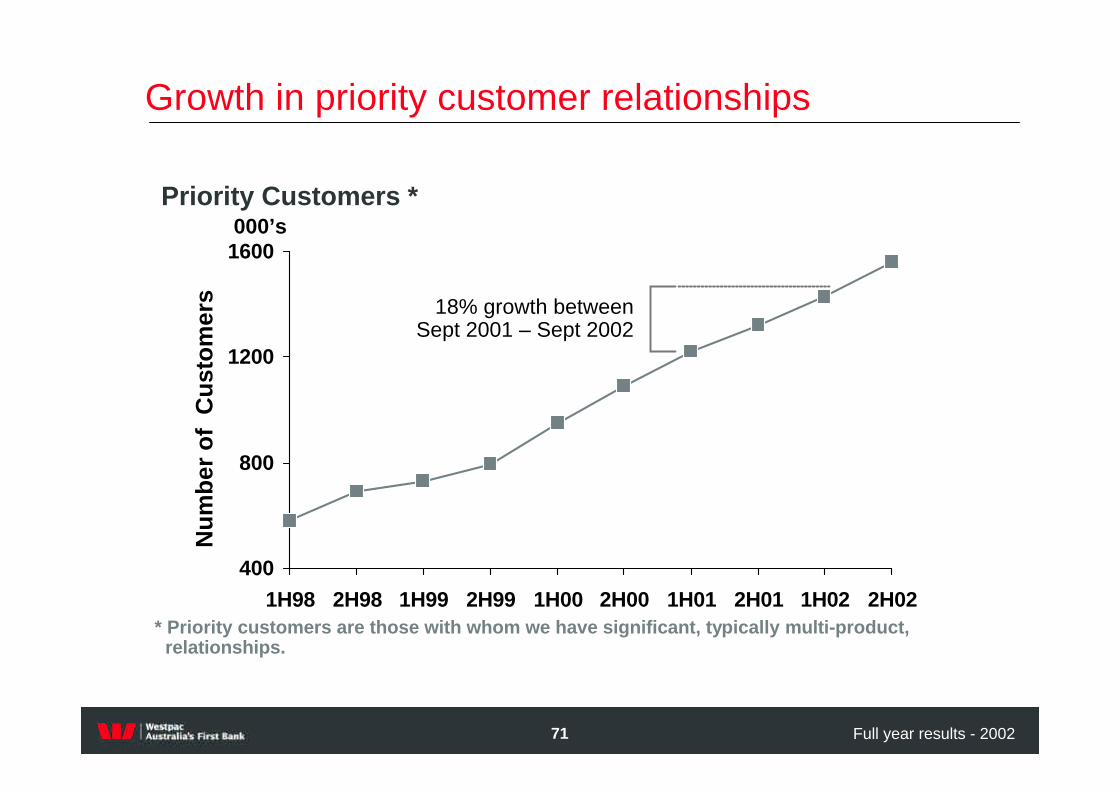
* Priority customers are those with whom we have significant, typically multi-product, relationships.
18% growth betweenSept 2001 – Sept 2002
Priority Customers *
Growth in priority customer relationships
72 Full year results - 2002
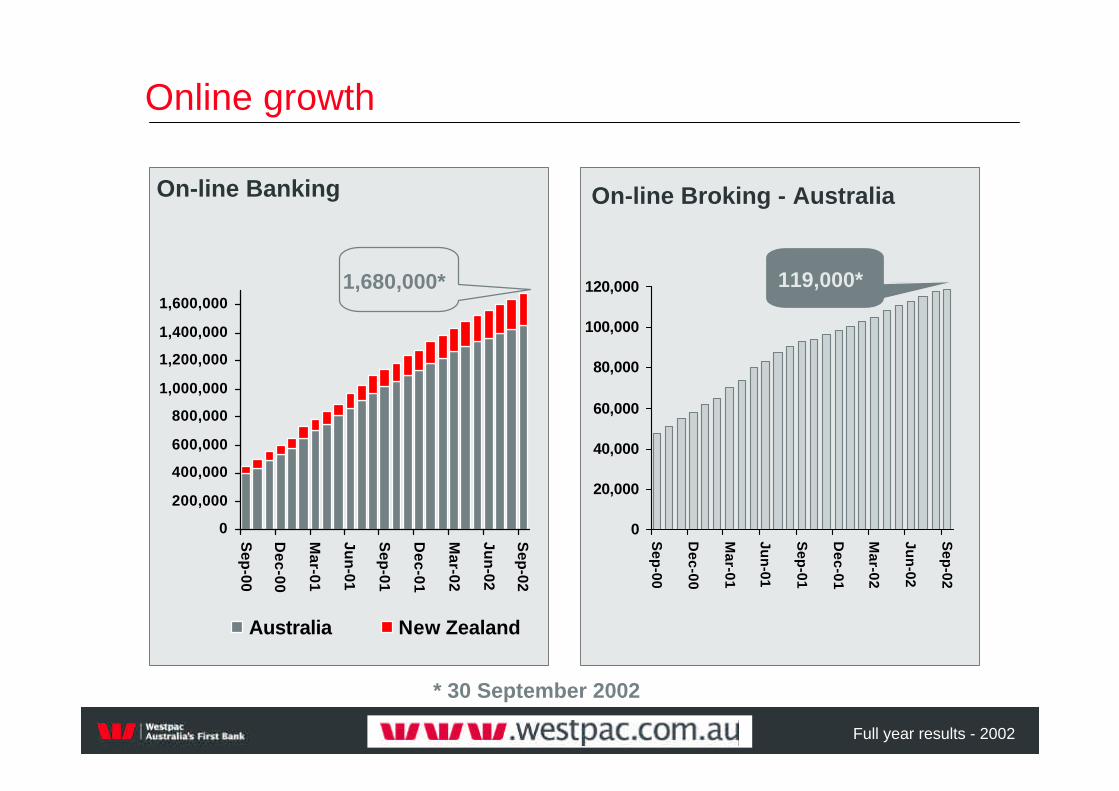
0
200,000
400,000
600,000
800,000
1,000,000
1,200,000
1,400,000
1,600,000
Sep
-00
Dec-00
Mar-01
Jun
-01
Sep
-01
Dec-01
Mar-02
Jun
-02
Sep
-02
Australia New Zealand
On-line Banking
0
20,000
40,000
60,000
80,000
100,000
120,000
Sep
-00
Dec-00
Mar-01
Jun
-01
Sep
-01
Dec-01
Mar-02
Jun
-02
Sep
-02
On-line Broking - Australia
1,680,000* 119,000*
* 30 September 2002
Online growth

73 Full year results - 2002
12
13
13
1
15
8
0 5 10 15 20
Deposits (excl CDs)
Australian Business lending
Australian Personal Lending
Credit cards
Housing - owner occ
Aver Earning Assets
Market share gained/stable/lost
Growth in core products
Growth
1
1 Excluding AGC in 2001 numbers

74 Full year results - 2002
Other consumer portfolio
* On balance sheet funded lending September 2002
Total Westpac Group *
Personal Loans
CardsMargin Lending
3.4%
1.8%
0.4%Other consumer6%
Mortgages55%
Business / Institutional
39%

75 Full year results - 2002
* % of Total Exposure - 30 September 2002
19% 18% 19% 20%
14% 12% 9%
14%13%
13% 13%
17%18% 19% 17%
9%
1.2%1.5% 1.3% 1%
0%
20%
40%
60%
80%
1H 01 FY 01 1H 02 FY 02
<B+BB+ to B+BBB+ to BBB-A+ to A-AAA to AA-
Business / Corporate risk grade profile*
76 Full year results - 2002
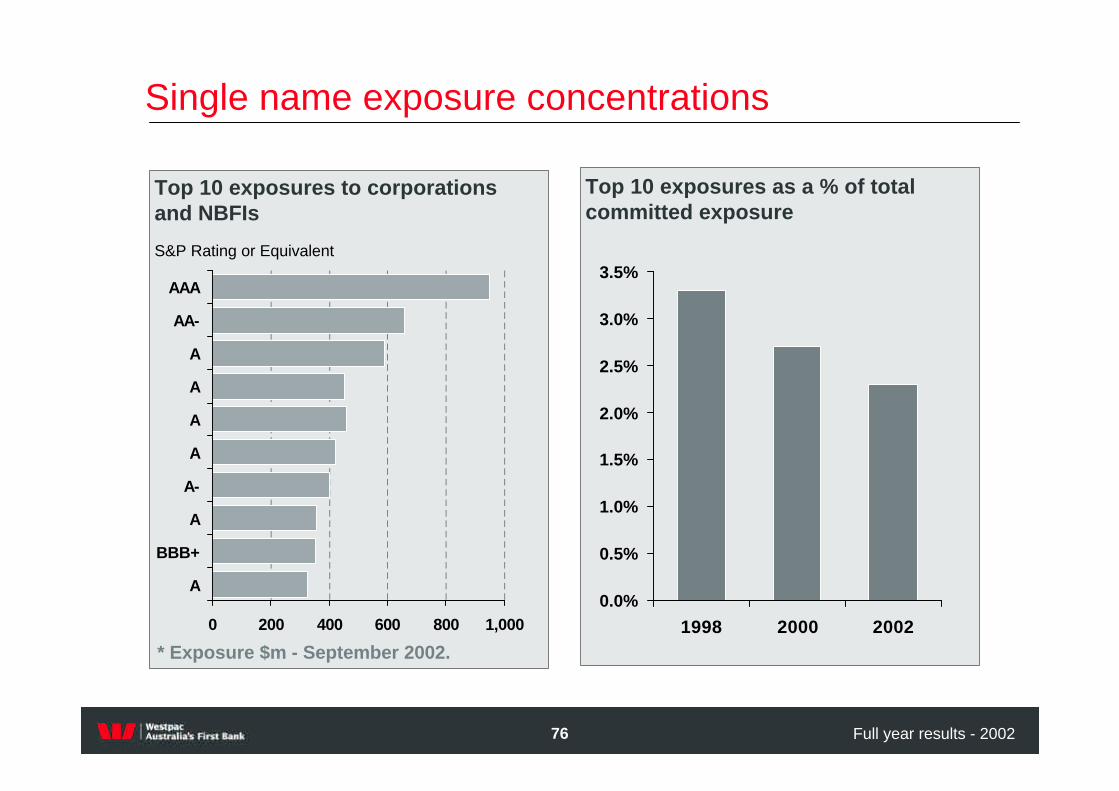
* Exposure $m - September 2002.
0 200 400 600 800 1,000
A
BBB+
A
A-
A
A
A
A
AA-
AAA
Top 10 exposures to corporations and NBFIs
S&P Rating or Equivalent
Single name exposure concentrations
0.0%
0.5%
1.0%
1.5%
2.0%
2.5%
3.0%
3.5%
1998 2000 2002
Top 10 exposures as a % of total committed exposure

77 Full year results - 2002
8%2,063Final cash earnings
(16)Lower financial markets and wealth management income
9%2,079Adjusted cash estimates
12Earnings on surplus capital
2Incremental Sagitta earnings
(53)Net AGC earnings change
11%2,118Initial cash earnings estimates
EPS Growth
2002$mD
ecM
arJu
nS
ep
Expectations at market update1 August 2002
Indicative
EPS growth reconciliation

78 Full year results - 2002
157
1,359
0
200
400
600
800
1,000
1,200
1,400
1,600
AAA to BBB+
BBB to BBB-
BB+ to BB-
>BB-
$m
Telco exposure
65%
20%
9%
6%
Australia (100% Investment grade)
Asia (100% Investment grade)
Europe (54% Investment Grade)
Nth America (0% Investment grade) 1,516

79 Full year results - 2002
Global energy portfolio
340
1,060
1,980
800
500
1,000
1,500
2,000
2,500
3,000
3,500
4,000
AAA to BBB+
BBB to BBB-
BB+ to BB
BB-
>BB-
$m
73%
4%
23%
Australia (91% Investment grade)
Asia (53% Investment grade)
Nth America (83% Investment grade) 3,460

80 Full year results - 2002
Total provisions to total impaired assets
%
62
88
137
183 188
233249
177
211
0
50
100
150
200
250
300
1994 1995 1996 1997 1998 1999 2000 2001 2002
%
General provision to non-housing performing loans & acceptances
2.522.41
2.212.01
1.81 1.76 1.70
0
1
2
3
1996 1997 1998 1999 2000 2001 2002
Provisioning coverage

81 Full year results - 2002
Disclaimer
The material contained in the following presentation is intended to be general background information on Westpac Banking Corporation and its activities as at 31 October 2002.
The information is supplied in summary form and is therefore not necessarily complete. Also, it is not intended that it be relied upon as advice to investors or potential investors, who should consider seeking independent professional advice depending upon their specific investment objectives, financial situation or particular needs.