Embed Size (px)
Citation preview
PM10 Measurements – the future

PM10 Measurements – the future?
3 Presented by David Green
Contents
• Present situation
–National PM monitoring
–London and South East PM monitoring
• Monitoring methods
–Intercomparisons
–Equivalence trials
• London FDMS monitoring
• FDMS Model Development
• Future?
–Report PM10 reference equivalent concentrations
4 Presented by David Green
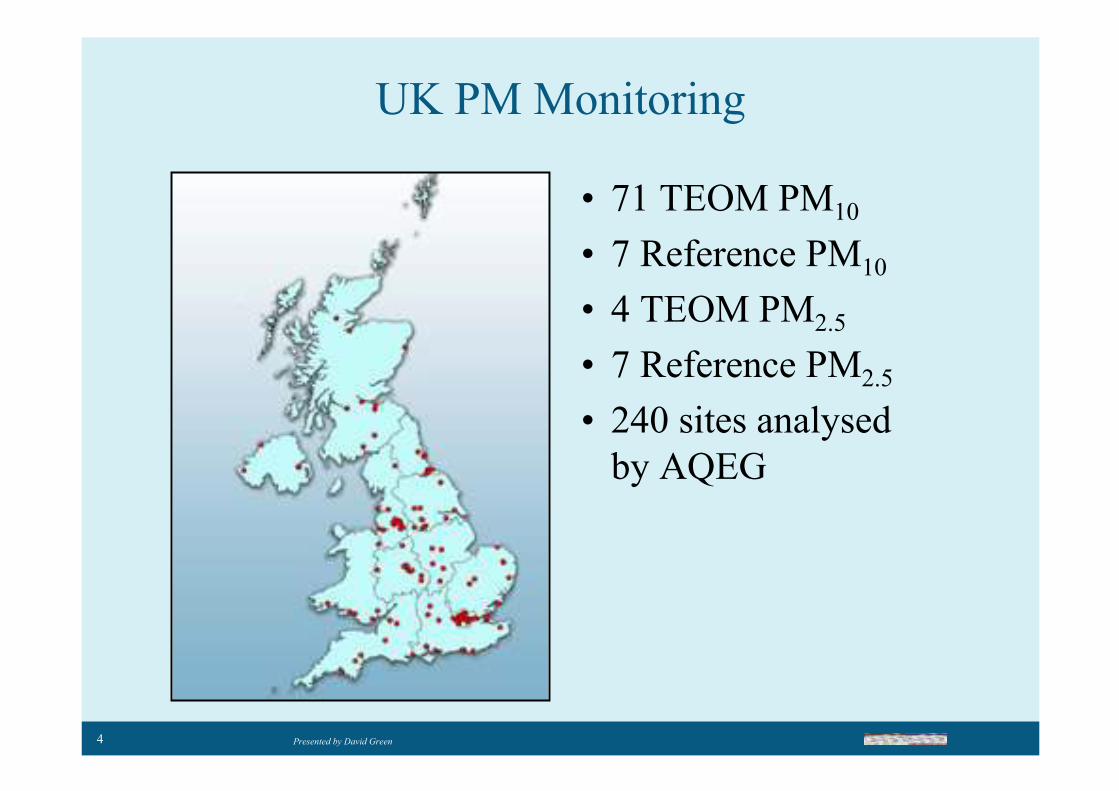
UK PM Monitoring
• 71 TEOM PM10
• 7 Reference PM10
• 4 TEOM PM2.5
• 7 Reference PM2.5
• 240 sites analysed
by AQEG
5 Presented by David Green
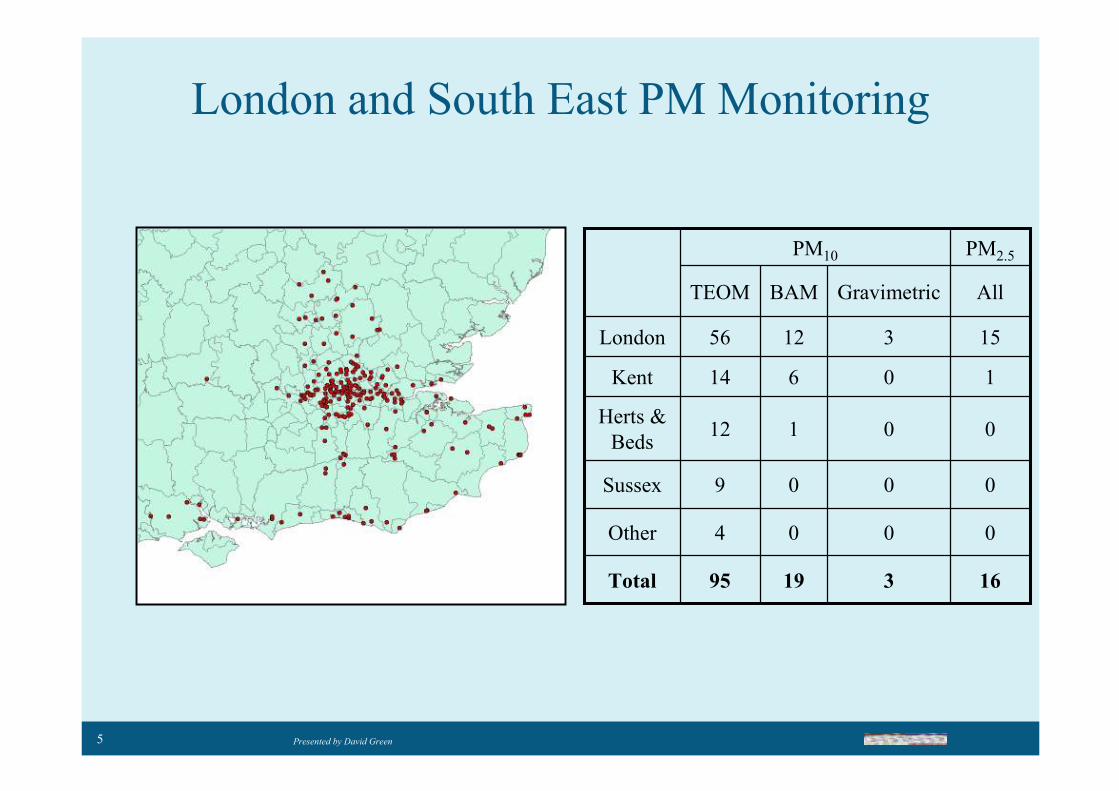
London and South East PM Monitoring
0004Other
1631995Total
0009Sussex
00112Herts &
Beds
10614Kent
1531256London
AllGravimetricBAMTEOM
PM2.5PM10
6 Presented by David Green
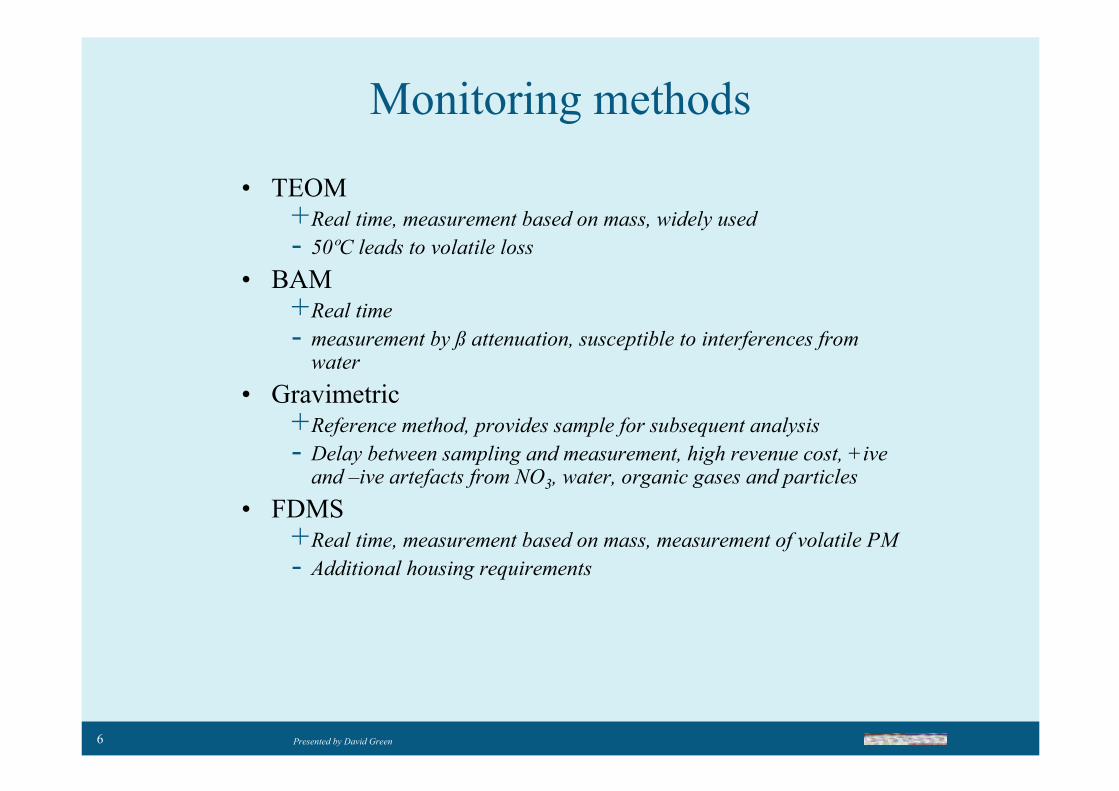
Monitoring methods
• TEOM+Real time, measurement based on mass, widely used
- 50ºC leads to volatile loss
• BAM+Real time
- measurement by ß attenuation, susceptible to interferences from water
• Gravimetric+Reference method, provides sample for subsequent analysis
- Delay between sampling and measurement, high revenue cost, +iveand –ive artefacts from NO3, water, organic gases and particles
• FDMS+Real time, measurement based on mass, measurement of volatile PM
- Additional housing requirements
7 Presented by David Green
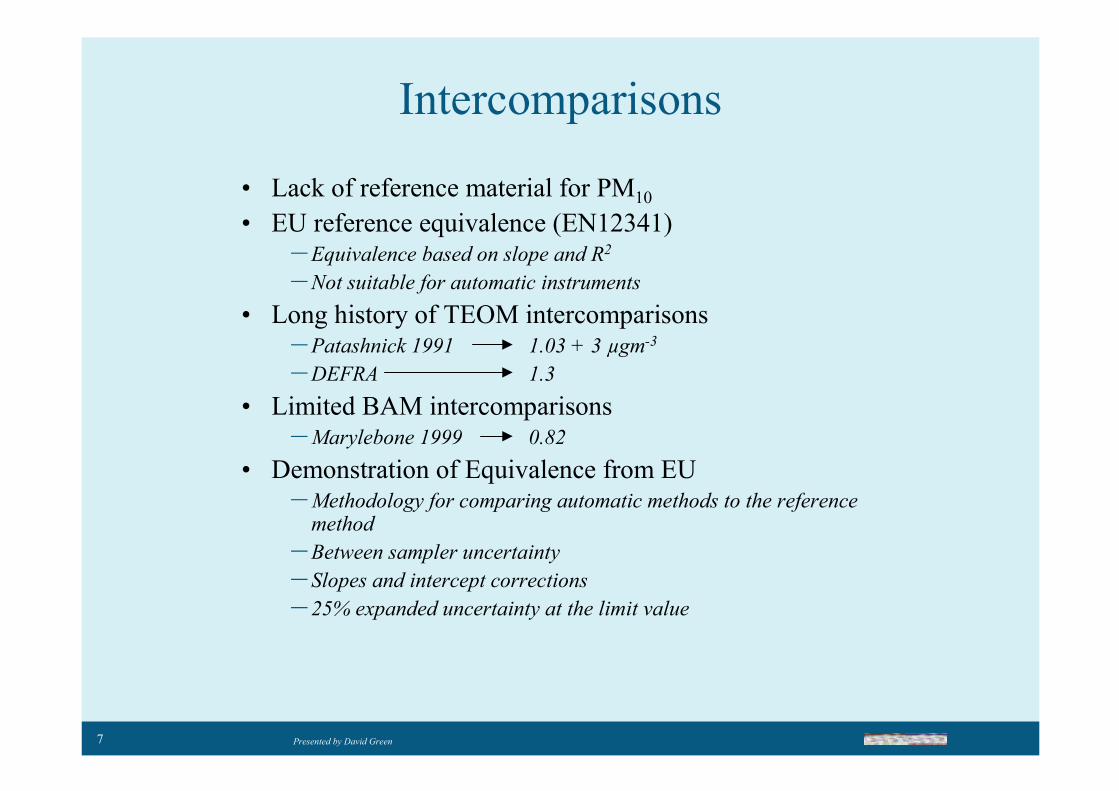
• Lack of reference material for PM10
• EU reference equivalence (EN12341)– Equivalence based on slope and R2
–Not suitable for automatic instruments
• Long history of TEOM intercomparisons– Patashnick 1991 1.03 + 3 µgm-3
–DEFRA 1.3
• Limited BAM intercomparisons–Marylebone 1999 0.82
• Demonstration of Equivalence from EU–Methodology for comparing automatic methods to the reference method
– Between sampler uncertainty
– Slopes and intercept corrections
– 25% expanded uncertainty at the limit value
Intercomparisons
8 Presented by David Green
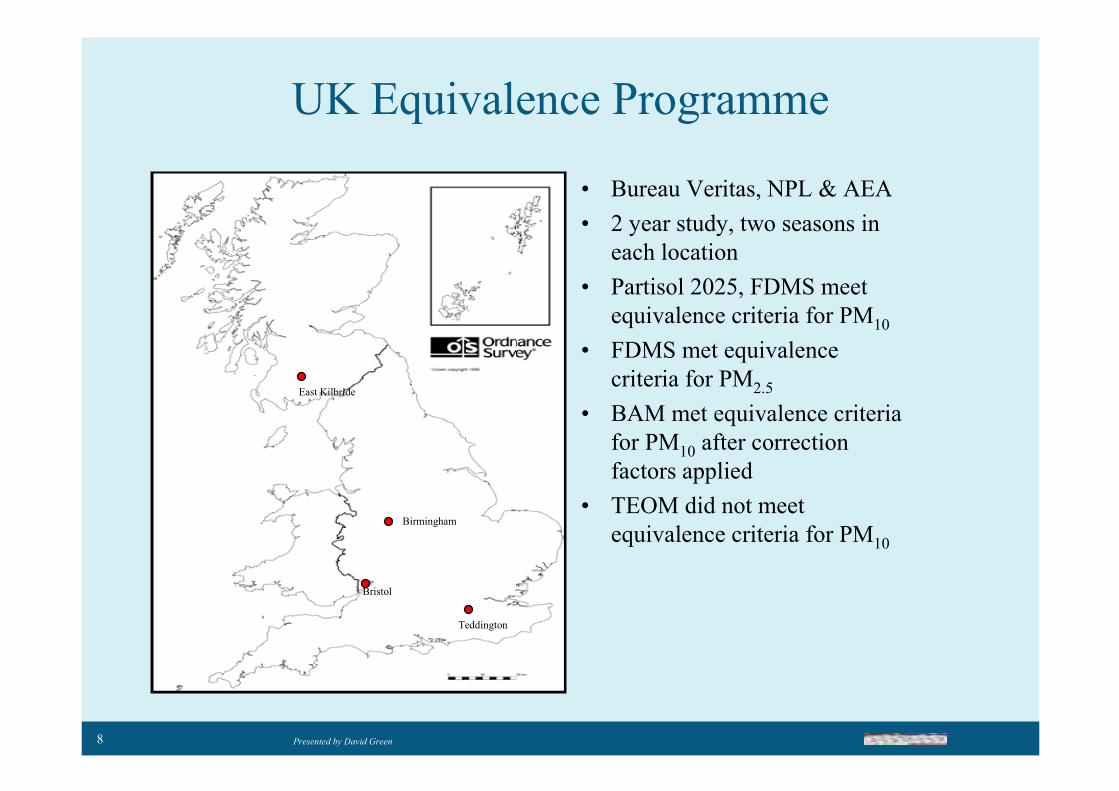
UK Equivalence Programme
• Bureau Veritas, NPL & AEA
• 2 year study, two seasons in
each location
• Partisol 2025, FDMS meet
equivalence criteria for PM10
• FDMS met equivalence
criteria for PM2.5
• BAM met equivalence criteria
for PM10 after correction
factors applied
• TEOM did not meet
equivalence criteria for PM10
East Kilbride
Birmingham
Bristol
Teddington
9 Presented by David Green
Current Situation
• Defra's advice to Local Authorities using TEOMs–Generally not necessary to replace your TEOM immediately. But when the time does come to replace it, the replacement instrument should be something that meets the equivalence criteria.
–TEOM data multiplied by 1.3 can still be used as an indicative measurement of gravimetric PM10 in the interim period
–30-40 daily measurements > 50 µg m-3 LAs should consider upgrading
• Defra's advice to Local Authorities using BAMs–Divide by 1.21 (where measured at STP)
10 Presented by David Green
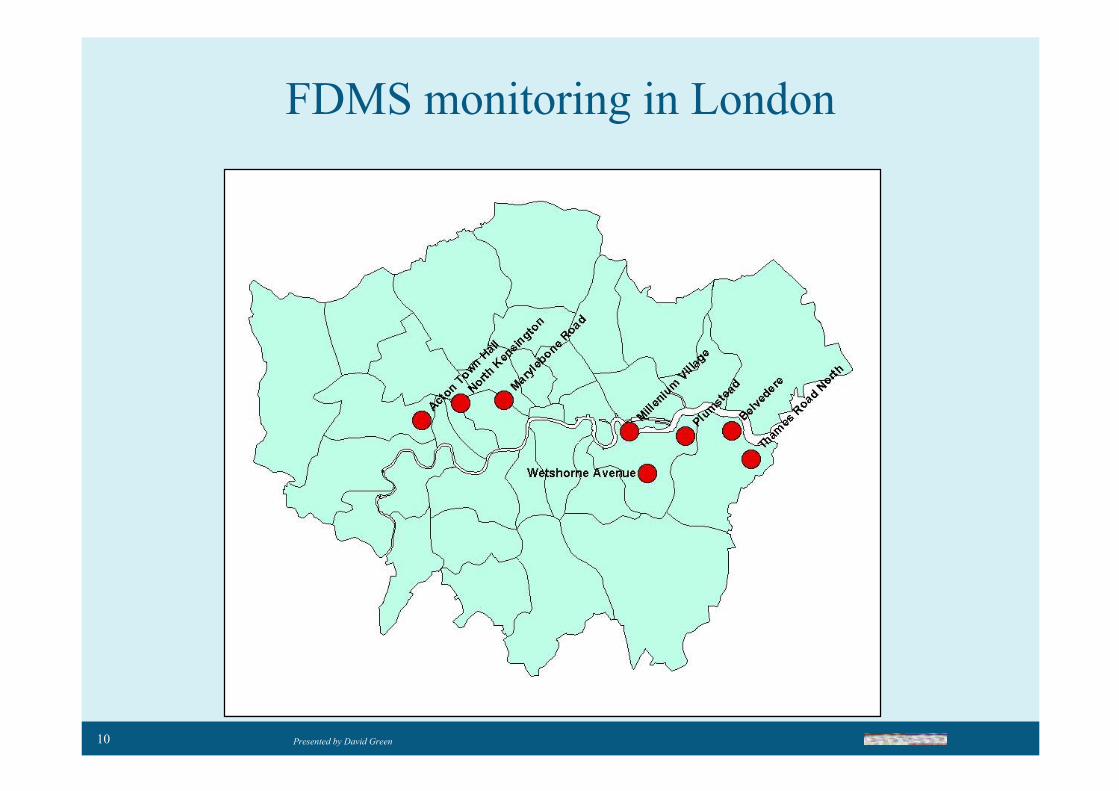
FDMS monitoring in London
11 Presented by David Green
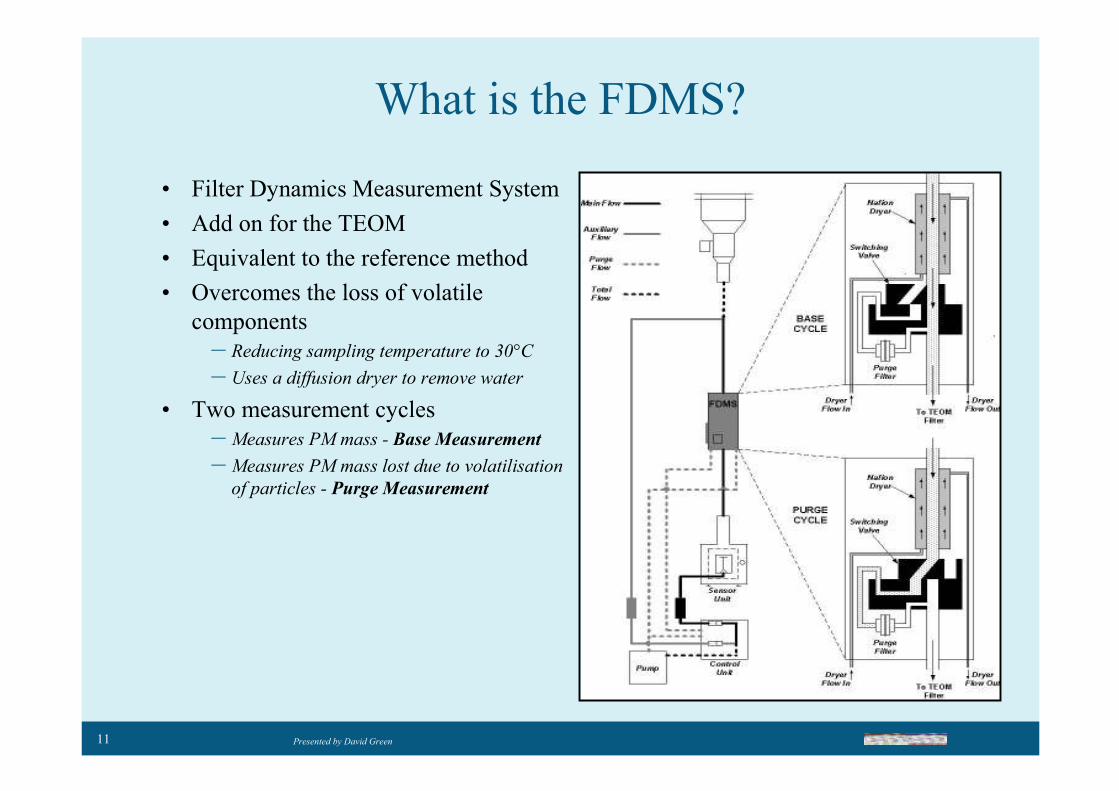
What is the FDMS?
• Filter Dynamics Measurement System
• Add on for the TEOM
• Equivalent to the reference method
• Overcomes the loss of volatile
components
– Reducing sampling temperature to 30°C
– Uses a diffusion dryer to remove water
• Two measurement cycles
– Measures PM mass - Base Measurement
– Measures PM mass lost due to volatilisation
of particles - Purge Measurement
12 Presented by David Green
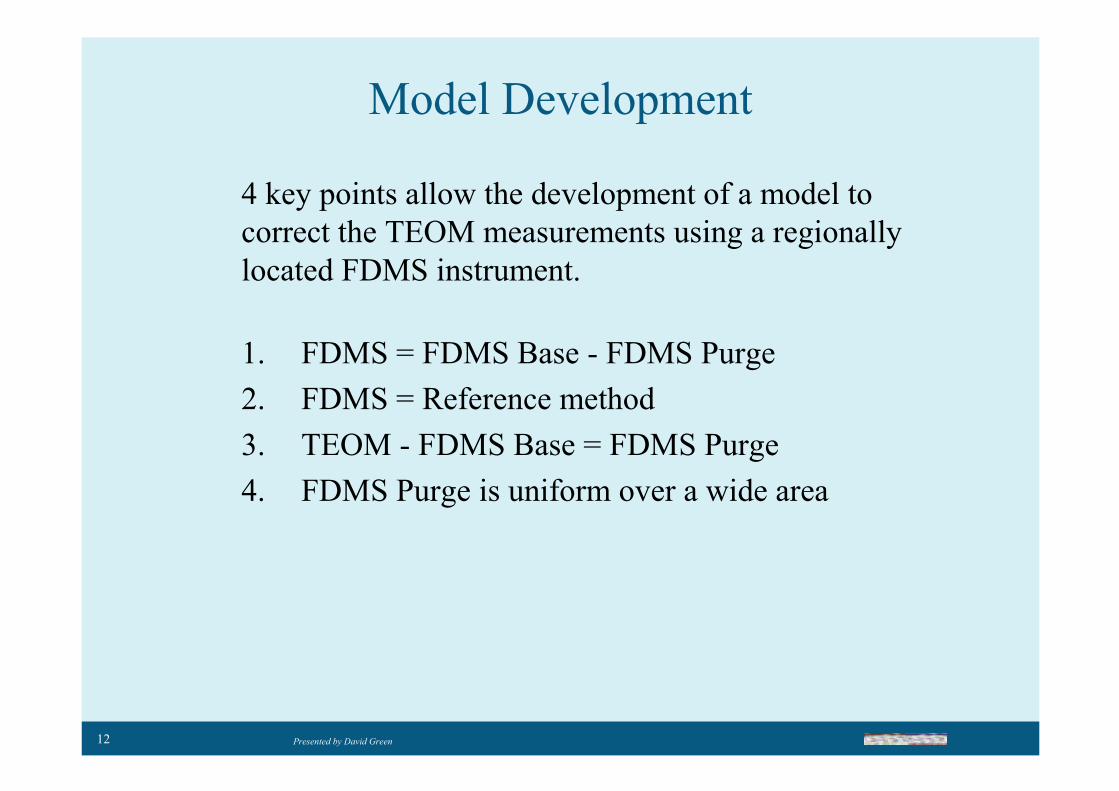
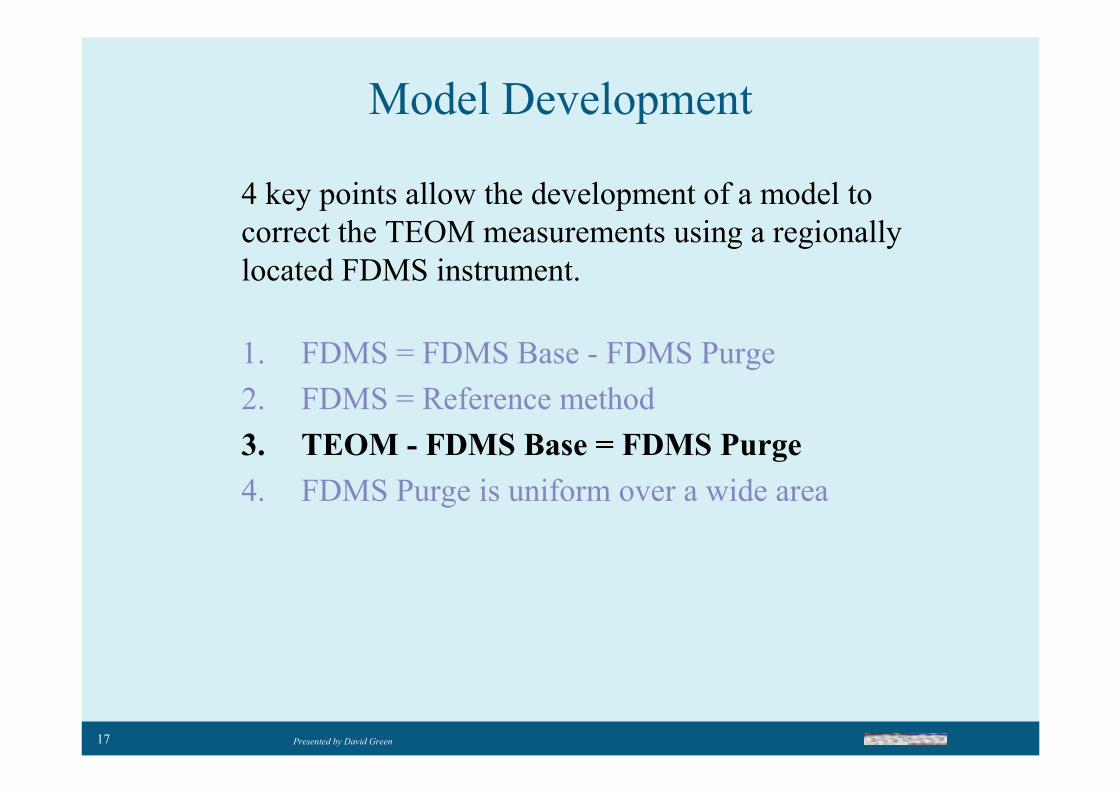
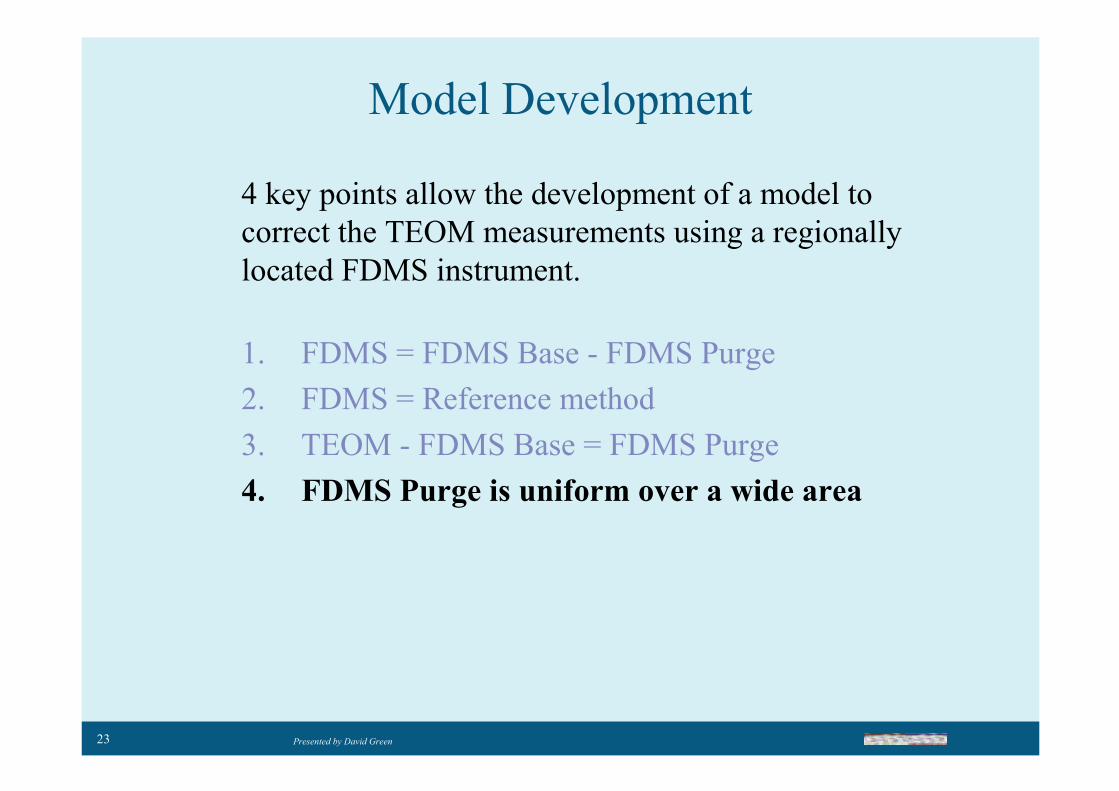
Model Development
4 key points allow the development of a model to
correct the TEOM measurements using a regionally
located FDMS instrument.
1. FDMS = FDMS Base - FDMS Purge
2. FDMS = Reference method
3. TEOM - FDMS Base = FDMS Purge
4. FDMS Purge is uniform over a wide area
13 Presented by David Green
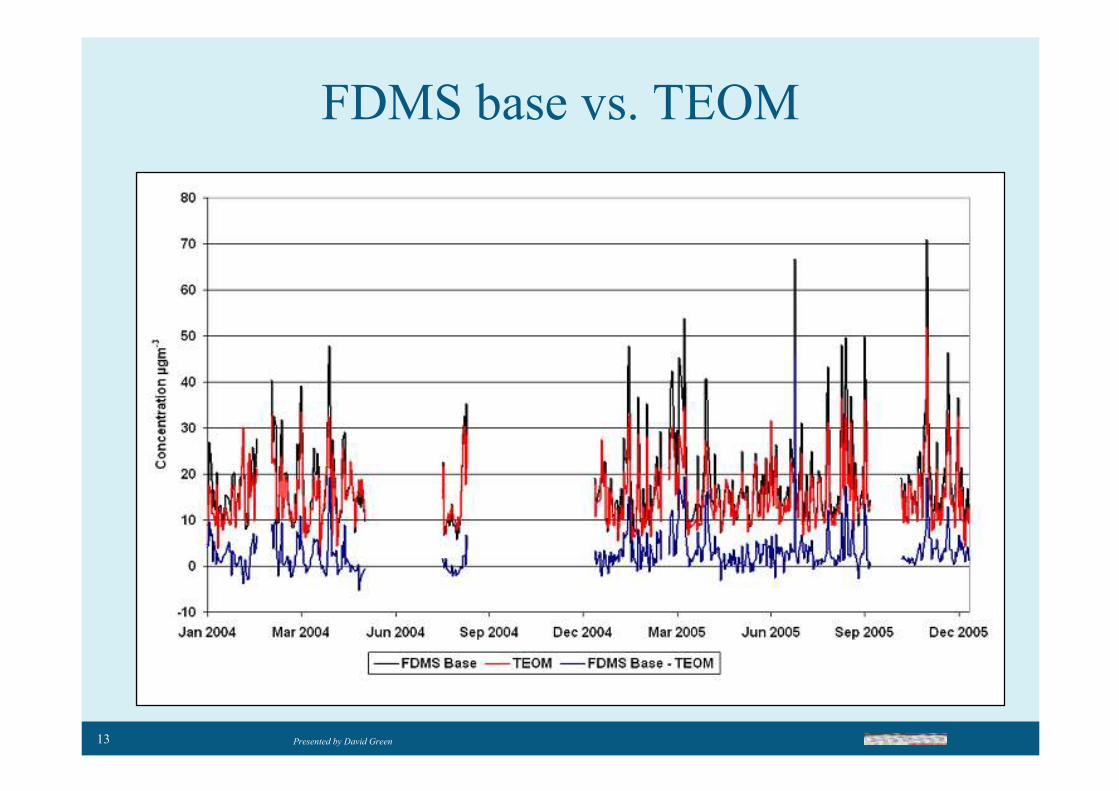
FDMS base vs. TEOM
14 Presented by David Green
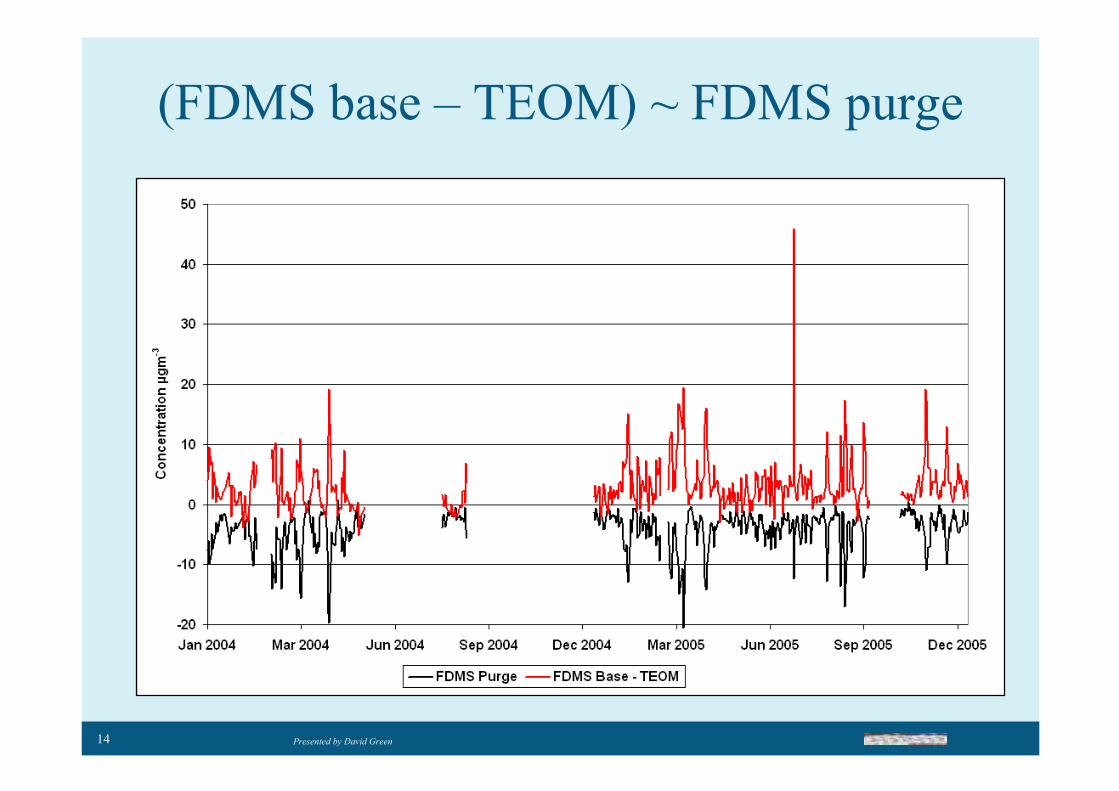
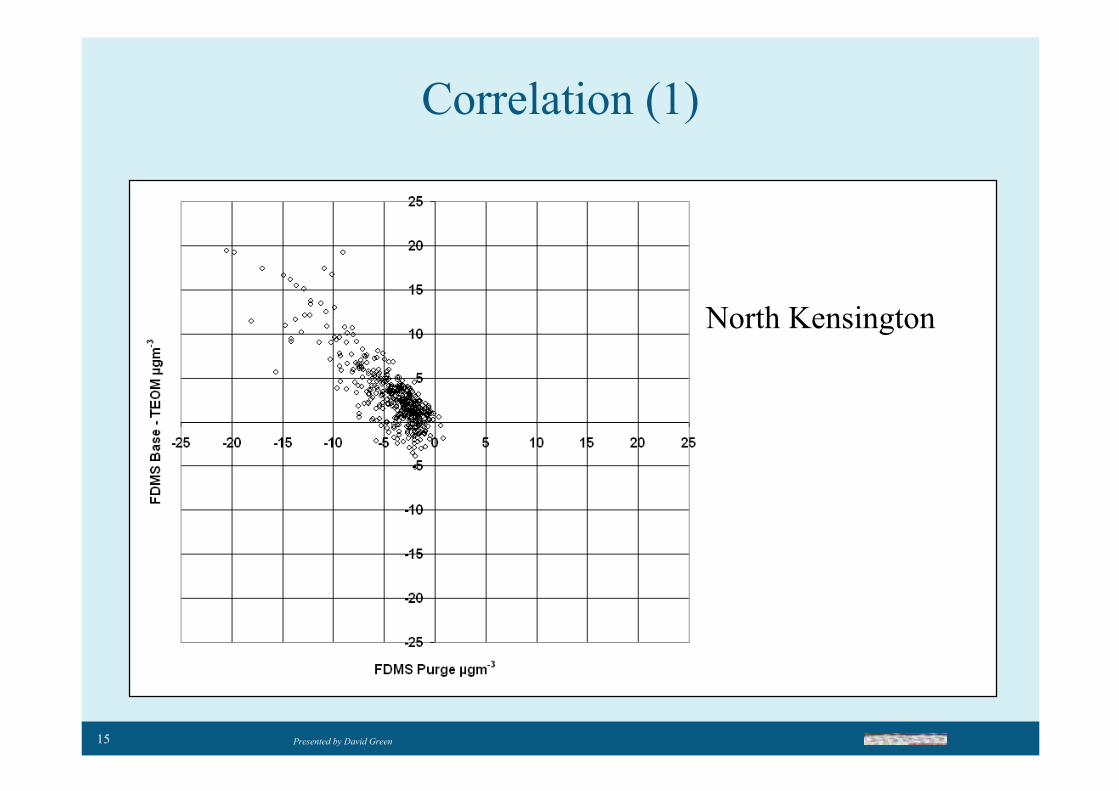
(FDMS base – TEOM) ~ FDMS purge
15 Presented by David Green
Correlation (1)
North Kensington

16 Presented by David Green
Marylebone Belvedere
Acton Town HallThames Road
Correlation (2)
17 Presented by David Green
Model Development
4 key points allow the development of a model to
correct the TEOM measurements using a regionally
located FDMS instrument.
1. FDMS = FDMS Base - FDMS Purge
2. FDMS = Reference method
3. TEOM - FDMS Base = FDMS Purge
4. FDMS Purge is uniform over a wide area

18 Presented by David Green
Model Development
4 key points allow the development of a model to
correct the TEOM measurements using a regionally
located FDMS instrument.
1. FDMS = FDMS Base - FDMS Purge
2. FDMS = Reference method
3. TEOM - FDMS Base = FDMS Purge
4. FDMS Purge is uniform over a wide area
19 Presented by David Green
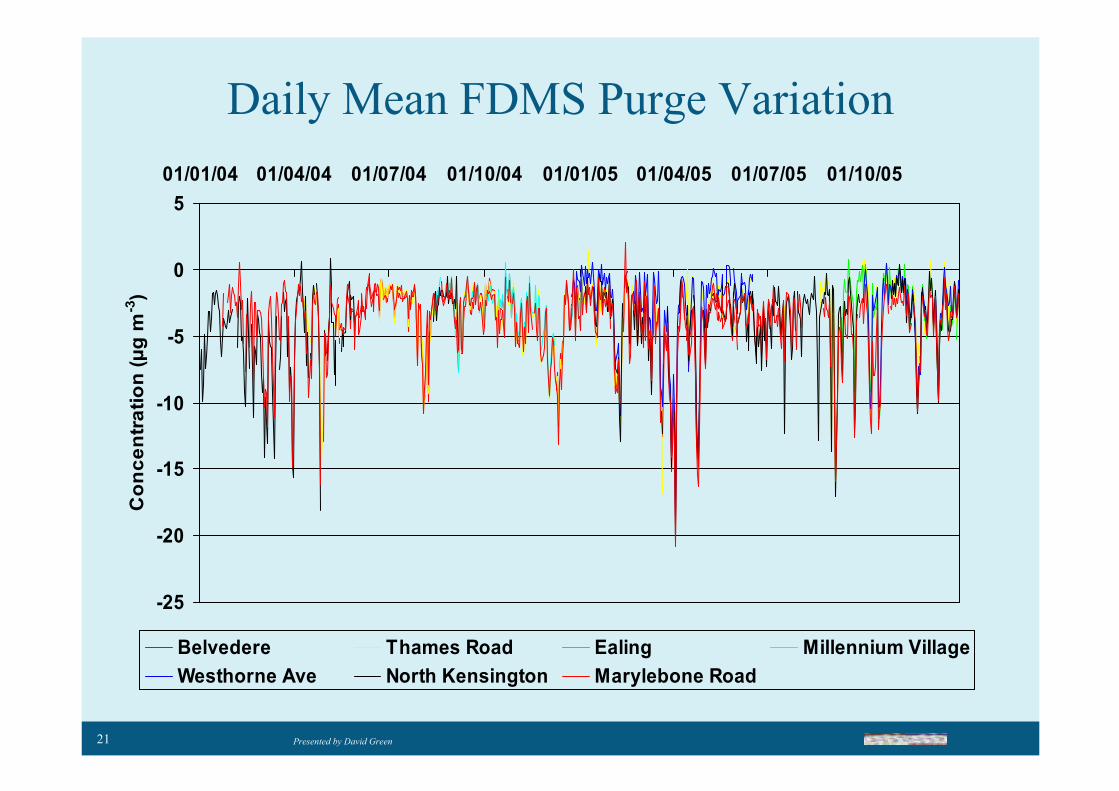
What do we know about the FDMS Purge?
• Measurement made when particle free air is passing over
the measurement filter
• Generally negative, indicating loss of mass from the filter
• Sometimes (but rarely) positive, indicating adsorption
under some conditions
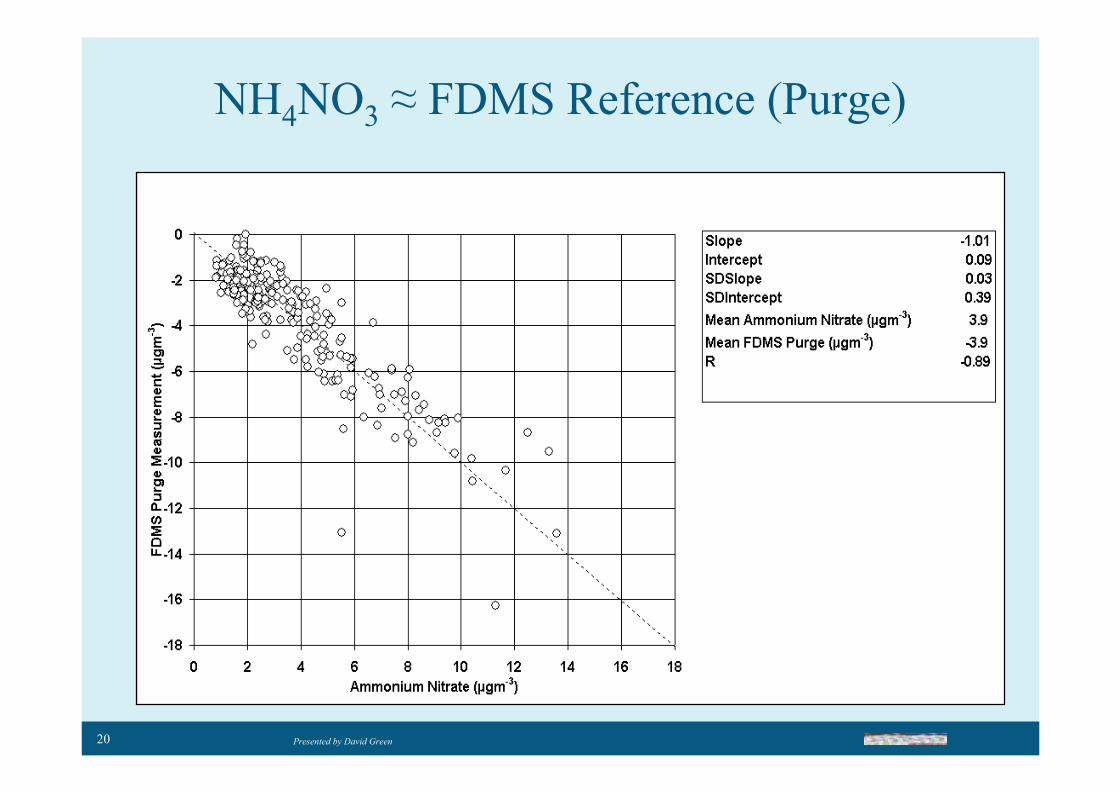
• Agrees well with mass of ammonium nitrate (Hering, S. et
al., 2004, Wittig, A. E. et al., 2004, Green and Fuller 2005)
• Ammonium nitrate, being a secondary PM component, is
likely to vary little on a regional scale. However, there has
been some suggestion of an urban enhancement.
20 Presented by David Green
NH4NO3 ≈ FDMS Reference (Purge)
21 Presented by David Green
Daily Mean FDMS Purge Variation
-25
-20
-15
-10
-5
0
5
01/01/04 01/04/04 01/07/04 01/10/04 01/01/05 01/04/05 01/07/05 01/10/05
Concentration (µg m
-3)
Belvedere Thames Road Ealing Millennium Village
Westhorne Ave North Kensington Marylebone Road
22 Presented by David Green
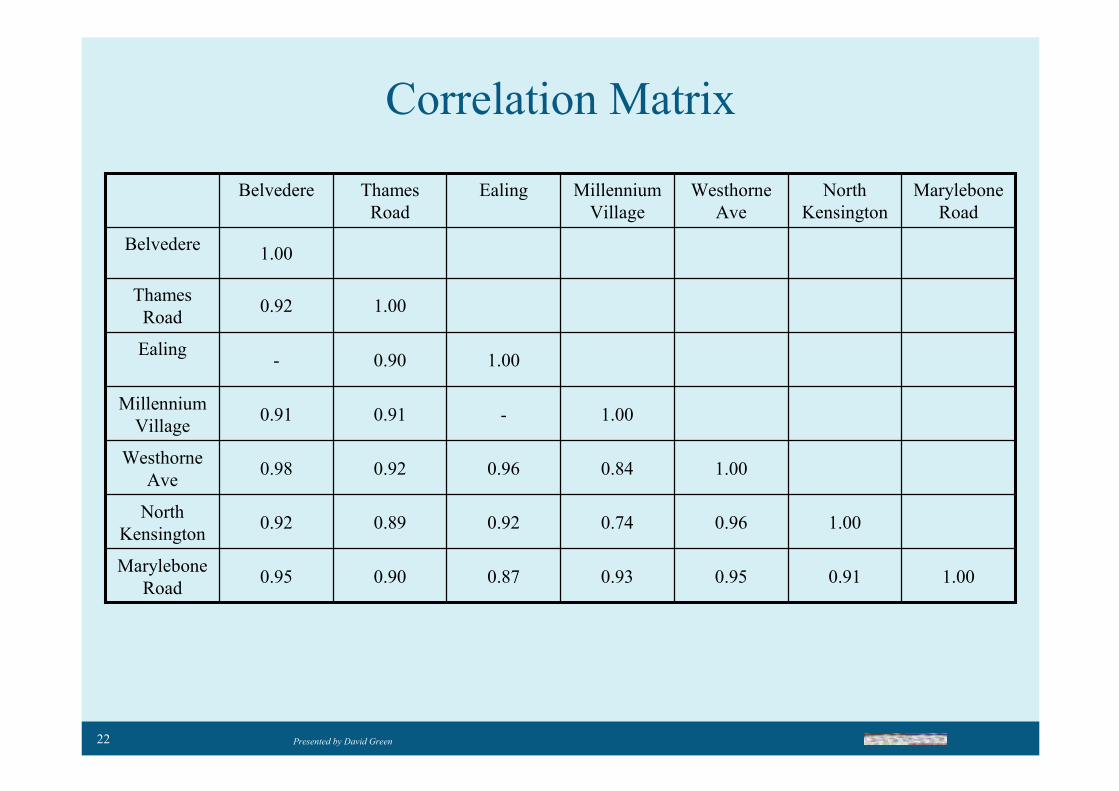
Correlation Matrix
1.000.910.950.930.870.900.95Marylebone
Road
1.000.960.740.920.890.92North
Kensington
1.000.840.960.920.98Westhorne
Ave
1.00-0.910.91Millennium
Village
1.000.90-Ealing
1.000.92Thames
Road
1.00Belvedere
Marylebone
Road
North
Kensington
Westhorne
Ave
Millennium
Village
EalingThames
Road
Belvedere
23 Presented by David Green
Model Development
4 key points allow the development of a model to
correct the TEOM measurements using a regionally
located FDMS instrument.
1. FDMS = FDMS Base - FDMS Purge
2. FDMS = Reference method
3. TEOM - FDMS Base = FDMS Purge
4. FDMS Purge is uniform over a wide area
24 Presented by David Green
Proposed Correction Model
FDMSPurgeFDMSBaseFDMS −=1.
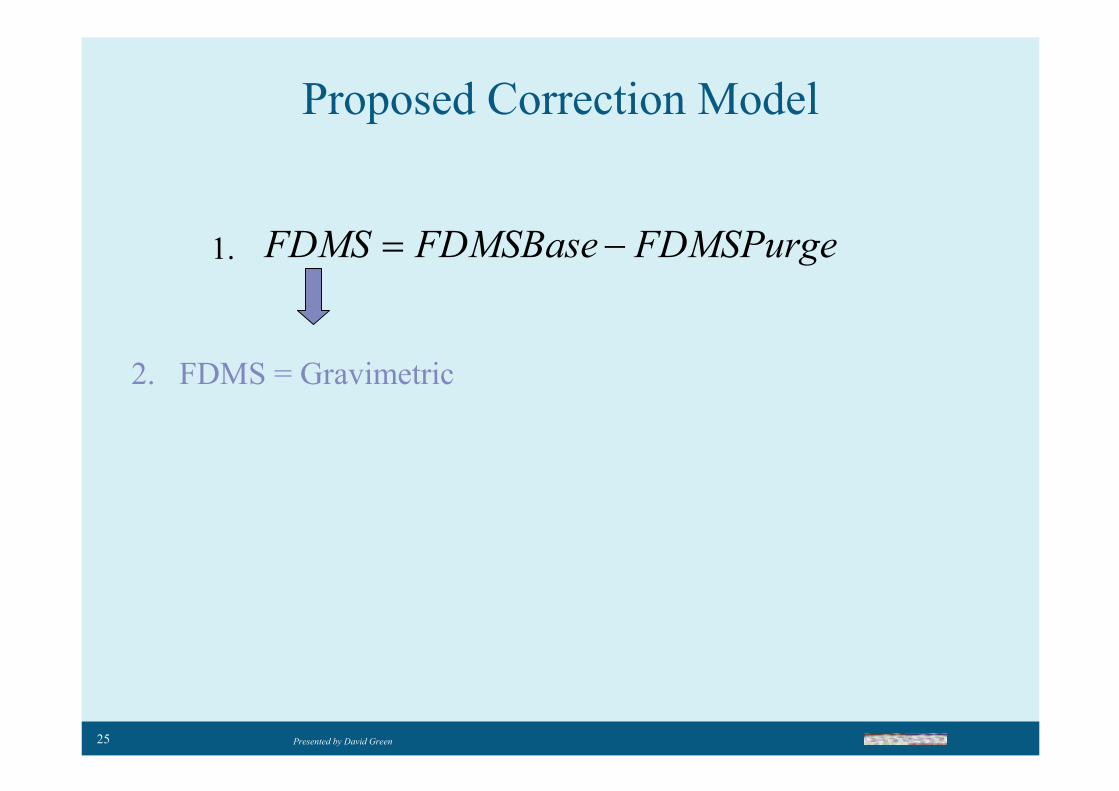
25 Presented by David Green
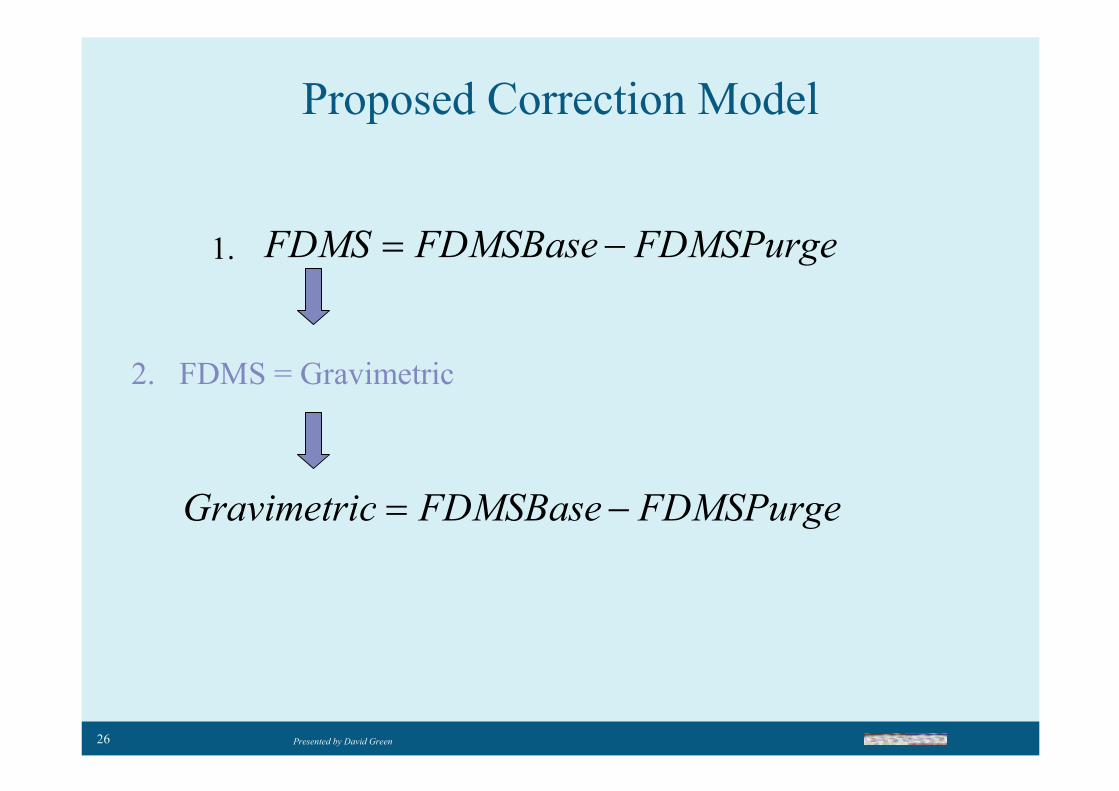
Proposed Correction Model
FDMSPurgeFDMSBaseFDMS −=
2. FDMS = Gravimetric
1.
26 Presented by David Green
Proposed Correction Model
FDMSPurgeFDMSBaseFDMS −=
2. FDMS = Gravimetric
FDMSPurgeFDMSBasecGravimetri −=
1.
27 Presented by David Green
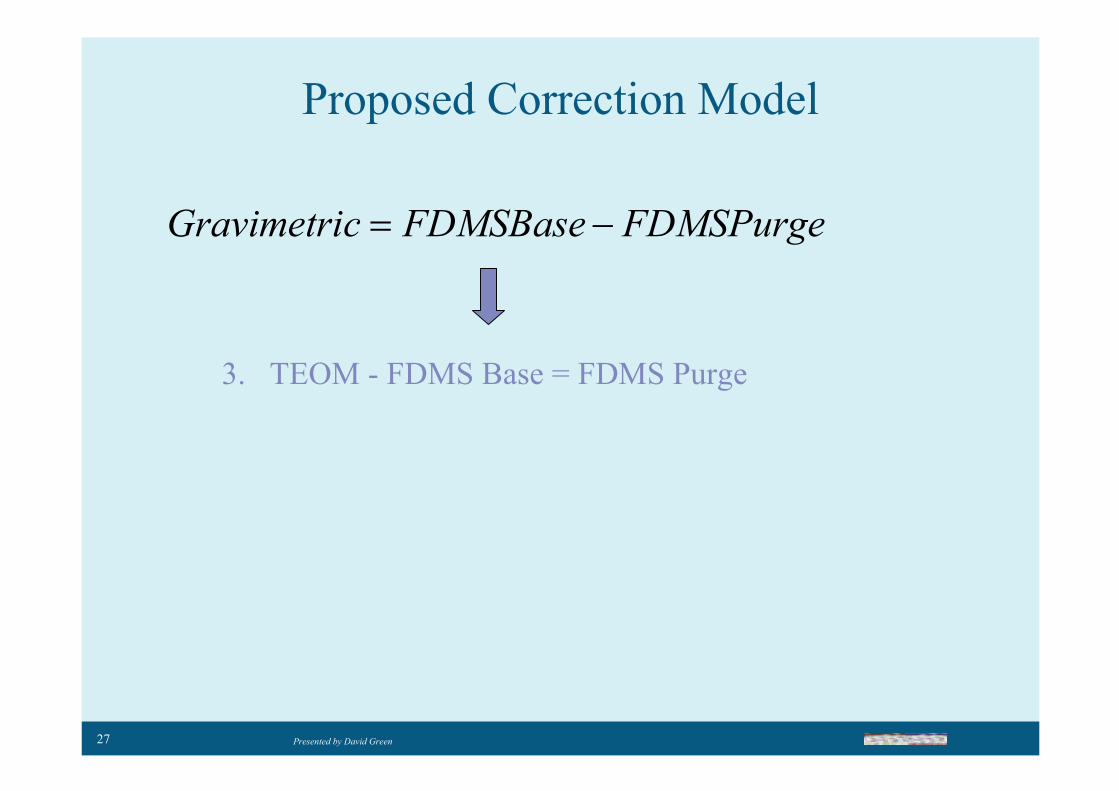
Proposed Correction Model
3. TEOM - FDMS Base = FDMS Purge
FDMSPurgeFDMSBasecGravimetri −=

28 Presented by David Green
Proposed Correction Model
3. FDMS Base = TEOM - FDMS Purge
FDMSPurgeFDMSBasecGravimetri −=
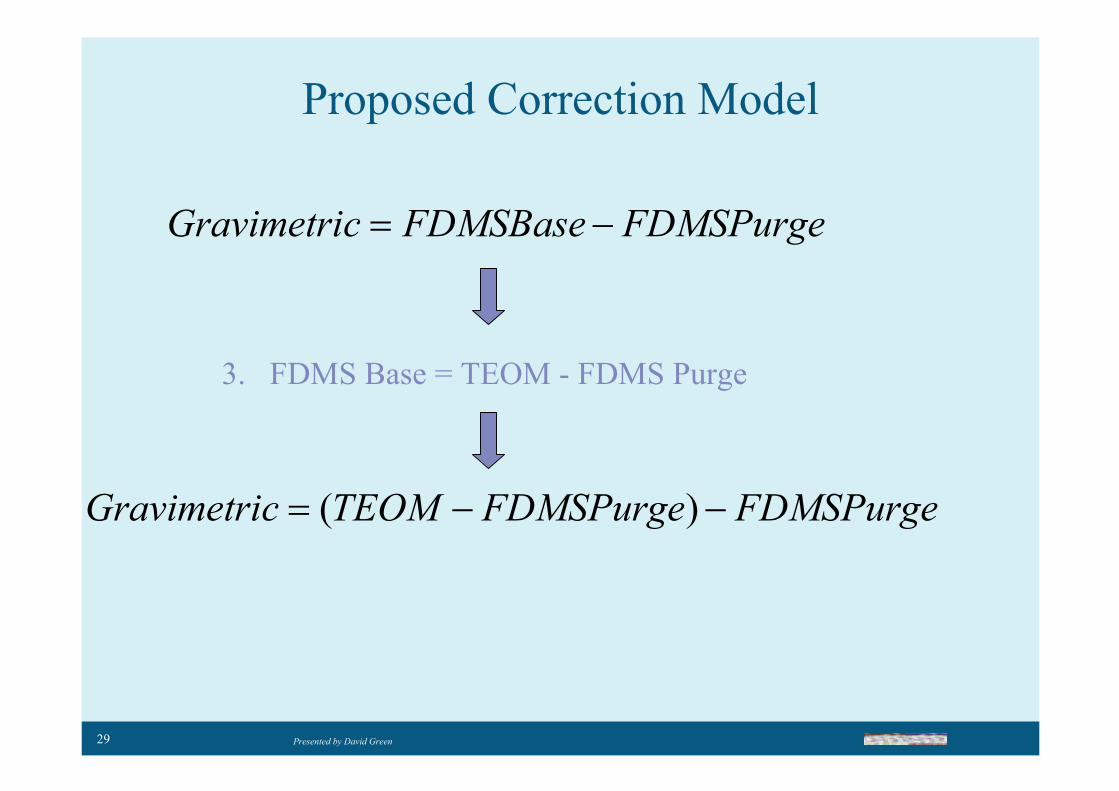
29 Presented by David Green
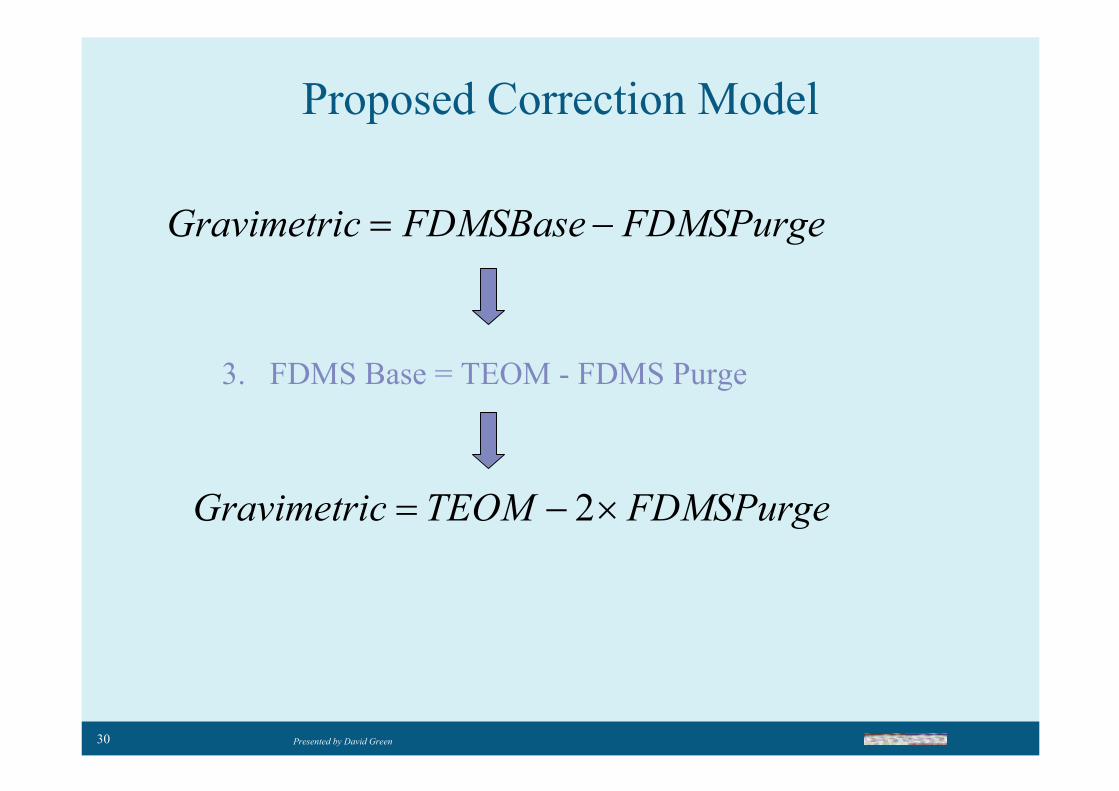
Proposed Correction Model
3. FDMS Base = TEOM - FDMS Purge
FDMSPurgeFDMSPurgeTEOMcGravimetri −−= )(
FDMSPurgeFDMSBasecGravimetri −=
30 Presented by David Green
Proposed Correction Model
3. FDMS Base = TEOM - FDMS Purge
FDMSPurgeTEOMcGravimetri ×−= 2
FDMSPurgeFDMSBasecGravimetri −=
31 Presented by David Green
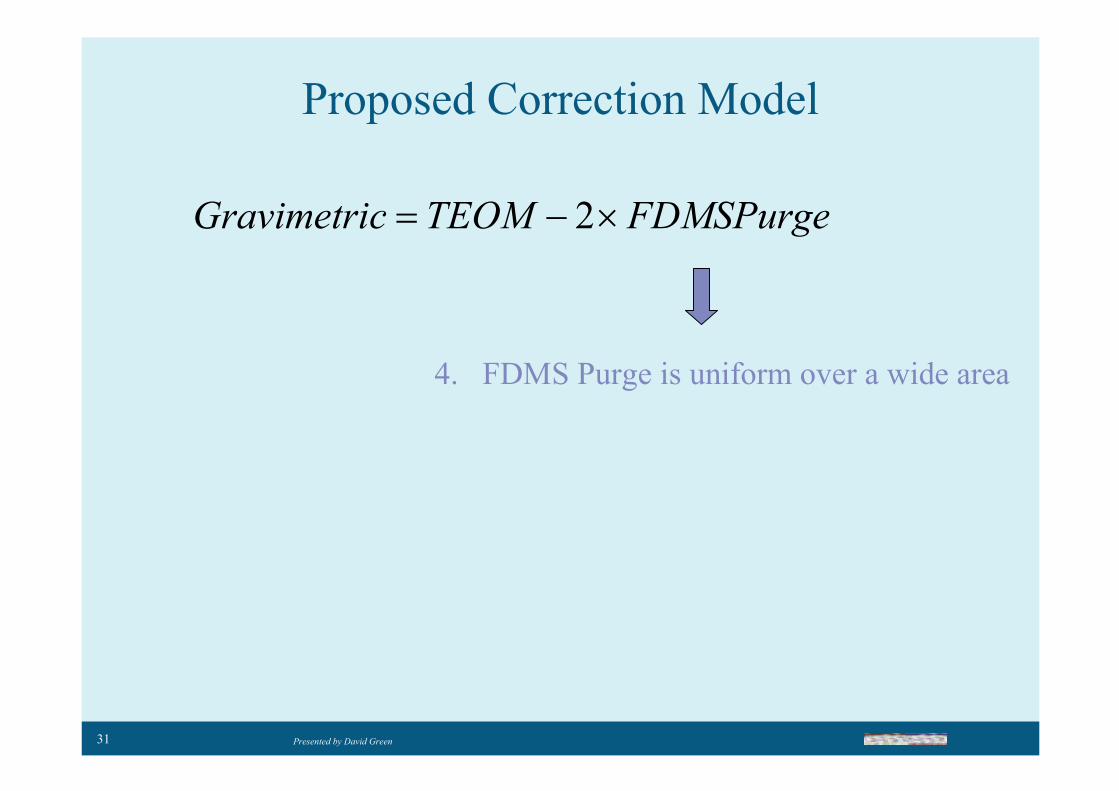
Proposed Correction Model
4. FDMS Purge is uniform over a wide area
FDMSPurgeTEOMcGravimetri ×−= 2
32 Presented by David Green
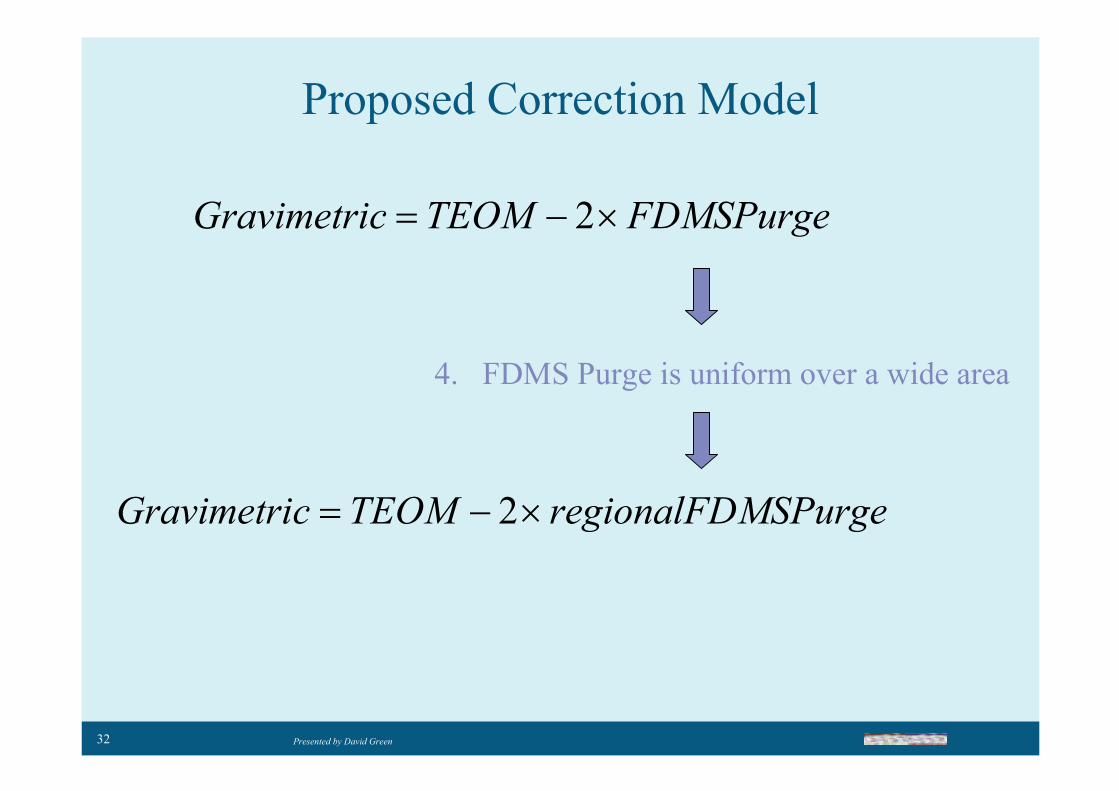
Proposed Correction Model
4. FDMS Purge is uniform over a wide area
FDMSPurgeTEOMcGravimetri ×−= 2
MSPurgeregionalFDTEOMcGravimetri ×−= 2
33 Presented by David Green
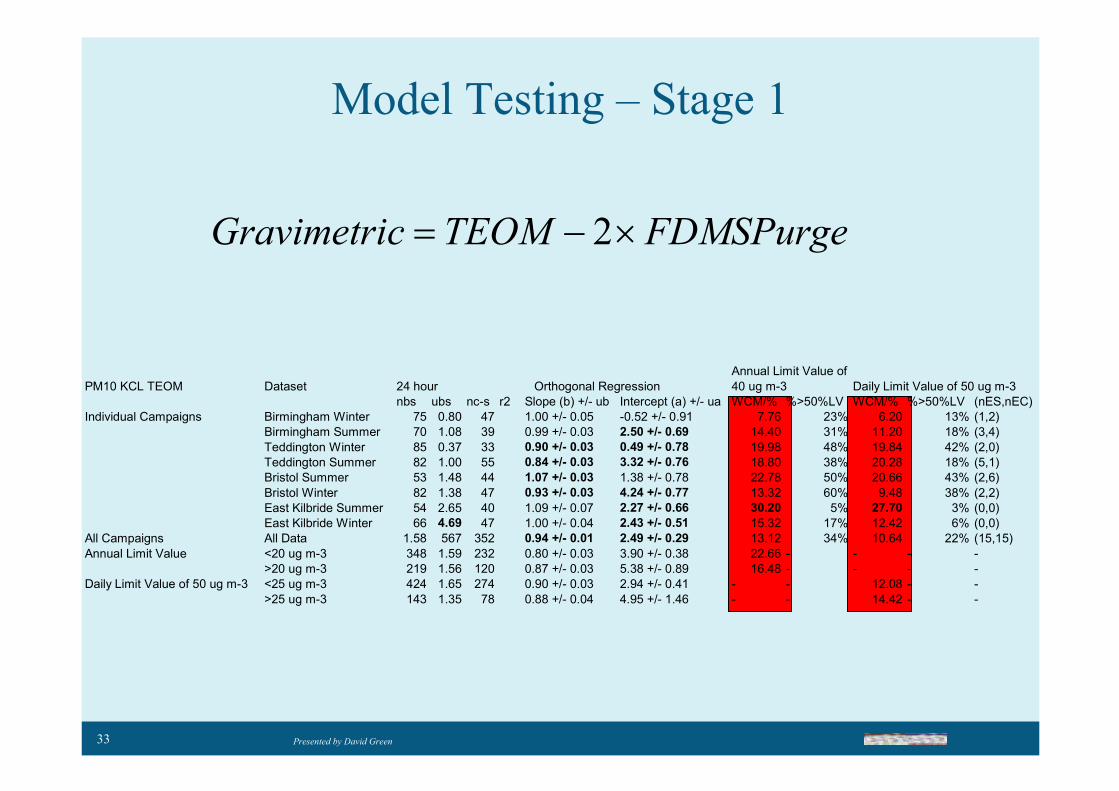
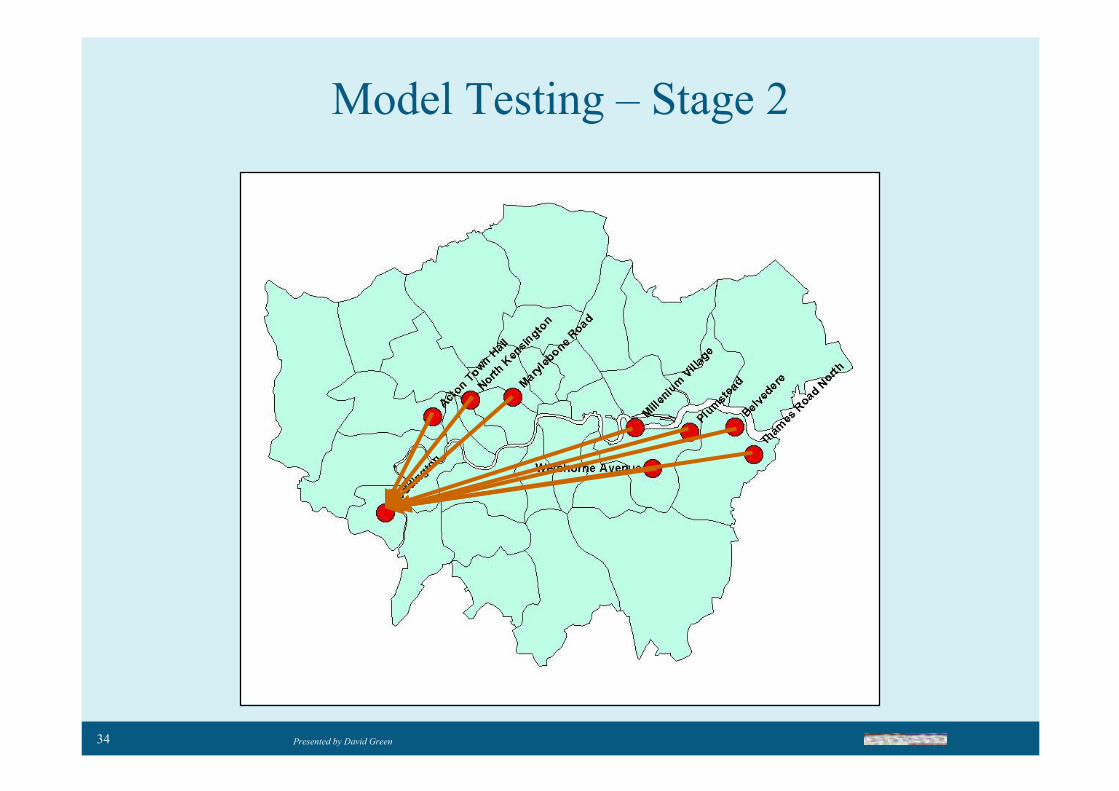
Model Testing – Stage 1
FDMSPurgeTEOMcGravimetri ×−= 2
PM10 KCL TEOM Dataset
nbs ubs nc-s r2 Slope (b) +/- ub Intercept (a) +/- ua WCM/% %>50%LV WCM/% %>50%LV (nES,nEC)
Individual Campaigns Birmingham Winter 75 0.80 47 1.00 +/- 0.05 -0.52 +/- 0.91 7.76 23% 6.20 13% (1,2)
Birmingham Summer 70 1.08 39 0.99 +/- 0.03 2.50 +/- 0.69 14.40 31% 11.20 18% (3,4)
Teddington Winter 85 0.37 33 0.90 +/- 0.03 0.49 +/- 0.78 19.98 48% 19.84 42% (2,0)
Teddington Summer 82 1.00 55 0.84 +/- 0.03 3.32 +/- 0.76 18.80 38% 20.28 18% (5,1)
Bristol Summer 53 1.48 44 1.07 +/- 0.03 1.38 +/- 0.78 22.78 50% 20.66 43% (2,6)
Bristol Winter 82 1.38 47 0.93 +/- 0.03 4.24 +/- 0.77 13.32 60% 9.48 38% (2,2)
East Kilbride Summer 54 2.65 40 1.09 +/- 0.07 2.27 +/- 0.66 30.20 5% 27.70 3% (0,0)
East Kilbride Winter 66 4.69 47 1.00 +/- 0.04 2.43 +/- 0.51 15.32 17% 12.42 6% (0,0)
All Campaigns All Data 1.58 567 352 0.94 +/- 0.01 2.49 +/- 0.29 13.12 34% 10.64 22% (15,15)
Annual Limit Value <20 ug m-3 348 1.59 232 0.80 +/- 0.03 3.90 +/- 0.38 22.66 - - - -
>20 ug m-3 219 1.56 120 0.87 +/- 0.03 5.38 +/- 0.89 16.48 - - - -
Daily Limit Value of 50 ug m-3 <25 ug m-3 424 1.65 274 0.90 +/- 0.03 2.94 +/- 0.41 - - 12.08 - -
>25 ug m-3 143 1.35 78 0.88 +/- 0.04 4.95 +/- 1.46 - - 14.42 - -
Annual Limit Value of
40 ug m-3 Daily Limit Value of 50 ug m-3Orthogonal Regression24 hour
34 Presented by David Green
Model Testing – Stage 2
35 Presented by David Green
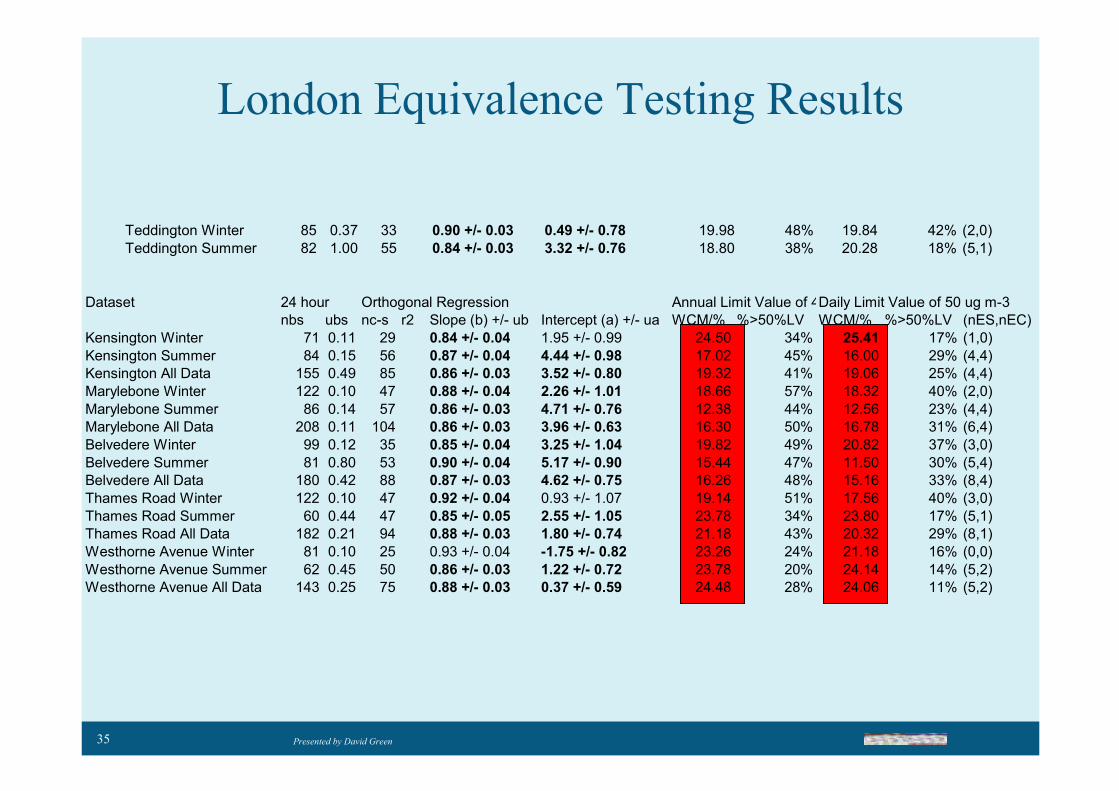
London Equivalence Testing Results
Teddington Winter 85 0.37 33 0.90 +/- 0.03 0.49 +/- 0.78 19.98 48% 19.84 42% (2,0)
Teddington Summer 82 1.00 55 0.84 +/- 0.03 3.32 +/- 0.76 18.80 38% 20.28 18% (5,1)
Dataset
nbs ubs nc-s r2 Slope (b) +/- ub Intercept (a) +/- ua WCM/% %>50%LV WCM/% %>50%LV (nES,nEC)
Kensington Winter 71 0.11 29 0.84 +/- 0.04 1.95 +/- 0.99 24.50 34% 25.41 17% (1,0)
Kensington Summer 84 0.15 56 0.87 +/- 0.04 4.44 +/- 0.98 17.02 45% 16.00 29% (4,4)
Kensington All Data 155 0.49 85 0.86 +/- 0.03 3.52 +/- 0.80 19.32 41% 19.06 25% (4,4)
Marylebone Winter 122 0.10 47 0.88 +/- 0.04 2.26 +/- 1.01 18.66 57% 18.32 40% (2,0)
Marylebone Summer 86 0.14 57 0.86 +/- 0.03 4.71 +/- 0.76 12.38 44% 12.56 23% (4,4)
Marylebone All Data 208 0.11 104 0.86 +/- 0.03 3.96 +/- 0.63 16.30 50% 16.78 31% (6,4)
Belvedere Winter 99 0.12 35 0.85 +/- 0.04 3.25 +/- 1.04 19.82 49% 20.82 37% (3,0)
Belvedere Summer 81 0.80 53 0.90 +/- 0.04 5.17 +/- 0.90 15.44 47% 11.50 30% (5,4)
Belvedere All Data 180 0.42 88 0.87 +/- 0.03 4.62 +/- 0.75 16.26 48% 15.16 33% (8,4)
Thames Road Winter 122 0.10 47 0.92 +/- 0.04 0.93 +/- 1.07 19.14 51% 17.56 40% (3,0)
Thames Road Summer 60 0.44 47 0.85 +/- 0.05 2.55 +/- 1.05 23.78 34% 23.80 17% (5,1)
Thames Road All Data 182 0.21 94 0.88 +/- 0.03 1.80 +/- 0.74 21.18 43% 20.32 29% (8,1)
Westhorne Avenue Winter 81 0.10 25 0.93 +/- 0.04 -1.75 +/- 0.82 23.26 24% 21.18 16% (0,0)
Westhorne Avenue Summer 62 0.45 50 0.86 +/- 0.03 1.22 +/- 0.72 23.78 20% 24.14 14% (5,2)
Westhorne Avenue All Data 143 0.25 75 0.88 +/- 0.03 0.37 +/- 0.59 24.48 28% 24.06 11% (5,2)
Annual Limit Value of 40 ug m-3Daily Limit Value of 50 ug m-3Orthogonal Regression24 hour
36 Presented by David Green
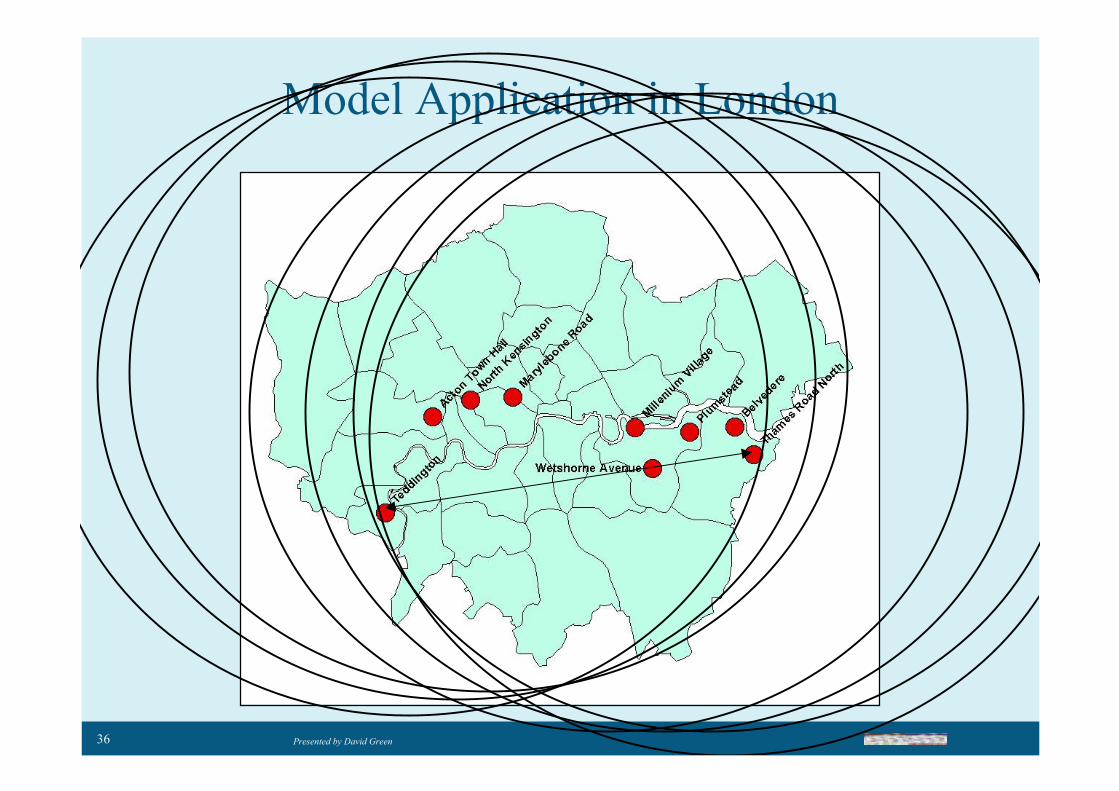
Model Application in London

37 Presented by David Green
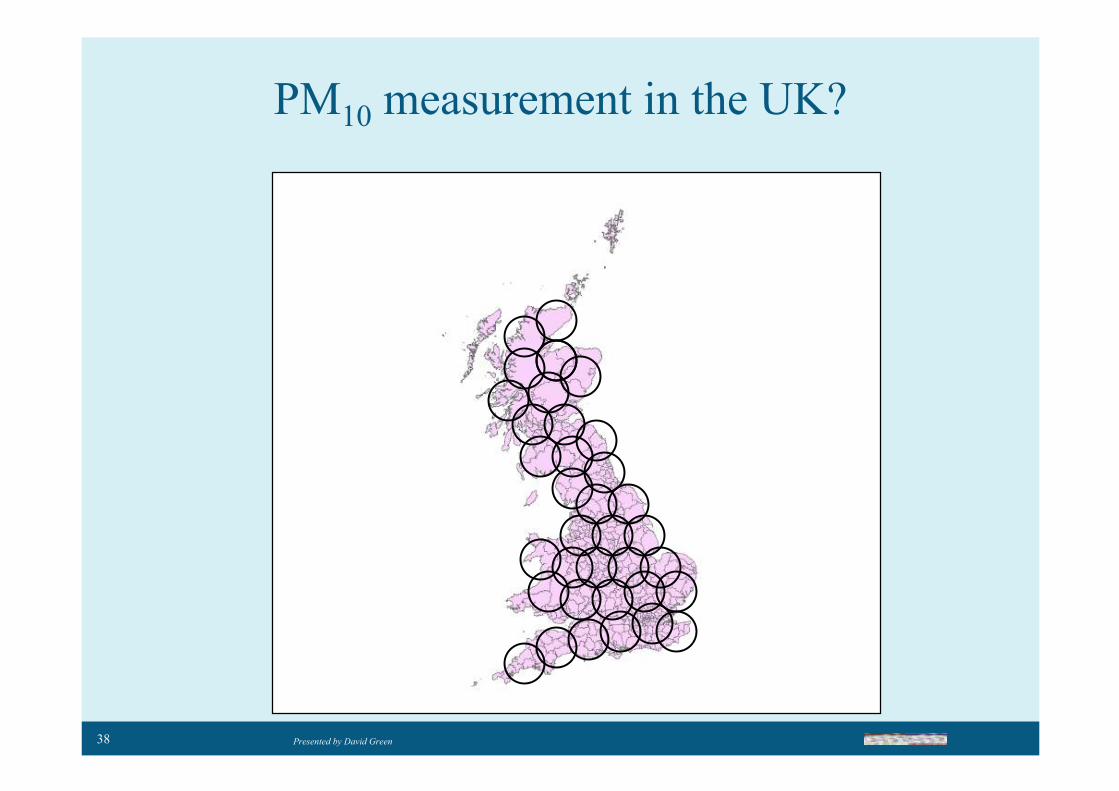
PM10 measurement in the UK
38 Presented by David Green
PM10 measurement in the UK?

39 Presented by David Green
Lots more questions….
40 Presented by David Green
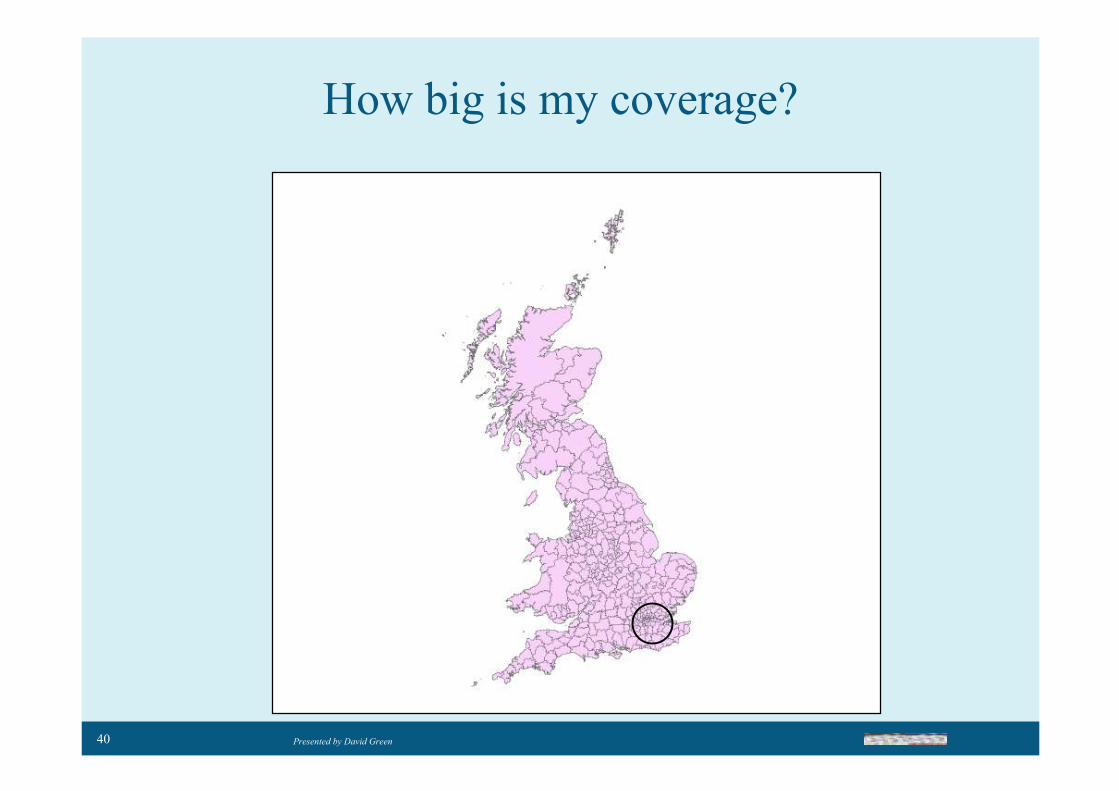
How big is my coverage?
41 Presented by David Green
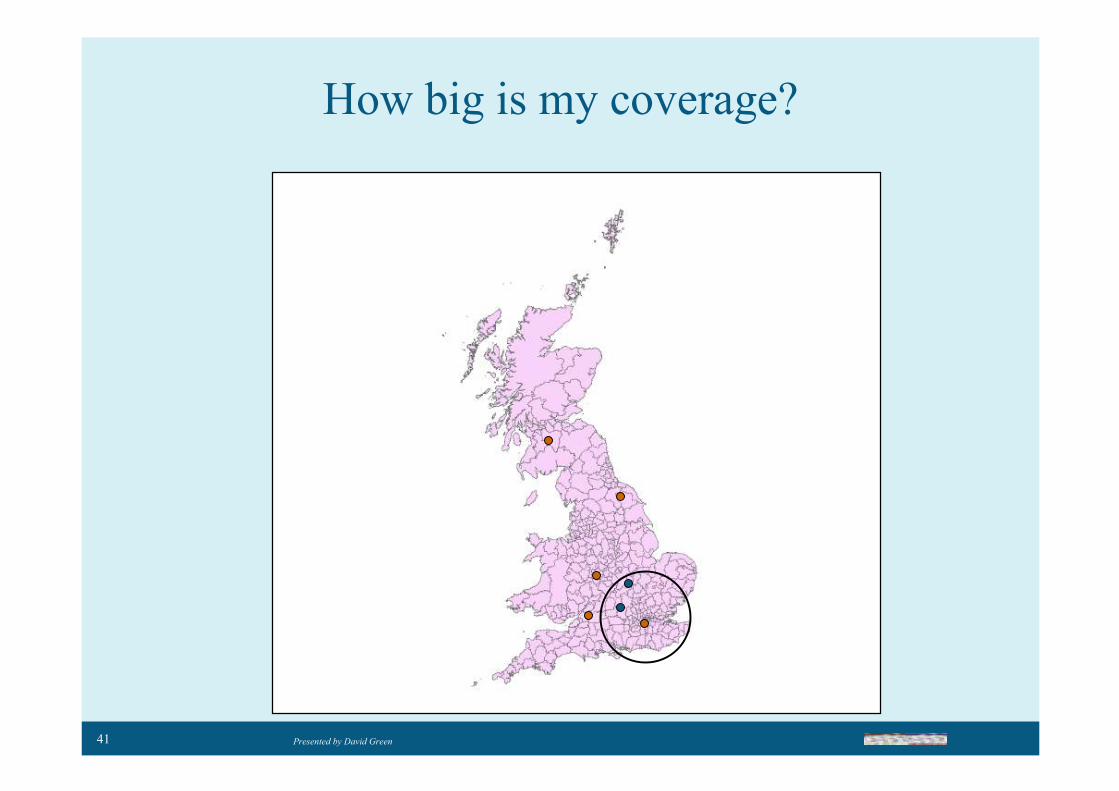
How big is my coverage?
42 Presented by David Green
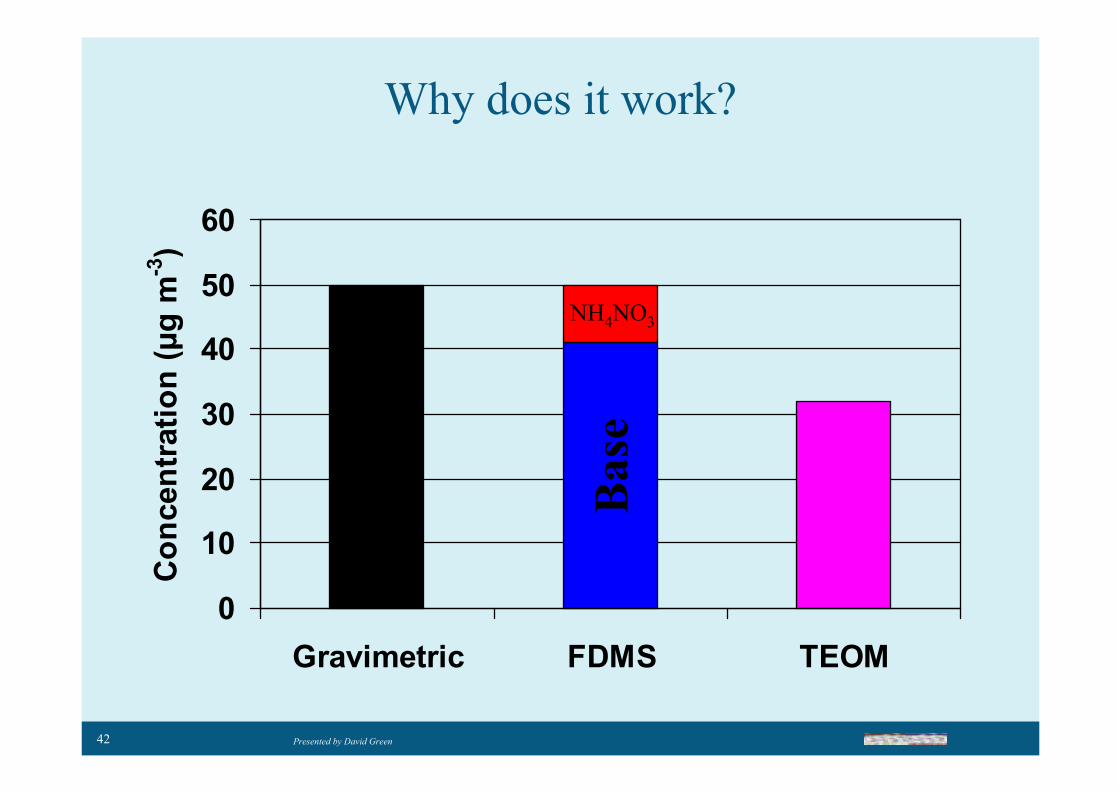
Why does it work?
0
10
20
30
40
50
60
Gravimetric FDMS TEOM
Concentration (µg m
-3)
Base
NH4NO3
43 Presented by David Green
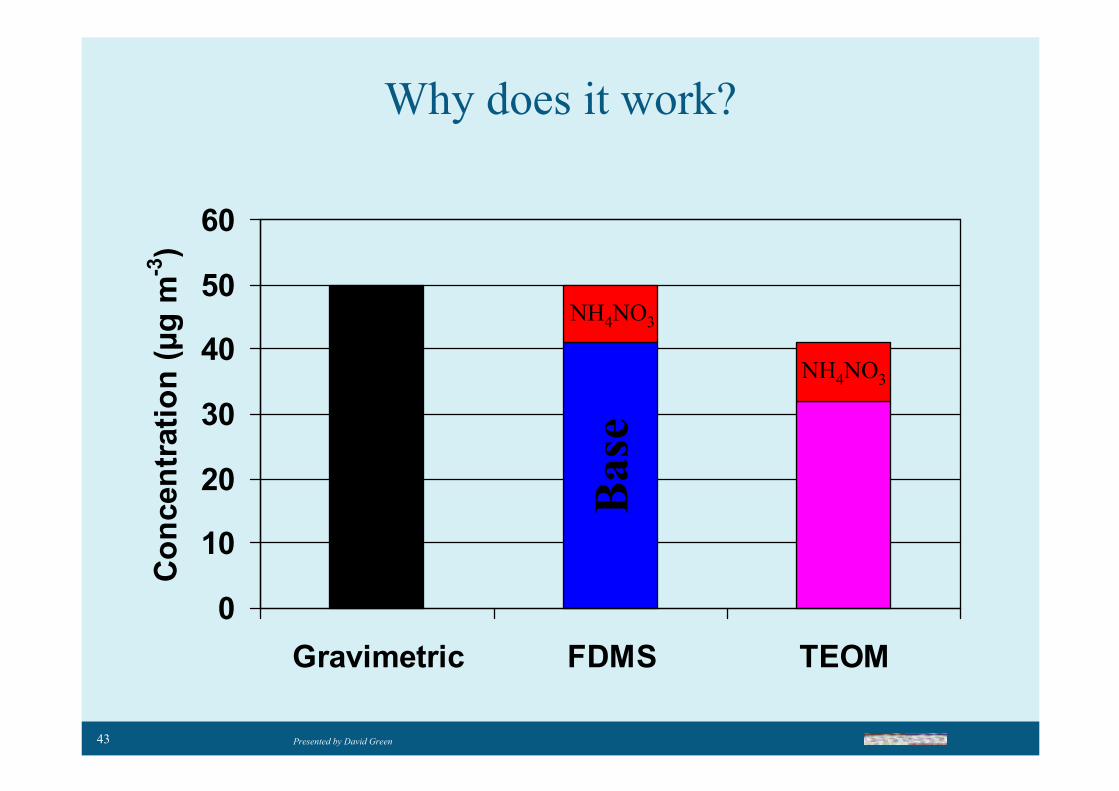
Why does it work?
0
10
20
30
40
50
60
Gravimetric FDMS TEOM
Concentration (µg m
-3)
Base
NH4NO3
NH4NO3
44 Presented by David Green
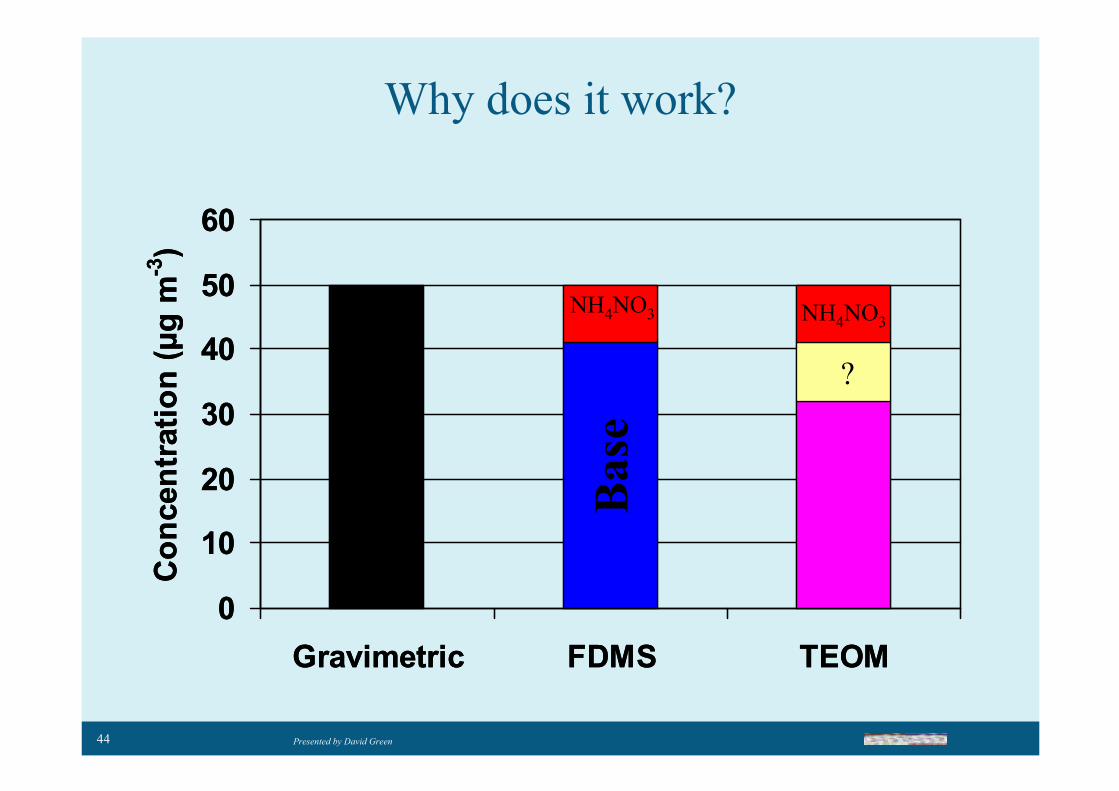
Why does it work?
0
10
20
30
40
50
60
Gravimetric FDMS TEOM
Concentration (µg m
-3)
0
10
20
30
40
50
60
Gravimetric FDMS TEOM
Concentration (µg m
-3)
Base
NH4NO3
?
NH4NO3
45 Presented by David Green
Further Work…
• Further model testing
–Geographical extent
• Underlying mechanisms
• Application in real time
• PM2.5
46 Presented by David Green
Acknowledgements
• London Borough of Bexley
• London Borough of Greenwich
• London Borough of Ealing
• City of Westminster
• Royal Borough of Kensington and Chelsea
• DEFRA
• Air Monitors
47 Presented by David Green
Summary
• PM10 monitoring network which reports
reference equivalent measurements
–Relatively little additional cost
–Gravimetric
–FDMS
–BAM (corrected)
–TEOM (volatile corrected)