Embed Size (px)
Citation preview

Correcting TEOM Measurements using the KCL Volatile
Correction ModelDavid Green, Gary Fuller
& Timothy Baker

2 Presented by David Green
Contents
• Model Development Context• UK PM Monitoring Problem• Model derivation• Model testing• Proposed monitoring strategy for
the UK

3 Presented by David Green
Model Development Context
• January LAQN Seminar – London FDMS• Defra funded work early 2007
–Grounded in statistics used to demonstrate equivalence
– UK wide applicability
• Named it: “Volatile Correction Model”• Future steps

4 Presented by David Green
PM10 Monitoring Problem• Complex pollutant
– Different components
– Constantly changing
• Reference Method– Labour intensive
– Poor time resolution
– Slow data dissemination
Reference
MethodTEOM
FDMS
• TEOM– Heats sample inlet to 50°C to
eliminate water but looses volatile PM
• FDMS– Uses a diffusion dryer to eliminate
water and retain a sample temperature of 30°C
– Equivalent to Reference
• UK Monitoring Networks– Predominately TEOM
– Need to use equivalent methods for reporting to EU
BAM

5 Presented by David Green
PM10 Measurement Time Series
0
10
20
30
40
50
60
70
28/11/04 28/01/05 28/03/05 28/05/05
Da
ily
Me
an
Co
nc
en
tra
tio
n (
µg
m-3
)KFGTEOM

6 Presented by David Green
PM10 Measurement Time Series
0
10
20
30
40
50
60
70
28/11/04 28/01/05 28/03/05 28/05/05
Da
ily
Me
an
Co
nc
en
tra
tio
n (
µg
m-3
)KFGTEOMFDMS

7 Presented by David Green
PM10 Measurement Correlation
0
10
20
30
40
50
60
0 10 20 30 40 50 60
Reference Method (µg m-3)
Ca
nd
ida
te M
eth
od
(µ
g m
-3)
TEOM
FDMS

8 Presented by David Green
How do we achieve an Equivalent Network?
• Upgrade TEOM to FDMS–Expensive (capital)
–Retains some continuity of measurement
• Change monitoring equipment–Gravimetric
– (capital and revenue)
– Loose continuity of measurement
–Delay in reporting time
–BAM–Expensive (capital)
– Loose continuity of measurement
• A ‘Third Way’?–Using FDMS measurements of volatile PM to
correct TEOM measurements

9 Presented by David Green
KCL Volatile Correction Model
• Provides a daily, site specific correction factor for TEOM measurements
• Correction based on FDMS purge measurement made some distance away
• Results in reference equivalent daily mean concentration within the 25% expanded uncertainty specified by the AQ Directive

10 Presented by David Green
Model Derivation

11 Presented by David Green
FDMS – Filter Dynamics Measurement System
• 2 measurement modes:–Base (analogous to
standard TEOM)
–Purge, which measures mass lost from the filter when particle free air is passing through it
• FDMS Mass = Base - Purge

12 Presented by David Green
Model Derivation

13 Presented by David Green
TEOM and FDMS Monitoring
East Kilbride
Birmingham
Bristol
Teddington

14 Presented by David Green
TEOM – Base vs. FDMS Purge
-25
-20
-15
-10
-5
0
5
23/12/2004 20/01/2005 17/02/2005 17/03/2005 14/04/2005 12/05/2005 09/06/2005
Co
nce
ntr
atio
n (
µg
m-3
)
Birmingham TEOM-Base Birmingham Purge

15 Presented by David Green
TEOM – FDMS Base vs. FDMS Purge
-25
-20
-15
-10
-5
0
5
-25 -15 -5 5
TEOM - FDMS Base (µg m-3)
FD
MS
Pu
rge
(µg
m-3
)

16 Presented by David Green
PM10 Measurements
0
10
20
30
40
50
60
0 10 20 30 40 50 60
Reference Method (µg m-3)
Ca
nd
ida
te M
eth
od
(µ
g m
-3)
TEOM
FDMS

17 Presented by David Green
PM10 Measurements
0
10
20
30
40
50
60
0 10 20 30 40 50 60
Reference Method (µg m-3)
Ca
nd
ida
te M
eth
od
(µ
g m
-3)
TEOM
FDMS
Model

18 Presented by David Green
Model Derivation

19 Presented by David Green
Uniform FDMS Purge Concentrations
-25
-20
-15
-10
-5
0
5
23/12/2004 20/01/2005 17/02/2005 17/03/2005 14/04/2005 12/05/2005 09/06/2005
Co
nce
ntr
atio
n (
µg
m-3
)
Bexley Purge North Kensington Purge Marylebone Purge

20 Presented by David Green
Equivalence Testing
• Experiment 1 – test the model at the equivalence programme sites excluding regional aspects
• Experiment 2 - test the model at the equivalence programme sites including regional aspects
Criteria
n ≥ 40
n ≥ 50 % of limit value ≥ 25%
Between reference sampler uncertainty
≤ 2 µg m-3
Between candidate sampler uncertainty
≤ 3 µg m-3
Expanded Uncertainty ≥ 25%

21 Presented by David Green
Experiment 2

22 Presented by David Green
Expanded Uncertainty
0
10
20
30
40
50
60
70
80
90
0 200 400 600
Distance (km)
Exp
and
ed U
nce
rtai
nty
(%
)
Model
FDMS

23 Presented by David Green
Monitoring Strategy based on the VCM Model
24 Presented by David Green
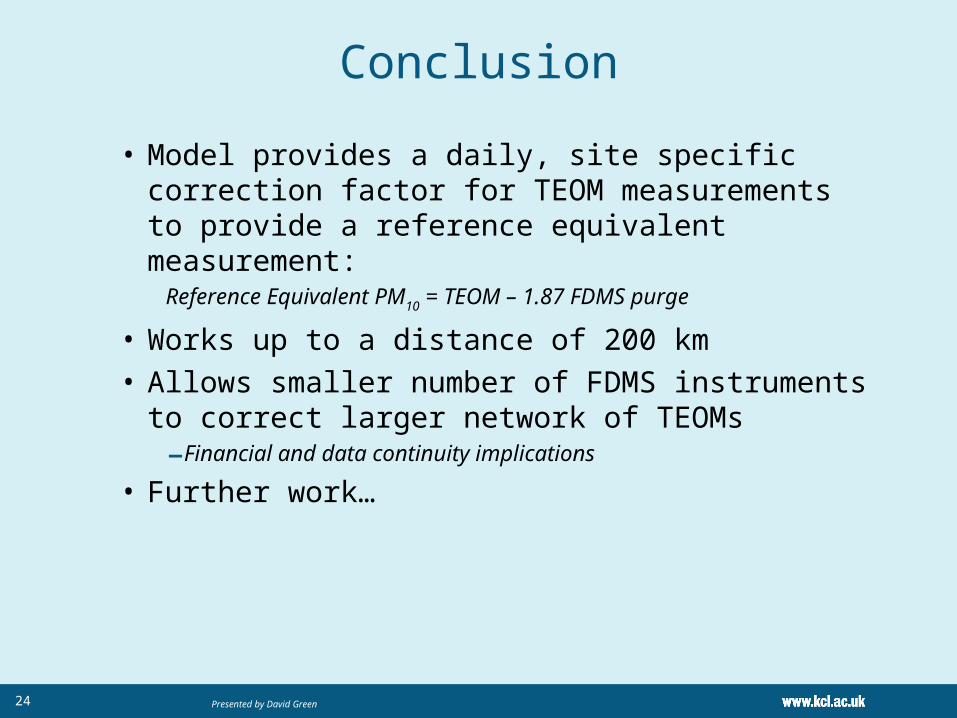
Conclusion
• Model provides a daily, site specific correction factor for TEOM measurements to provide a reference equivalent measurement:
Reference Equivalent PM10 = TEOM – 1.87 FDMS purge
• Works up to a distance of 200 km• Allows smaller number of FDMS instruments
to correct larger network of TEOMs–Financial and data continuity implications
• Further work…

25 Presented by David Green
Further Work
• Physical and chemical basis for model–Concentrations on TEOM and FDMS filters
–Ammonium nitrate
–Volatile organic compounds
–Collocated measurements–Ammonium nitrate
–Volatile organic compounds
–Water
• Extend to hourly public dissemination• Provide method for local authorities to use the
model• Extend to PM2.5

26 Presented by David Green
Acknowledgements
• Defra• London Borough of Bexley• London Borough of Greenwich• London Borough of Ealing• City of Westminster• Royal Borough of Kensington and
Chelsea• Air Monitors

27 Presented by David Green
Thank you for you attention!