Embed Size (px)
Citation preview

Data Warehousing - 2
ISYS 650

Data Warehouse Design- Star Schema -
• Dimension tables– contain descriptions about the subjects of the
business such as customers, employees, locations, products, time periods, etc.
• Fact table– contain detailed business data with links to
dimension tables.

Star schema example
Fact table provides statistics for sales broken down by product, period and store dimensions
Dimension tables contain descriptions about the subjects of the business
Note: What is the key of the fact table?

Star schema with sample data

On-Line Analytical Processing (OLAP) Tools• The use of a set of graphical tools that provides users
with multidimensional views of their data and allows them to analyze the data using simple windowing techniques
• OLAP Operations– Cube slicing–come up with 2-D view of data– Drill-down–going from summary to more detailed views– Roll-up – the opposite direction of drill-down– Reaggregation – rearrange the order of dimensions

Slicing a data cube
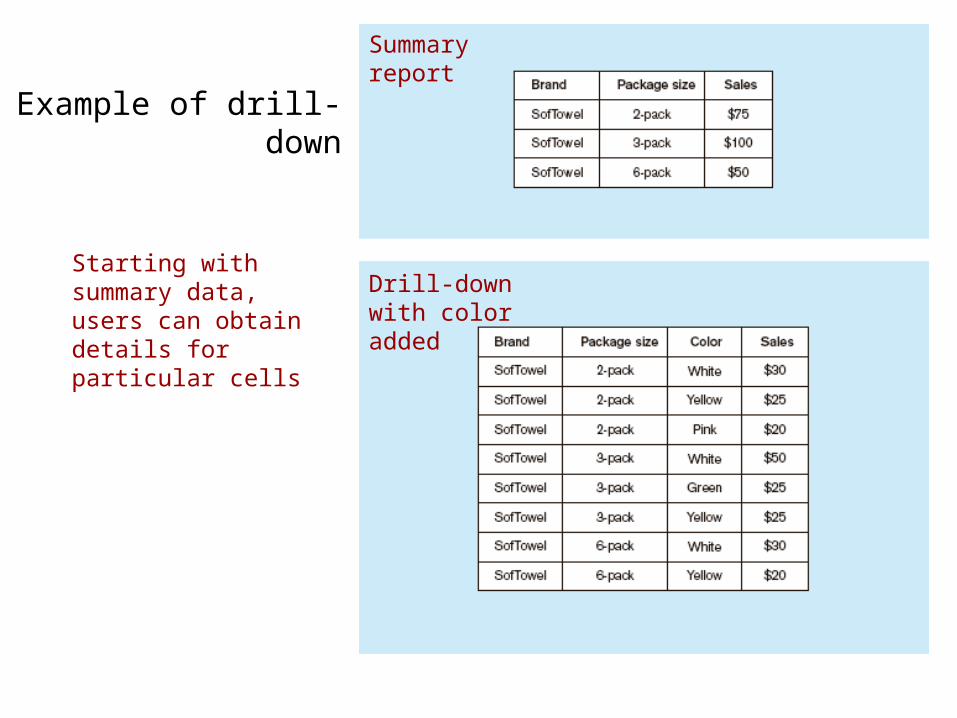
Example of drill-down
Summary report
Drill-down with color added
Starting with summary data, users can obtain details for particular cells
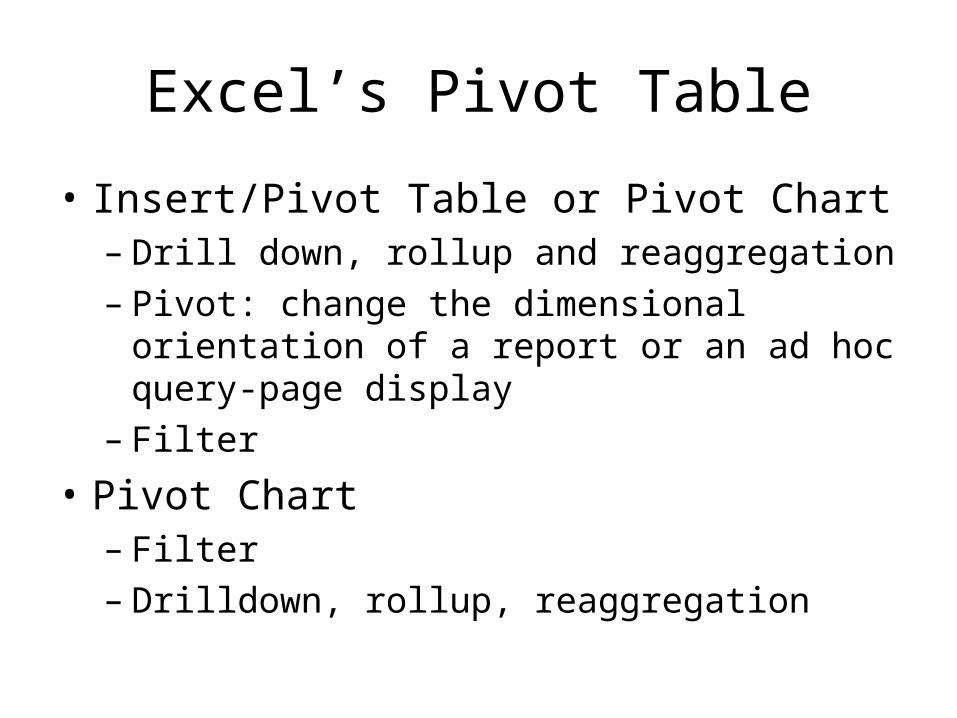
Excel’s Pivot Table
• Insert/Pivot Table or Pivot Chart– Drill down, rollup and reaggregation– Pivot: change the dimensional orientation of a
report or an ad hoc query-page display– Filter
• Pivot Chart– Filter– Drilldown, rollup, reaggregation

Data Warehouse Lifecycle • Requirement gathering
– Determine the reports that DW is supposed to support.• Identify data sources and data modeling
– based on user requirements• Extract data and populate the staging area with
the data extracted from transactional sources.• Build and populate a dimensional database.• Build Extraction Transformation and Loading (ETL)
routines to populate the dimensional database regularly.
• Build reports and analytical views• Maintain the warehouse by adding/changing
supported features and reports

Example:Transaction Database
Customer Order
Product
Has
Has
1 M
M
M
CID Cname City OID ODate
PIDPname
Price
RatingSalesPerson
Qty

Analyze Sales DataDetailed Business Data
• Total sales:– by product:
• Qty*Price of each detail line• Sum (Qty*Price)• Detailed business data: qty*price
• Total quantity sold:– By product:
• Sum(Qty)• Detailed business data: Qty
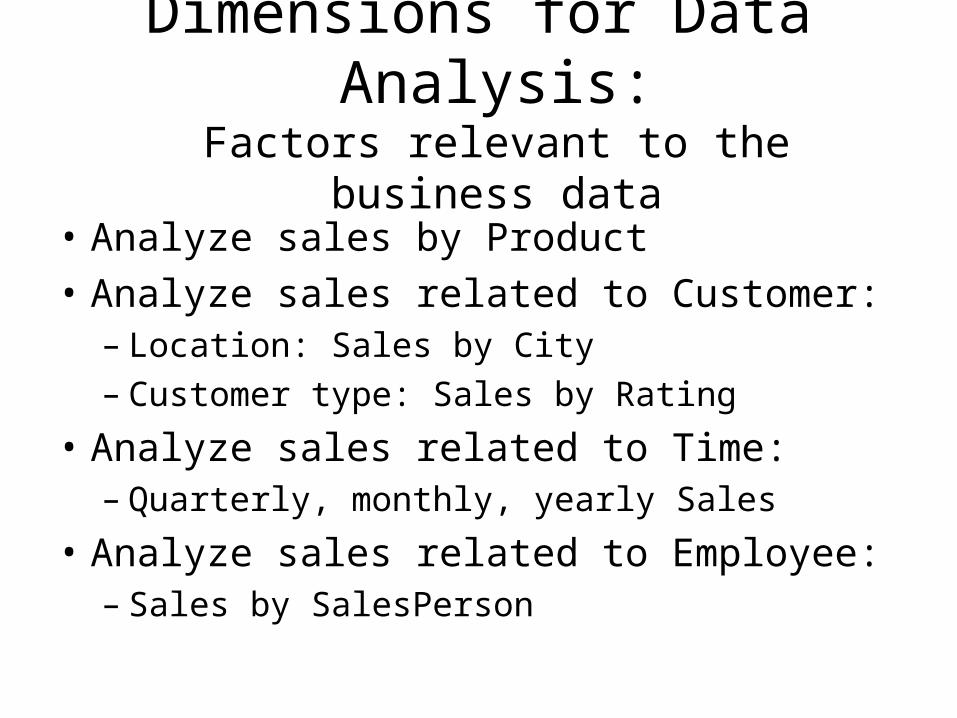
Dimensions for Data Analysis:Factors relevant to the business data
• Analyze sales by Product• Analyze sales related to Customer:
– Location: Sales by City– Customer type: Sales by Rating
• Analyze sales related to Time:– Quarterly, monthly, yearly Sales
• Analyze sales related to Employee:– Sales by SalesPerson
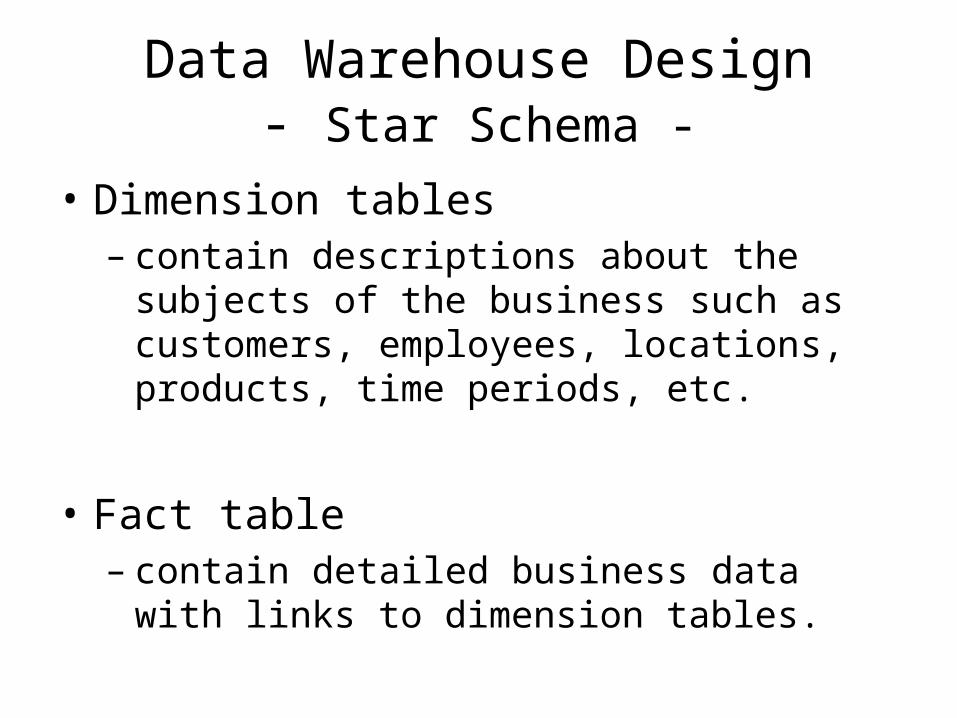
Data Warehouse Design- Star Schema -
• Dimension tables– contain descriptions about the subjects of the
business such as customers, employees, locations, products, time periods, etc.
• Fact table– contain detailed business data with links to
dimension tables.
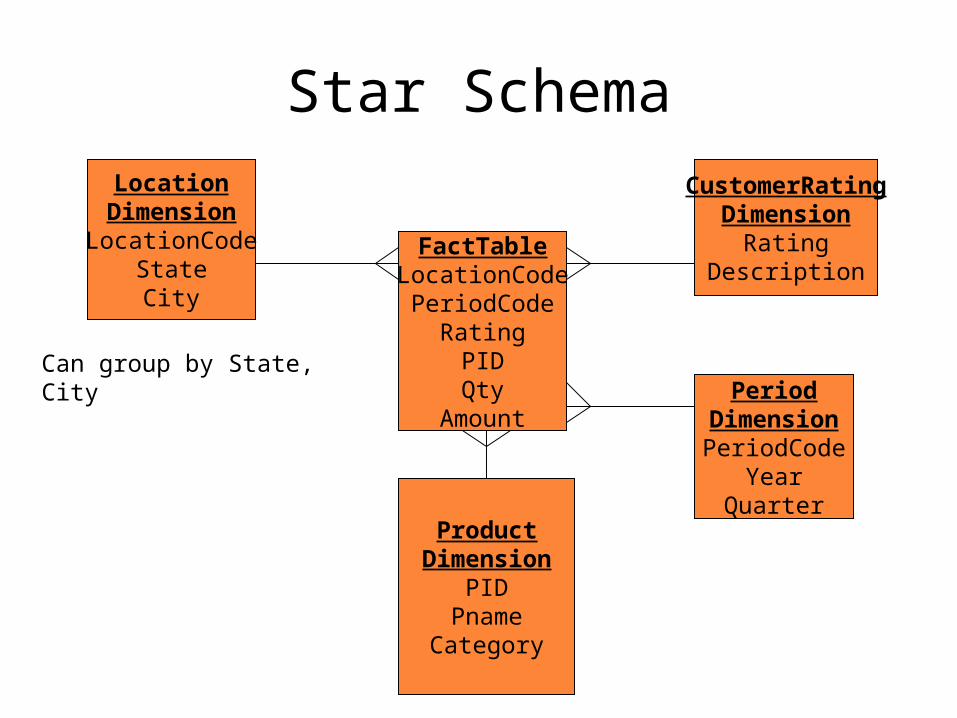
Star Schema
FactTableLocationCodePeriodCode
RatingPIDQty
Amount
LocationDimension
LocationCodeStateCity
CustomerRatingDimension
RatingDescription
ProductDimension
PIDPname
Category
PeriodDimensionPeriodCode
YearQuarter
Can group by State, City

Define Location Dimension
• Location:– In the transaction database: City– In the data warehouse we define Location to be
State, City• San Francisco -> California, San Francisco• Los Angeles -> California, Los Angeles
– Define Location Code: • California, San Francisco -> L1• California, Los Angeles -> L2

Define Period Dimension
• Period:– In the transaction database: Odate– In the data warehouse we define Period to be:
Year, Quarter• Odate: 11/2/2003 -> 2003, 4• Odate: 2/28/2003 -> 2003, 1
– Define Period Code:• 2003, 4 -> 20034• 2003, 1 -> 20031
The ETL Process
• Capture/Extract• Transform
– Scrub(data cleansing),derive– Example:
• City -> LocationCode, State, City• OrderDate -> PeriodCode, Year, Quarter
• Load and Index

From SalesDB to MyDataWarehouse
• Extract data from SalesDB:– Create query to get the fact data
• FactData– Download to MyDataWareHouse
• Transform:– Transform City to Location– Transform Odate to Period
• Query FactDataScrubing
• Load data to FactTable

Performing Analysis
• Analyze sales:– by Location– By Location and Customer Type– By Location and Period– By Period and Product
• Pivot Table:– Drill down, roll up, reaggregation

HR Database
• Historical data:– Job_History
A record in this table keep track the starting date and ending date of an employee working on a job at a department.

We may study:• Average days an employee stays in assigned
jobs.• Average days employees stay in a specific
job_id.• Any difference among departments in how
long employees stay in job.• Will the starting year affect how long
employees stay in job?• Basic measurement:
– DaysOnJob: End_Date – Start_Date

Star Schema
FactTableEmpliyee_IDSartedYear
Job_IDDepartment_ID
CityDayOnJob
CityDimension
CityCountry_Name
EmployeeDimensionEmpliyee_ID
FullNameEmail
Department Dimension
Department_IDDepartment_Name
StartYearDimensionStartedYear
CityDimension
CityCountry_Name

Define Dimensions• Employee dimension:
– Employee_ID, FullName, Email• FullName = First_name || ‘ ‘ || Last_Name
• Job dimension:– Job_ID, Job_Title
• City dimension:– City, Country_Name
• Join Locations and Countries
• Department dimension:– Department_ID, Department_Name
• StartYear dimension– StartedYear
• extract(year from start_date)

Create DWHR Using Access
• Each dimension is defined as a view in HR database.
• Communication between Access and Oracle is using ODBC.
• In Access, we can import Oracle’s view to create a table.

Create View to Retrieve Fact Data
FactData view is a join of Job_History, Departments and Locations.

Transform Fact Dataselect employee_id, extract(year from start_date) as StartedYear, Job_id,department_id,city, End_date-Start_date as DaysOnJob from factdata ;

Reference
• http://msdn.microsoft.com/en-us/library/aa902672(SQL.80).aspx#sql_dwdesign_tool