Embed Size (px)
Citation preview

Data Packet for 2017-18 Planning
Evaluation & Assessment
Office of Institutional Research
http://mydata.dallasisd.org
BRYAN ADAMS HIGH SCHOOLSchool Number 1 August 14, 2017
Notice regarding TELPAS: Counts were incorrectly reported in previous versions of 2017-18 data packets. Counts
were doubled when reported, but percentages were not affected.
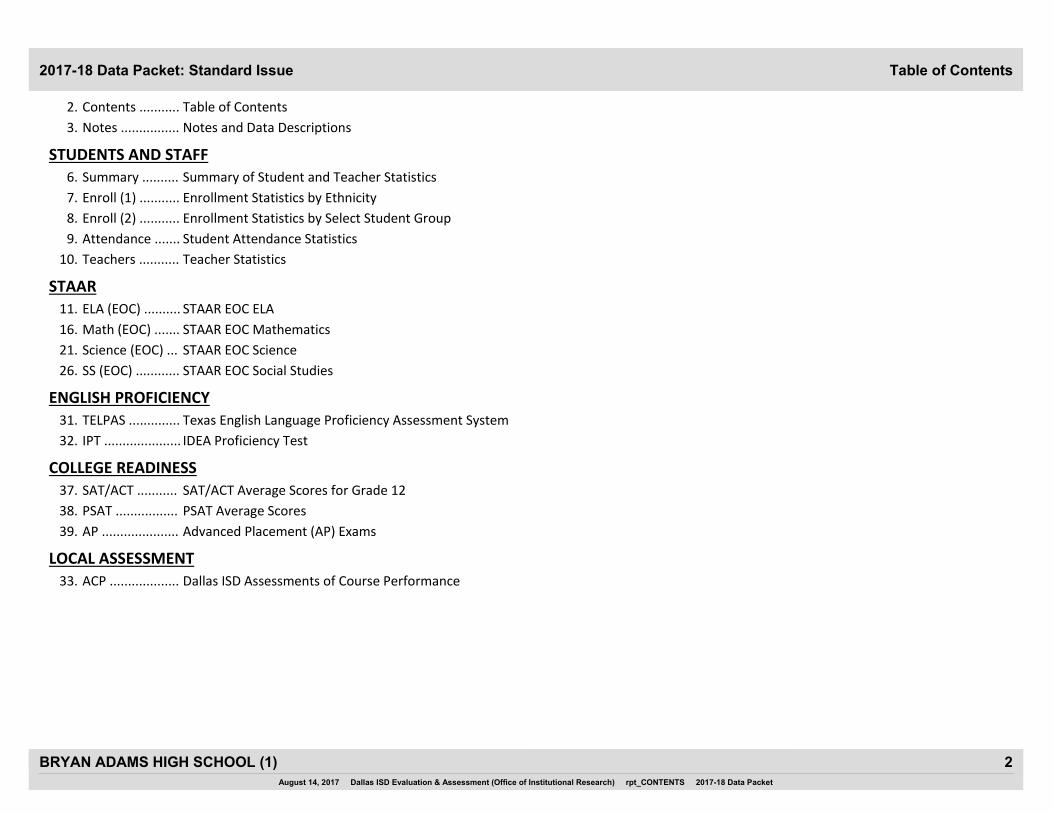
1 Table of Contents2017-18 Data Packet: Standard Issue
2. Contents ........... Table of Contents
3. Notes ................ Notes and Data Descriptions
STUDENTS AND STAFF
6. Summary .......... Summary of Student and Teacher Statistics
7. Enroll (1) ........... Enrollment Statistics by Ethnicity
8. Enroll (2) ........... Enrollment Statistics by Select Student Group
9. Attendance ....... Student Attendance Statistics
10. Teachers ........... Teacher Statistics
STAAR
11. ELA (EOC) .......... STAAR EOC ELA
16. Math (EOC) ....... STAAR EOC Mathematics
21. Science (EOC) ... STAAR EOC Science
26. SS (EOC) ............ STAAR EOC Social Studies
ENGLISH PROFICIENCY
31. TELPAS .............. Texas English Language Proficiency Assessment System
32. IPT ..................... IDEA Proficiency Test
COLLEGE READINESS
37. SAT/ACT ........... SAT/ACT Average Scores for Grade 12
38. PSAT ................. PSAT Average Scores
39. AP ..................... Advanced Placement (AP) Exams
LOCAL ASSESSMENT
33. ACP ................... Dallas ISD Assessments of Course Performance
August 14, 2017 Dallas ISD Evaluation & Assessment (Office of Institutional Research) rpt_CONTENTS 2017-18 Data Packet
2BRYAN ADAMS HIGH SCHOOL (1)
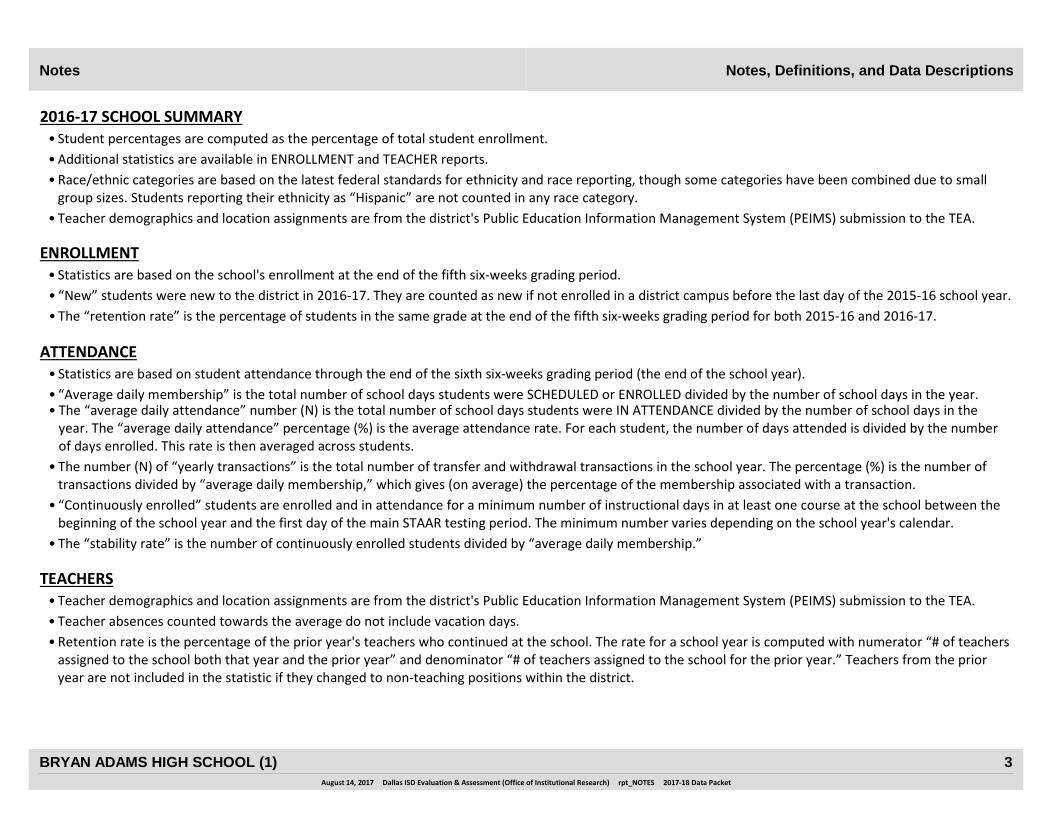
3Notes, Definitions, and Data DescriptionsNotes
Student percentages are computed as the percentage of total student enrollment.•
Additional statistics are available in ENROLLMENT and TEACHER reports.•
Teacher demographics and location assignments are from the district's Public Education Information Management System (PEIMS) submission to the TEA.•
2016-17 SCHOOL SUMMARY
Race/ethnic categories are based on the latest federal standards for ethnicity and race reporting, though some categories have been combined due to small
group sizes. Students reporting their ethnicity as “Hispanic” are not counted in any race category.
•
Statistics are based on the school's enrollment at the end of the fifth six-weeks grading period.•
The “retention rate” is the percentage of students in the same grade at the end of the fifth six-weeks grading period for both 2015-16 and 2016-17.•
“New” students were new to the district in 2016-17. They are counted as new if not enrolled in a district campus before the last day of the 2015-16 school year.•
ENROLLMENT
• Statistics are based on student attendance through the end of the sixth six-weeks grading period (the end of the school year).
• “Average daily membership” is the total number of school days students were SCHEDULED or ENROLLED divided by the number of school days in the year.• The “average daily attendance” number (N) is the total number of school days students were IN ATTENDANCE divided by the number of school days in the
year. The “average daily attendance” percentage (%) is the average attendance rate. For each student, the number of days attended is divided by the number
of days enrolled. This rate is then averaged across students.
• The number (N) of “yearly transactions” is the total number of transfer and withdrawal transactions in the school year. The percentage (%) is the number of
transactions divided by “average daily membership,” which gives (on average) the percentage of the membership associated with a transaction.
• “Continuously enrolled” students are enrolled and in attendance for a minimum number of instructional days in at least one course at the school between the
beginning of the school year and the first day of the main STAAR testing period. The minimum number varies depending on the school year's calendar.
• The “stability rate” is the number of continuously enrolled students divided by “average daily membership.”
ATTENDANCE
• Teacher demographics and location assignments are from the district's Public Education Information Management System (PEIMS) submission to the TEA.
TEACHERS
• Teacher absences counted towards the average do not include vacation days.
• Retention rate is the percentage of the prior year's teachers who continued at the school. The rate for a school year is computed with numerator “# of teachers
assigned to the school both that year and the prior year” and denominator “# of teachers assigned to the school for the prior year.” Teachers from the prior
year are not included in the statistic if they changed to non-teaching positions within the district.
August 14, 2017 Dallas ISD Evaluation & Assessment (Office of Institutional Research) rpt_NOTES 2017-18 Data Packet
3BRYAN ADAMS HIGH SCHOOL (1)

3Notes, Definitions, and Data DescriptionsNotes
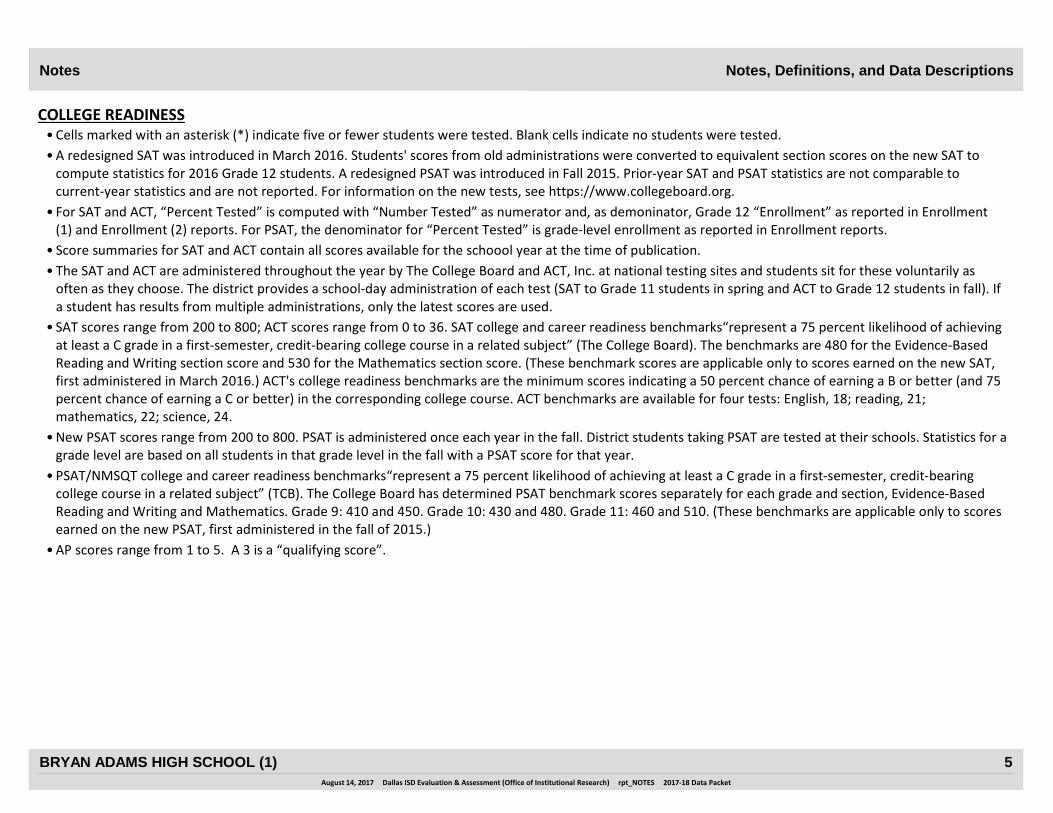
Cells marked with an asterisk (*) indicate five or fewer students were tested. Blank cells indicate no students were tested.•
•
•
•
Student group assignments are from the district's Public Education Information Management System (PEIMS) submission to the TEA.
Statistics by reporting category are averages for all students (across student groups and genders).
“Average percentage correct” is computed as follows: For each student, divide number of items correctly answered by total number of items in test section,
then average resulting percentages across all students. For short answers on EOC English tests, an “average rating” is presented; STAAR EOC short answers are
rated on a scale of 0 to 3. For written compositions on writing tests, “average score points” is presented. Additional details provided in report footnotes.
• EOC statistics are based on scores from students testing for the first time during fall or spring administrations.
• STAAR statistics for years prior to 2016-17 include results from all STAAR tests (STAAR, STAAR A, and STAAR L) for comparability to statistics beginning 2016-17,
when STAAR A and STAAR L were discontinued.
STATE OF TEXAS ASSESSMENT OF ACADEMIC READINESS (STAAR)
• Performance standard labels have changed. “Approached Grade Level” is comparable to Level 2: Satisfactory (2015-16 standard). “Met Grade Level” is
equivalent to Level 2: Satisfactory (final standard). “Mastered Grade Level” is equivalent to Level 3: Advanced. Statistics for a performance level (such as
“Percentage Approached Grade Level” ) include all scores at or above that level.
•
• If a student's composite rating did not increase at least one level from 2016 to 2017, the TEA did not report the 2016 composite rating.
Students are counted as having tested if any one of the four domains is rated. Because a TELPAS composite rating is not assigned to a student unless all four
domains are rated, the number of TELPAS composite ratings may be smaller than the number tested.
• If a student is rated as advanced high in 2017, the TEA does not differentiate between the advanced and advanced high levels from 2016.
TELPAS
•
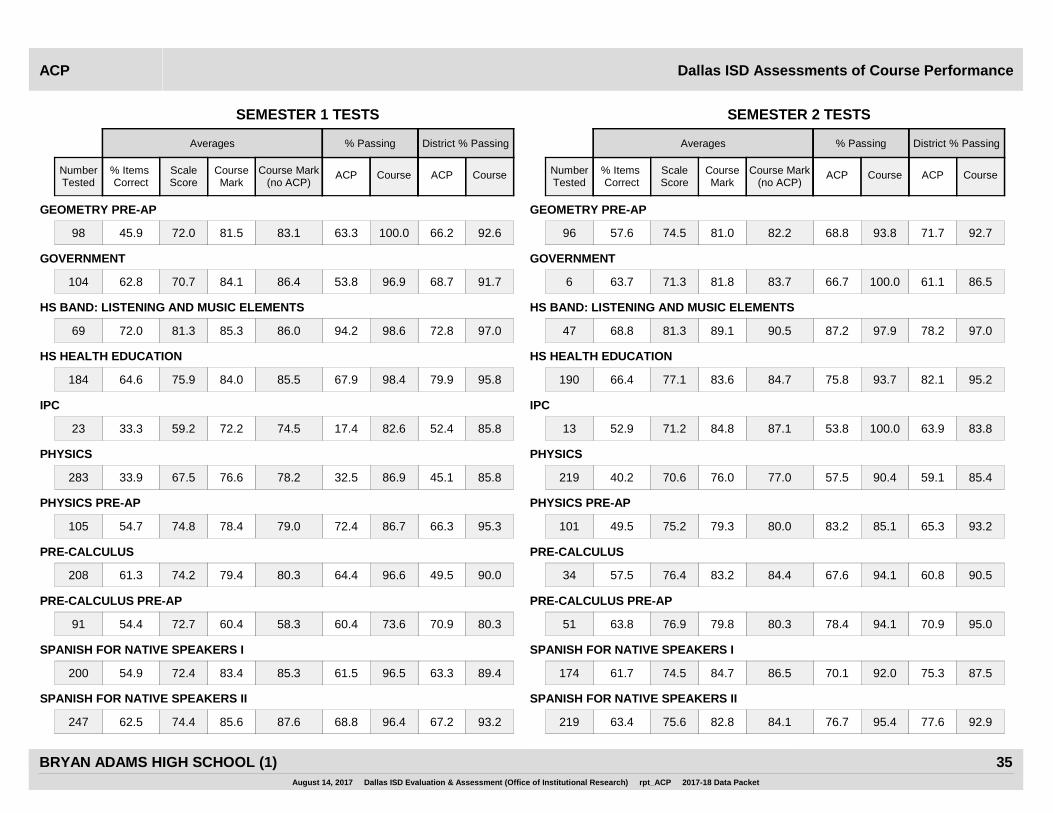
• Raw scores on the ACPs (percentage of items correct) are scaled each year to maintain similar annual passing rates for the district.
ACPs are semester exams administered in grades K-12. Not all courses have ACPs. In secondary grades, ACP scores account for a portion of students' semester
grades (10% at middle and 15% at high). “Average course mark (no ACP)” is computed from semester grades before factoring in ACP scores. In elementary
grades, ACP results account for 5% of students' semester grades for core courses; course-grade statistics are not reported in packets for elementary grades.
• A scale score of at least 70% is required to pass an ACP. For grade levels with numeric grading, a course mark of at least 70% is required to pass a course.
Cells marked with an asterisk (*) indicate five or fewer students were tested. Blank cells indicate no students were tested.•
DALLAS ISD ASSESSMENTS OF COURSE PERFORMANCE (ACP)
• Statistics are computed separately for Semester 1 and Semester 2 tests; time of administration during the school year is not relevant. Results from tests
written for different school years are not combined.
August 14, 2017 Dallas ISD Evaluation & Assessment (Office of Institutional Research) rpt_NOTES 2017-18 Data Packet
4BRYAN ADAMS HIGH SCHOOL (1)
3Notes, Definitions, and Data DescriptionsNotes
•
•
A redesigned SAT was introduced in March 2016. Students' scores from old administrations were converted to equivalent section scores on the new SAT to
compute statistics for 2016 Grade 12 students. A redesigned PSAT was introduced in Fall 2015. Prior-year SAT and PSAT statistics are not comparable to
current-year statistics and are not reported. For information on the new tests, see https://www.collegeboard.org.
For SAT and ACT, “Percent Tested” is computed with “Number Tested” as numerator and, as demoninator, Grade 12 “Enrollment” as reported in Enrollment
(1) and Enrollment (2) reports. For PSAT, the denominator for “Percent Tested” is grade-level enrollment as reported in Enrollment reports.
• SAT scores range from 200 to 800; ACT scores range from 0 to 36. SAT college and career readiness benchmarks“represent a 75 percent likelihood of achieving
at least a C grade in a first-semester, credit-bearing college course in a related subject” (The College Board). The benchmarks are 480 for the Evidence-Based
Reading and Writing section score and 530 for the Mathematics section score. (These benchmark scores are applicable only to scores earned on the new SAT,
first administered in March 2016.) ACT's college readiness benchmarks are the minimum scores indicating a 50 percent chance of earning a B or better (and 75
percent chance of earning a C or better) in the corresponding college course. ACT benchmarks are available for four tests: English, 18; reading, 21;
mathematics, 22; science, 24.
• New PSAT scores range from 200 to 800. PSAT is administered once each year in the fall. District students taking PSAT are tested at their schools. Statistics for a
grade level are based on all students in that grade level in the fall with a PSAT score for that year.
• AP scores range from 1 to 5. A 3 is a “qualifying score”.
Cells marked with an asterisk (*) indicate five or fewer students were tested. Blank cells indicate no students were tested.•
• Score summaries for SAT and ACT contain all scores available for the schoool year at the time of publication.
COLLEGE READINESS
• The SAT and ACT are administered throughout the year by The College Board and ACT, Inc. at national testing sites and students sit for these voluntarily as
often as they choose. The district provides a school-day administration of each test (SAT to Grade 11 students in spring and ACT to Grade 12 students in fall). If
a student has results from multiple administrations, only the latest scores are used.
• PSAT/NMSQT college and career readiness benchmarks“represent a 75 percent likelihood of achieving at least a C grade in a first-semester, credit-bearing
college course in a related subject” (TCB). The College Board has determined PSAT benchmark scores separately for each grade and section, Evidence-Based
Reading and Writing and Mathematics. Grade 9: 410 and 450. Grade 10: 430 and 480. Grade 11: 460 and 510. (These benchmarks are applicable only to scores
earned on the new PSAT, first administered in the fall of 2015.)
August 14, 2017 Dallas ISD Evaluation & Assessment (Office of Institutional Research) rpt_NOTES 2017-18 Data Packet
5BRYAN ADAMS HIGH SCHOOL (1)

Summary 2016-17 Group Summary Statistics
Grade
STUDENT ENROLLMENT
Enrollment
9 601
10 528
11 405
12 406
ALL 1,940
STUDENT AND TEACHER RACE/ETHNICITY
Students
Number Percent Number PercentEthnicity/Race
Black/African American
American Indian/Alaska Native
Asian/Hawaiian/Pacific Islander
Hispanic
White
Multiple
242 12.5
6 0.3
48 2.5
1,538 79.3
96 4.9
30 22.4
30 22.4
63 47.0
6 4.5
* *
* *
10 0.5
SELECT STUDENT GROUP ENROLLMENT
Number PercentGroup
Economically disadvantaged
Limited English proficient (LEP)
Special education
1,723 88.8
646 33.3
189 9.7
*For teachers, “Other” category includes American Indican/Alaska Native and Asian/Hawaiian/Pacific Islander.
Not reported (students only) — —0 0.0
Other* (teachers only) 5 3.7— —
Talented and Gifted (TAG) 187 9.6
At-Risk 1,273 65.6
Teachers
August 14, 2017 Dallas ISD Evaluation & Assessment (Office of Institutional Research) rpt_SUMMARY 2017-18 Data Packet
6BRYAN ADAMS HIGH SCHOOL (1)

N %
Asian
%NN %%
Hispanic
N N %Grade Year
African American American Indian
Enrollment
White
Enrollment Statistics by Race/EthnicityEnroll (1)
N %
Multiple category
2017
2015
2016
3.1
3.2
1.0
19
19
6
0.5
0.5
0.0
3
3
0
75.5
75.2
81.4
459
443
489
16.8
14.8
12.1
102
87
73
4.1
6.1
4.8
25
36
29
9
601
589
608 0.0
0.2
0.7
0
1
4
2017
2015
2016
1.9
3.9
3.4
9
18
18
0.4
0.6
0.4
2
3
2
79.3
76.4
76.3
375
356
403
13.1
14.6
14.4
62
68
76
4.9
4.1
5.3
23
19
28
10
528
466
473 0.4
0.4
0.2
2
2
1
2017
2015
2016
2.8
2.0
4.2
11
8
17
0.8
0.2
0.7
3
1
3
79.4
80.8
77.8
312
328
315
12.0
10.8
12.6
47
44
51
4.3
5.4
4.4
17
22
18
11
405
406
393 0.5
0.7
0.2
2
3
1
2017
2015
2016
1.8
2.8
1.7
7
11
7
0.3
0.5
0.2
1
2
1
75.4
79.5
81.5
294
314
331
17.7
11.1
10.3
69
44
42
4.9
5.6
5.2
19
22
21
12
406
395
390 0.0
0.3
1.0
0
1
4
2017
2015
2016
2.5
3.0
2.5
46
56
48
0.5
0.5
0.3
9
9
6
77.3
77.6
79.3
1,440
1,441
1,538
15.0
13.1
12.5
280
243
242
4.5
5.3
4.9
84
99
96
9-12
1,940
1,856
1,864 0.2
0.4
0.5
4
7
10
August 14, 2017 Dallas ISD Evaluation & Assessment (Office of Institutional Research) rpt_ENROLL_ETH 2017-18 Data Packet
7BRYAN ADAMS HIGH SCHOOL (1)

N %
At RIsk New (to District)
N %
TAG
N %
Economically Disadvantaged
Grade Year
LEP Special Education
N % N % N %
Retention Rate (%)
Enrollment
Enrollment Statistics by Select Student GroupEnroll (2)
Gender
% Male % Female
76.5
77.2
76.2
465
455
458
13.0
17.3
16.5
9
2017 601
589
608 87.0
88.8
89.7
529
523
539
36.3
44.3
47.4
221
261
285
10.5
10.0
9.0
64
59
54
7.9
8.1
8.5
48
48
51
7.9
5.1
2.5
2015
2016
79
102
99
56.7
54.5
53.1
43.3
45.5
46.9
67.0
68.7
71.4
317
320
377
7.8
5.8
8.3
10
2017 528
466
473 86.5
89.7
87.3
409
418
461
24.1
33.3
34.5
114
155
182
9.3
9.9
10.8
44
46
57
10.6
9.7
9.7
50
45
51
4.2
1.5
3.6
2015
2016
37
27
44
51.4
55.8
56.1
48.6
44.2
43.9
75.8
55.2
61.0
298
224
247
5.3
5.7
5.9
11
2017 405
406
393 89.8
88.7
90.1
353
360
365
26.0
22.4
23.7
102
91
96
9.9
7.4
9.4
39
30
38
6.9
13.1
8.9
27
53
36
1.0
0.0
0.2
2015
2016
21
23
24
51.9
51.5
54.6
48.1
48.5
45.4
75.1
61.3
47.0
293
242
191
2.8
2.5
3.0
12
2017 406
395
390 85.9
89.4
88.2
335
353
358
19.7
27.3
20.4
77
108
83
11.0
13.4
9.9
43
53
40
7.7
5.8
12.1
30
23
49
3.1
5.1
2.0
2015
2016
11
10
12
47.4
52.2
51.2
52.6
47.8
48.8
73.7
66.9
65.6
1,373
1,241
1,273
7.9
8.7
9.2
9-12
2017 1,940
1,856
1,864 87.2
89.1
88.8
1,626
1,654
1,723
27.6
33.1
33.3
514
615
646
10.2
10.1
9.7
190
188
189
8.3
9.1
9.6
155
169
187
4.5
3.1
2.2
2015
2016
148
162
179
52.4
53.7
53.8
47.6
46.3
46.2
August 14, 2017 Dallas ISD Evaluation & Assessment (Office of Institutional Research) rpt_ENROLL_OTH 2017-18 Data Packet
8BRYAN ADAMS HIGH SCHOOL (1)

Stability Rate
%
ContinuouslyEnrolled
N DistrictNN
Average DailyMembership
Average Daily Attendance Yearly Transactions
Grade Year N %District District N District % % District % District
Student Attendance StatisticsAttendance
86.8
90.3
85.0
538
557
514
9,789
9,766
9,913
132
138
1249
2015 94.7587 21.3 24.5
2016
2017 95.9592 22.4 25.7
95.2576 20.5 26.2
11,577
11,759
11,813
94.3
93.0
93.6
10,921
10,936
11,053
84.6
83.1
83.9
620
617
605
89.2
91.0
89.5
442
488
434
8,616
9,045
8,845
49
85
4510
2015 95.1471 9.9 18.1
2016
2017 95.4512 15.9 16.3
95.4463 9.3 19.4
9,928
10,329
10,202
94.5
94.0
94.1
9,383
9,713
9,595
86.8
87.6
86.7
495
536
485
87.9
91.6
93.2
355
384
388
7,728
7,756
7,400
42
41
4211
2015 94.6382 10.4 14.6
2016
2017 94.8397 9.8 13.7
96.2400 10.1 16.9
8,742
8,543
8,384
94.5
94.7
94.3
8,258
8,088
7,906
88.4
90.8
88.3
404
419
416
90.2
95.2
93.9
356
386
367
7,395
7,365
7,523
28
10
512
2015 94.5373 7.1 14.2
2016
2017 95.9389 2.5 6.4
96.1375 1.3 10.2
8,362
8,197
8,426
94.4
94.7
94.5
7,893
7,762
7,965
88.4
89.8
89.3
395
406
391
88.3
91.8
89.8
1,691
1,815
1,703
33,528
33,932
33,681
251
274
2169-12
2015 94.71,813 13.1 18.4
2016
2017 95.51,890 13.9 16.5
95.71,814 11.4 18.9
38,609
38,829
38,826
94.4
94.0
94.1
36,456
36,498
36,519
86.8
87.4
86.7
1,914
1,978
1,897
August 14, 2017 Dallas ISD Evaluation & Assessment (Office of Institutional Research) rpt_ATTENDANCE 2017-18 Data Packet
9BRYAN ADAMS HIGH SCHOOL (1)

Teacher StatisticsTeachers
14.9
Percentage
20Beginning (0)
471 - 5
256 - 10
2911 - 20
13More than 20
Years Number
75.0
59.7
62.6
6
47.864
52.270
4.5
22.430
22.430
47.063White
African American
Hispanic
Multiple
Male
Female
5.3
6.6
Number PercentageEthnicity/Race
DISTRIBUTIONS YEARS EXPERIENCE
Teachers: 134
5.8
Average Absences
RetentionRate
35.1
18.7
21.6
9.7
2014-15
2015-16
2016-17
Number PercentageGender
9.7131
12.7172
7.5103
29.9401-3
4.564
0.715
74More than 3 55.2
5 3.7Other
ATTENDANCE / RETENTION
August 14, 2017 Dallas ISD Evaluation & Assessment (Office of Institutional Research) rpt_TEACHER 2017-18 Data Packet
10BRYAN ADAMS HIGH SCHOOL (1)

PERCENTAGE APPROACHED GRADE LEVEL STANDARD
FemaleMigrant MaleAt RiskWhiteAfricanAmer
HispanicEcon
DisadvSpecialEduc
LEP All DistrictYearTest
State of Texas Assessment of Academic Readiness End-Of-Course: ELAEOC ELA (1)
54.1 67.6
50.8 58.0
47.2 66.0
58.72017 66.7 49.3 61.9 64.2 13.3 42.5 60.450.3
ENGLISH I
56.82015 60.9 48.9 55.3 55.8 7.1 32.9 54.042.7
57.62016 77.4 48.3 56.5 58.5 8.7 34.7 55.745.0
318 275
307 250
305 253
11,0922017 27 48371 478 45 287 593449
11,2412015 23 42390 448 42 210 557415
10,7712016 31 41889 436 46 248 558433Tests Taken
48.7 65.8
55.7 60.8
* 51.1 65.6
60.32017 84.6 50.0 55.8 57.0 17.0 25.8 56.641.8
ENGLISH II
58.42015 72.0 51.6 59.2 57.2 8.5 20.0 58.242.6
57.82016 66.7 52.2 59.1 57.7 9.1 30.8 57.543.7
277 234
262 250
1 266 209
9,8222017 26 39474 419 47 178 511364
9,5832015 25 41262 409 47 135 512359
9,5502016 18 36469 395 33 159 475327Tests Taken
August 14, 2017 Dallas ISD Evaluation & Assessment (Office of Institutional Research) rpt_STAAREOC_read_per_app 2017-18 Data Packet
11BRYAN ADAMS HIGH SCHOOL (1)

FemaleMigrant MaleAt RiskWhiteAfricanAmer
HispanicEcon
DisadvSpecialEduc
LEP All DistrictYearTest
State of Texas Assessment of Academic Readiness End-Of-Course: ELA
NUMBER NOT APPROACHED GRADE LEVEL STANDARD
EOC ELA (2)
146 89
151 105
161 86
4,5772017 9 36 184 171 39 165 235223
ENGLISH I
4,8512015 9 46 189 198 39 141 256238
4,5692016 7 46 182 181 42 162 247238
318 275
307 250
305 253
11,0922017 27 48371 478 45 287 593449
11,2412015 23 42390 448 42 210 557415
10,7712016 31 41889 436 46 248 558433Tests Taken
142 80
116 98
* 130 72
3,8952017 4 37 174 180 39 132 222212
ENGLISH II
3,9862015 7 30 168 175 43 108 214206
4,0282016 6 33 149 167 30 110 202184
277 234
262 250
1 266 209
9,8222017 26 39474 419 47 178 511364
9,5832015 25 41262 409 47 135 512359
9,5502016 18 36469 395 33 159 475327Tests Taken
August 14, 2017 Dallas ISD Evaluation & Assessment (Office of Institutional Research) rpt_STAAREOC_read_num_not_app 2017-18 Data Packet
12BRYAN ADAMS HIGH SCHOOL (1)

PERCENTAGE MET GRADE LEVEL STANDARD
FemaleMigrant MaleAt RiskWhiteAfricanAmer
HispanicEcon
DisadvSpecialEduc
LEP All DistrictYearTest
State of Texas Assessment of Academic Readiness End-Of-Course: ELAEOC ELA (3)
36.8 46.5
29.0 38.0
28.5 47.8
41.22017 66.7 29.6 41.6 42.9 4.4 21.6 41.326.9
ENGLISH I
35.32015 47.8 32.2 32.6 34.6 2.4 15.2 33.019.3
38.32016 67.7 31.5 36.4 38.5 6.5 14.1 37.325.2
318 275
307 250
305 253
11,0922017 27 48371 478 45 287 593449
11,2412015 23 42390 448 42 210 557415
10,7712016 31 41889 436 46 248 558433Tests Taken
32.1 41.5
31.7 35.6
* 29.7 40.7
42.12017 65.4 28.4 35.8 36.5 8.5 11.2 36.420.1
ENGLISH II
35.22015 60.0 22.6 33.7 31.3 4.3 6.7 33.617.3
36.92016 61.1 30.4 34.1 34.2 0.0 14.5 34.518.3
277 234
262 250
1 266 209
9,8222017 26 39474 419 47 178 511364
9,5832015 25 41262 409 47 135 512359
9,5502016 18 36469 395 33 159 475327Tests Taken
August 14, 2017 Dallas ISD Evaluation & Assessment (Office of Institutional Research) rpt_STAAREOC_read_per_met 2017-18 Data Packet
13BRYAN ADAMS HIGH SCHOOL (1)
FemaleMigrant MaleAt RiskWhiteAfricanAmer
HispanicEcon
DisadvSpecialEduc
LEP All DistrictYearTest
State of Texas Assessment of Academic Readiness End-Of-Course: ELA
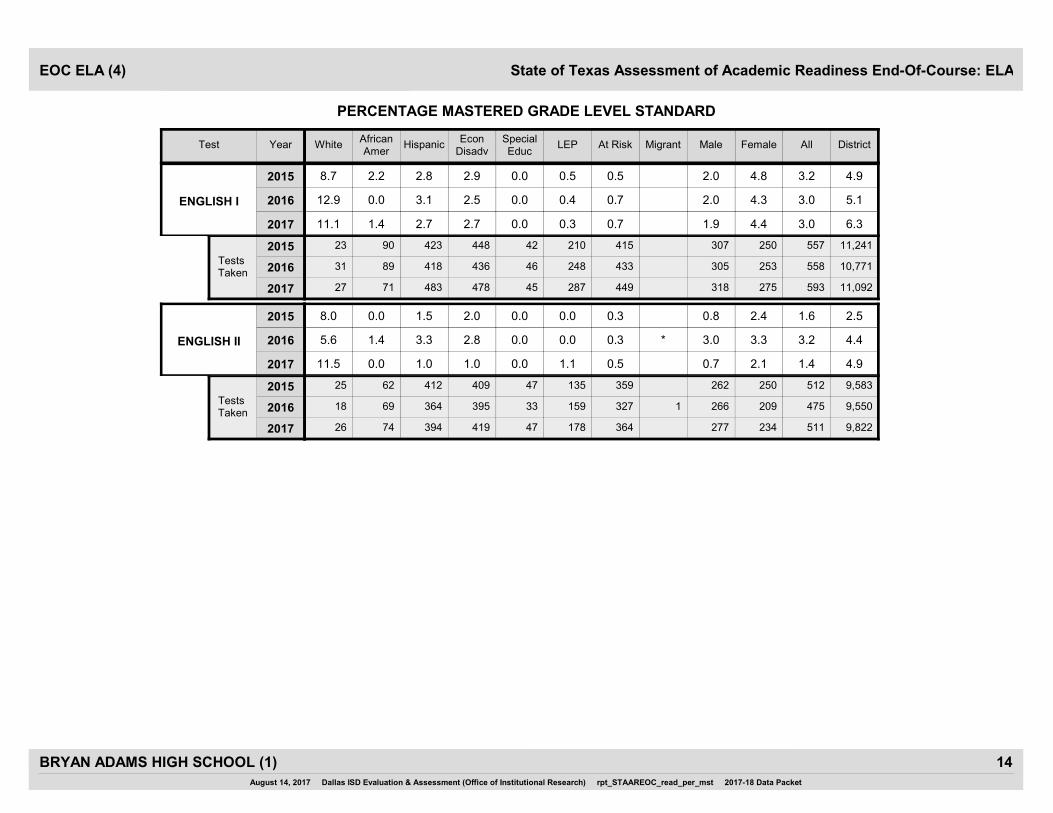
PERCENTAGE MASTERED GRADE LEVEL STANDARD
EOC ELA (4)
1.9 4.4
2.0 4.8
2.0 4.3
6.32017 11.1 1.4 2.7 2.7 0.0 0.3 3.00.7
ENGLISH I
4.92015 8.7 2.2 2.8 2.9 0.0 0.5 3.20.5
5.12016 12.9 0.0 3.1 2.5 0.0 0.4 3.00.7
318 275
307 250
305 253
11,0922017 27 48371 478 45 287 593449
11,2412015 23 42390 448 42 210 557415
10,7712016 31 41889 436 46 248 558433Tests Taken
0.7 2.1
0.8 2.4
* 3.0 3.3
4.92017 11.5 0.0 1.0 1.0 0.0 1.1 1.40.5
ENGLISH II
2.52015 8.0 0.0 1.5 2.0 0.0 0.0 1.60.3
4.42016 5.6 1.4 3.3 2.8 0.0 0.0 3.20.3
277 234
262 250
1 266 209
9,8222017 26 39474 419 47 178 511364
9,5832015 25 41262 409 47 135 512359
9,5502016 18 36469 395 33 159 475327Tests Taken
August 14, 2017 Dallas ISD Evaluation & Assessment (Office of Institutional Research) rpt_STAAREOC_read_per_mst 2017-18 Data Packet
14BRYAN ADAMS HIGH SCHOOL (1)
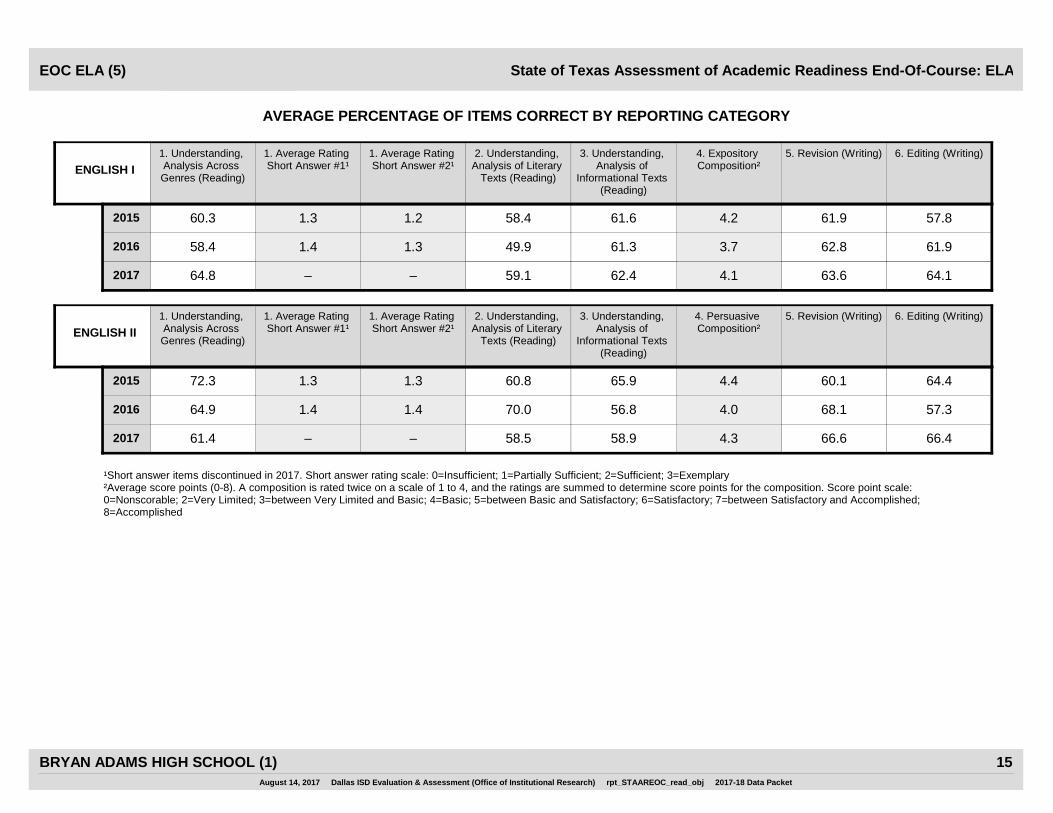
State of Texas Assessment of Academic Readiness End-Of-Course: ELA
AVERAGE PERCENTAGE OF ITEMS CORRECT BY REPORTING CATEGORY
EOC ELA (5)
2017 64.8 – – 59.1 62.4
2015 60.3 1.3 1.2 58.4 61.6
2016 58.4 1.4 1.3 49.9 61.3
1. Understanding, Analysis Across Genres (Reading)
1. Average Rating Short Answer #1¹
1. Average Rating Short Answer #2¹
2. Understanding, Analysis of Literary
Texts (Reading)
3. Understanding, Analysis of
Informational Texts (Reading)
ENGLISH I
4.1 63.6 64.1
4.2 61.9 57.8
3.7 62.8 61.9
4. Expository Composition²
5. Revision (Writing) 6. Editing (Writing)
2017 61.4 – – 58.5 58.9
2015 72.3 1.3 1.3 60.8 65.9
2016 64.9 1.4 1.4 70.0 56.8
1. Understanding, Analysis Across Genres (Reading)
1. Average Rating Short Answer #1¹
1. Average Rating Short Answer #2¹
2. Understanding, Analysis of Literary
Texts (Reading)
3. Understanding, Analysis of
Informational Texts (Reading)
ENGLISH II
4.3 66.6 66.4
4.4 60.1 64.4
4.0 68.1 57.3
4. Persuasive Composition²
5. Revision (Writing) 6. Editing (Writing)
¹Short answer items discontinued in 2017. Short answer rating scale: 0=Insufficient; 1=Partially Sufficient; 2=Sufficient; 3=Exemplary²Average score points (0-8). A composition is rated twice on a scale of 1 to 4, and the ratings are summed to determine score points for the composition. Score point scale: 0=Nonscorable; 2=Very Limited; 3=between Very Limited and Basic; 4=Basic; 5=between Basic and Satisfactory; 6=Satisfactory; 7=between Satisfactory and Accomplished; 8=Accomplished
August 14, 2017 Dallas ISD Evaluation & Assessment (Office of Institutional Research) rpt_STAAREOC_read_obj 2017-18 Data Packet
15BRYAN ADAMS HIGH SCHOOL (1)
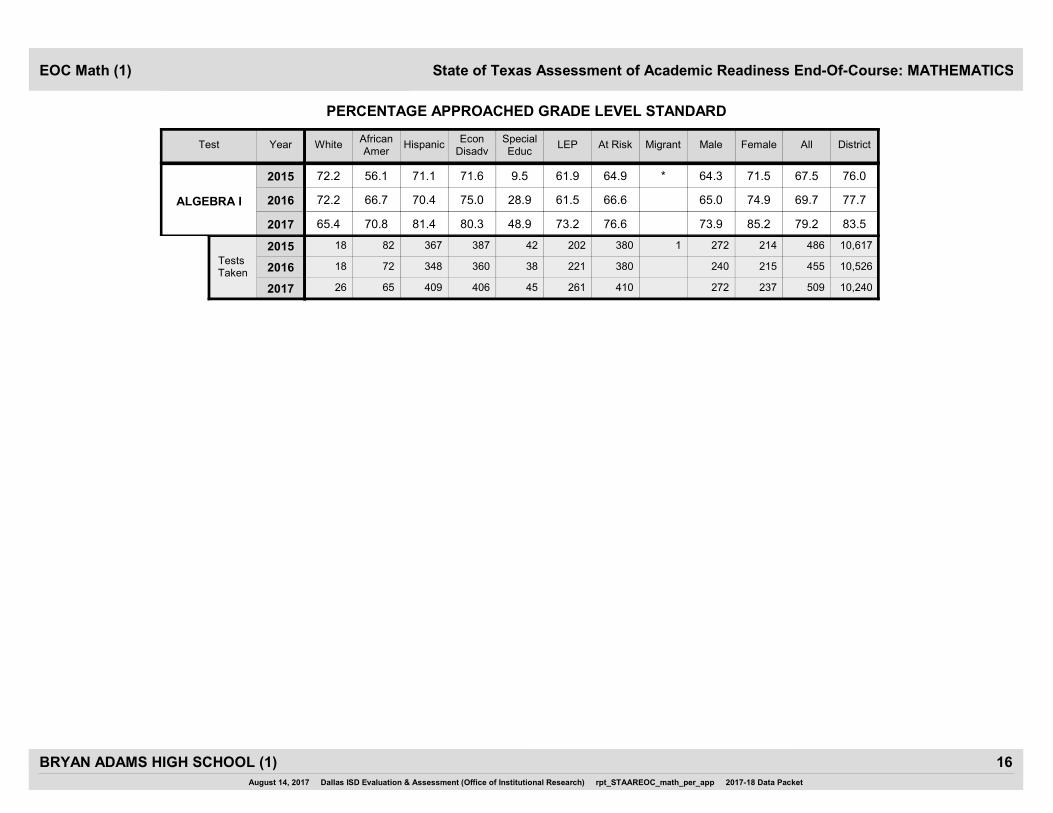
PERCENTAGE APPROACHED GRADE LEVEL STANDARD
FemaleMigrant MaleAt RiskWhiteAfricanAmer
HispanicEcon
DisadvSpecialEduc
LEP All DistrictYearTest
State of Texas Assessment of Academic Readiness End-Of-Course: MATHEMATICSEOC Math (1)
73.9 85.2
* 64.3 71.5
65.0 74.9
83.52017 65.4 70.8 81.4 80.3 48.9 73.2 79.276.6
ALGEBRA I
76.02015 72.2 56.1 71.1 71.6 9.5 61.9 67.564.9
77.72016 72.2 66.7 70.4 75.0 28.9 61.5 69.766.6
272 237
1 272 214
240 215
10,2402017 26 40965 406 45 261 509410
10,6172015 18 36782 387 42 202 486380
10,5262016 18 34872 360 38 221 455380Tests Taken
August 14, 2017 Dallas ISD Evaluation & Assessment (Office of Institutional Research) rpt_STAAREOC_math_per_app 2017-18 Data Packet
16BRYAN ADAMS HIGH SCHOOL (1)

NUMBER NOT APPROACHED GRADE LEVEL STANDARD
FemaleMigrant MaleAt RiskWhiteAfricanAmer
HispanicEcon
DisadvSpecialEduc
LEP All DistrictYearTest
State of Texas Assessment of Academic Readiness End-Of-Course: MATHEMATICSEOC Math (2)
71 35
* 97 61
84 54
1,6922017 9 19 76 80 23 70 10696
ALGEBRA I
2,5462015 5 36 106 110 38 77 158137
2,3452016 5 24 103 90 27 85 138127
272 237
1 272 214
240 215
10,2402017 26 40965 406 45 261 509410
10,6172015 18 36782 387 42 202 486380
10,5262016 18 34872 360 38 221 455380Tests Taken
August 14, 2017 Dallas ISD Evaluation & Assessment (Office of Institutional Research) rpt_STAAREOC_math_num_not_app 2017-18 Data Packet
17BRYAN ADAMS HIGH SCHOOL (1)

PERCENTAGE MET GRADE LEVEL STANDARD
FemaleMigrant MaleAt RiskWhiteAfricanAmer
HispanicEcon
DisadvSpecialEduc
LEP All DistrictYearTest
State of Texas Assessment of Academic Readiness End-Of-Course: MATHEMATICSEOC Math (3)
26.8 41.4
* 17.3 17.3
20.4 29.8
47.92017 30.8 24.6 35.5 34.2 4.4 25.7 33.627.8
ALGEBRA I
33.82015 11.1 12.2 19.1 17.8 0.0 11.4 17.312.6
43.02016 27.8 12.5 26.7 26.4 5.3 19.5 24.819.2
272 237
1 272 214
240 215
10,2402017 26 40965 406 45 261 509410
10,6172015 18 36782 387 42 202 486390
10,5262016 18 34872 360 38 221 455380Tests Taken
August 14, 2017 Dallas ISD Evaluation & Assessment (Office of Institutional Research) rpt_STAAREOC_math_per_met 2017-18 Data Packet
18BRYAN ADAMS HIGH SCHOOL (1)

FemaleMigrant MaleAt RiskWhiteAfricanAmer
HispanicEcon
DisadvSpecialEduc
LEP All DistrictYearTest
State of Texas Assessment of Academic Readiness End-Of-Course: MATHEMATICS
PERCENTAGE MASTERED GRADE LEVEL STANDARD
EOC Math (4)
7.4 11.8
* 2.6 4.2
6.7 6.5
23.12017 11.5 3.1 10.3 9.9 2.2 5.7 9.45.9
ALGEBRA I
14.22015 0.0 2.4 3.8 3.6 0.0 3.0 3.32.1
19.72016 0.0 4.2 6.6 7.2 0.0 5.0 6.64.5
272 237
1 272 214
240 215
10,2402017 26 40965 406 45 261 509410
10,6172015 18 36782 387 42 202 486390
10,5262016 18 34872 360 38 221 455380Tests Taken
August 14, 2017 Dallas ISD Evaluation & Assessment (Office of Institutional Research) rpt_STAAREOC_math_per_mst 2017-18 Data Packet
19BRYAN ADAMS HIGH SCHOOL (1)

AVERAGE PERCENTAGE OF ITEMS CORRECT BY REPORTING CATEGORY
State of Texas Assessment of Academic Readiness End-Of-Course: MATHEMATICSEOC Math (5)
2017 48.9 51.4 56.5 56.3 57.9
2015 46.7 51.4 44.6 41.9 39.9
2016 45.1 52.1 44.4 56.5 53.0
1. Number and Algebraic Methods
2. Describing and Graphing Linear
Functions, Equations, and Inequalities
3. Writing and Solving Linear
Functions, Equations, and Inequalities
4. Quadratic Functions and
Equations
5. Exponential Functions and
EquationsALGEBRA I
August 14, 2017 Dallas ISD Evaluation & Assessment (Office of Institutional Research) rpt_STAAREOC_math_obj 2017-18 Data Packet
20BRYAN ADAMS HIGH SCHOOL (1)

FemaleMigrant MaleAt RiskWhiteAfricanAmer
HispanicEcon
DisadvSpecialEduc
LEP All DistrictYearTest
State of Texas Assessment of Academic Readiness End-Of-Course: SCIENCE
PERCENTAGE APPROACHED GRADE LEVEL STANDARD
EOC Science (1)
89.8 90.7
89.1 92.6
81.0 90.1
86.42017 81.5 80.0 92.0 91.8 52.1 89.7 90.288.0
BIOLOGY
87.62015 84.2 87.2 92.3 91.4 50.0 86.7 90.788.1
84.92016 90.3 86.6 85.7 88.1 41.5 74.8 85.282.0
303 268
294 231
290 242
9,6222017 27 46565 476 48 262 571426
10,2272015 19 40286 443 44 188 525388
9,6802016 31 39882 429 41 226 532405Tests Taken
August 14, 2017 Dallas ISD Evaluation & Assessment (Office of Institutional Research) rpt_STAAREOC_sc_per_app 2017-18 Data Packet
21BRYAN ADAMS HIGH SCHOOL (1)

FemaleMigrant MaleAt RiskWhiteAfricanAmer
HispanicEcon
DisadvSpecialEduc
LEP All DistrictYearTest
State of Texas Assessment of Academic Readiness End-Of-Course: SCIENCE
NUMBER NOT APPROACHED GRADE LEVEL STANDARD
EOC Science (2)
31 25
32 17
55 24
1,3102017 5 13 37 39 23 27 5651
BIOLOGY
1,2702015 3 11 31 38 22 25 4946
1,4662016 3 11 57 51 24 57 7973
303 268
294 231
290 242
9,6222017 27 46565 476 48 262 571426
10,2272015 19 40286 443 44 188 525388
9,6802016 31 39882 429 41 226 532405Tests Taken
August 14, 2017 Dallas ISD Evaluation & Assessment (Office of Institutional Research) rpt_STAAREOC_sc_num_not_app 2017-18 Data Packet
22BRYAN ADAMS HIGH SCHOOL (1)

FemaleMigrant MaleAt RiskWhiteAfricanAmer
HispanicEcon
DisadvSpecialEduc
LEP All DistrictYearTest
State of Texas Assessment of Academic Readiness End-Of-Course: SCIENCE
PERCENTAGE MET GRADE LEVEL STANDARD
EOC Science (3)
51.5 60.1
48.3 50.2
48.3 55.8
54.02017 70.4 53.8 55.1 55.5 8.3 39.7 55.544.1
BIOLOGY
46.12015 57.9 44.2 50.5 48.8 4.5 33.5 49.136.6
50.62016 74.2 51.2 50.5 50.8 7.3 31.4 51.740.2
303 268
294 231
290 242
9,6222017 27 46565 476 48 262 571426
10,2272015 19 40286 443 44 188 525388
9,6802016 31 39882 429 41 226 532405Tests Taken
August 14, 2017 Dallas ISD Evaluation & Assessment (Office of Institutional Research) rpt_STAAREOC_sc_per_met 2017-18 Data Packet
23BRYAN ADAMS HIGH SCHOOL (1)

FemaleMigrant MaleAt RiskWhiteAfricanAmer
HispanicEcon
DisadvSpecialEduc
LEP All DistrictYearTest
State of Texas Assessment of Academic Readiness End-Of-Course: SCIENCE
PERCENTAGE MASTERED GRADE LEVEL STANDARD
EOC Science (4)
13.2 17.2
9.9 13.0
13.4 10.7
15.12017 18.5 9.2 15.5 15.3 0.0 8.0 15.16.6
BIOLOGY
10.92015 31.6 7.0 11.2 9.9 0.0 6.4 11.24.9
13.22016 38.7 6.1 11.6 9.8 2.4 4.0 12.24.9
303 268
294 231
290 242
9,6222017 27 46565 476 48 262 571426
10,2272015 19 40286 443 44 188 525388
9,6802016 31 39882 429 41 226 532405Tests Taken
August 14, 2017 Dallas ISD Evaluation & Assessment (Office of Institutional Research) rpt_STAAREOC_sc_per_mst 2017-18 Data Packet
24BRYAN ADAMS HIGH SCHOOL (1)

AVERAGE PERCENTAGE OF ITEMS CORRECT BY REPORTING CATEGORY
State of Texas Assessment of Academic Readiness End-Of-Course: SCIENCEEOC Science (5)
2017 61.1 65.2 60.0 58.3 67.3
2015 57.2 62.8 58.2 53.7 63.4
2016 59.5 59.0 60.5 55.2 63.8
1. Cell Structure and Function
2. Mechanisms of Genetics
3. Biological Evolution and Classif ication
4. Biological Processes and
Systems
5. Interdependence w ithin Environmental
SystemsBIOLOGY
August 14, 2017 Dallas ISD Evaluation & Assessment (Office of Institutional Research) rpt_STAAREOC_sc_obj 2017-18 Data Packet
25BRYAN ADAMS HIGH SCHOOL (1)

FemaleMigrant MaleAt RiskWhiteAfricanAmer
HispanicEcon
DisadvSpecialEduc
LEP All DistrictYearTest
PERCENTAGE APPROACHED GRADE LEVEL STANDARD
EOC SS (1) State of Texas Assessment of Academic Readiness End-Of-Course: SOCIAL STUDIES
94.3 94.5
94.2 87.6
90.2 92.4
92.82017 88.9 89.6 96.3 94.6 74.2 84.3 94.491.5
U.S. HISTORY
89.52015 93.3 81.5 92.7 90.0 69.4 84.3 91.088.7
91.52016 100.0 88.9 91.5 91.7 53.6 72.7 91.285.3
230 181
206 194
224 210
8,2302017 18 32548 353 31 102 411258
8,6352015 15 31554 341 36 102 400309
9,3162016 24 35345 360 28 110 434251Tests Taken
August 14, 2017 Dallas ISD Evaluation & Assessment (Office of Institutional Research) rpt_STAAREOC_ss_per_app 2017-18 Data Packet
26BRYAN ADAMS HIGH SCHOOL (1)

FemaleMigrant MaleAt RiskWhiteAfricanAmer
HispanicEcon
DisadvSpecialEduc
LEP All DistrictYearTest
NUMBER NOT APPROACHED GRADE LEVEL STANDARD
EOC SS (2) State of Texas Assessment of Academic Readiness End-Of-Course: SOCIAL STUDIES
13 10
12 24
22 16
5932017 2 5 12 19 8 16 2322
U.S. HISTORY
9072015 1 10 23 34 11 16 3635
7952016 0 5 30 30 13 30 3837
230 181
206 194
224 210
8,2302017 18 32548 353 31 102 411258
8,6352015 15 31554 341 36 102 400309
9,3162016 24 35345 360 28 110 434251Tests Taken
August 14, 2017 Dallas ISD Evaluation & Assessment (Office of Institutional Research) rpt_STAAREOC_ss_num_not_app 2017-18 Data Packet
27BRYAN ADAMS HIGH SCHOOL (1)

FemaleMigrant MaleAt RiskWhiteAfricanAmer
HispanicEcon
DisadvSpecialEduc
LEP All DistrictYearTest
PERCENTAGE MET GRADE LEVEL STANDARD
EOC SS (3) State of Texas Assessment of Academic Readiness End-Of-Course: SOCIAL STUDIES
67.4 61.3
65.0 44.8
77.7 60.5
65.22017 83.3 52.1 66.5 64.0 25.8 37.3 64.751.6
U.S. HISTORY
55.32015 73.3 46.3 55.6 53.4 19.4 35.3 55.346.3
63.22016 91.7 55.6 70.5 68.6 32.1 42.7 69.455.8
230 181
206 194
224 210
8,2302017 18 32548 353 31 102 411258
8,6352015 15 31554 341 36 102 400309
9,3162016 24 35345 360 28 110 434251Tests Taken
August 14, 2017 Dallas ISD Evaluation & Assessment (Office of Institutional Research) rpt_STAAREOC_ss_per_met 2017-18 Data Packet
28BRYAN ADAMS HIGH SCHOOL (1)

FemaleMigrant MaleAt RiskWhiteAfricanAmer
HispanicEcon
DisadvSpecialEduc
LEP All DistrictYearTest
PERCENTAGE MASTERED GRADE LEVEL STANDARD
EOC SS (4) State of Texas Assessment of Academic Readiness End-Of-Course: SOCIAL STUDIES
33.9 25.4
26.7 7.2
38.4 19.0
30.82017 66.7 29.2 28.6 28.0 6.5 16.7 30.218.6
U.S. HISTORY
19.62015 40.0 14.8 16.8 16.4 2.8 7.8 17.311.0
26.52016 58.3 24.4 28.3 27.5 7.1 12.7 29.017.1
230 181
206 194
224 210
8,2302017 18 32548 353 31 102 411258
8,6352015 15 31554 341 36 102 400309
9,3162016 24 35345 360 28 110 434251Tests Taken
August 14, 2017 Dallas ISD Evaluation & Assessment (Office of Institutional Research) rpt_STAAREOC_ss_per_mst 2017-18 Data Packet
29BRYAN ADAMS HIGH SCHOOL (1)

AVERAGE PERCENTAGE OF ITEMS CORRECT BY REPORTING CATEGORY
EOC SS (5) State of Texas Assessment of Academic Readiness End-Of-Course: SOCIAL STUDIES
2017 69.5 65.1 65.0 71.1
2015 65.1 62.0 51.2 68.1
2016 68.7 71.1 69.9 70.9
1. History 2. Geography and Culture
3. Government and Citizenship
4. Economics, Science, Technology,
and SocietyU.S. HISTORY
August 14, 2017 Dallas ISD Evaluation & Assessment (Office of Institutional Research) rpt_STAAREOC_ss_obj 2017-18 Data Packet
30BRYAN ADAMS HIGH SCHOOL (1)

Composite
1
Grade2016-17 Listening
N (%) Progressed
Number RatedBoth Years
2016 Level
PERFORMANCE IN 2017 PROGRESSION FROM2016 TO 2017
Speaking Writing
% % %N N N(N Rated) 2017 Level N % 2017 Level
Domain:
IntBeg Adv AdvHigh
Texas English Language Proficiency Assessment SystemTELPAS
Reading
%N
11.4
14.0
9
40 13.4 42 42 14.0 44
(299)
Beginning
Intermediate
Advanced High
15.7 12.134
6.411 3.7 19 30 10.0 61 21.7 32
25.853 17.7 77 90 30.1 122 43.4 36.7103
53.8195 65.2 161 137 45.8 54 19.2 39.9112
218
126 (57.8%)
Beginning
Intermediate
Advanced
Advanced High
2
184
1
0
18
5
72
98
Advanced
16.4
3.2
10
3 1.6 6 7 3.7 18
(187)
Beginning
Intermediate
Advanced High
10.9 3.66
11.819 10.2 22 45 24.1 48 29.1 27
34.267 35.8 64 72 38.5 85 51.5 49.782
50.898 52.4 95 63 33.7 14 8.5 30.350
150
59 (39.3%)
Beginning
Intermediate
Advanced
Advanced High
3
242
4
0
10
1
64
42
Advanced
9.1
1.0
11
1 1.0 1 0 0.0 5
(96)
Beginning
Intermediate
Advanced High
5.7 1.11
9.49 9.4 9 8 8.3 20 22.7 8
55.251 53.1 53 63 65.6 48 54.5 62.555
34.435 36.5 33 25 26.0 15 17.0 27.324
82
26 (31.7%)
Beginning
Intermediate
Advanced
Advanced High
1
80
0
0
5
0
47
21
Advanced
14.3
1.3
12
0 0.0 1 3 3.9 4
(76)
Beginning
Intermediate
Advanced High
5.7 2.92
7.97 9.2 6 10 13.2 13 18.6 10
35.527 35.5 27 33 43.4 37 52.9 40.028
55.342 55.3 42 30 39.5 16 22.9 42.930
65
30 (46.2%)
Beginning
Intermediate
Advanced
Advanced High
2
90
0
0
2
0
24
28
Advanced
12.7
7.6
ALL
44 6.7 50 52 7.9 71
(658)
Beginning
Intermediate
Advanced High
11.8 7.143
8.546 7.0 56 93 14.1 142 23.5 77
33.6198 30.1 221 258 39.2 292 48.3 44.4268
50.3370 56.2 331 255 38.8 99 16.4 35.8216
515
241 (46.8%)
Beginning
Intermediate
Advanced
Advanced High
8
596
5
0
35
6
207
189
Advanced
Indicates students w ho progressed at least one level f rom 2016 to 2017.
August 14, 2017 Dallas ISD Evaluation & Assessment (Office of Institutional Research) rpt_TELPAS 2017-18 Data Packet
31BRYAN ADAMS HIGH SCHOOL (1)

IDEA Proficiency Test
PERCENTAGE BY PROFICIENCY LEVEL
IPT
%NNumberTested
%NNNGrade N N %%%%
Level 6Level 5Level 4Level 3Level 2Level 1
* 21.2 36 30.652 45.9 78 *9 170
7 21.1 24 44.751 28.1 32 6.110 114
7 28.3 17 31.719 28.3 17 11.711 60
* 33.3 15 42.219 22.2 10 *12 45
19 23.7 92 36.2141 35.2 137 4.9ALL 389
August 14, 2017 Dallas ISD Evaluation & Assessment (Office of Institutional Research) rpt_IPT 2017-18 Data Packet
32BRYAN ADAMS HIGH SCHOOL (1)

Course% Items Correct
CourseMark
ACP ACP
Averages % Passing District % Passing
Course Mark(no ACP)
ScaleScore
NumberTested
Course
Dallas ISD Assessments of Course PerformanceACP
Course% Items Correct
CourseMark
ACP ACP
Averages % Passing District % Passing
Course Mark(no ACP)
ScaleScore
NumberTested
Course
SEMESTER 1 TESTS SEMESTER 2 TESTS
High School Exams
ALGEBRA I ALGEBRA I
82.251.6 69.1 80.2 50.5 85.9 51.6 81.8481
ALGEBRA II ALGEBRA II
76.447.2 64.8 74.7 37.5 90.2 49.5 85.9 77.942.2 70.1 76.7 50.2 84.2 67.7 87.6279357
ALGEBRA II PRE-AP ALGEBRA II PRE-AP
80.946.3 67.8 78.9 42.2 88.0 68.9 92.8 80.947.3 70.7 79.3 55.1 87.2 73.4 93.57883
BIOLOGY BIOLOGY
74.056.5 73.9 74.0 71.2 80.2 62.7 83.7410
BIOLOGY PRE-AP BIOLOGY PRE-AP
79.463.4 77.1 79.1 80.4 93.5 67.8 93.2168
CHEMISTRY CHEMISTRY
77.739.9 68.9 76.4 44.6 82.6 45.5 82.4 75.042.3 70.1 74.3 53.3 73.1 57.1 81.6338379
CHEMISTRY PRE-AP CHEMISTRY PRE-AP
85.256.5 73.4 83.4 63.4 96.7 75.7 96.2 81.954.9 70.6 80.1 59.0 92.3 71.6 95.0117123
ECONOMICS ECONOMICS
91.973.7 82.8 90.5 90.9 100.0 74.2 94.8 ** * * * * 55.6 *5121
ENGLISH I ENGLISH I
76.263.6 71.3 75.5 61.7 83.2 59.1 81.9368
ENGLISH I FOR ESOL BEGINNER ENGLISH I FOR ESOL BEGINNER
86.342.6 71.3 84.0 43.8 96.9 46.3 84.132
August 14, 2017 Dallas ISD Evaluation & Assessment (Office of Institutional Research) rpt_ACP 2017-18 Data Packet
33BRYAN ADAMS HIGH SCHOOL (1)

Course% Items Correct
CourseMark
ACP ACP
Averages % Passing District % Passing
Course Mark(no ACP)
ScaleScore
NumberTested
Course
Dallas ISD Assessments of Course PerformanceACP
Course% Items Correct
CourseMark
ACP ACP
Averages % Passing District % Passing
Course Mark(no ACP)
ScaleScore
NumberTested
Course
SEMESTER 1 TESTS SEMESTER 2 TESTS
ENGLISH I FOR ESOL INTERMEDIATE ENGLISH I FOR ESOL INTERMEDIATE
81.543.8 69.9 79.8 50.0 91.7 47.4 90.812
ENGLISH I PRE-AP ENGLISH I PRE-AP
86.073.3 75.7 84.4 71.1 97.5 75.1 94.7159
ENGLISH II ENGLISH II
76.751.8 71.1 75.8 56.1 86.1 63.8 86.9287
ENGLISH II FOR ESOL INTERMEDIATE ENGLISH II FOR ESOL INTERMEDIATE
80.036.0 66.3 77.9 31.0 79.3 48.5 89.229
ENGLISH II PRE-AP ENGLISH II PRE-AP
86.961.2 70.1 84.4 55.6 97.4 76.9 94.9196
ENGLISH III ENGLISH III
79.259.0 72.6 78.3 67.6 95.5 66.3 90.4 77.556.1 70.1 76.4 55.0 85.1 57.8 87.1242290
ENGLISH IV ENGLISH IV
81.970.0 75.6 81.0 77.3 95.3 73.3 90.9 ** * * * * 53.0 *2233
ENVIRONMENTAL SYSTEMS ENVIRONMENTAL SYSTEMS
91.564.2 78.1 89.5 80.0 100.0 73.1 93.0 ** * * * * 51.9 *315
FRENCH I FRENCH I
81.956.4 73.9 80.7 60.2 90.4 63.3 87.7 80.153.4 73.1 79.1 55.1 82.1 62.7 85.77883
FRENCH II FRENCH II
79.565.7 72.9 78.5 58.3 80.9 60.5 89.6 80.554.5 71.0 79.1 50.5 84.8 65.5 92.6105115
GEOMETRY GEOMETRY
79.138.7 69.9 77.7 52.8 94.8 57.5 87.3 78.541.1 69.6 77.2 47.5 89.0 55.3 84.7354400
August 14, 2017 Dallas ISD Evaluation & Assessment (Office of Institutional Research) rpt_ACP 2017-18 Data Packet
34BRYAN ADAMS HIGH SCHOOL (1)
Course% Items Correct
CourseMark
ACP ACP
Averages % Passing District % Passing
Course Mark(no ACP)
ScaleScore
NumberTested
Course
Dallas ISD Assessments of Course PerformanceACP
Course% Items Correct
CourseMark
ACP ACP
Averages % Passing District % Passing
Course Mark(no ACP)
ScaleScore
NumberTested
Course
SEMESTER 1 TESTS SEMESTER 2 TESTS
GEOMETRY PRE-AP GEOMETRY PRE-AP
83.145.9 72.0 81.5 63.3 100.0 66.2 92.6 82.257.6 74.5 81.0 68.8 93.8 71.7 92.79698
GOVERNMENT GOVERNMENT
86.462.8 70.7 84.1 53.8 96.9 68.7 91.7 83.763.7 71.3 81.8 66.7 100.0 61.1 86.56104
HS BAND: LISTENING AND MUSIC ELEMENTS HS BAND: LISTENING AND MUSIC ELEMENTS
86.072.0 81.3 85.3 94.2 98.6 72.8 97.0 90.568.8 81.3 89.1 87.2 97.9 78.2 97.04769
HS HEALTH EDUCATION HS HEALTH EDUCATION
85.564.6 75.9 84.0 67.9 98.4 79.9 95.8 84.766.4 77.1 83.6 75.8 93.7 82.1 95.2190184
IPC IPC
74.533.3 59.2 72.2 17.4 82.6 52.4 85.8 87.152.9 71.2 84.8 53.8 100.0 63.9 83.81323
PHYSICS PHYSICS
78.233.9 67.5 76.6 32.5 86.9 45.1 85.8 77.040.2 70.6 76.0 57.5 90.4 59.1 85.4219283
PHYSICS PRE-AP PHYSICS PRE-AP
79.054.7 74.8 78.4 72.4 86.7 66.3 95.3 80.049.5 75.2 79.3 83.2 85.1 65.3 93.2101105
PRE-CALCULUS PRE-CALCULUS
80.361.3 74.2 79.4 64.4 96.6 49.5 90.0 84.457.5 76.4 83.2 67.6 94.1 60.8 90.534208
PRE-CALCULUS PRE-AP PRE-CALCULUS PRE-AP
58.354.4 72.7 60.4 60.4 73.6 70.9 80.3 80.363.8 76.9 79.8 78.4 94.1 70.9 95.05191
SPANISH FOR NATIVE SPEAKERS I SPANISH FOR NATIVE SPEAKERS I
85.354.9 72.4 83.4 61.5 96.5 63.3 89.4 86.561.7 74.5 84.7 70.1 92.0 75.3 87.5174200
SPANISH FOR NATIVE SPEAKERS II SPANISH FOR NATIVE SPEAKERS II
87.662.5 74.4 85.6 68.8 96.4 67.2 93.2 84.163.4 75.6 82.8 76.7 95.4 77.6 92.9219247
August 14, 2017 Dallas ISD Evaluation & Assessment (Office of Institutional Research) rpt_ACP 2017-18 Data Packet
35BRYAN ADAMS HIGH SCHOOL (1)
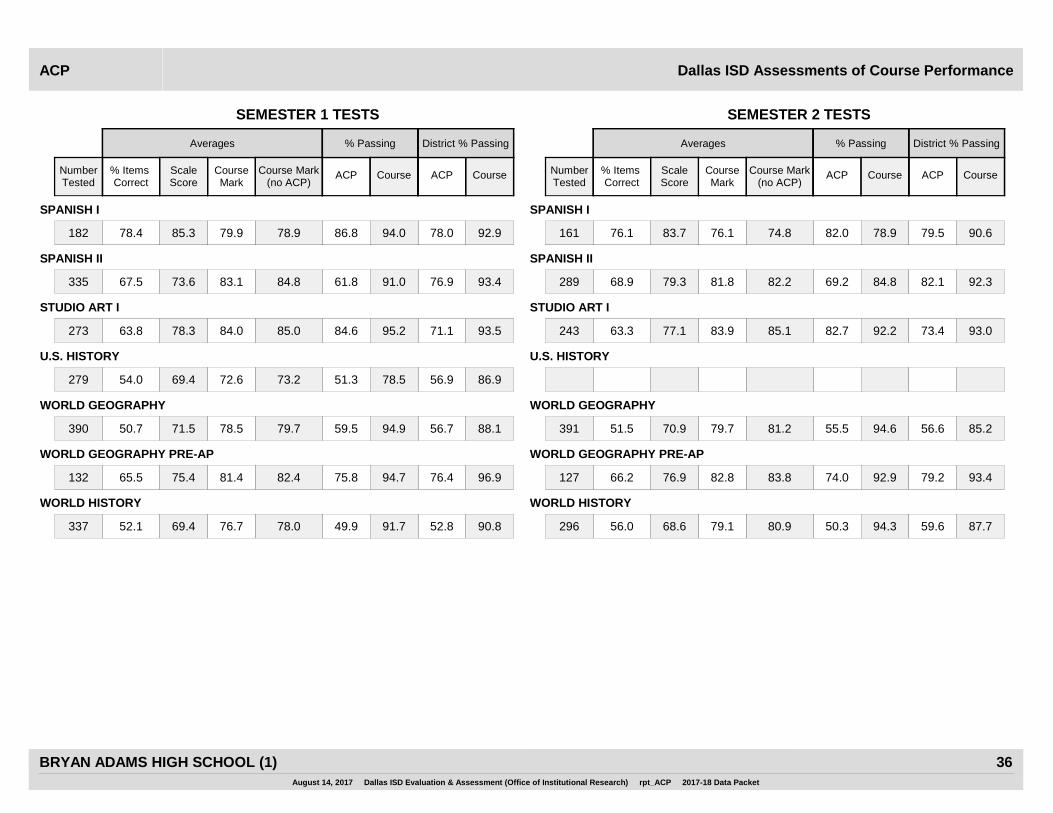
Course% Items Correct
CourseMark
ACP ACP
Averages % Passing District % Passing
Course Mark(no ACP)
ScaleScore
NumberTested
Course
Dallas ISD Assessments of Course PerformanceACP
Course% Items Correct
CourseMark
ACP ACP
Averages % Passing District % Passing
Course Mark(no ACP)
ScaleScore
NumberTested
Course
SEMESTER 1 TESTS SEMESTER 2 TESTS
SPANISH I SPANISH I
78.978.4 85.3 79.9 86.8 94.0 78.0 92.9 74.876.1 83.7 76.1 82.0 78.9 79.5 90.6161182
SPANISH II SPANISH II
84.867.5 73.6 83.1 61.8 91.0 76.9 93.4 82.268.9 79.3 81.8 69.2 84.8 82.1 92.3289335
STUDIO ART I STUDIO ART I
85.063.8 78.3 84.0 84.6 95.2 71.1 93.5 85.163.3 77.1 83.9 82.7 92.2 73.4 93.0243273
U.S. HISTORY U.S. HISTORY
73.254.0 69.4 72.6 51.3 78.5 56.9 86.9279
WORLD GEOGRAPHY WORLD GEOGRAPHY
79.750.7 71.5 78.5 59.5 94.9 56.7 88.1 81.251.5 70.9 79.7 55.5 94.6 56.6 85.2391390
WORLD GEOGRAPHY PRE-AP WORLD GEOGRAPHY PRE-AP
82.465.5 75.4 81.4 75.8 94.7 76.4 96.9 83.866.2 76.9 82.8 74.0 92.9 79.2 93.4127132
WORLD HISTORY WORLD HISTORY
78.052.1 69.4 76.7 49.9 91.7 52.8 90.8 80.956.0 68.6 79.1 50.3 94.3 59.6 87.7296337
August 14, 2017 Dallas ISD Evaluation & Assessment (Office of Institutional Research) rpt_ACP 2017-18 Data Packet
36BRYAN ADAMS HIGH SCHOOL (1)

SAT/ACT for Grade 12 StudentsSAT/ACT
All Students Hispanic White DistrictAfrican American
Subtest Year Dist % MeanN N MeanN MeanMeanN N MeanTest %
Percent Tested
% at BMRK*
% at BMRK*
% at BMRK*
% at BMRK*
% at BMRK*
ACT English 6,84917161226312361233083.5 14
6,83916131223013541330477.9 15
6,88518161430714351436790.4 15
2014-15
2015-16
2016-17
84.1
85.3
86.0
14.5
15.8
19.1
5.6
20.4
14.3
13.7
13.5
17.6
50.0
30.8
56.3
22.8
25.4
25.3
Mathematics 6,84919161626314361633083.5 17
6,83918131523016541630477.9 17
6,88520161730716351736790.4 18
2014-15
2015-16
2016-17
84.1
85.3
86.0
7.3
3.6
10.6
0.0
3.7
5.7
6.5
2.6
8.8
31.3
15.4
50.0
16.0
15.1
16.7
Reading 6,84918161526314361533083.5 16
6,83920131323015541430477.9 16
6,88519161630716351636790.4 17
2014-15
2015-16
2016-17
84.1
85.3
86.0
8.5
6.3
11.7
5.6
7.4
8.6
7.6
4.3
11.4
31.3
30.8
25.0
17.0
15.1
17.6
Science 6,84917161526315361533083.5 17
6,83919131523016541530477.9 17
6,88519161730716351736790.4 18
2014-15
2015-16
2016-17
84.1
85.3
86.0
5.2
6.3
8.4
5.6
3.7
8.6
4.9
5.2
7.8
6.3
30.8
18.8
12.6
12.5
13.3
Composite 6,84918161526314361533083.5 16
6,83918131423015541430477.9 16
6,88519161630716351636790.4 17
2014-15
2015-16
2016-17
84.1
85.3
86.0
–
–
–
–
–
–
–
–
–
–
–
–
–
–
–
SAT
7,109506184583034513445936489.7 461
7,259456164132773893741234487.1 440Reading & Writing
2014-15*
2015-16
2016-17 88.8
89.1 22.4
42.6
16.2
29.4
21.3
41.9
50.0
72.2
31.7
41.0
7,109488184523034143445136489.7 462
7,259477164242773873742234487.1 449Mathematics
2014-15*
2015-16
2016-17 88.8
89.1 8.7
13.7
2.7
8.8
8.3
13.5
25.0
33.3
18.2
20.7
*See the NOTES report for information about the new SAT (beginning March 2016) as well as college-readiness benchmarks set by The College Board (SAT) and ACT, Inc.
August 14, 2017 Dallas ISD Evaluation & Assessment (Office of Institutional Research) rpt_SAT 2017-18 Data Packet
37BRYAN ADAMS HIGH SCHOOL (1)

OtherWhite
PSAT (all grades)PSAT
All African American Hispanic District
Mean MeanNN MeanMeanN N MeanMean NNSubtest Year% at
BMRK*% at
BMRK*% at
BMRK*% at
BMRK*% at
BMRK% at
BMRK*% at
BMRK*Grade
9 2016
2014*
2015 *
*2 0 4641,442* 68.2
4749 *3 4621,54077.8 70.1
*5 4133846 423 58.7 * 52.6
39323419743 408 44.2 42.9 39.1Reading &
Writing
2016
2014*
2015 *
*2 0 4691,442* 62.8
4579 *3 4561,54055.6 54.3
*5 4273846 428 41.3 * 42.1
41023404743 417 30.2 28.6 26.1Mathematics
10 2016
2014*
2015
33.3
28.6
46627 39317 4179,09063.0 40.1
46513 39720 4148,97253.8 38.6
38375 397394514 398 32.9 20.0 33.2
39435040169453 397 28.0 23.2 28.0Reading &
Writing
2016
2014*
2015
11.1
19.0
43927 40817 4339,09033.3 26.6
44213 40320 4248,97223.1 22.2
38875 411394514 409 16.3 4.0 17.8
41335040569453 412 13.5 11.6 13.1Mathematics
11 2016
2014*
2015
*
*
*3 *1 5112,020* 69.2
*2 *1 4912,313* 61.3
*4 4472735 462 40.0 * 29.6
45027*536 442 41.7 * 48.1Reading &
Writing
2016
2014*
2015
*
*
*3 *1 5112,020* 49.7
*2 *1 4922,313* 39.5
*4 4762735 488 34.3 * 25.9
43227*536 429 5.6 * 7.4Mathematics
*See the NOTES report for information about the new PSAT, introduced in 2015, as well as college readiness benchmarks set by The College Board for PSAT.
August 14, 2017 Dallas ISD Evaluation & Assessment (Office of Institutional Research) rpt_PSAT 2017-18 Data Packet
38BRYAN ADAMS HIGH SCHOOL (1)
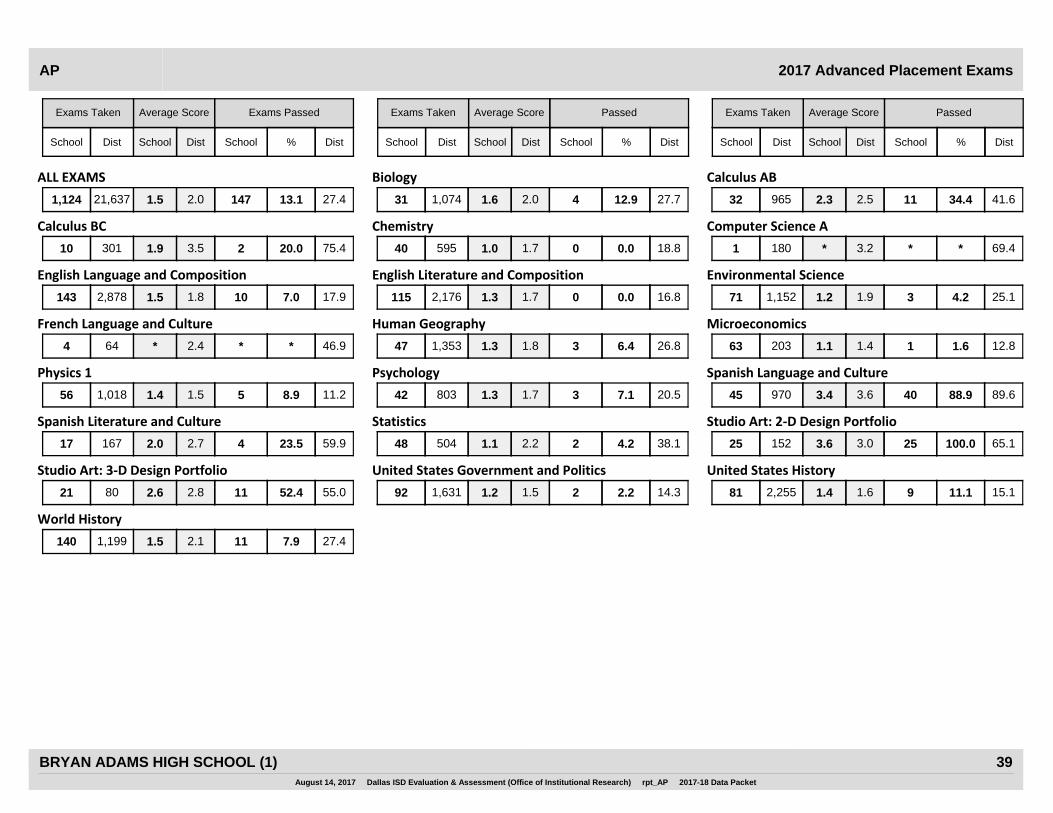
Passed
School Dist%
Passed
School Dist%Dist School
Average Score
2017 Advanced Placement ExamsAP
Dist
Average Score Exams Passed
%DistSchool
Exams Taken Average Score
DistSchoolDistSchool
Exams Taken
DistSchoolDistSchool
Exams Taken
School
ALL EXAMS
21,637 13.11,124 1.5 27.42.0 147
Biology
1,074 12.931 1.6 27.72.0 4
Calculus AB
965 34.432 2.3 41.62.5 11
Calculus BC
301 20.010 1.9 75.43.5 2
Chemistry
595 0.040 1.0 18.81.7 0
Computer Science A
180 *1 * 69.43.2 *
English Language and Composition
2,878 7.0143 1.5 17.91.8 10
English Literature and Composition
2,176 0.0115 1.3 16.81.7 0
Environmental Science
1,152 4.271 1.2 25.11.9 3
French Language and Culture
64 *4 * 46.92.4 *
Human Geography
1,353 6.447 1.3 26.81.8 3
Microeconomics
203 1.663 1.1 12.81.4 1
Physics 1
1,018 8.956 1.4 11.21.5 5
Psychology
803 7.142 1.3 20.51.7 3
Spanish Language and Culture
970 88.945 3.4 89.63.6 40
Spanish Literature and Culture
167 23.517 2.0 59.92.7 4
Statistics
504 4.248 1.1 38.12.2 2
Studio Art: 2-D Design Portfolio
152 100.025 3.6 65.13.0 25
Studio Art: 3-D Design Portfolio
80 52.421 2.6 55.02.8 11
United States Government and Politics
1,631 2.292 1.2 14.31.5 2
United States History
2,255 11.181 1.4 15.11.6 9
World History
1,199 7.9140 1.5 27.42.1 11
August 14, 2017 Dallas ISD Evaluation & Assessment (Office of Institutional Research) rpt_AP 2017-18 Data Packet
39BRYAN ADAMS HIGH SCHOOL (1)