Embed Size (px)
Citation preview
Data Packet for 2017-18 Planning
Evaluation & Assessment
Office of Institutional Research
http://mydata.dallasisd.org
SIDNEY LANIER EXPRESSIVE ARTS VANGUARDSchool Number 827
Statistics based only on students in vanguard or other choice program
August 15, 2017
Notice regarding TELPAS: Counts were incorrectly reported in previous versions of 2017-18 data packets. Counts
were doubled when reported, but percentages were not affected.
1 Table of Contents2017-18 Data Packet: Standard Issue
2. Contents ........... Table of Contents
3. Notes ................ Notes and Data Descriptions
STUDENTS AND STAFF
5. Summary .......... Summary of Student and Teacher Statistics
6. Enroll (1) ........... Enrollment Statistics by Ethnicity
7. Enroll (2) ........... Enrollment Statistics by Select Student Group
8. Attendance ....... Student Attendance Statistics
STAAR
9. Reading (3-8) .... STAAR 3-8 Reading in English
14. Writing (3-8) ..... STAAR 3-8 Writing in English
19. Math (3-8) ........ STAAR 3-8 Mathematics in English
24. Science (3-8) ..... STAAR 3-8 Science in English
STAAR (SPANISH)
29. Reading (3-8) .... STAAR 3-8 Reading in Spanish
34. Writing (3-8) ..... STAAR 3-8 Writing in Spanish
ENGLISH PROFICIENCY
39. TELPAS .............. Texas English Language Proficiency Assessment System
40. IPT ..................... IDEA Proficiency Test
LOCAL ASSESSMENT
41. ACP ................... Dallas ISD Assessments of Course Performance
August 15, 2017 Dallas ISD Evaluation & Assessment (Office of Institutional Research) rpt_CONTENTS 2017-18 Data Packet
2SIDNEY LANIER EXPRESSIVE ARTS VANGUARD (827)
2Notes, Definitions, and Data DescriptionsNotes
Student percentages are computed as the percentage of total student enrollment.•
Additional statistics are available in ENROLLMENT and TEACHER reports.•
2016-17 SCHOOL SUMMARY
Teacher statistics are not available for programs within a campus or for “zoned only” students. See statistics for whole campus in main campus packet.•
Race/ethnic categories are based on the latest federal standards for ethnicity and race reporting, though some categories have been combined due to small
group sizes. Students reporting their ethnicity as “Hispanic” are not counted in any race category.
•
Statistics are based on the school's enrollment at the end of the fifth six-weeks grading period.•
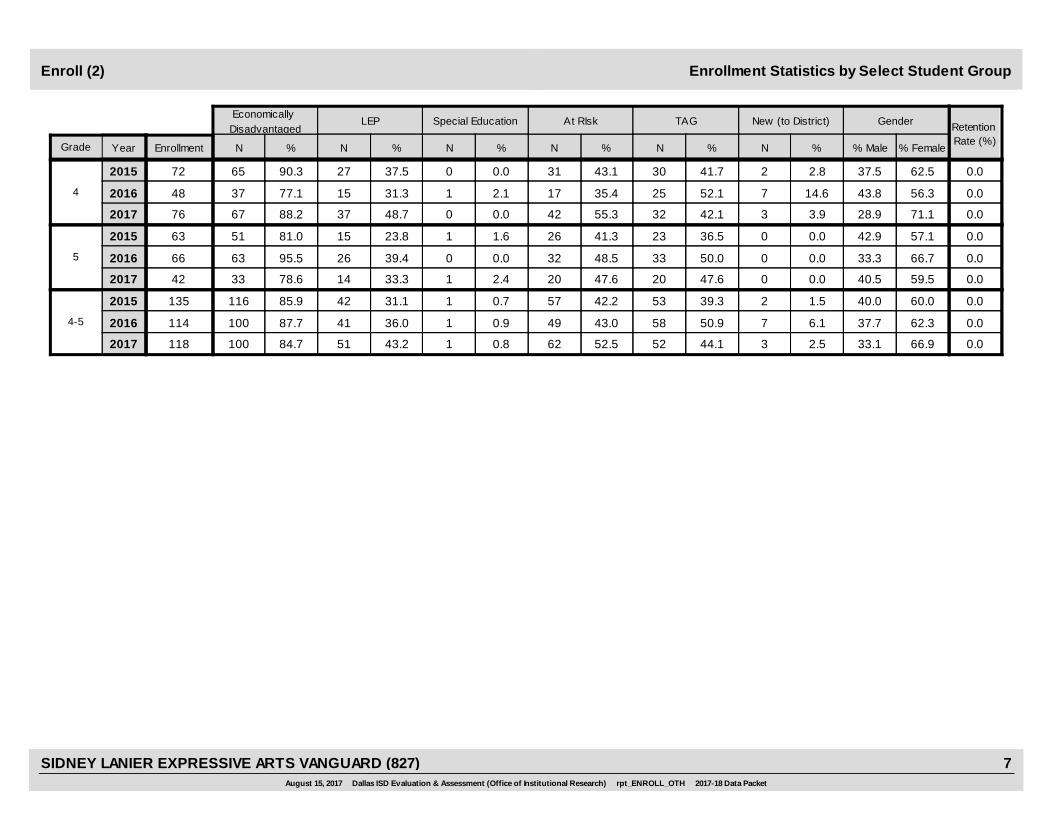
The “retention rate” is the percentage of students in the same grade at the end of the fifth six-weeks grading period for both 2015-16 and 2016-17.•
“New” students were new to the district in 2016-17. They are counted as new if not enrolled in a district campus before the last day of the 2015-16 school year.•
ENROLLMENT
• Statistics are based on student attendance through the end of the sixth six-weeks grading period (the end of the school year).
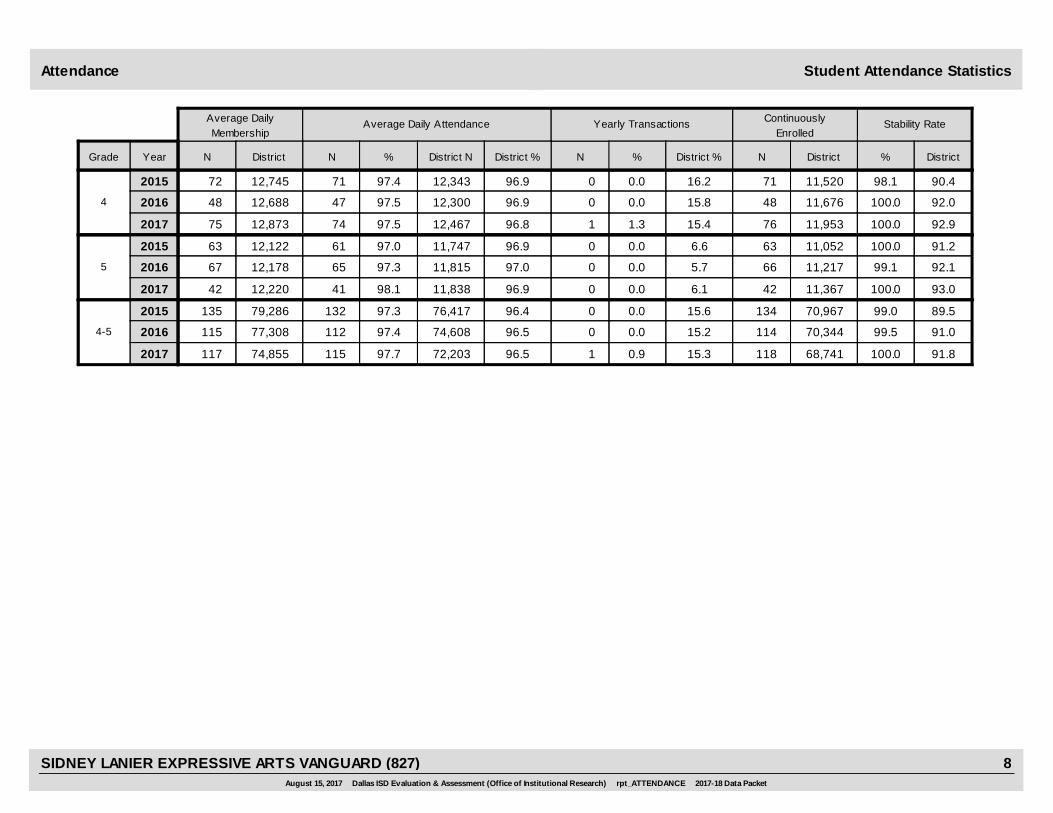
• “Average daily membership” is the total number of school days students were SCHEDULED or ENROLLED divided by the number of school days in the year.• The “average daily attendance” number (N) is the total number of school days students were IN ATTENDANCE divided by the number of school days in the
year. The “average daily attendance” percentage (%) is the average attendance rate. For each student, the number of days attended is divided by the number
of days enrolled. This rate is then averaged across students.
• The number (N) of “yearly transactions” is the total number of transfer and withdrawal transactions in the school year. The percentage (%) is the number of
transactions divided by “average daily membership,” which gives (on average) the percentage of the membership associated with a transaction.
• “Continuously enrolled” students are enrolled and in attendance for a minimum number of instructional days in at least one course at the school between the
beginning of the school year and the first day of the main STAAR testing period. The minimum number varies depending on the school year's calendar.
• The “stability rate” is the number of continuously enrolled students divided by “average daily membership.”
ATTENDANCE
August 15, 2017 Dallas ISD Evaluation & Assessment (Office of Institutional Research) rpt_NOTES 2017-18 Data Packet
3SIDNEY LANIER EXPRESSIVE ARTS VANGUARD (827)
2Notes, Definitions, and Data DescriptionsNotes
Cells marked with an asterisk (*) indicate five or fewer students were tested. Blank cells indicate no students were tested.•
•
•
•
•
Student group assignments are from the district's Public Education Information Management System (PEIMS) submission to the TEA.
Grade in report is grade level of assessment, not student's grade level. For example, grade 7 students in Pre-AP math or science courses are assessed with the
Grade 8 Math or Grade 8 Science assessment. These students' scores are reflected in the row for “Grade 8”.
Statistics by reporting category are averages for all students (across student groups and genders).
“Average percentage correct” is computed as follows: For each student, divide number of items correctly answered by total number of items in test section,
then average resulting percentages across all students. For short answers on EOC English tests, an “average rating” is presented; STAAR EOC short answers are
rated on a scale of 0 to 3. For written compositions on writing tests, “average score points” is presented. Additional details provided in report footnotes.
• Statistics for SSI grades 5 and 8 are based on scores cumulative through students' second administrations.
• STAAR statistics for years prior to 2016-17 include results from all STAAR tests (STAAR, STAAR A, and STAAR L) for comparability to statistics beginning 2016-17,
when STAAR A and STAAR L were discontinued.
STATE OF TEXAS ASSESSMENT OF ACADEMIC READINESS (STAAR)
• Performance standard labels have changed. “Approached Grade Level” is comparable to Level 2: Satisfactory (2015-16 standard). “Met Grade Level” is
equivalent to Level 2: Satisfactory (final standard). “Mastered Grade Level” is equivalent to Level 3: Advanced. Statistics for a performance level (such as
“Percentage Approached Grade Level” ) include all scores at or above that level.
•
• If a student's composite rating did not increase at least one level from 2016 to 2017, the TEA did not report the 2016 composite rating.
Students are counted as having tested if any one of the four domains is rated. Because a TELPAS composite rating is not assigned to a student unless all four
domains are rated, the number of TELPAS composite ratings may be smaller than the number tested.
• If a student is rated as advanced high in 2017, the TEA does not differentiate between the advanced and advanced high levels from 2016.
TELPAS
•
• Raw scores on the ACPs (percentage of items correct) are scaled each year to maintain similar annual passing rates for the district.
ACPs are semester exams administered in grades K-12. Not all courses have ACPs. In secondary grades, ACP scores account for a portion of students' semester
grades (10% at middle and 15% at high). “Average course mark (no ACP)” is computed from semester grades before factoring in ACP scores. In elementary
grades, ACP results account for 5% of students' semester grades for core courses; course-grade statistics are not reported in packets for elementary grades.
• A scale score of at least 70% is required to pass an ACP. For grade levels with numeric grading, a course mark of at least 70% is required to pass a course.
Cells marked with an asterisk (*) indicate five or fewer students were tested. Blank cells indicate no students were tested.•
DALLAS ISD ASSESSMENTS OF COURSE PERFORMANCE (ACP)
• Statistics are computed separately for Semester 1 and Semester 2 tests; time of administration during the school year is not relevant. Results from tests
written for different school years are not combined.
August 15, 2017 Dallas ISD Evaluation & Assessment (Office of Institutional Research) rpt_NOTES 2017-18 Data Packet
4SIDNEY LANIER EXPRESSIVE ARTS VANGUARD (827)
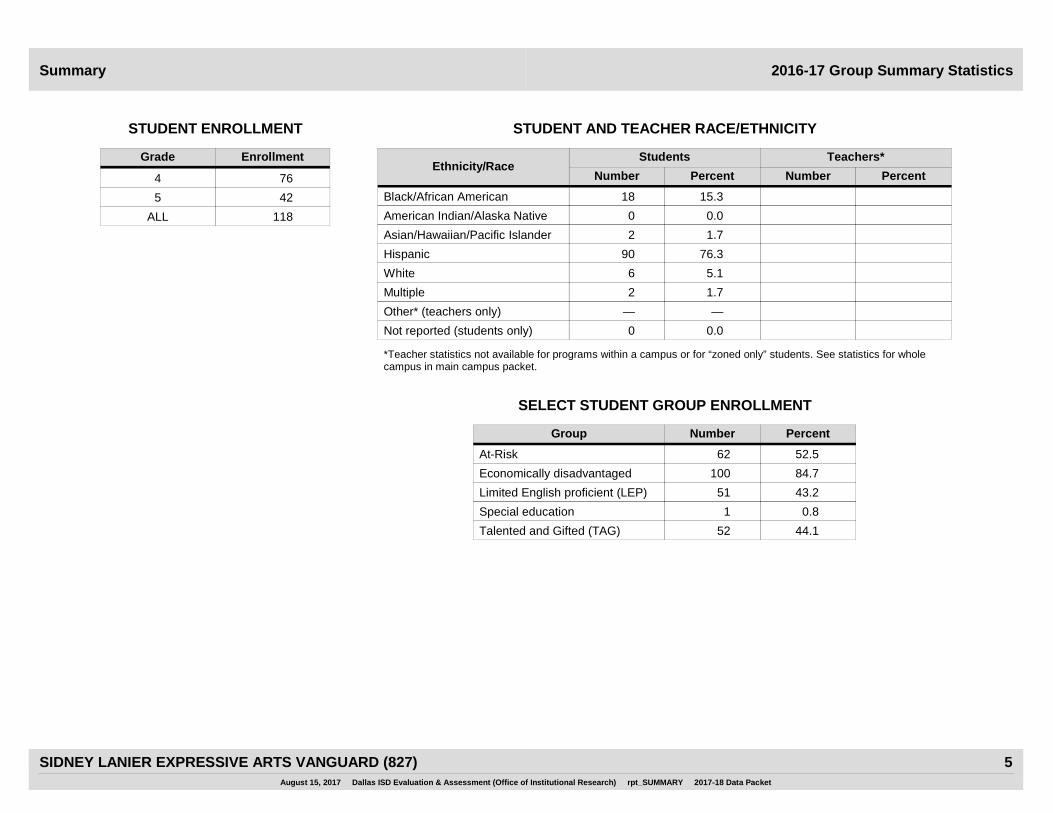
Summary 2016-17 Group Summary Statistics
Grade
STUDENT ENROLLMENT
Enrollment
4 76
5 42
ALL 118
STUDENT AND TEACHER RACE/ETHNICITY
Students
Number Percent Number PercentEthnicity/Race
Black/African American
American Indian/Alaska Native
Asian/Hawaiian/Pacific Islander
Hispanic
White
Multiple
18 15.3
0 0.0
2 1.7
90 76.3
6 5.1
2 1.7
SELECT STUDENT GROUP ENROLLMENT
Number PercentGroup
Economically disadvantaged
Limited English proficient (LEP)
Special education
100 84.7
51 43.2
1 0.8
*Teacher statistics not available for programs within a campus or for “zoned only” students. See statistics for whole campus in main campus packet.
Not reported (students only) 0 0.0
Other* (teachers only) — —
Talented and Gifted (TAG) 52 44.1
At-Risk 62 52.5
Teachers*
August 15, 2017 Dallas ISD Evaluation & Assessment (Office of Institutional Research) rpt_SUMMARY 2017-18 Data Packet
5SIDNEY LANIER EXPRESSIVE ARTS VANGUARD (827)
N %
Asian
%NN %%
Hispanic
N N %Grade Year
African American American Indian
Enrollment
White
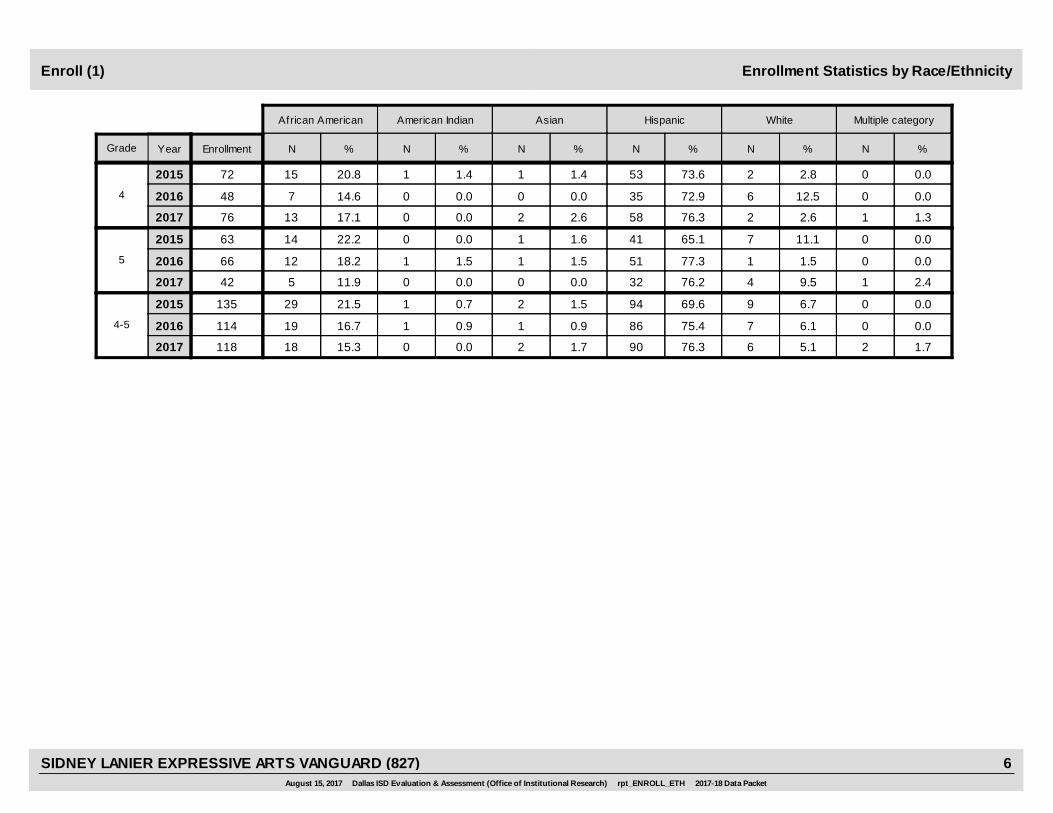
Enrollment Statistics by Race/EthnicityEnroll (1)
N %
Multiple category
2017
2015
2016
1.4
0.0
2.6
1
0
2
1.4
0.0
0.0
1
0
0
73.6
72.9
76.3
53
35
58
20.8
14.6
17.1
15
7
13
2.8
12.5
2.6
2
6
2
4
76
48
72 0.0
0.0
1.3
0
0
1
2017
2015
2016
1.6
1.5
0.0
1
1
0
0.0
1.5
0.0
0
1
0
65.1
77.3
76.2
41
51
32
22.2
18.2
11.9
14
12
5
11.1
1.5
9.5
7
1
4
5
42
66
63 0.0
0.0
2.4
0
0
1
2017
2015
2016
1.5
0.9
1.7
2
1
2
0.7
0.9
0.0
1
1
0
69.6
75.4
76.3
94
86
90
21.5
16.7
15.3
29
19
18
6.7
6.1
5.1
9
7
6
4-5
118
114
135 0.0
0.0
1.7
0
0
2
August 15, 2017 Dallas ISD Evaluation & Assessment (Office of Institutional Research) rpt_ENROLL_ETH 2017-18 Data Packet
6SIDNEY LANIER EXPRESSIVE ARTS VANGUARD (827)
N %
At RIsk New (to District)
N %
TAG
N %
Economically Disadvantaged
Grade Year
LEP Special Education
N % N % N %
Retention Rate (%)
Enrollment
Enrollment Statistics by Select Student GroupEnroll (2)
Gender
% Male % Female
43.1
35.4
55.3
31
17
42
2.8
14.6
3.9
4
2017 76
48
72 90.3
77.1
88.2
65
37
67
37.5
31.3
48.7
27
15
37
0.0
2.1
0.0
0
1
0
41.7
52.1
42.1
30
25
32
0.0
0.0
0.0
2015
2016
2
7
3
37.5
43.8
28.9
62.5
56.3
71.1
41.3
48.5
47.6
26
32
20
0.0
0.0
0.0
5
2017 42
66
63 81.0
95.5
78.6
51
63
33
23.8
39.4
33.3
15
26
14
1.6
0.0
2.4
1
0
1
36.5
50.0
47.6
23
33
20
0.0
0.0
0.0
2015
2016
0
0
0
42.9
33.3
40.5
57.1
66.7
59.5
42.2
43.0
52.5
57
49
62
1.5
6.1
2.5
4-5
2017 118
114
135 85.9
87.7
84.7
116
100
100
31.1
36.0
43.2
42
41
51
0.7
0.9
0.8
1
1
1
39.3
50.9
44.1
53
58
52
0.0
0.0
0.0
2015
2016
2
7
3
40.0
37.7
33.1
60.0
62.3
66.9
August 15, 2017 Dallas ISD Evaluation & Assessment (Office of Institutional Research) rpt_ENROLL_OTH 2017-18 Data Packet
7SIDNEY LANIER EXPRESSIVE ARTS VANGUARD (827)
Stability Rate
%
ContinuouslyEnrolled
N DistrictNN
Average DailyMembership
Average Daily Attendance Yearly Transactions
Grade Year N %District District N District % % District % District
Student Attendance StatisticsAttendance
98.1
100.0
100.0
71
76
48
11,520
11,953
11,676
0
1
04
2015 97.471 0.0 16.2
2016
2017 97.574 1.3 15.4
97.547 0.0 15.8
12,745
12,873
12,688
96.9
96.8
96.9
12,343
12,467
12,300
90.4
92.9
92.0
72
75
48
100.0
100.0
99.1
63
42
66
11,052
11,367
11,217
0
0
05
2015 97.061 0.0 6.6
2016
2017 98.141 0.0 6.1
97.365 0.0 5.7
12,122
12,220
12,178
96.9
96.9
97.0
11,747
11,838
11,815
91.2
93.0
92.1
63
42
67
99.0
100.0
99.5
134
118
114
70,967
68,741
70,344
0
1
04-5
2015 97.3132 0.0 15.6
2016
2017 97.7115 0.9 15.3
97.4112 0.0 15.2
79,286
74,855
77,308
96.4
96.5
96.5
76,417
72,203
74,608
89.5
91.8
91.0
135
117
115
August 15, 2017 Dallas ISD Evaluation & Assessment (Office of Institutional Research) rpt_ATTENDANCE 2017-18 Data Packet
8SIDNEY LANIER EXPRESSIVE ARTS VANGUARD (827)
FemaleMigrant MaleAt RiskWhiteAfricanAmer
HispanicEcon
DisadvSpecialEduc
LEP All DistrictYearGradeNumber Tested(All Students)
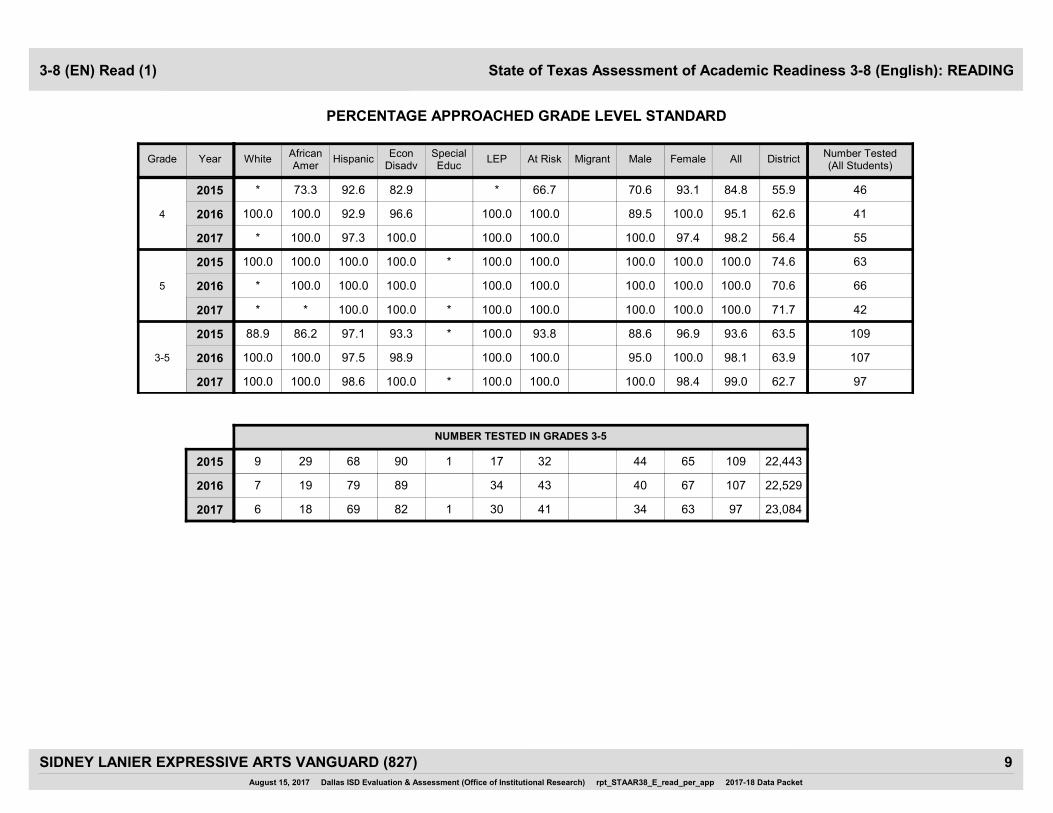
State of Texas Assessment of Academic Readiness 3-8 (English): READING
PERCENTAGE APPROACHED GRADE LEVEL STANDARD
3-8 (EN) Read (1)
100.0 97.4
70.6 93.1
89.5 100.0
56.42017 * 100.0 97.3 100.0 100.0 98.2 55100.0
4
55.92015 * 73.3 92.6 82.9 * 84.8 4666.7
62.62016 100.0 100.0 92.9 96.6 100.0 95.1 41100.0
100.0 100.0
100.0 100.0
100.0 100.0
71.72017 * * 100.0 100.0 * 100.0 100.0 42100.0
5
74.62015 100.0 100.0 100.0 100.0 * 100.0 100.0 63100.0
70.62016 * 100.0 100.0 100.0 100.0 100.0 66100.0
100.0 98.4
88.6 96.9
95.0 100.0
62.72017 100.0 100.0 98.6 100.0 * 100.0 99.0 97100.0
3-5
63.52015 88.9 86.2 97.1 93.3 * 100.0 93.6 10993.8
63.92016 100.0 100.0 97.5 98.9 100.0 98.1 107100.0
NUMBER TESTED IN GRADES 3-5
34 63
44 65
40 67
23,0842017 6 6918 82 1 30 9741
22,4432015 9 6829 90 1 17 10932
22,5292016 7 7919 89 34 10743
August 15, 2017 Dallas ISD Evaluation & Assessment (Office of Institutional Research) rpt_STAAR38_E_read_per_app 2017-18 Data Packet
9SIDNEY LANIER EXPRESSIVE ARTS VANGUARD (827)
FemaleMigrant MaleAt RiskWhiteAfricanAmer
HispanicEcon
DisadvSpecialEduc
LEP All DistrictYearGradeNumber Tested(All Students)
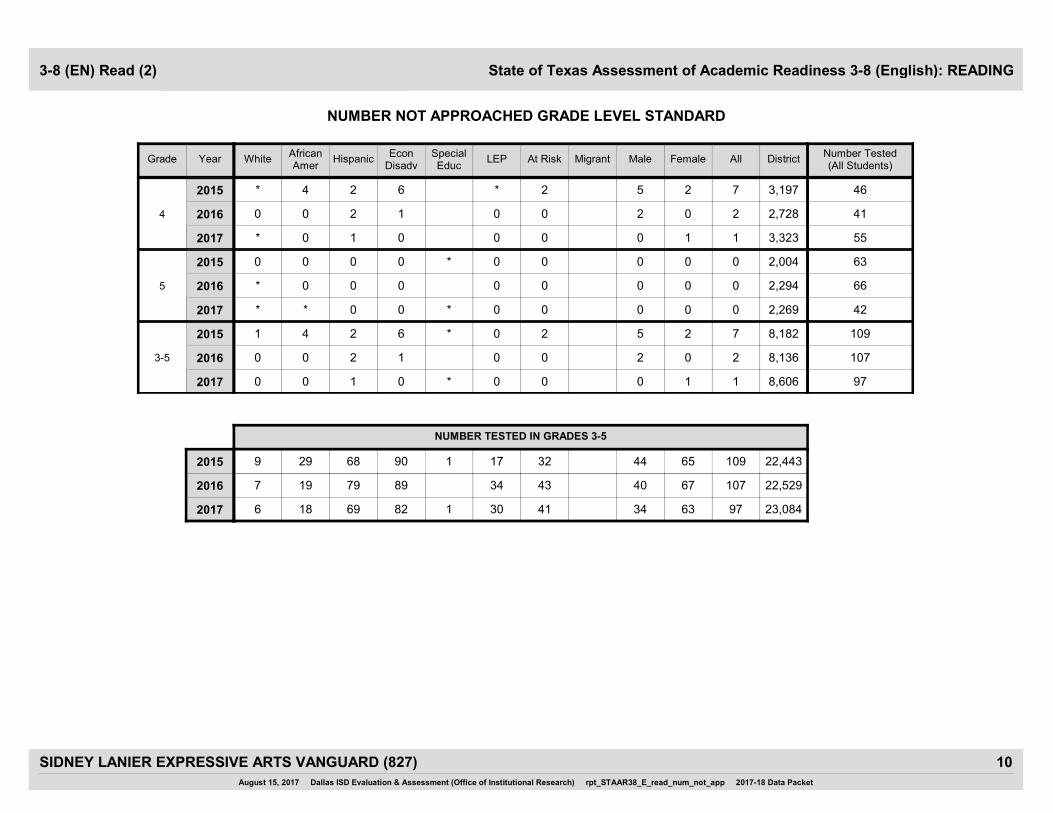
State of Texas Assessment of Academic Readiness 3-8 (English): READING
NUMBER NOT APPROACHED GRADE LEVEL STANDARD
3-8 (EN) Read (2)
0 1
5 2
2 0
3,3232017 * 0 1 0 0 1 550
4
3,1972015 * 4 2 6 * 7 462
2,7282016 0 0 2 1 0 2 410
0 0
0 0
0 0
2,2692017 * * 0 0 * 0 0 420
5
2,0042015 0 0 0 0 * 0 0 630
2,2942016 * 0 0 0 0 0 660
0 1
5 2
2 0
8,6062017 0 0 1 0 * 0 1 970
3-5
8,1822015 1 4 2 6 * 0 7 1092
8,1362016 0 0 2 1 0 2 1070
NUMBER TESTED IN GRADES 3-5
34 63
44 65
40 67
23,0842017 6 6918 82 1 30 9741
22,4432015 9 6829 90 1 17 10932
22,5292016 7 7919 89 34 10743
August 15, 2017 Dallas ISD Evaluation & Assessment (Office of Institutional Research) rpt_STAAR38_E_read_num_not_app 2017-18 Data Packet
10SIDNEY LANIER EXPRESSIVE ARTS VANGUARD (827)
FemaleMigrant MaleAt RiskWhiteAfricanAmer
HispanicEcon
DisadvSpecialEduc
LEP All DistrictYearGradeNumber Tested(All Students)
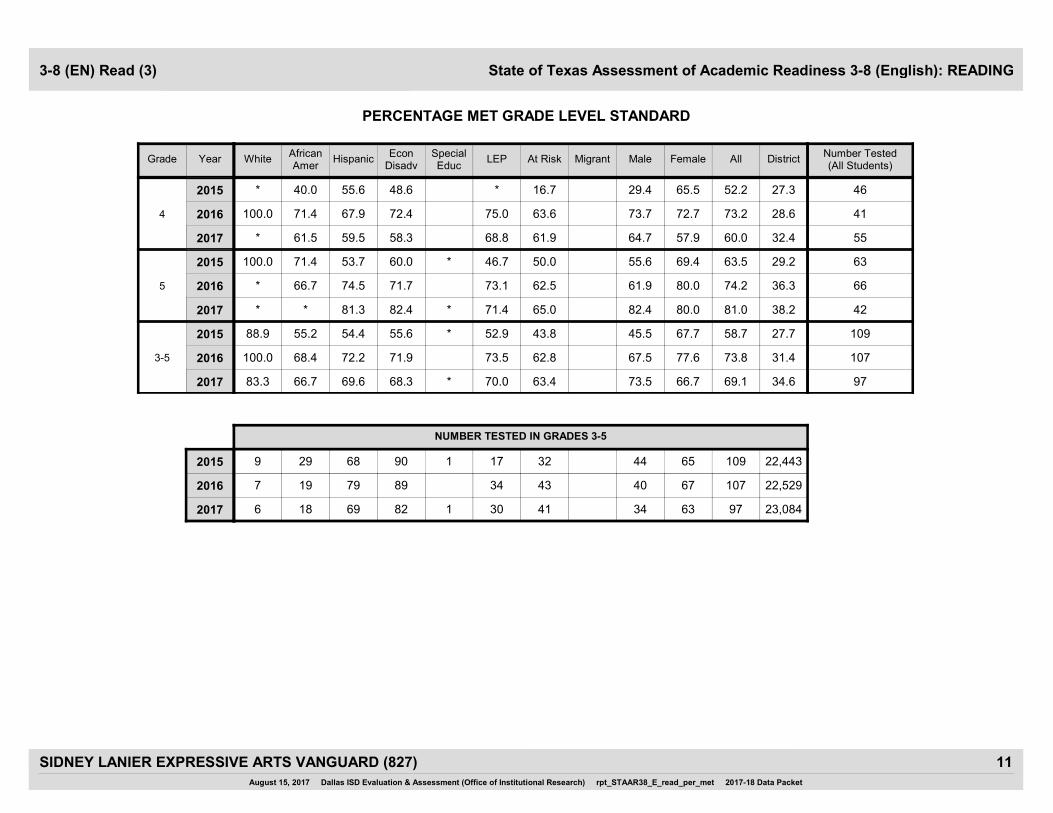
State of Texas Assessment of Academic Readiness 3-8 (English): READING
PERCENTAGE MET GRADE LEVEL STANDARD
3-8 (EN) Read (3)
64.7 57.9
29.4 65.5
73.7 72.7
32.42017 * 61.5 59.5 58.3 68.8 60.0 5561.9
4
27.32015 * 40.0 55.6 48.6 * 52.2 4616.7
28.62016 100.0 71.4 67.9 72.4 75.0 73.2 4163.6
82.4 80.0
55.6 69.4
61.9 80.0
38.22017 * * 81.3 82.4 * 71.4 81.0 4265.0
5
29.22015 100.0 71.4 53.7 60.0 * 46.7 63.5 6350.0
36.32016 * 66.7 74.5 71.7 73.1 74.2 6662.5
73.5 66.7
45.5 67.7
67.5 77.6
34.62017 83.3 66.7 69.6 68.3 * 70.0 69.1 9763.4
3-5
27.72015 88.9 55.2 54.4 55.6 * 52.9 58.7 10943.8
31.42016 100.0 68.4 72.2 71.9 73.5 73.8 10762.8
NUMBER TESTED IN GRADES 3-5
34 63
44 65
40 67
23,0842017 6 6918 82 1 30 9741
22,4432015 9 6829 90 1 17 10932
22,5292016 7 7919 89 34 10743
August 15, 2017 Dallas ISD Evaluation & Assessment (Office of Institutional Research) rpt_STAAR38_E_read_per_met 2017-18 Data Packet
11SIDNEY LANIER EXPRESSIVE ARTS VANGUARD (827)
FemaleMigrant MaleAt RiskWhiteAfricanAmer
HispanicEcon
DisadvSpecialEduc
LEP All DistrictYearGradeNumber Tested(All Students)
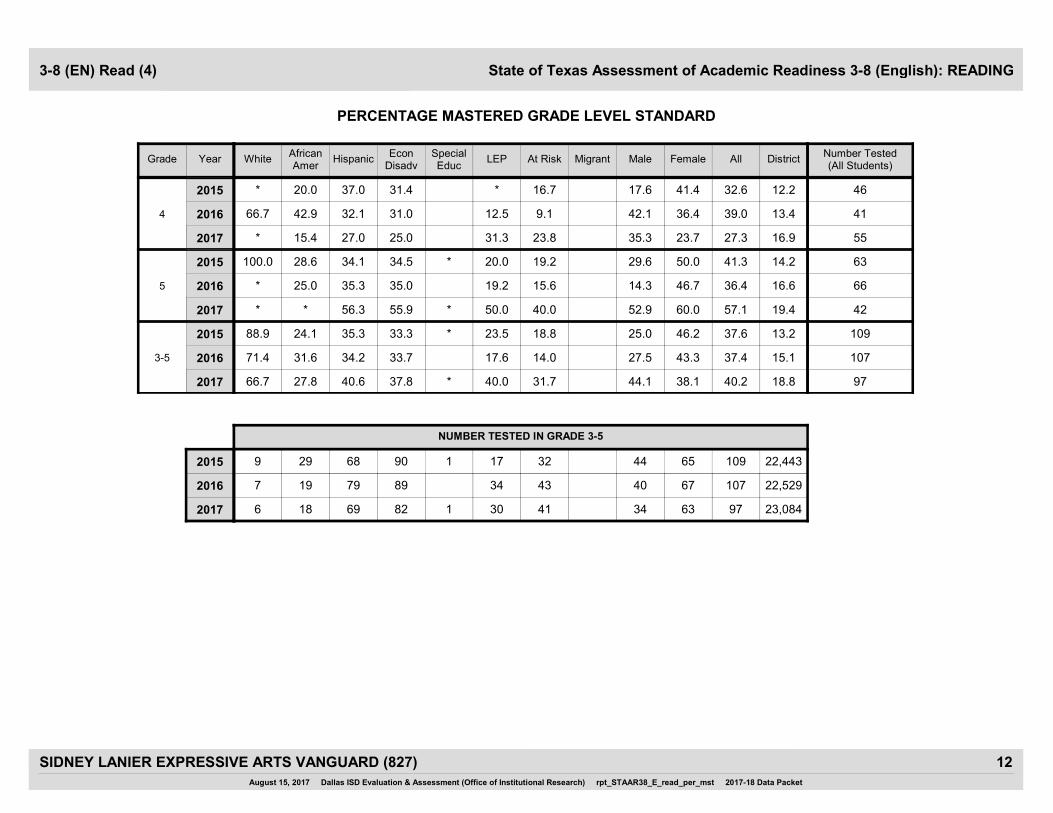
State of Texas Assessment of Academic Readiness 3-8 (English): READING
PERCENTAGE MASTERED GRADE LEVEL STANDARD
3-8 (EN) Read (4)
35.3 23.7
17.6 41.4
42.1 36.4
16.92017 * 15.4 27.0 25.0 31.3 27.3 5523.8
4
12.22015 * 20.0 37.0 31.4 * 32.6 4616.7
13.42016 66.7 42.9 32.1 31.0 12.5 39.0 419.1
52.9 60.0
29.6 50.0
14.3 46.7
19.42017 * * 56.3 55.9 * 50.0 57.1 4240.0
5
14.22015 100.0 28.6 34.1 34.5 * 20.0 41.3 6319.2
16.62016 * 25.0 35.3 35.0 19.2 36.4 6615.6
44.1 38.1
25.0 46.2
27.5 43.3
18.82017 66.7 27.8 40.6 37.8 * 40.0 40.2 9731.7
3-5
13.22015 88.9 24.1 35.3 33.3 * 23.5 37.6 10918.8
15.12016 71.4 31.6 34.2 33.7 17.6 37.4 10714.0
NUMBER TESTED IN GRADE 3-5
34 63
44 65
40 67
23,0842017 6 6918 82 1 30 9741
22,4432015 9 6829 90 1 17 10932
22,5292016 7 7919 89 34 10743
August 15, 2017 Dallas ISD Evaluation & Assessment (Office of Institutional Research) rpt_STAAR38_E_read_per_mst 2017-18 Data Packet
12SIDNEY LANIER EXPRESSIVE ARTS VANGUARD (827)
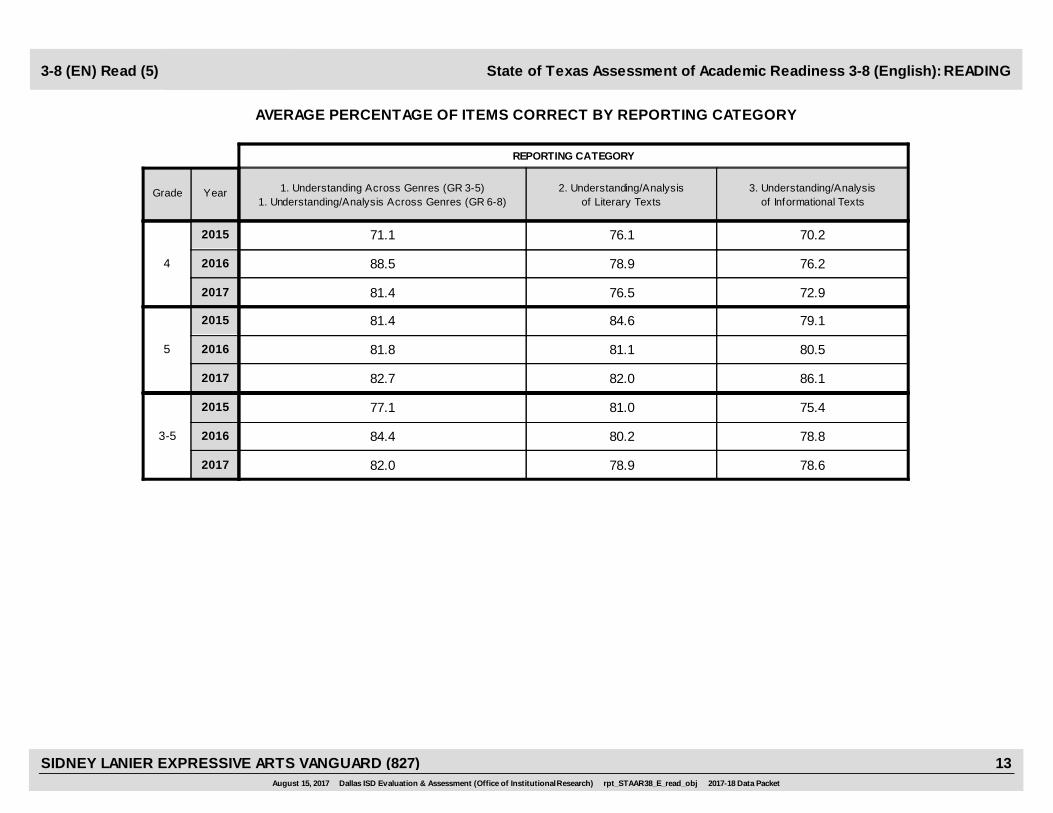
1. Understanding Across Genres (GR 3-5)1. Understanding/Analysis Across Genres (GR 6-8)
2. Understanding/Analysisof Literary Texts
3. Understanding/Analysisof Informational Texts
YearGrade
REPORTING CATEGORY
State of Texas Assessment of Academic Readiness 3-8 (English): READING
AVERAGE PERCENTAGE OF ITEMS CORRECT BY REPORTING CATEGORY
3-8 (EN) Read (5)
2017 81.4 76.5 72.9
2015 71.1 76.1 70.2
4 2016 88.5 78.9 76.2
2017 82.7 82.0 86.1
2015 81.4 84.6 79.1
5 2016 81.8 81.1 80.5
2017 82.0 78.9 78.6
2015 77.1 81.0 75.4
3-5 2016 84.4 80.2 78.8
August 15, 2017 Dallas ISD Evaluation & Assessment (Office of Institutional Research) rpt_STAAR38_E_read_obj 2017-18 Data Packet
13SIDNEY LANIER EXPRESSIVE ARTS VANGUARD (827)

FemaleMigrant MaleAt RiskWhiteAfricanAmer
HispanicEcon
DisadvSpecialEduc
LEP All DistrictYearGradeNumber Tested(All Students)
State of Texas Assessment of Academic Readiness 3-8 (English): WRITING
PERCENTAGE APPROACHED GRADE LEVEL STANDARD
3-8 (EN) Writing (1)
93.8 83.3
82.4 96.6
73.7 88.5
54.42017 * 92.3 82.4 86.7 78.6 86.5 5277.8
4
57.92015 * 93.3 92.6 88.6 * 91.3 4666.7
57.32016 100.0 85.7 78.1 84.8 90.0 82.2 4578.6
NUMBER TESTED IN GRADE 4
16 36
17 29
19 26
7,5302017 2 3413 45 14 5218
7,2152015 2 2715 35 2 466
7,2392016 6 327 33 10 4514
August 15, 2017 Dallas ISD Evaluation & Assessment (Office of Institutional Research) rpt_STAAR38_E_write_per_app 2017-18 Data Packet
14SIDNEY LANIER EXPRESSIVE ARTS VANGUARD (827)

FemaleMigrant MaleAt RiskWhiteAfricanAmer
HispanicEcon
DisadvSpecialEduc
LEP All DistrictYearGradeNumber Tested(All Students)
State of Texas Assessment of Academic Readiness 3-8 (English): WRITING
NUMBER NOT APPROACHED GRADE LEVEL STANDARD
3-8 (EN) Writing (2)
1 6
3 1
5 3
3,4352017 * 1 6 6 3 7 524
4
3,0412015 * 1 2 4 * 4 462
3,0902016 0 1 7 5 1 8 453
NUMBER TESTED IN GRADE 4
16 36
17 29
19 26
7,5302017 2 3413 45 14 5218
7,2152015 2 2715 35 2 466
7,2392016 6 327 33 10 4514
August 15, 2017 Dallas ISD Evaluation & Assessment (Office of Institutional Research) rpt_STAAR38_E_write_num_not_app 2017-18 Data Packet
15SIDNEY LANIER EXPRESSIVE ARTS VANGUARD (827)

FemaleMigrant MaleAt RiskWhiteAfricanAmer
HispanicEcon
DisadvSpecialEduc
LEP All DistrictYearGradeNumber Tested(All Students)
State of Texas Assessment of Academic Readiness 3-8 (English): WRITING
PERCENTAGE MET GRADE LEVEL STANDARD
3-8 (EN) Writing (3)
75.0 52.8
11.8 58.6
52.6 65.4
26.02017 * 46.2 61.8 57.8 50.0 59.6 5244.4
4
19.52015 * 40.0 40.7 40.0 * 41.3 4616.7
28.72016 100.0 57.1 53.1 60.6 60.0 60.0 4557.1
NUMBER TESTED IN GRADE 4
16 36
17 29
19 26
7,5302017 2 3413 45 14 5218
7,2152015 2 2715 35 2 466
7,2392016 6 327 33 10 4514
August 15, 2017 Dallas ISD Evaluation & Assessment (Office of Institutional Research) rpt_STAAR38_E_write_per_met 2017-18 Data Packet
16SIDNEY LANIER EXPRESSIVE ARTS VANGUARD (827)
FemaleMigrant MaleAt RiskWhiteAfricanAmer
HispanicEcon
DisadvSpecialEduc
LEP All DistrictYearGradeNumber Tested(All Students)
State of Texas Assessment of Academic Readiness 3-8 (English): WRITING
PERCENTAGE MASTERED GRADE LEVEL STANDARD
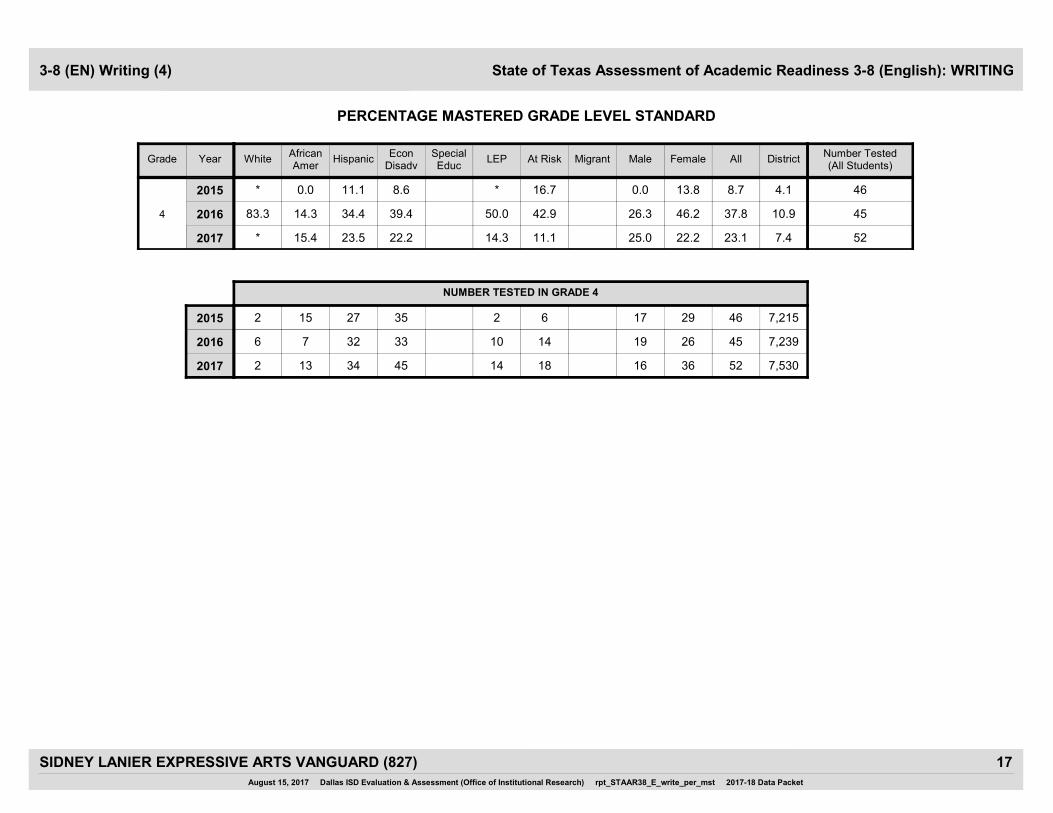
3-8 (EN) Writing (4)
25.0 22.2
0.0 13.8
26.3 46.2
7.42017 * 15.4 23.5 22.2 14.3 23.1 5211.1
4
4.12015 * 0.0 11.1 8.6 * 8.7 4616.7
10.92016 83.3 14.3 34.4 39.4 50.0 37.8 4542.9
NUMBER TESTED IN GRADE 4
16 36
17 29
19 26
7,5302017 2 3413 45 14 5218
7,2152015 2 2715 35 2 466
7,2392016 6 327 33 10 4514
August 15, 2017 Dallas ISD Evaluation & Assessment (Office of Institutional Research) rpt_STAAR38_E_write_per_mst 2017-18 Data Packet
17SIDNEY LANIER EXPRESSIVE ARTS VANGUARD (827)
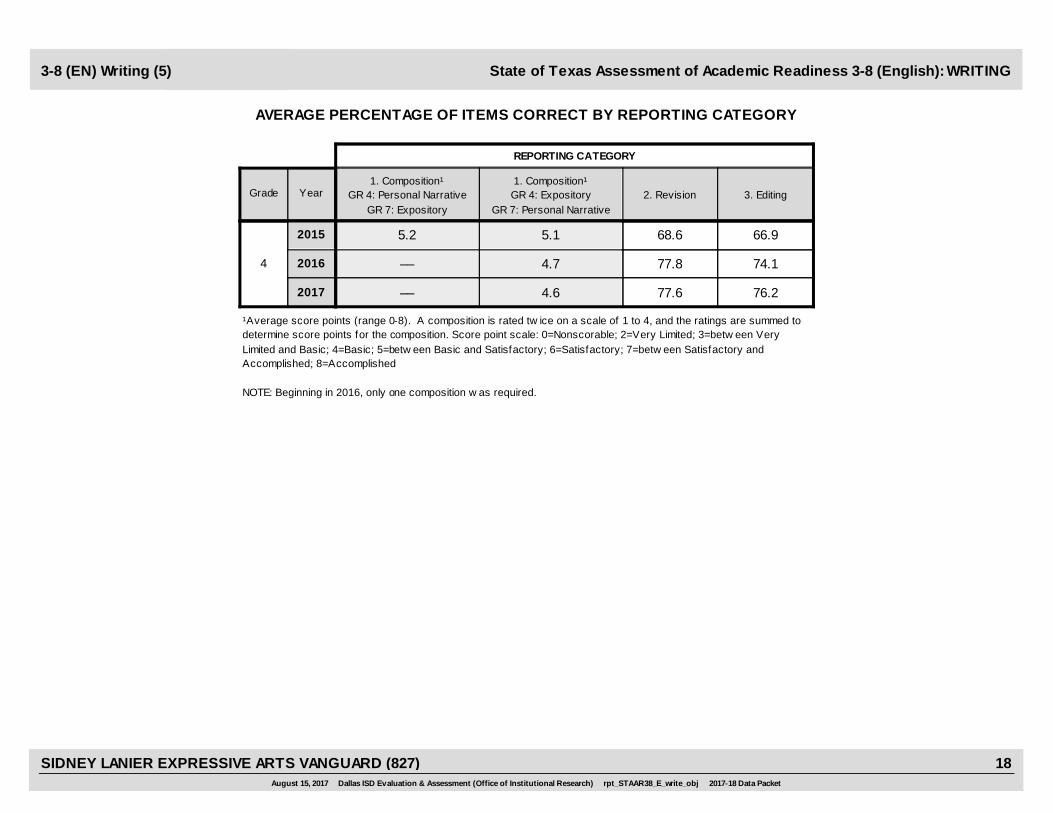
1. Composition¹GR 4: Expository
GR 7: Personal Narrative
1. Composition¹GR 4: Personal Narrative
GR 7: Expository2. Revision 3. EditingYearGrade
REPORTING CATEGORY
State of Texas Assessment of Academic Readiness 3-8 (English): WRITING
AVERAGE PERCENTAGE OF ITEMS CORRECT BY REPORTING CATEGORY
3-8 (EN) Writing (5)
4.6
5.1
4.7
2017 –– 77.6 76.2
2015 5.2 68.6 66.9
4 2016 –– 77.8 74.1
¹Average score points (range 0-8). A composition is rated tw ice on a scale of 1 to 4, and the ratings are summed to determine score points for the composition. Score point scale: 0=Nonscorable; 2=Very Limited; 3=betw een Very Limited and Basic; 4=Basic; 5=betw een Basic and Satisfactory; 6=Satisfactory; 7=betw een Satisfactory and Accomplished; 8=Accomplished
NOTE: Beginning in 2016, only one composition w as required.
August 15, 2017 Dallas ISD Evaluation & Assessment (Office of Institutional Research) rpt_STAAR38_E_write_obj 2017-18 Data Packet
18SIDNEY LANIER EXPRESSIVE ARTS VANGUARD (827)
FemaleMigrant MaleAt RiskWhiteAfricanAmer
HispanicEcon
DisadvSpecialEduc
LEP All DistrictYearGradeNumber Tested(All Students)
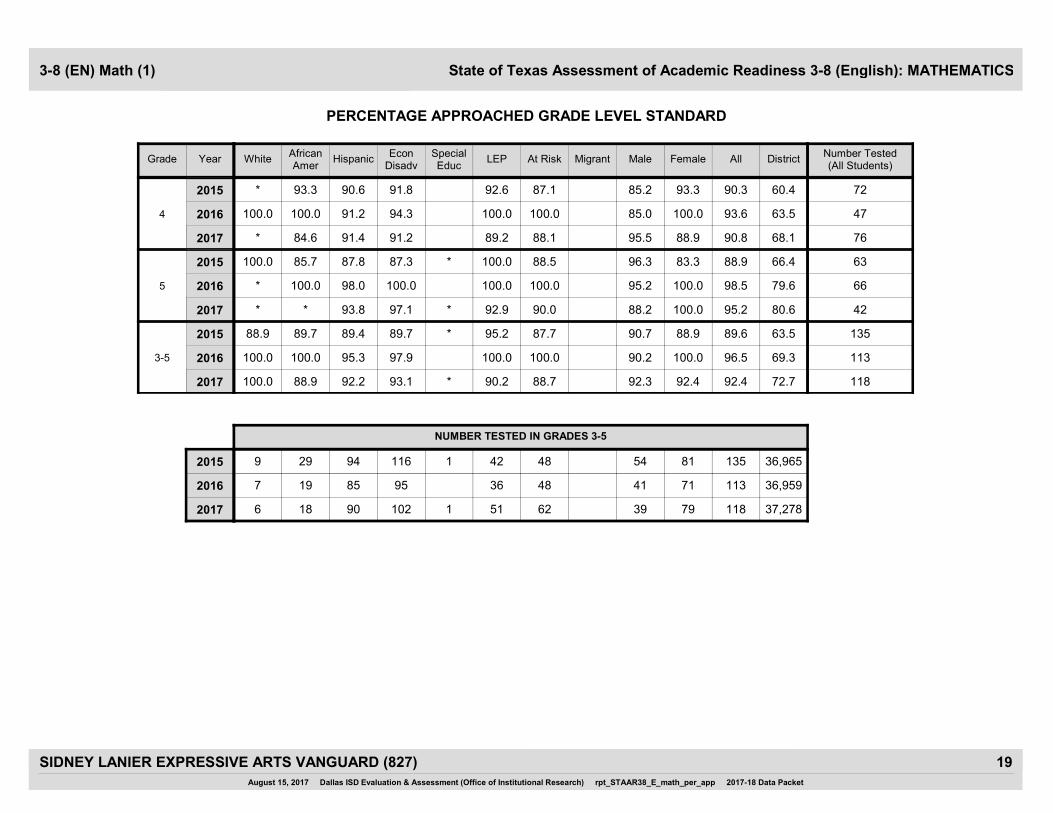
State of Texas Assessment of Academic Readiness 3-8 (English): MATHEMATICS
PERCENTAGE APPROACHED GRADE LEVEL STANDARD
3-8 (EN) Math (1)
95.5 88.9
85.2 93.3
85.0 100.0
68.12017 * 84.6 91.4 91.2 89.2 90.8 7688.1
4
60.42015 * 93.3 90.6 91.8 92.6 90.3 7287.1
63.52016 100.0 100.0 91.2 94.3 100.0 93.6 47100.0
88.2 100.0
96.3 83.3
95.2 100.0
80.62017 * * 93.8 97.1 * 92.9 95.2 4290.0
5
66.42015 100.0 85.7 87.8 87.3 * 100.0 88.9 6388.5
79.62016 * 100.0 98.0 100.0 100.0 98.5 66100.0
92.3 92.4
90.7 88.9
90.2 100.0
72.72017 100.0 88.9 92.2 93.1 * 90.2 92.4 11888.7
3-5
63.52015 88.9 89.7 89.4 89.7 * 95.2 89.6 13587.7
69.32016 100.0 100.0 95.3 97.9 100.0 96.5 113100.0
39 79
54 81
41 71
37,2782017 6 9018 102 1 51 11862
36,9652015 9 9429 116 1 42 13548
NUMBER TESTED IN GRADES 3-5
36,9592016 7 8519 95 36 11348
August 15, 2017 Dallas ISD Evaluation & Assessment (Office of Institutional Research) rpt_STAAR38_E_math_per_app 2017-18 Data Packet
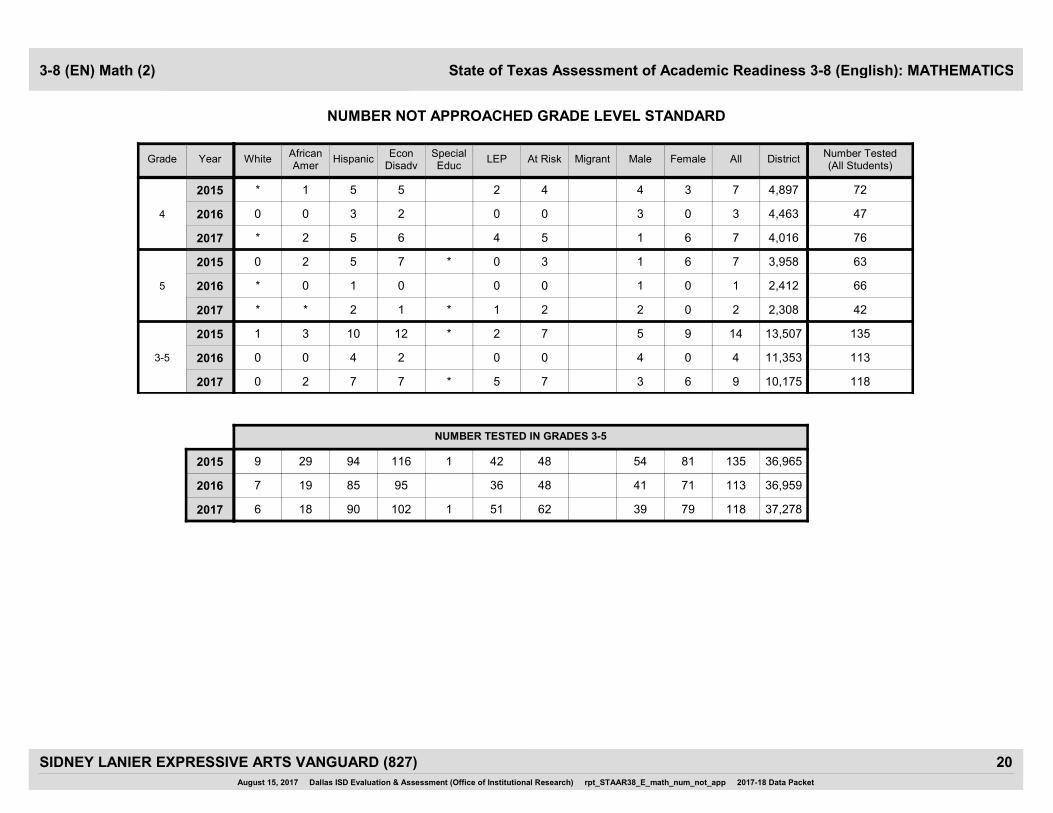
19SIDNEY LANIER EXPRESSIVE ARTS VANGUARD (827)
FemaleMigrant MaleAt RiskWhiteAfricanAmer
HispanicEcon
DisadvSpecialEduc
LEP All DistrictYearGradeNumber Tested(All Students)
State of Texas Assessment of Academic Readiness 3-8 (English): MATHEMATICS
NUMBER NOT APPROACHED GRADE LEVEL STANDARD
3-8 (EN) Math (2)
1 6
4 3
3 0
4,0162017 * 2 5 6 4 7 765
4
4,8972015 * 1 5 5 2 7 724
4,4632016 0 0 3 2 0 3 470
2 0
1 6
1 0
2,3082017 * * 2 1 * 1 2 422
5
3,9582015 0 2 5 7 * 0 7 633
2,4122016 * 0 1 0 0 1 660
3 6
5 9
4 0
10,1752017 0 2 7 7 * 5 9 1187
3-5
13,5072015 1 3 10 12 * 2 14 1357
11,3532016 0 0 4 2 0 4 1130
NUMBER TESTED IN GRADES 3-5
39 79
54 81
41 71
37,2782017 6 9018 102 1 51 11862
36,9652015 9 9429 116 1 42 13548
36,9592016 7 8519 95 36 11348
August 15, 2017 Dallas ISD Evaluation & Assessment (Office of Institutional Research) rpt_STAAR38_E_math_num_not_app 2017-18 Data Packet
20SIDNEY LANIER EXPRESSIVE ARTS VANGUARD (827)
FemaleMigrant MaleAt RiskWhiteAfricanAmer
HispanicEcon
DisadvSpecialEduc
LEP All DistrictYearGradeNumber Tested(All Students)
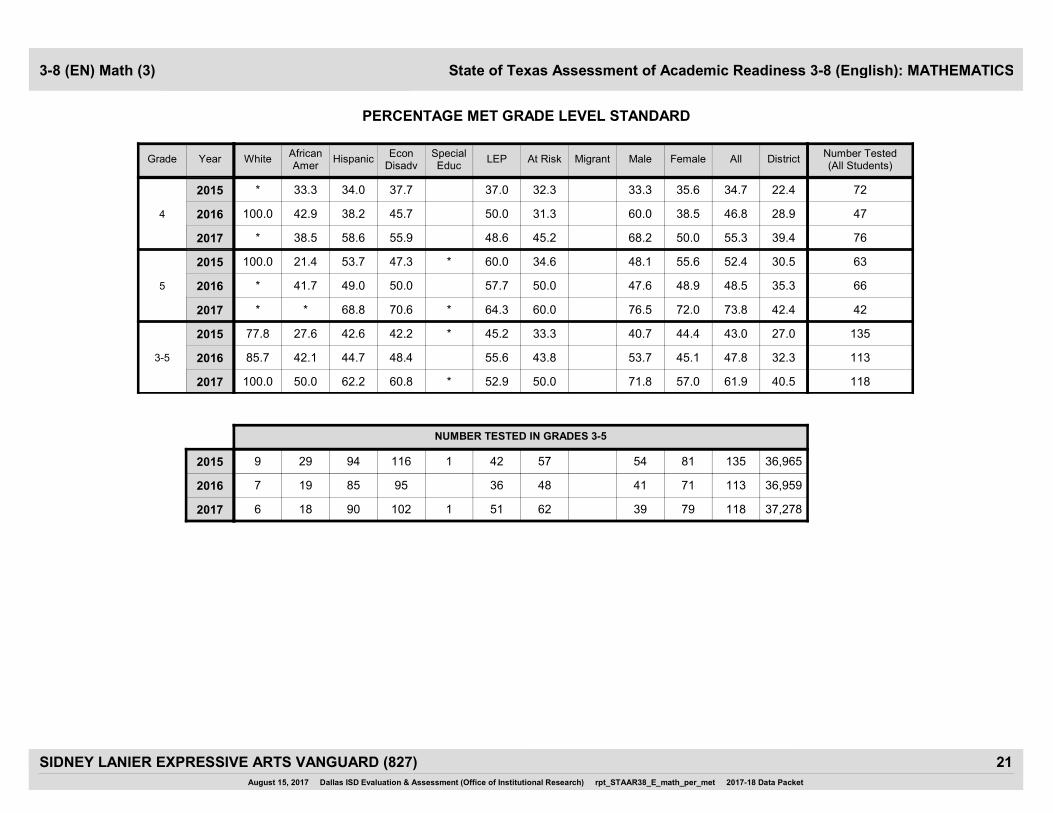
State of Texas Assessment of Academic Readiness 3-8 (English): MATHEMATICS
PERCENTAGE MET GRADE LEVEL STANDARD
3-8 (EN) Math (3)
68.2 50.0
33.3 35.6
60.0 38.5
39.42017 * 38.5 58.6 55.9 48.6 55.3 7645.2
4
22.42015 * 33.3 34.0 37.7 37.0 34.7 7232.3
28.92016 100.0 42.9 38.2 45.7 50.0 46.8 4731.3
76.5 72.0
48.1 55.6
47.6 48.9
42.42017 * * 68.8 70.6 * 64.3 73.8 4260.0
5
30.52015 100.0 21.4 53.7 47.3 * 60.0 52.4 6334.6
35.32016 * 41.7 49.0 50.0 57.7 48.5 6650.0
71.8 57.0
40.7 44.4
53.7 45.1
40.52017 100.0 50.0 62.2 60.8 * 52.9 61.9 11850.0
3-5
27.02015 77.8 27.6 42.6 42.2 * 45.2 43.0 13533.3
32.32016 85.7 42.1 44.7 48.4 55.6 47.8 11343.8
39 79
54 81
41 71
37,2782017 6 9018 102 1 51 11862
36,9652015 9 9429 116 1 42 13557
NUMBER TESTED IN GRADES 3-5
36,9592016 7 8519 95 36 11348
August 15, 2017 Dallas ISD Evaluation & Assessment (Office of Institutional Research) rpt_STAAR38_E_math_per_met 2017-18 Data Packet
21SIDNEY LANIER EXPRESSIVE ARTS VANGUARD (827)
FemaleMigrant MaleAt RiskWhiteAfricanAmer
HispanicEcon
DisadvSpecialEduc
LEP All DistrictYearGradeNumber Tested(All Students)
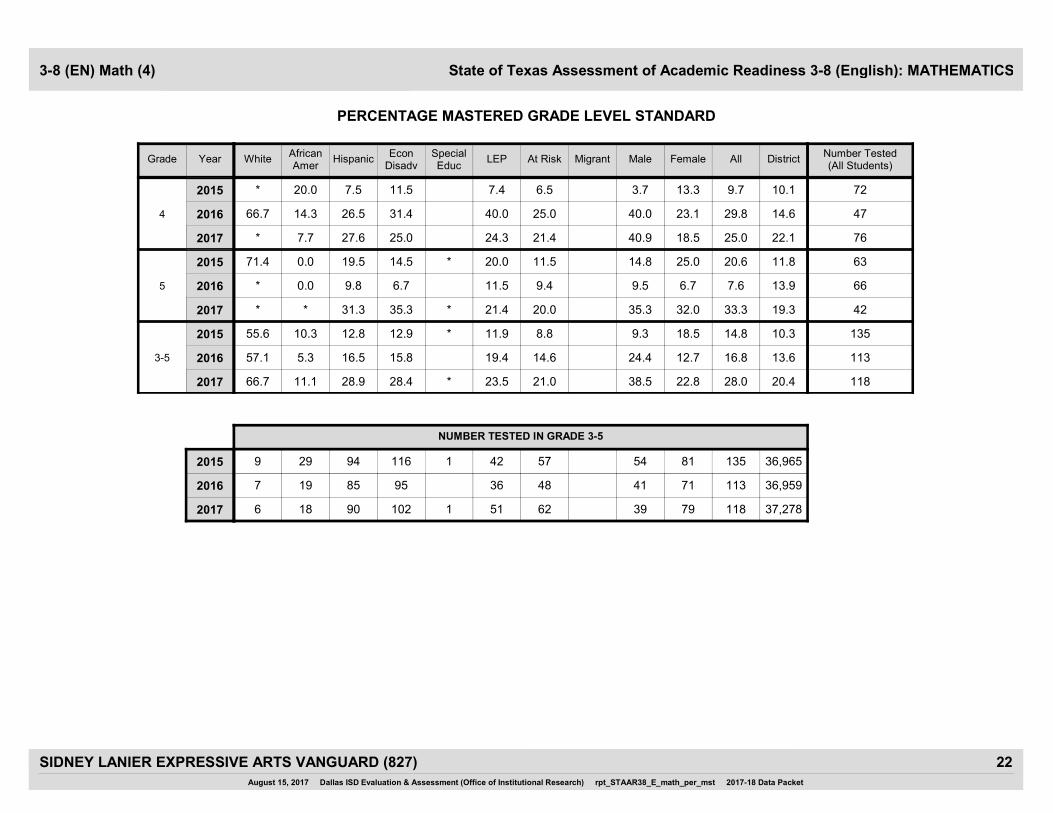
State of Texas Assessment of Academic Readiness 3-8 (English): MATHEMATICS
PERCENTAGE MASTERED GRADE LEVEL STANDARD
3-8 (EN) Math (4)
40.9 18.5
3.7 13.3
40.0 23.1
22.12017 * 7.7 27.6 25.0 24.3 25.0 7621.4
4
10.12015 * 20.0 7.5 11.5 7.4 9.7 726.5
14.62016 66.7 14.3 26.5 31.4 40.0 29.8 4725.0
35.3 32.0
14.8 25.0
9.5 6.7
19.32017 * * 31.3 35.3 * 21.4 33.3 4220.0
5
11.82015 71.4 0.0 19.5 14.5 * 20.0 20.6 6311.5
13.92016 * 0.0 9.8 6.7 11.5 7.6 669.4
38.5 22.8
9.3 18.5
24.4 12.7
20.42017 66.7 11.1 28.9 28.4 * 23.5 28.0 11821.0
3-5
10.32015 55.6 10.3 12.8 12.9 * 11.9 14.8 1358.8
13.62016 57.1 5.3 16.5 15.8 19.4 16.8 11314.6
NUMBER TESTED IN GRADE 3-5
39 79
54 81
41 71
37,2782017 6 9018 102 1 51 11862
36,9652015 9 9429 116 1 42 13557
36,9592016 7 8519 95 36 11348
August 15, 2017 Dallas ISD Evaluation & Assessment (Office of Institutional Research) rpt_STAAR38_E_math_per_mst 2017-18 Data Packet
22SIDNEY LANIER EXPRESSIVE ARTS VANGUARD (827)
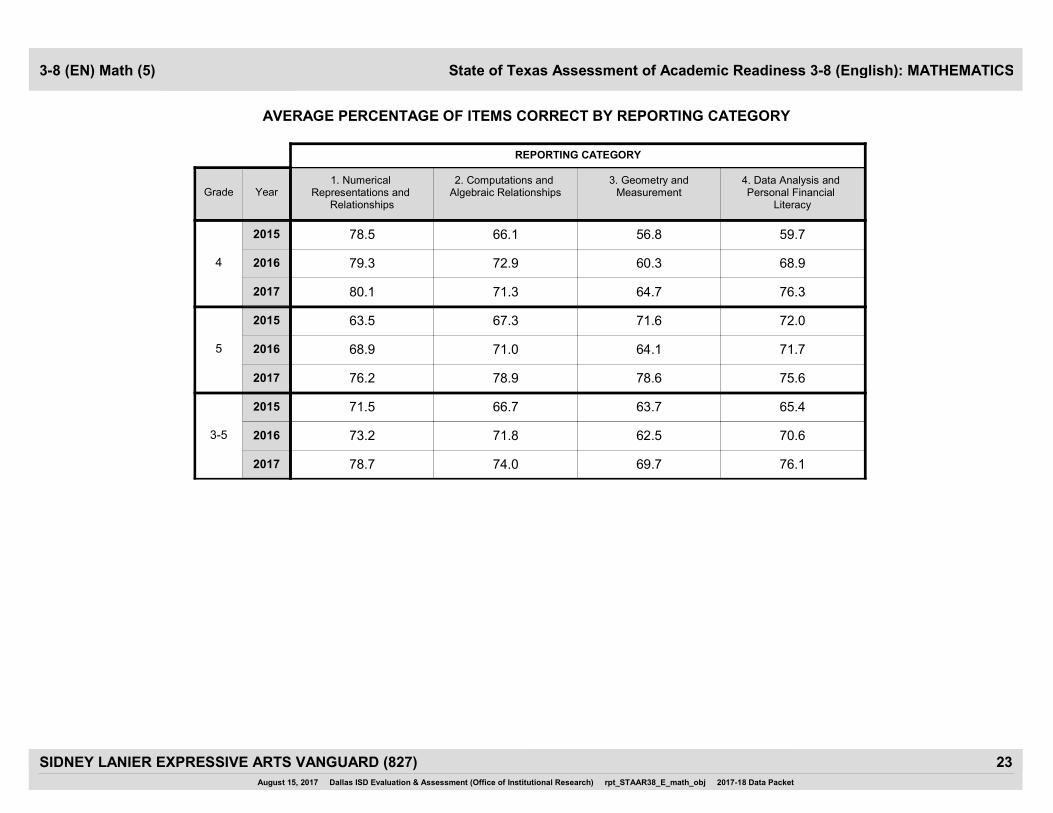
1. Numerical Representations and
Relationships
2. Computations and Algebraic Relationships
3. Geometry andMeasurement
4. Data Analysis and Personal Financial
Literacy
YearGrade
REPORTING CATEGORY
State of Texas Assessment of Academic Readiness 3-8 (English): MATHEMATICS
AVERAGE PERCENTAGE OF ITEMS CORRECT BY REPORTING CATEGORY
3-8 (EN) Math (5)
2017 80.1 71.3 64.7 76.3
2015 78.5 66.1 56.8 59.7
4 2016 79.3 72.9 60.3 68.9
2017 76.2 78.9 78.6 75.6
2015 63.5 67.3 71.6 72.0
5 2016 68.9 71.0 64.1 71.7
2017 78.7 74.0 69.7 76.1
2015 71.5 66.7 63.7 65.4
3-5 2016 73.2 71.8 62.5 70.6
August 15, 2017 Dallas ISD Evaluation & Assessment (Office of Institutional Research) rpt_STAAR38_E_math_obj 2017-18 Data Packet
23SIDNEY LANIER EXPRESSIVE ARTS VANGUARD (827)

FemaleMigrant MaleAt RiskWhiteAfricanAmer
HispanicEcon
DisadvSpecialEduc
LEP All DistrictYearGradeNumber Tested(All Students)
State of Texas Assessment of Academic Readiness 3-8 (English): SCIENCE
PERCENTAGE APPROACHED GRADE LEVEL STANDARD
3-8 (EN) Science (1)
88.2 92.0
80.8 75.0
100.0 84.4
65.92017 * * 90.6 94.1 * 92.9 90.5 4285.0
5
57.12015 100.0 64.3 77.5 74.1 * 78.6 77.4 6268.0
66.12016 * 91.7 88.2 88.3 84.6 89.4 6681.3
NUMBER TESTED IN GRADE 5
17 25
26 36
21 45
9,7592017 4 325 34 1 14 4220
9,4532015 7 4014 54 1 14 6225
9,6262016 1 5112 60 26 6632
August 15, 2017 Dallas ISD Evaluation & Assessment (Office of Institutional Research) rpt_STAAR38_E_sc_per_app 2017-18 Data Packet
24SIDNEY LANIER EXPRESSIVE ARTS VANGUARD (827)

FemaleMigrant MaleAt RiskWhiteAfricanAmer
HispanicEcon
DisadvSpecialEduc
LEP All DistrictYearGradeNumber Tested(All Students)
State of Texas Assessment of Academic Readiness 3-8 (English): SCIENCE
NUMBER NOT APPROACHED GRADE LEVEL STANDARD
3-8 (EN) Science (2)
2 2
5 9
0 7
33282017 * * 3 2 * 1 4 423
5
40592015 0 5 9 14 * 3 14 628
32632016 * 1 6 7 4 7 666
NUMBER TESTED IN GRADE 5
17 25
26 36
21 45
9,7592017 4 325 34 1 14 4220
9,4532015 7 4014 54 1 14 6225
9,6262016 1 5112 60 26 6632
August 15, 2017 Dallas ISD Evaluation & Assessment (Office of Institutional Research) rpt_STAAR38_E_sc_num_not_app 2017-18 Data Packet
25SIDNEY LANIER EXPRESSIVE ARTS VANGUARD (827)

FemaleMigrant MaleAt RiskWhiteAfricanAmer
HispanicEcon
DisadvSpecialEduc
LEP All DistrictYearGradeNumber Tested(All Students)
State of Texas Assessment of Academic Readiness 3-8 (English): SCIENCE
PERCENTAGE MET GRADE LEVEL STANDARD
3-8 (EN) Science (3)
58.8 44.0
23.1 38.9
28.6 44.4
33.02017 * * 46.9 47.1 * 42.9 50.0 4230.0
5
21.82015 100.0 14.3 25.0 24.1 * 14.3 32.3 628.0
26.72016 * 41.7 35.3 36.7 23.1 39.4 6621.9
NUMBER TESTED IN GRADE 5
17 25
26 36
21 45
9,7592017 4 325 34 1 14 4220
9,4532015 7 4014 54 1 14 6225
9,6262016 1 5112 60 26 6632
August 15, 2017 Dallas ISD Evaluation & Assessment (Office of Institutional Research) rpt_STAAR38_E_sc_per_met 2017-18 Data Packet
26SIDNEY LANIER EXPRESSIVE ARTS VANGUARD (827)

FemaleMigrant MaleAt RiskWhiteAfricanAmer
HispanicEcon
DisadvSpecialEduc
LEP All DistrictYearGradeNumber Tested(All Students)
State of Texas Assessment of Academic Readiness 3-8 (English): SCIENCE
PERCENTAGE MASTERED GRADE LEVEL STANDARD
3-8 (EN) Science (4)
11.8 8.0
11.5 8.3
4.8 8.9
12.82017 * * 6.3 8.8 * 0.0 9.5 420.0
5
6.32015 42.9 7.1 5.0 3.7 * 0.0 9.7 620.0
6.72016 * 8.3 5.9 5.0 3.8 7.6 663.1
NUMBER TESTED IN GRADE 5
17 25
26 36
21 45
9,7592017 4 325 34 1 14 4220
9,4532015 7 4014 54 1 14 6225
9,6262016 1 5112 60 26 6632
August 15, 2017 Dallas ISD Evaluation & Assessment (Office of Institutional Research) rpt_STAAR38_E_sc_per_mst 2017-18 Data Packet
27SIDNEY LANIER EXPRESSIVE ARTS VANGUARD (827)
1. Matter and Energy2. Force, Motion,
and Energy3. Earth and Space
4. Organisms andEnvironments
YearGrade
REPORTING CATEGORY
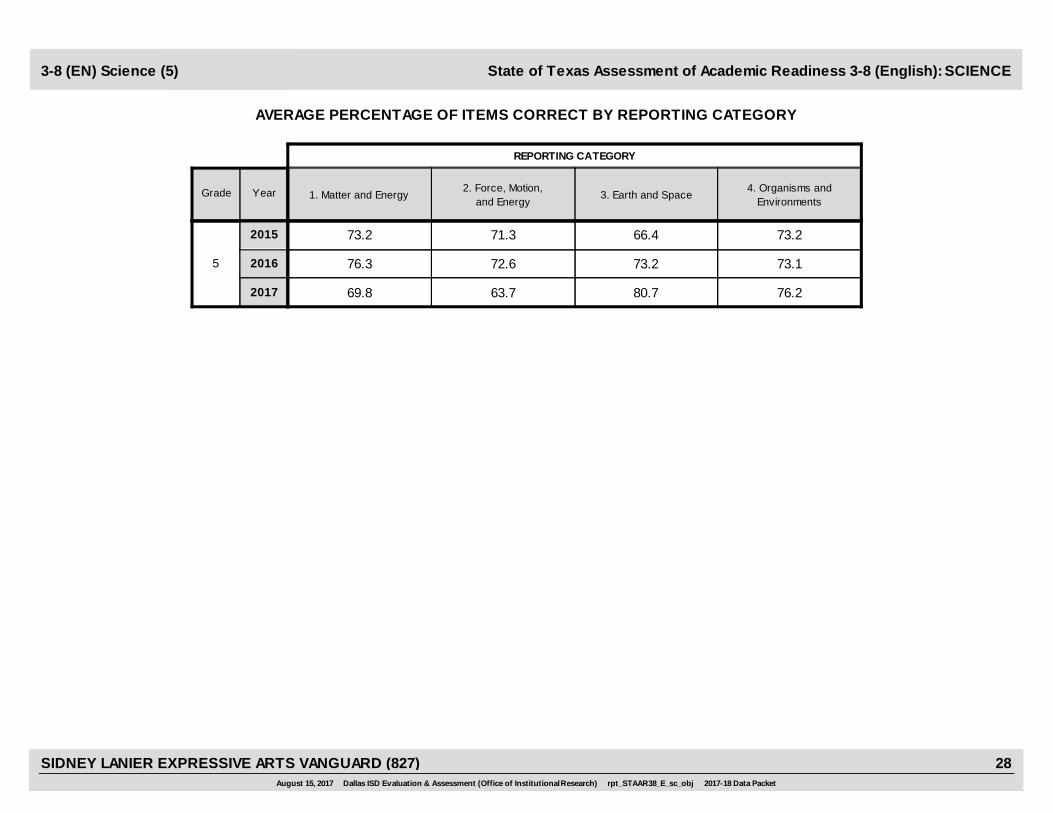
State of Texas Assessment of Academic Readiness 3-8 (English): SCIENCE
AVERAGE PERCENTAGE OF ITEMS CORRECT BY REPORTING CATEGORY
3-8 (EN) Science (5)
2017 69.8 63.7 80.7 76.2
2015 73.2 71.3 66.4 73.2
5 2016 76.3 72.6 73.2 73.1
August 15, 2017 Dallas ISD Evaluation & Assessment (Office of Institutional Research) rpt_STAAR38_E_sc_obj 2017-18 Data Packet
28SIDNEY LANIER EXPRESSIVE ARTS VANGUARD (827)
FemaleMigrant MaleAt RiskWhiteAfricanAmer
HispanicEcon
DisadvSpecialEduc
LEP All DistrictYearGradeNumber Tested(All Students)
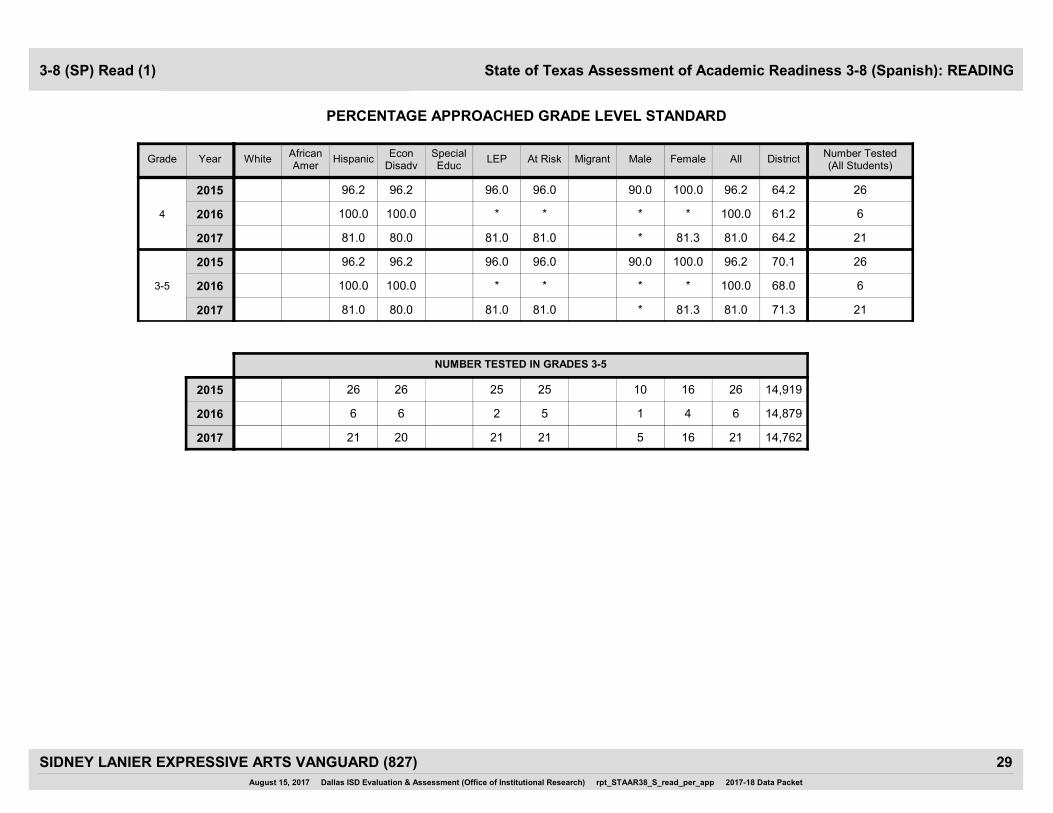
State of Texas Assessment of Academic Readiness 3-8 (Spanish): READING
PERCENTAGE APPROACHED GRADE LEVEL STANDARD
3-8 (SP) Read (1)
* 81.3
90.0 100.0
* *
64.22017 81.0 80.0 81.0 81.0 2181.0
4
64.22015 96.2 96.2 96.0 96.2 2696.0
61.22016 100.0 100.0 * 100.0 6*
* 81.3
90.0 100.0
* *
71.32017 81.0 80.0 81.0 81.0 2181.0
3-5
70.12015 96.2 96.2 96.0 96.2 2696.0
68.02016 100.0 100.0 * 100.0 6*
NUMBER TESTED IN GRADES 3-5
5 16
10 16
1 4
14,7622017 21 20 21 2121
14,9192015 26 26 25 2625
14,8792016 6 6 2 65
August 15, 2017 Dallas ISD Evaluation & Assessment (Office of Institutional Research) rpt_STAAR38_S_read_per_app 2017-18 Data Packet
29SIDNEY LANIER EXPRESSIVE ARTS VANGUARD (827)
FemaleMigrant MaleAt RiskWhiteAfricanAmer
HispanicEcon
DisadvSpecialEduc
LEP All DistrictYearGradeNumber Tested(All Students)
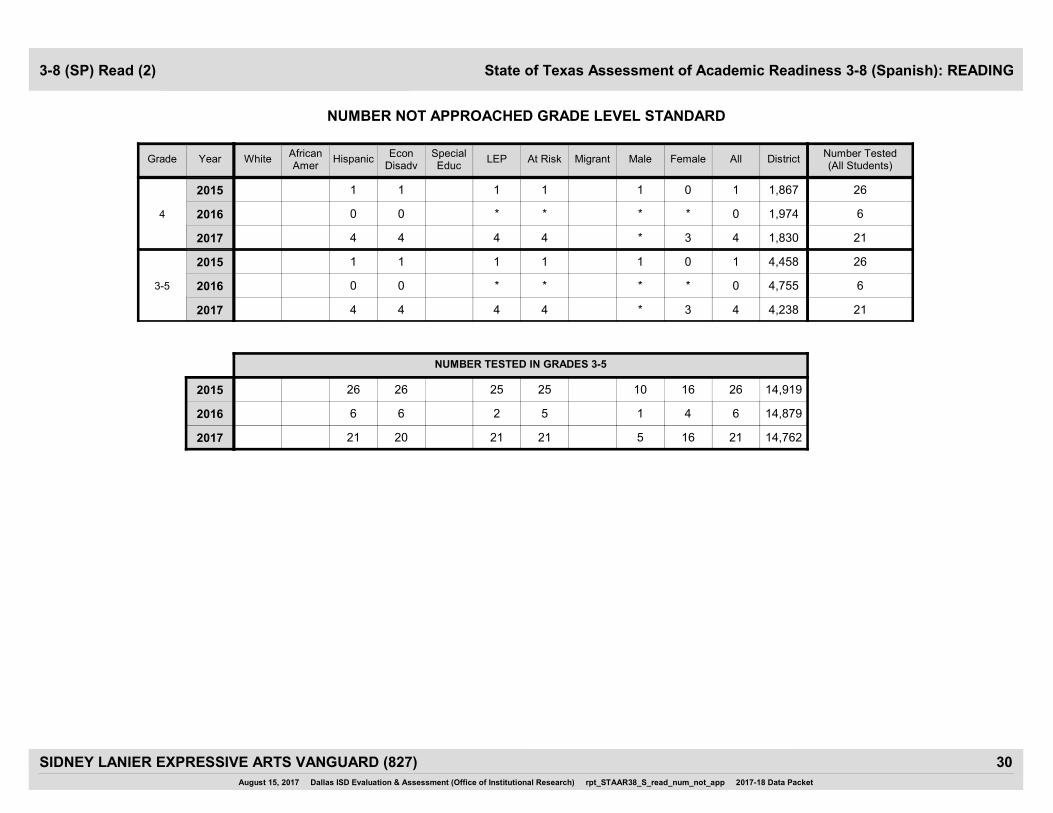
State of Texas Assessment of Academic Readiness 3-8 (Spanish): READING
NUMBER NOT APPROACHED GRADE LEVEL STANDARD
3-8 (SP) Read (2)
* 3
1 0
* *
1,8302017 4 4 4 4 214
4
1,8672015 1 1 1 1 261
1,9742016 0 0 * 0 6*
* 3
1 0
* *
4,2382017 4 4 4 4 214
3-5
4,4582015 1 1 1 1 261
4,7552016 0 0 * 0 6*
NUMBER TESTED IN GRADES 3-5
5 16
10 16
1 4
14,7622017 21 20 21 2121
14,9192015 26 26 25 2625
14,8792016 6 6 2 65
August 15, 2017 Dallas ISD Evaluation & Assessment (Office of Institutional Research) rpt_STAAR38_S_read_num_not_app 2017-18 Data Packet
30SIDNEY LANIER EXPRESSIVE ARTS VANGUARD (827)

FemaleMigrant MaleAt RiskWhiteAfricanAmer
HispanicEcon
DisadvSpecialEduc
LEP All DistrictYearGradeNumber Tested(All Students)
State of Texas Assessment of Academic Readiness 3-8 (Spanish): READING
PERCENTAGE MET GRADE LEVEL STANDARD
3-8 (SP) Read (3)
* 62.5
40.0 43.8
* *
36.02017 52.4 50.0 52.4 52.4 2152.4
4
29.82015 42.3 42.3 44.0 42.3 2644.0
35.52016 100.0 100.0 * 100.0 6*
* 62.5
40.0 43.8
* *
40.82017 52.4 50.0 52.4 52.4 2152.4
3-5
32.52015 42.3 42.3 44.0 42.3 2644.0
38.22016 100.0 100.0 * 100.0 6*
NUMBER TESTED IN GRADES 3-5
5 16
10 16
1 4
14,7622017 21 20 21 2121
14,9192015 26 26 25 2625
14,8792016 6 6 2 65
August 15, 2017 Dallas ISD Evaluation & Assessment (Office of Institutional Research) rpt_STAAR38_S_read_per_met 2017-18 Data Packet
31SIDNEY LANIER EXPRESSIVE ARTS VANGUARD (827)
FemaleMigrant MaleAt RiskWhiteAfricanAmer
HispanicEcon
DisadvSpecialEduc
LEP All DistrictYearGradeNumber Tested(All Students)
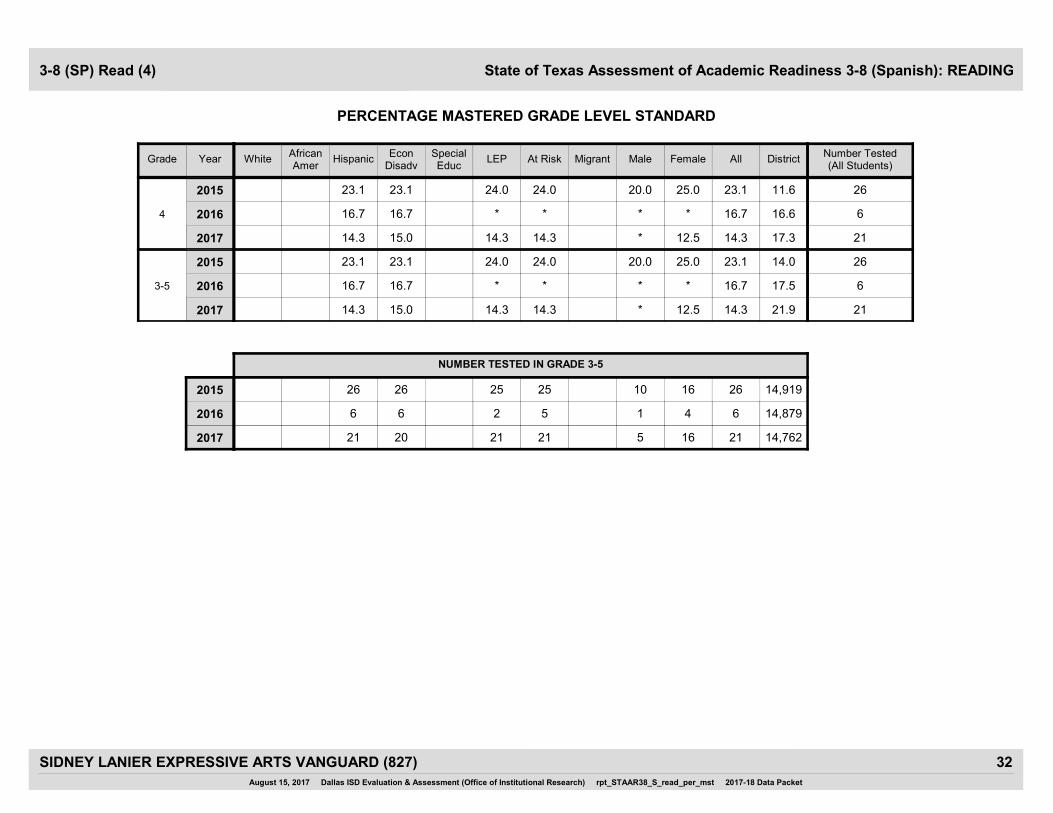
State of Texas Assessment of Academic Readiness 3-8 (Spanish): READING
PERCENTAGE MASTERED GRADE LEVEL STANDARD
3-8 (SP) Read (4)
* 12.5
20.0 25.0
* *
17.32017 14.3 15.0 14.3 14.3 2114.3
4
11.62015 23.1 23.1 24.0 23.1 2624.0
16.62016 16.7 16.7 * 16.7 6*
* 12.5
20.0 25.0
* *
21.92017 14.3 15.0 14.3 14.3 2114.3
3-5
14.02015 23.1 23.1 24.0 23.1 2624.0
17.52016 16.7 16.7 * 16.7 6*
NUMBER TESTED IN GRADE 3-5
5 16
10 16
1 4
14,7622017 21 20 21 2121
14,9192015 26 26 25 2625
14,8792016 6 6 2 65
August 15, 2017 Dallas ISD Evaluation & Assessment (Office of Institutional Research) rpt_STAAR38_S_read_per_mst 2017-18 Data Packet
32SIDNEY LANIER EXPRESSIVE ARTS VANGUARD (827)
1. Understanding Across Genres 2. Understanding/Analysisof Literary Texts
3. Understanding/Analysisof Informational Texts
YearGrade
REPORTING CATEGORY
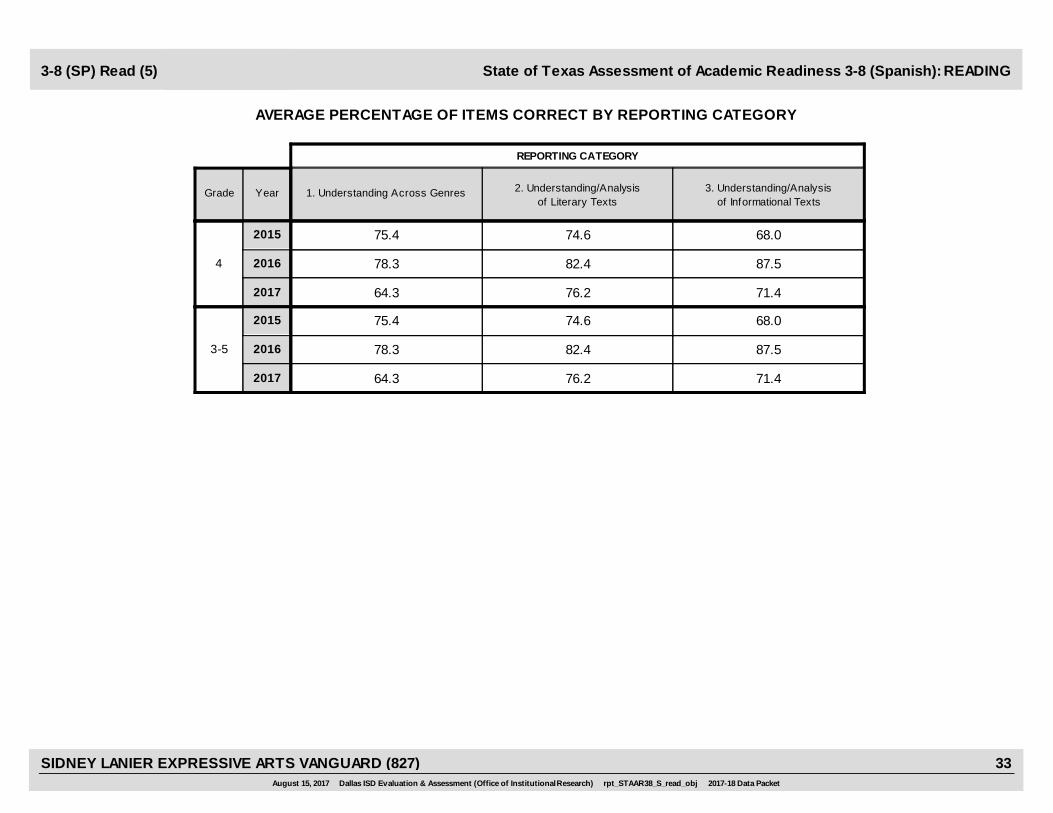
State of Texas Assessment of Academic Readiness 3-8 (Spanish): READING
AVERAGE PERCENTAGE OF ITEMS CORRECT BY REPORTING CATEGORY
3-8 (SP) Read (5)
2017 64.3 76.2 71.4
2015 75.4 74.6 68.0
4 2016 78.3 82.4 87.5
2017 64.3 76.2 71.4
2015 75.4 74.6 68.0
3-5 2016 78.3 82.4 87.5
August 15, 2017 Dallas ISD Evaluation & Assessment (Office of Institutional Research) rpt_STAAR38_S_read_obj 2017-18 Data Packet
33SIDNEY LANIER EXPRESSIVE ARTS VANGUARD (827)

FemaleMigrant MaleAt RiskWhiteAfricanAmer
HispanicEcon
DisadvSpecialEduc
LEP All DistrictYearGradeNumber Tested(All Students)
State of Texas Assessment of Academic Readiness 3-8 (Spanish): WRITING
PERCENTAGE APPROACHED GRADE LEVEL STANDARD
3-8 (SP) Writing (1)
66.7 88.9
90.0 81.3
*
70.32017 83.3 82.6 82.6 83.3 2483.3
4
67.92015 84.6 84.6 84.0 84.6 2684.0
71.72016 * * * * 3*
NUMBER TESTED IN GRADE 4
6 18
10 16
2
5,2072017 24 23 23 2424
5,2472015 26 26 25 2625
5,1162016 3 3 2 33
August 15, 2017 Dallas ISD Evaluation & Assessment (Office of Institutional Research) rpt_STAAR38_S_write_per_app 2017-18 Data Packet
34SIDNEY LANIER EXPRESSIVE ARTS VANGUARD (827)

FemaleMigrant MaleAt RiskWhiteAfricanAmer
HispanicEcon
DisadvSpecialEduc
LEP All DistrictYearGradeNumber Tested(All Students)
State of Texas Assessment of Academic Readiness 3-8 (Spanish): WRITING
NUMBER NOT APPROACHED GRADE LEVEL STANDARD
3-8 (SP) Writing (2)
2 2
1 3
*
1,5482017 4 4 4 4 244
4
1,6852015 4 4 4 4 264
1,4492016 * * * * 3*
NUMBER TESTED IN GRADE 4
6 18
10 16
2
5,2072017 24 23 23 2424
5,2472015 26 26 25 2625
5,1162016 3 3 2 33
August 15, 2017 Dallas ISD Evaluation & Assessment (Office of Institutional Research) rpt_STAAR38_S_write_num_not_app 2017-18 Data Packet
SIDNEY LANIER EXPRESSIVE ARTS VANGUARD (827) 35
FemaleMigrant MaleAt RiskWhiteAfricanAmer
HispanicEcon
DisadvSpecialEduc
LEP All DistrictYearGradeNumber Tested(All Students)
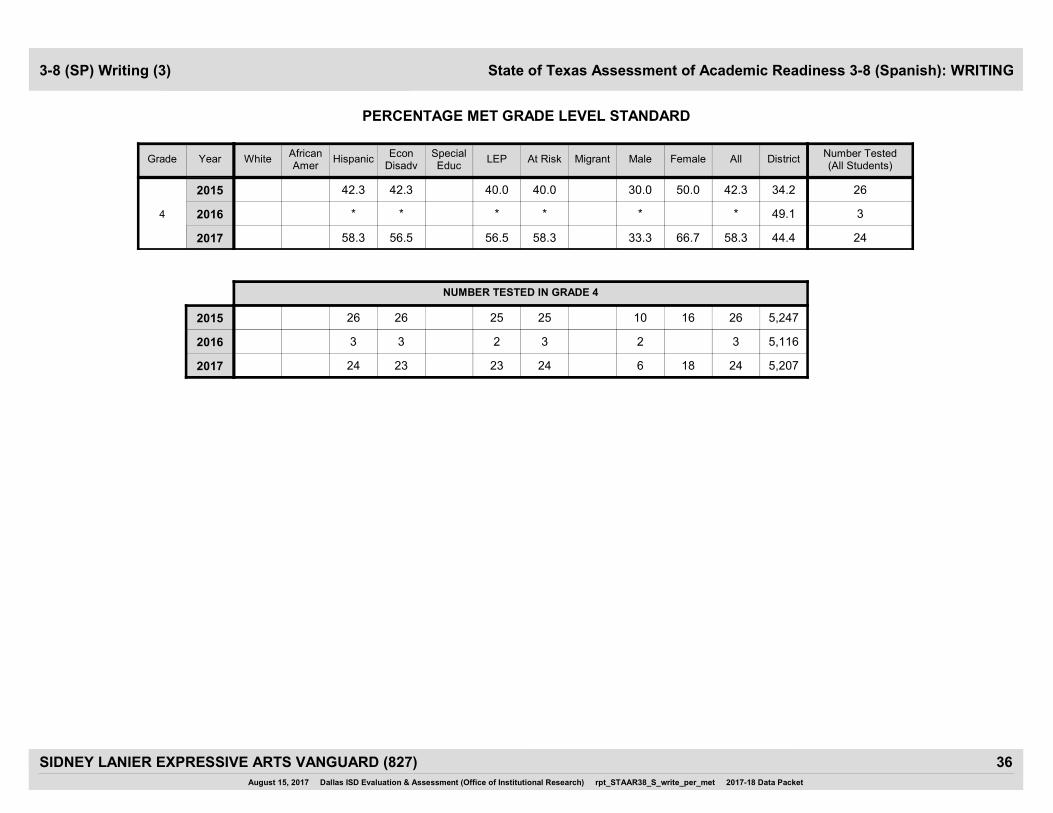
State of Texas Assessment of Academic Readiness 3-8 (Spanish): WRITING
PERCENTAGE MET GRADE LEVEL STANDARD
3-8 (SP) Writing (3)
33.3 66.7
30.0 50.0
*
44.42017 58.3 56.5 56.5 58.3 2458.3
4
34.22015 42.3 42.3 40.0 42.3 2640.0
49.12016 * * * * 3*
NUMBER TESTED IN GRADE 4
6 18
10 16
2
5,2072017 24 23 23 2424
5,2472015 26 26 25 2625
5,1162016 3 3 2 33
August 15, 2017 Dallas ISD Evaluation & Assessment (Office of Institutional Research) rpt_STAAR38_S_write_per_met 2017-18 Data Packet
36SIDNEY LANIER EXPRESSIVE ARTS VANGUARD (827)
FemaleMigrant MaleAt RiskWhiteAfricanAmer
HispanicEcon
DisadvSpecialEduc
LEP All DistrictYearGradeNumber Tested(All Students)
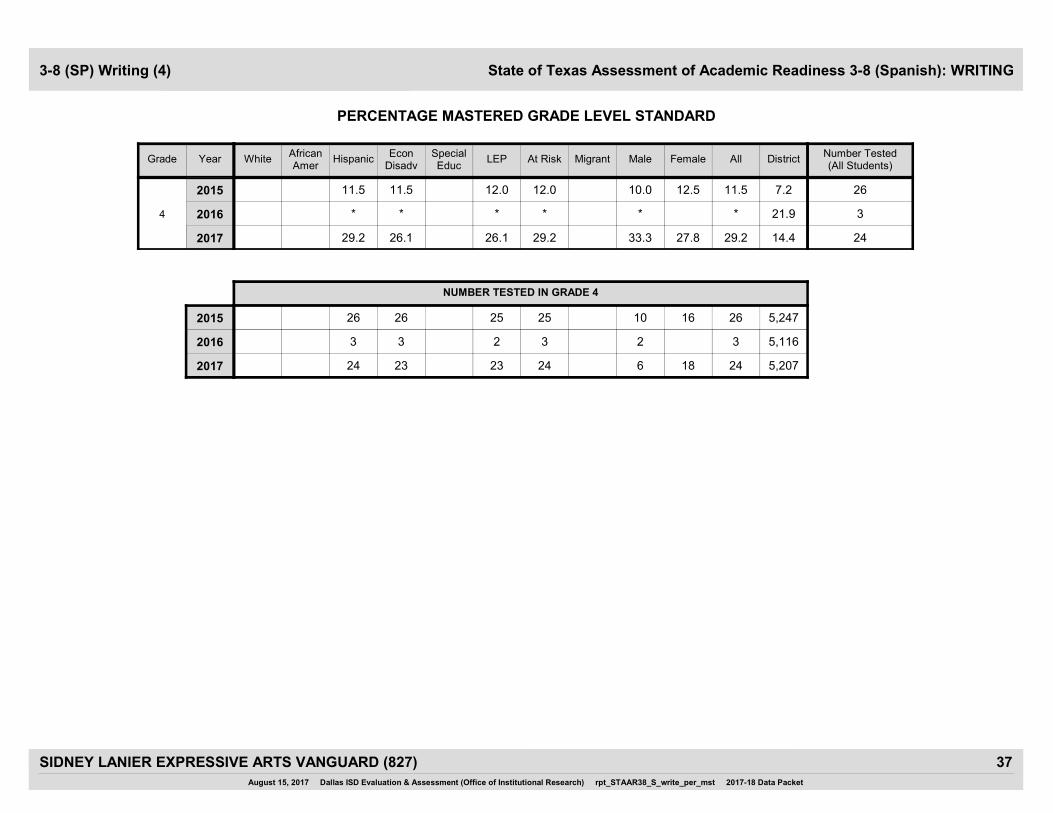
State of Texas Assessment of Academic Readiness 3-8 (Spanish): WRITING
PERCENTAGE MASTERED GRADE LEVEL STANDARD
3-8 (SP) Writing (4)
33.3 27.8
10.0 12.5
*
14.42017 29.2 26.1 26.1 29.2 2429.2
4
7.22015 11.5 11.5 12.0 11.5 2612.0
21.92016 * * * * 3*
NUMBER TESTED IN GRADE 4
6 18
10 16
2
5,2072017 24 23 23 2424
5,2472015 26 26 25 2625
5,1162016 3 3 2 33
August 15, 2017 Dallas ISD Evaluation & Assessment (Office of Institutional Research) rpt_STAAR38_S_write_per_mst 2017-18 Data Packet
37SIDNEY LANIER EXPRESSIVE ARTS VANGUARD (827)
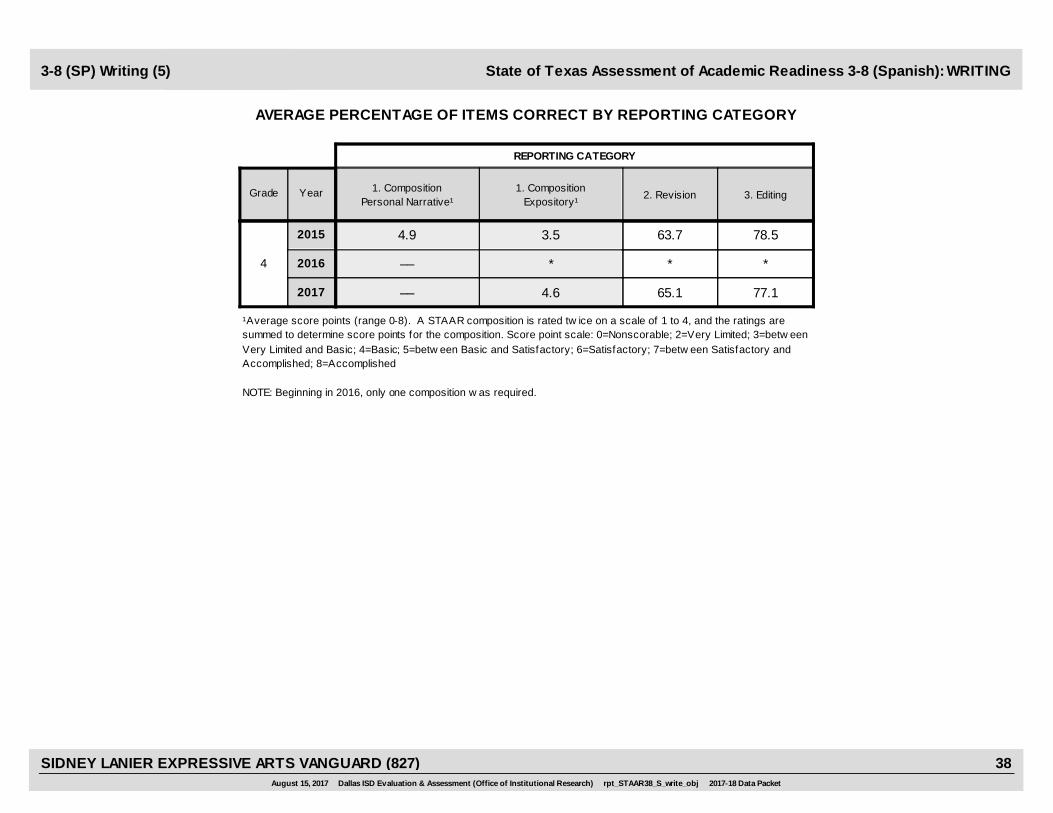
1. CompositionExpository¹
1. CompositionPersonal Narrative¹
2. Revision 3. EditingYearGrade
REPORTING CATEGORY
State of Texas Assessment of Academic Readiness 3-8 (Spanish): WRITING
AVERAGE PERCENTAGE OF ITEMS CORRECT BY REPORTING CATEGORY
3-8 (SP) Writing (5)
4.6
3.5
*
2017 –– 65.1 77.1
2015 4.9 63.7 78.5
4 2016 –– * *
¹Average score points (range 0-8). A STAAR composition is rated tw ice on a scale of 1 to 4, and the ratings are summed to determine score points for the composition. Score point scale: 0=Nonscorable; 2=Very Limited; 3=betw een Very Limited and Basic; 4=Basic; 5=betw een Basic and Satisfactory; 6=Satisfactory; 7=betw een Satisfactory and Accomplished; 8=Accomplished
NOTE: Beginning in 2016, only one composition w as required.
August 15, 2017 Dallas ISD Evaluation & Assessment (Office of Institutional Research) rpt_STAAR38_S_write_obj 2017-18 Data Packet
38SIDNEY LANIER EXPRESSIVE ARTS VANGUARD (827)
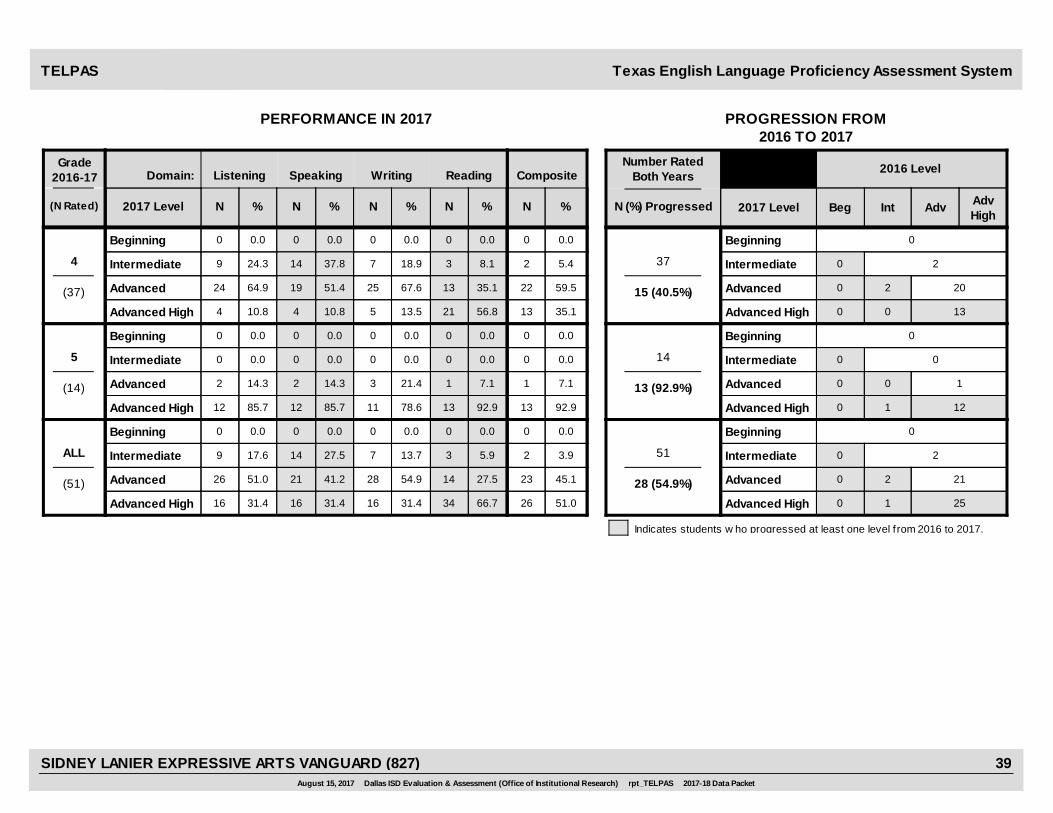
Composite
1
Grade2016-17 Listening
N (%) Progressed
Number RatedBoth Years
2016 Level
PERFORMANCE IN 2017 PROGRESSION FROM2016 TO 2017
Speaking Writing
% % %N N N(N Rated) 2017 Level N % 2017 Level
Domain:
IntBeg Adv AdvHigh
Texas English Language Proficiency Assessment SystemTELPAS
Reading
%N
5.4
0.0
4
0 0.0 0 0 0.0 0
(37)
Beginning
Intermediate
Advanced High
0.0 0.00
37.89 24.3 14 7 18.9 3 8.1 2
51.424 64.9 19 25 67.6 13 35.1 59.522
10.84 10.8 4 5 13.5 21 56.8 35.113
37
15 (40.5%)
Beginning
Intermediate
Advanced
Advanced High
0
20
0
0
2
0
20
13
Advanced
0.0
0.0
5
0 0.0 0 0 0.0 0
(14)
Beginning
Intermediate
Advanced High
0.0 0.00
0.00 0.0 0 0 0.0 0 0.0 0
14.32 14.3 2 3 21.4 1 7.1 7.11
85.712 85.7 12 11 78.6 13 92.9 92.913
14
13 (92.9%)
Beginning
Intermediate
Advanced
Advanced High
0
00
0
0
0
1
1
12
Advanced
3.9
0.0
ALL
0 0.0 0 0 0.0 0
(51)
Beginning
Intermediate
Advanced High
0.0 0.00
27.59 17.6 14 7 13.7 3 5.9 2
41.226 51.0 21 28 54.9 14 27.5 45.123
31.416 31.4 16 16 31.4 34 66.7 51.026
51
28 (54.9%)
Beginning
Intermediate
Advanced
Advanced High
0
20
0
0
2
1
21
25
Advanced
Indicates students w ho progressed at least one level f rom 2016 to 2017.
August 15, 2017 Dallas ISD Evaluation & Assessment (Office of Institutional Research) rpt_TELPAS 2017-18 Data Packet
39SIDNEY LANIER EXPRESSIVE ARTS VANGUARD (827)
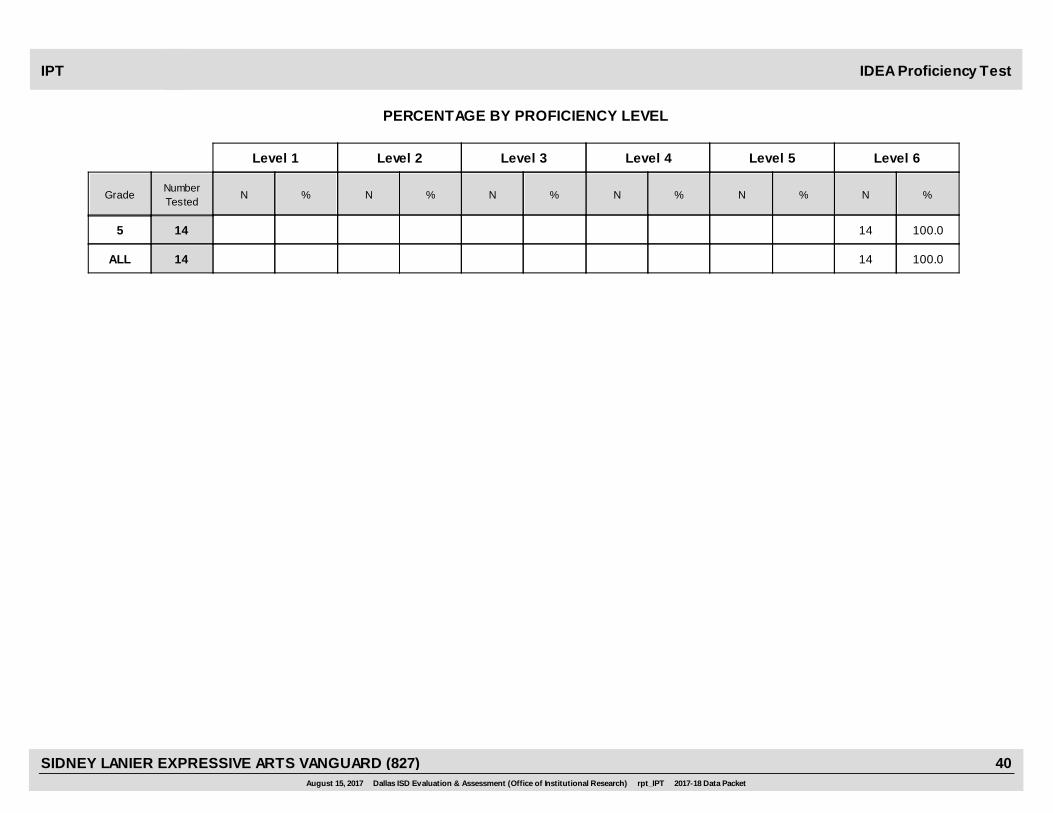
IDEA Proficiency Test
PERCENTAGE BY PROFICIENCY LEVEL
IPT
%NNumberTested
%NNNGrade N N %%%%
Level 6Level 5Level 4Level 3Level 2Level 1
14 100.05 14
14 100.0ALL 14
August 15, 2017 Dallas ISD Evaluation & Assessment (Office of Institutional Research) rpt_IPT 2017-18 Data Packet
40SIDNEY LANIER EXPRESSIVE ARTS VANGUARD (827)
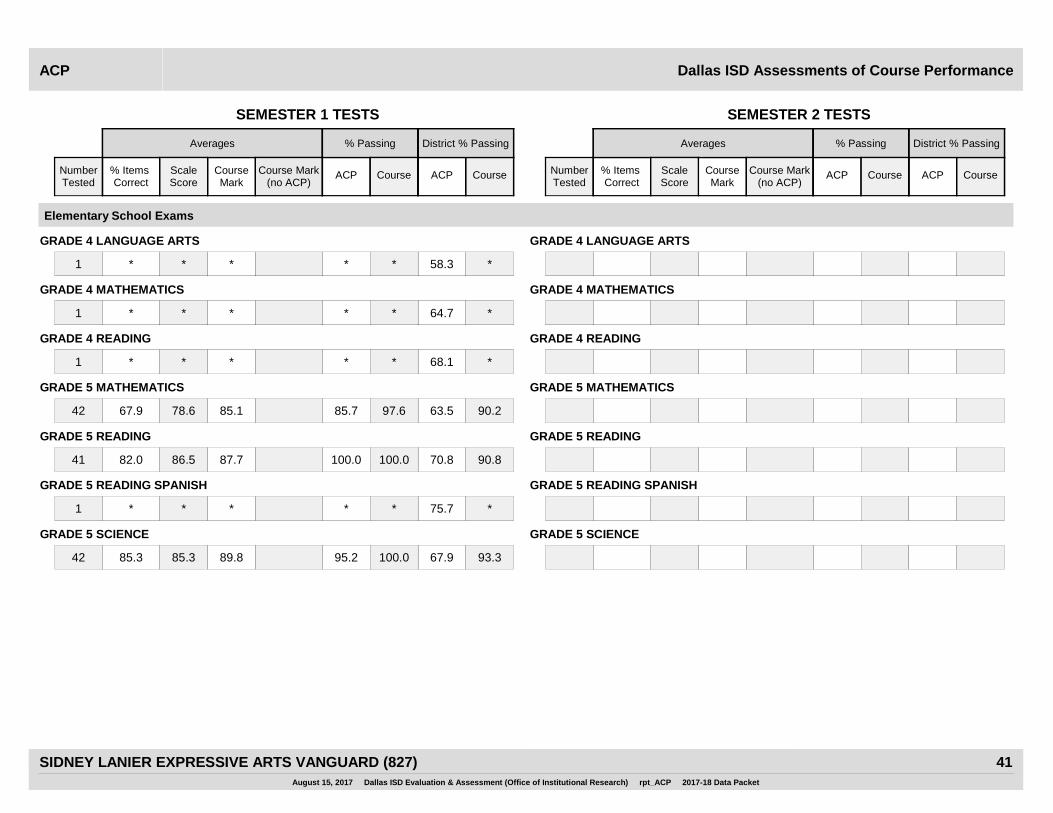
Course% Items Correct
CourseMark
ACP ACP
Averages % Passing District % Passing
Course Mark(no ACP)
ScaleScore
NumberTested
Course
Dallas ISD Assessments of Course PerformanceACP
Course% Items Correct
CourseMark
ACP ACP
Averages % Passing District % Passing
Course Mark(no ACP)
ScaleScore
NumberTested
Course
SEMESTER 1 TESTS SEMESTER 2 TESTS
Elementary School Exams
GRADE 4 LANGUAGE ARTS GRADE 4 LANGUAGE ARTS
* * * * * 58.3 *1
GRADE 4 MATHEMATICS GRADE 4 MATHEMATICS
* * * * * 64.7 *1
GRADE 4 READING GRADE 4 READING
* * * * * 68.1 *1
GRADE 5 MATHEMATICS GRADE 5 MATHEMATICS
67.9 78.6 85.1 85.7 97.6 63.5 90.242
GRADE 5 READING GRADE 5 READING
82.0 86.5 87.7 100.0 100.0 70.8 90.841
GRADE 5 READING SPANISH GRADE 5 READING SPANISH
* * * * * 75.7 *1
GRADE 5 SCIENCE GRADE 5 SCIENCE
85.3 85.3 89.8 95.2 100.0 67.9 93.342
August 15, 2017 Dallas ISD Evaluation & Assessment (Office of Institutional Research) rpt_ACP 2017-18 Data Packet
41SIDNEY LANIER EXPRESSIVE ARTS VANGUARD (827)