Embed Size (px)
Citation preview
Data Packet for 2017-18 Planning
Evaluation & Assessment
Office of Institutional Research
http://mydata.dallasisd.org
DAN D. ROGERS ELEMENTARY SCHOOLSchool Number 203 August 14, 2017
Notice regarding TELPAS: Counts were incorrectly reported in previous versions of 2017-18 data packets. Counts
were doubled when reported, but percentages were not affected.
1 Table of Contents2017-18 Data Packet: Standard Issue
2. Contents ........... Table of Contents
3. Notes ................ Notes and Data Descriptions
STUDENTS AND STAFF
6. Summary .......... Summary of Student and Teacher Statistics
7. Enroll (1) ........... Enrollment Statistics by Ethnicity
8. Enroll (2) ........... Enrollment Statistics by Select Student Group
9. Attendance ....... Student Attendance Statistics
10. Teachers ........... Teacher Statistics
STAAR
11. Reading (3-8) .... STAAR 3-8 Reading in English
16. Writing (3-8) ..... STAAR 3-8 Writing in English
21. Math (3-8) ........ STAAR 3-8 Mathematics in English
26. Science (3-8) ..... STAAR 3-8 Science in English
STAAR (SPANISH)
31. Reading (3-8) .... STAAR 3-8 Reading in Spanish
36. Writing (3-8) ..... STAAR 3-8 Writing in Spanish
TERRANOVA/SUPERA
41. Compliance ....... SCE Compliance for At-Risk Students
42. Reading (TN) ..... TerraNova Reading Subtest
44. Language (TN) .. TerraNova Language Subtest
46. Math (TN) ......... TerraNova Mathematics Subtest
48. Reading (SUP) ... SUPERA Reading Subtest
50. Language (SUP) SUPERA Language Subtest
ENGLISH PROFICIENCY
52. TELPAS .............. Texas English Language Proficiency Assessment System
54. IPT ..................... IDEA Proficiency Test
LOCAL ASSESSMENT
55. ACP ................... Dallas ISD Assessments of Course Performance
August 14, 2017 Dallas ISD Evaluation & Assessment (Office of Institutional Research) rpt_CONTENTS 2017-18 Data Packet
2DAN D. ROGERS ELEMENTARY SCHOOL (203)
3Notes, Definitions, and Data DescriptionsNotes
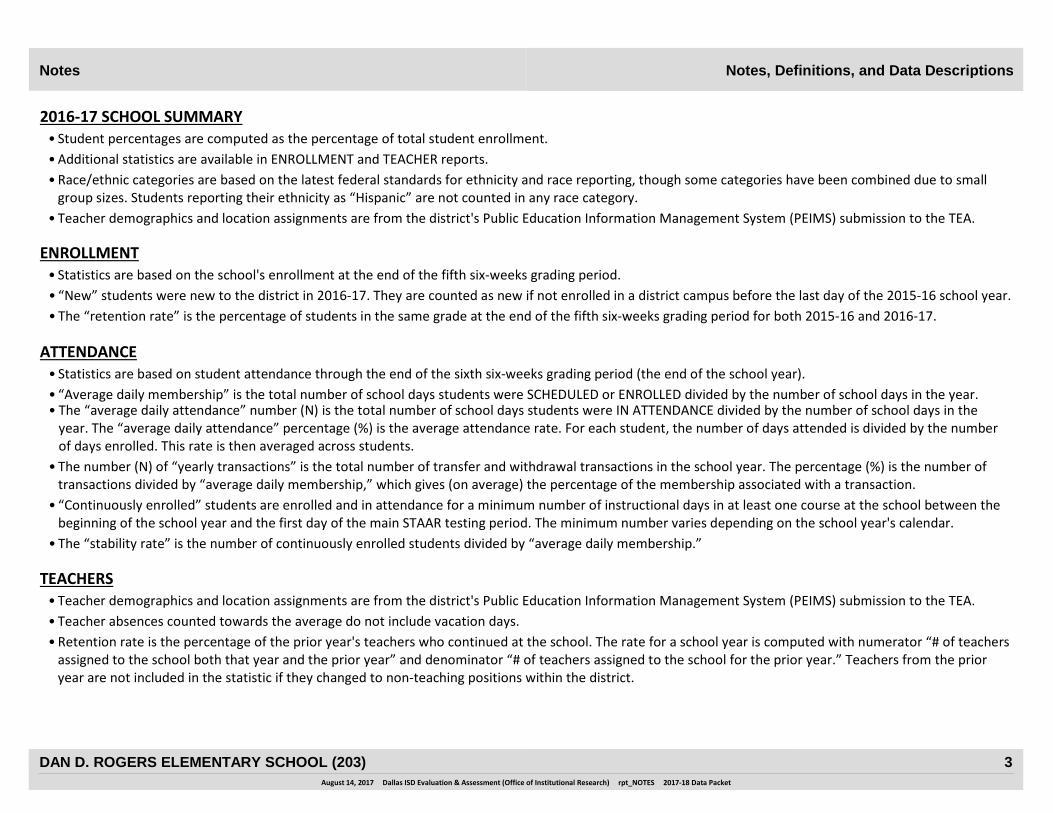
Student percentages are computed as the percentage of total student enrollment.•
Additional statistics are available in ENROLLMENT and TEACHER reports.•
Teacher demographics and location assignments are from the district's Public Education Information Management System (PEIMS) submission to the TEA.•
2016-17 SCHOOL SUMMARY
Race/ethnic categories are based on the latest federal standards for ethnicity and race reporting, though some categories have been combined due to small
group sizes. Students reporting their ethnicity as “Hispanic” are not counted in any race category.
•
Statistics are based on the school's enrollment at the end of the fifth six-weeks grading period.•
The “retention rate” is the percentage of students in the same grade at the end of the fifth six-weeks grading period for both 2015-16 and 2016-17.•
“New” students were new to the district in 2016-17. They are counted as new if not enrolled in a district campus before the last day of the 2015-16 school year.•
ENROLLMENT
• Statistics are based on student attendance through the end of the sixth six-weeks grading period (the end of the school year).
• “Average daily membership” is the total number of school days students were SCHEDULED or ENROLLED divided by the number of school days in the year.• The “average daily attendance” number (N) is the total number of school days students were IN ATTENDANCE divided by the number of school days in the
year. The “average daily attendance” percentage (%) is the average attendance rate. For each student, the number of days attended is divided by the number
of days enrolled. This rate is then averaged across students.
• The number (N) of “yearly transactions” is the total number of transfer and withdrawal transactions in the school year. The percentage (%) is the number of
transactions divided by “average daily membership,” which gives (on average) the percentage of the membership associated with a transaction.
• “Continuously enrolled” students are enrolled and in attendance for a minimum number of instructional days in at least one course at the school between the
beginning of the school year and the first day of the main STAAR testing period. The minimum number varies depending on the school year's calendar.
• The “stability rate” is the number of continuously enrolled students divided by “average daily membership.”
ATTENDANCE
• Teacher demographics and location assignments are from the district's Public Education Information Management System (PEIMS) submission to the TEA.
TEACHERS
• Teacher absences counted towards the average do not include vacation days.
• Retention rate is the percentage of the prior year's teachers who continued at the school. The rate for a school year is computed with numerator “# of teachers
assigned to the school both that year and the prior year” and denominator “# of teachers assigned to the school for the prior year.” Teachers from the prior
year are not included in the statistic if they changed to non-teaching positions within the district.
August 14, 2017 Dallas ISD Evaluation & Assessment (Office of Institutional Research) rpt_NOTES 2017-18 Data Packet
3DAN D. ROGERS ELEMENTARY SCHOOL (203)
3Notes, Definitions, and Data DescriptionsNotes
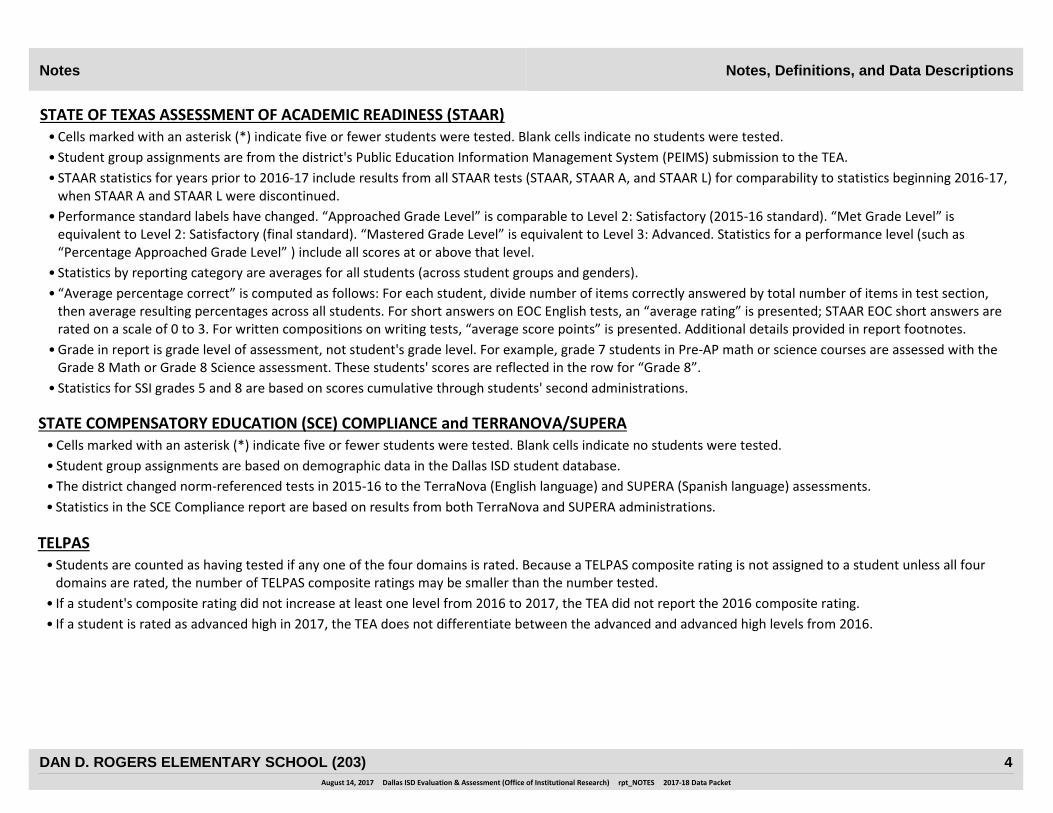
Cells marked with an asterisk (*) indicate five or fewer students were tested. Blank cells indicate no students were tested.•
•
•
•
•
Student group assignments are from the district's Public Education Information Management System (PEIMS) submission to the TEA.
Grade in report is grade level of assessment, not student's grade level. For example, grade 7 students in Pre-AP math or science courses are assessed with the
Grade 8 Math or Grade 8 Science assessment. These students' scores are reflected in the row for “Grade 8”.
Statistics by reporting category are averages for all students (across student groups and genders).
“Average percentage correct” is computed as follows: For each student, divide number of items correctly answered by total number of items in test section,
then average resulting percentages across all students. For short answers on EOC English tests, an “average rating” is presented; STAAR EOC short answers are
rated on a scale of 0 to 3. For written compositions on writing tests, “average score points” is presented. Additional details provided in report footnotes.
• Statistics for SSI grades 5 and 8 are based on scores cumulative through students' second administrations.
• STAAR statistics for years prior to 2016-17 include results from all STAAR tests (STAAR, STAAR A, and STAAR L) for comparability to statistics beginning 2016-17,
when STAAR A and STAAR L were discontinued.
STATE OF TEXAS ASSESSMENT OF ACADEMIC READINESS (STAAR)
• Performance standard labels have changed. “Approached Grade Level” is comparable to Level 2: Satisfactory (2015-16 standard). “Met Grade Level” is
equivalent to Level 2: Satisfactory (final standard). “Mastered Grade Level” is equivalent to Level 3: Advanced. Statistics for a performance level (such as
“Percentage Approached Grade Level” ) include all scores at or above that level.
•
•
Cells marked with an asterisk (*) indicate five or fewer students were tested. Blank cells indicate no students were tested.
Student group assignments are based on demographic data in the Dallas ISD student database.
• The district changed norm-referenced tests in 2015-16 to the TerraNova (English language) and SUPERA (Spanish language) assessments.
• Statistics in the SCE Compliance report are based on results from both TerraNova and SUPERA administrations.
STATE COMPENSATORY EDUCATION (SCE) COMPLIANCE and TERRANOVA/SUPERA
•
• If a student's composite rating did not increase at least one level from 2016 to 2017, the TEA did not report the 2016 composite rating.
Students are counted as having tested if any one of the four domains is rated. Because a TELPAS composite rating is not assigned to a student unless all four
domains are rated, the number of TELPAS composite ratings may be smaller than the number tested.
• If a student is rated as advanced high in 2017, the TEA does not differentiate between the advanced and advanced high levels from 2016.
TELPAS
August 14, 2017 Dallas ISD Evaluation & Assessment (Office of Institutional Research) rpt_NOTES 2017-18 Data Packet
4DAN D. ROGERS ELEMENTARY SCHOOL (203)
3Notes, Definitions, and Data DescriptionsNotes
•
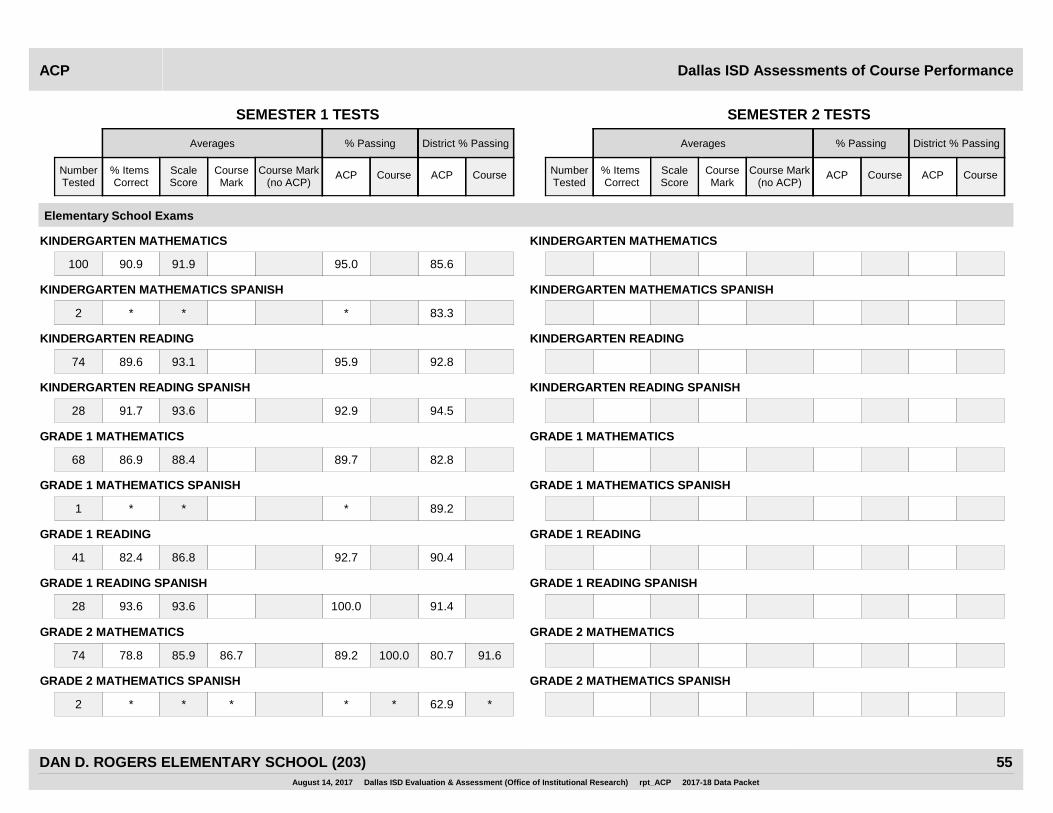
• Raw scores on the ACPs (percentage of items correct) are scaled each year to maintain similar annual passing rates for the district.
ACPs are semester exams administered in grades K-12. Not all courses have ACPs. In secondary grades, ACP scores account for a portion of students' semester
grades (10% at middle and 15% at high). “Average course mark (no ACP)” is computed from semester grades before factoring in ACP scores. In elementary
grades, ACP results account for 5% of students' semester grades for core courses; course-grade statistics are not reported in packets for elementary grades.
• A scale score of at least 70% is required to pass an ACP. For grade levels with numeric grading, a course mark of at least 70% is required to pass a course.
Cells marked with an asterisk (*) indicate five or fewer students were tested. Blank cells indicate no students were tested.•
DALLAS ISD ASSESSMENTS OF COURSE PERFORMANCE (ACP)
• Statistics are computed separately for Semester 1 and Semester 2 tests; time of administration during the school year is not relevant. Results from tests
written for different school years are not combined.
August 14, 2017 Dallas ISD Evaluation & Assessment (Office of Institutional Research) rpt_NOTES 2017-18 Data Packet
5DAN D. ROGERS ELEMENTARY SCHOOL (203)
Summary 2016-17 Group Summary Statistics
Grade
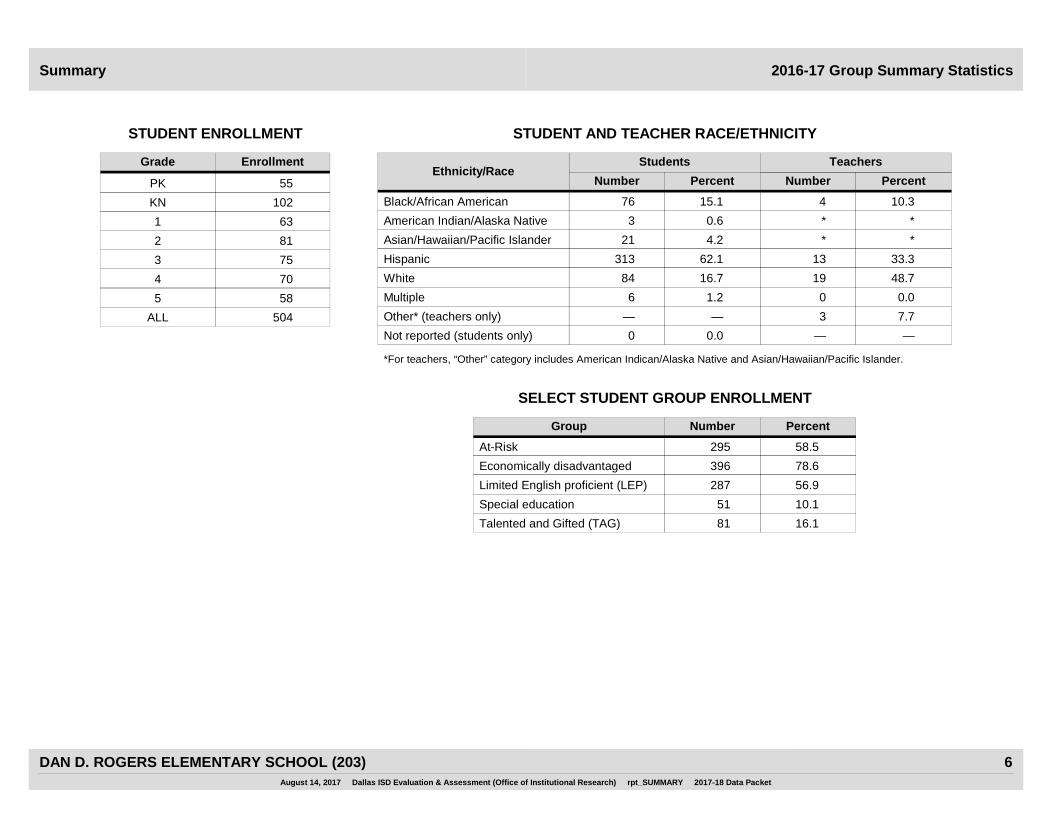
STUDENT ENROLLMENT
Enrollment
PK 55
KN 102
1 63
2 81
3 75
4 70
5 58
ALL 504
STUDENT AND TEACHER RACE/ETHNICITY
Students
Number Percent Number PercentEthnicity/Race
Black/African American
American Indian/Alaska Native
Asian/Hawaiian/Pacific Islander
Hispanic
White
Multiple
76 15.1
3 0.6
21 4.2
313 62.1
84 16.7
4 10.3
13 33.3
19 48.7
0 0.0
* *
* *
6 1.2
SELECT STUDENT GROUP ENROLLMENT
Number PercentGroup
Economically disadvantaged
Limited English proficient (LEP)
Special education
396 78.6
287 56.9
51 10.1
*For teachers, “Other” category includes American Indican/Alaska Native and Asian/Hawaiian/Pacific Islander.
Not reported (students only) — —0 0.0
Other* (teachers only) 3 7.7— —
Talented and Gifted (TAG) 81 16.1
At-Risk 295 58.5
Teachers
August 14, 2017 Dallas ISD Evaluation & Assessment (Office of Institutional Research) rpt_SUMMARY 2017-18 Data Packet
6DAN D. ROGERS ELEMENTARY SCHOOL (203)
N %
Asian
%NN %%
Hispanic
N N %Grade Year
African American American Indian
Enrollment
White
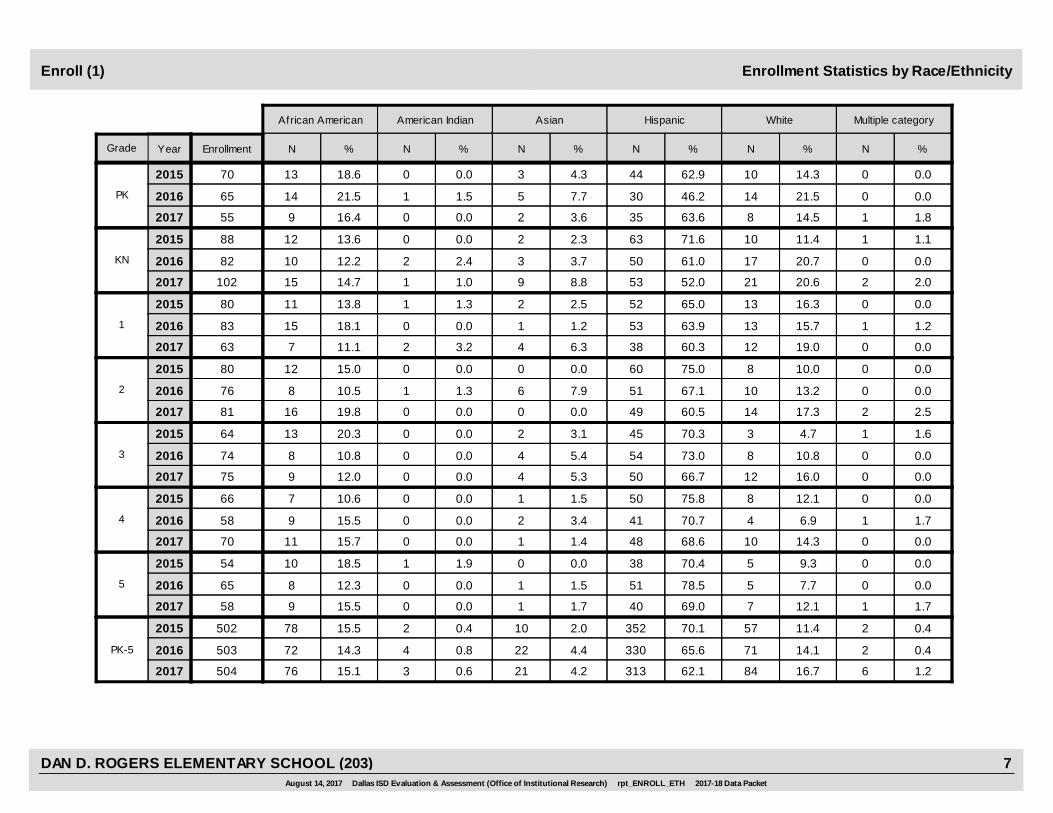
Enrollment Statistics by Race/EthnicityEnroll (1)
N %
Multiple category
2017
2015
2016
4.3
7.7
3.6
3
5
2
0.0
1.5
0.0
0
1
0
62.9
46.2
63.6
44
30
35
18.6
21.5
16.4
13
14
9
14.3
21.5
14.5
10
14
8
PK
55
65
70 0.0
0.0
1.8
0
0
1
2017
2015
2016
2.3
3.7
8.8
2
3
9
0.0
2.4
1.0
0
2
1
71.6
61.0
52.0
63
50
53
13.6
12.2
14.7
12
10
15
11.4
20.7
20.6
10
17
21
KN
102
82
88 1.1
0.0
2.0
1
0
2
2017
2015
2016
2.5
1.2
6.3
2
1
4
1.3
0.0
3.2
1
0
2
65.0
63.9
60.3
52
53
38
13.8
18.1
11.1
11
15
7
16.3
15.7
19.0
13
13
12
1
63
83
80 0.0
1.2
0.0
0
1
0
2017
2015
2016
0.0
7.9
0.0
0
6
0
0.0
1.3
0.0
0
1
0
75.0
67.1
60.5
60
51
49
15.0
10.5
19.8
12
8
16
10.0
13.2
17.3
8
10
14
2
81
76
80 0.0
0.0
2.5
0
0
2
2017
2015
2016
3.1
5.4
5.3
2
4
4
0.0
0.0
0.0
0
0
0
70.3
73.0
66.7
45
54
50
20.3
10.8
12.0
13
8
9
4.7
10.8
16.0
3
8
12
3
75
74
64 1.6
0.0
0.0
1
0
0
2017
2015
2016
1.5
3.4
1.4
1
2
1
0.0
0.0
0.0
0
0
0
75.8
70.7
68.6
50
41
48
10.6
15.5
15.7
7
9
11
12.1
6.9
14.3
8
4
10
4
70
58
66 0.0
1.7
0.0
0
1
0
2017
2015
2016
0.0
1.5
1.7
0
1
1
1.9
0.0
0.0
1
0
0
70.4
78.5
69.0
38
51
40
18.5
12.3
15.5
10
8
9
9.3
7.7
12.1
5
5
7
5
58
65
54 0.0
0.0
1.7
0
0
1
2017
2015
2016
2.0
4.4
4.2
10
22
21
0.4
0.8
0.6
2
4
3
70.1
65.6
62.1
352
330
313
15.5
14.3
15.1
78
72
76
11.4
14.1
16.7
57
71
84
PK-5
504
503
502 0.4
0.4
1.2
2
2
6
August 14, 2017 Dallas ISD Evaluation & Assessment (Office of Institutional Research) rpt_ENROLL_ETH 2017-18 Data Packet
7DAN D. ROGERS ELEMENTARY SCHOOL (203)
N %
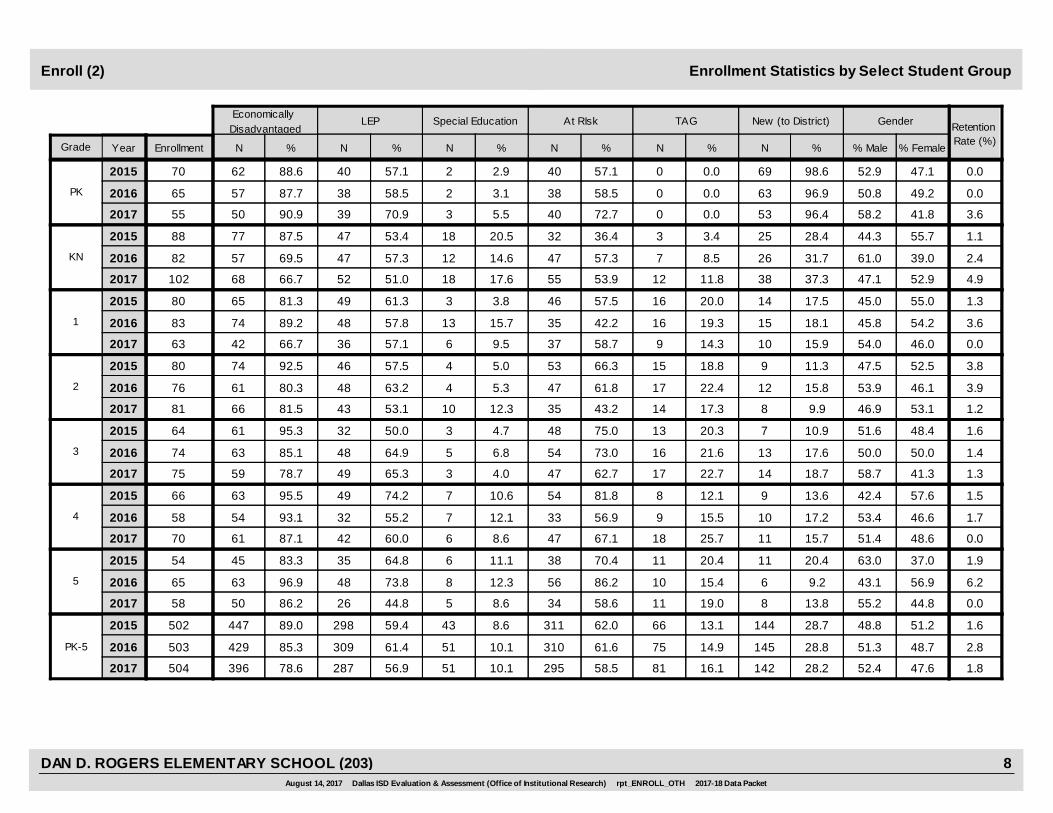
At RIsk New (to District)
N %
TAG
N %
Economically Disadvantaged
Grade Year
LEP Special Education
N % N % N %
Retention Rate (%)
Enrollment
Enrollment Statistics by Select Student GroupEnroll (2)
Gender
% Male % Female
57.1
58.5
72.7
40
38
40
98.6
96.9
96.4
PK
2017 55
65
70 88.6
87.7
90.9
62
57
50
57.1
58.5
70.9
40
38
39
2.9
3.1
5.5
2
2
3
0.0
0.0
0.0
0
0
0
0.0
0.0
3.6
2015
2016
69
63
53
52.9
50.8
58.2
47.1
49.2
41.8
36.4
57.3
53.9
32
47
55
28.4
31.7
37.3
KN
2017 102
82
88 87.5
69.5
66.7
77
57
68
53.4
57.3
51.0
47
47
52
20.5
14.6
17.6
18
12
18
3.4
8.5
11.8
3
7
12
1.1
2.4
4.9
2015
2016
25
26
38
44.3
61.0
47.1
55.7
39.0
52.9
57.5
42.2
58.7
46
35
37
17.5
18.1
15.9
1
2017 63
83
80 81.3
89.2
66.7
65
74
42
61.3
57.8
57.1
49
48
36
3.8
15.7
9.5
3
13
6
20.0
19.3
14.3
16
16
9
1.3
3.6
0.0
2015
2016
14
15
10
45.0
45.8
54.0
55.0
54.2
46.0
66.3
61.8
43.2
53
47
35
11.3
15.8
9.9
2
2017 81
76
80 92.5
80.3
81.5
74
61
66
57.5
63.2
53.1
46
48
43
5.0
5.3
12.3
4
4
10
18.8
22.4
17.3
15
17
14
3.8
3.9
1.2
2015
2016
9
12
8
47.5
53.9
46.9
52.5
46.1
53.1
75.0
73.0
62.7
48
54
47
10.9
17.6
18.7
3
2017 75
74
64 95.3
85.1
78.7
61
63
59
50.0
64.9
65.3
32
48
49
4.7
6.8
4.0
3
5
3
20.3
21.6
22.7
13
16
17
1.6
1.4
1.3
2015
2016
7
13
14
51.6
50.0
58.7
48.4
50.0
41.3
81.8
56.9
67.1
54
33
47
13.6
17.2
15.7
4
2017 70
58
66 95.5
93.1
87.1
63
54
61
74.2
55.2
60.0
49
32
42
10.6
12.1
8.6
7
7
6
12.1
15.5
25.7
8
9
18
1.5
1.7
0.0
2015
2016
9
10
11
42.4
53.4
51.4
57.6
46.6
48.6
70.4
86.2
58.6
38
56
34
20.4
9.2
13.8
5
2017 58
65
54 83.3
96.9
86.2
45
63
50
64.8
73.8
44.8
35
48
26
11.1
12.3
8.6
6
8
5
20.4
15.4
19.0
11
10
11
1.9
6.2
0.0
2015
2016
11
6
8
63.0
43.1
55.2
37.0
56.9
44.8
62.0
61.6
58.5
311
310
295
28.7
28.8
28.2
PK-5
2017 504
503
502 89.0
85.3
78.6
447
429
396
59.4
61.4
56.9
298
309
287
8.6
10.1
10.1
43
51
51
13.1
14.9
16.1
66
75
81
1.6
2.8
1.8
2015
2016
144
145
142
48.8
51.3
52.4
51.2
48.7
47.6
August 14, 2017 Dallas ISD Evaluation & Assessment (Office of Institutional Research) rpt_ENROLL_OTH 2017-18 Data Packet
8DAN D. ROGERS ELEMENTARY SCHOOL (203)
Stability Rate
%
ContinuouslyEnrolled
N DistrictNN
Average DailyMembership
Average Daily Attendance Yearly Transactions
Grade Year N %District District N District % % District % District
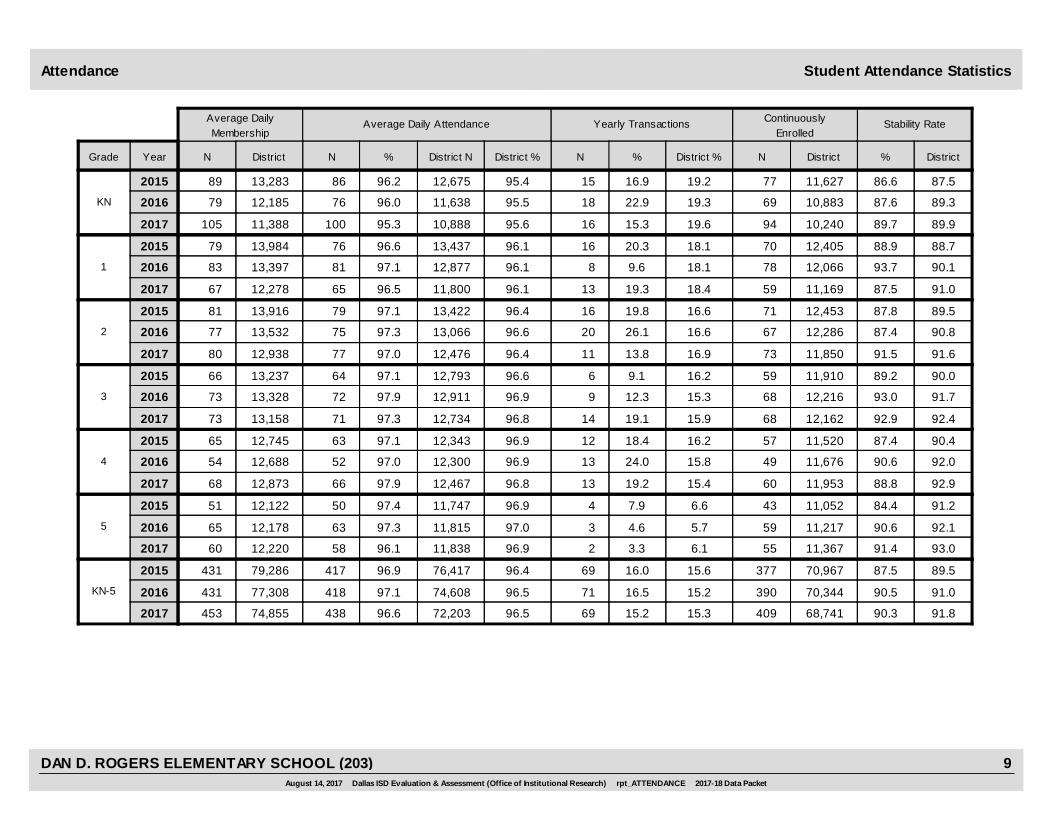
Student Attendance StatisticsAttendance
86.6
89.7
87.6
77
94
69
11,627
10,240
10,883
15
16
18KN
2015 96.286 16.9 19.2
2016
2017 95.3100 15.3 19.6
96.076 22.9 19.3
13,283
11,388
12,185
95.4
95.6
95.5
12,675
10,888
11,638
87.5
89.9
89.3
89
105
79
88.9
87.5
93.7
70
59
78
12,405
11,169
12,066
16
13
81
2015 96.676 20.3 18.1
2016
2017 96.565 19.3 18.4
97.181 9.6 18.1
13,984
12,278
13,397
96.1
96.1
96.1
13,437
11,800
12,877
88.7
91.0
90.1
79
67
83
87.8
91.5
87.4
71
73
67
12,453
11,850
12,286
16
11
202
2015 97.179 19.8 16.6
2016
2017 97.077 13.8 16.9
97.375 26.1 16.6
13,916
12,938
13,532
96.4
96.4
96.6
13,422
12,476
13,066
89.5
91.6
90.8
81
80
77
89.2
92.9
93.0
59
68
68
11,910
12,162
12,216
6
14
93
2015 97.164 9.1 16.2
2016
2017 97.371 19.1 15.9
97.972 12.3 15.3
13,237
13,158
13,328
96.6
96.8
96.9
12,793
12,734
12,911
90.0
92.4
91.7
66
73
73
87.4
88.8
90.6
57
60
49
11,520
11,953
11,676
12
13
134
2015 97.163 18.4 16.2
2016
2017 97.966 19.2 15.4
97.052 24.0 15.8
12,745
12,873
12,688
96.9
96.8
96.9
12,343
12,467
12,300
90.4
92.9
92.0
65
68
54
84.4
91.4
90.6
43
55
59
11,052
11,367
11,217
4
2
35
2015 97.450 7.9 6.6
2016
2017 96.158 3.3 6.1
97.363 4.6 5.7
12,122
12,220
12,178
96.9
96.9
97.0
11,747
11,838
11,815
91.2
93.0
92.1
51
60
65
87.5
90.3
90.5
377
409
390
70,967
68,741
70,344
69
69
71KN-5
2015 96.9417 16.0 15.6
2016
2017 96.6438 15.2 15.3
97.1418 16.5 15.2
79,286
74,855
77,308
96.4
96.5
96.5
76,417
72,203
74,608
89.5
91.8
91.0
431
453
431
August 14, 2017 Dallas ISD Evaluation & Assessment (Office of Institutional Research) rpt_ATTENDANCE 2017-18 Data Packet
9DAN D. ROGERS ELEMENTARY SCHOOL (203)
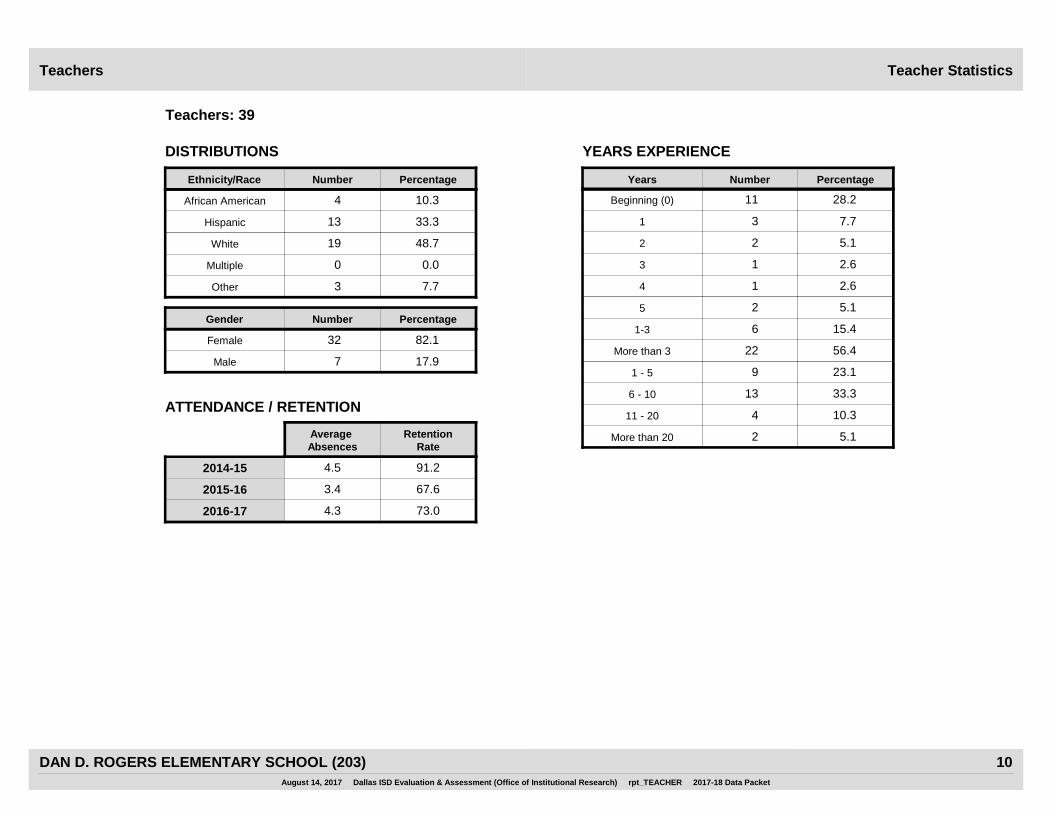
Teacher StatisticsTeachers
28.2
Percentage
11Beginning (0)
91 - 5
136 - 10
411 - 20
2More than 20
Years Number
73.0
67.6
91.2
0
82.132
17.97
0.0
33.313
10.34
48.719White
African American
Hispanic
Multiple
Male
Female
3.4
4.5
Number PercentageEthnicity/Race
DISTRIBUTIONS YEARS EXPERIENCE
Teachers: 39
4.3
Average Absences
RetentionRate
23.1
33.3
10.3
5.1
2014-15
2015-16
2016-17
Number PercentageGender
7.731
5.122
2.613
15.461-3
2.614
5.125
22More than 3 56.4
3 7.7Other
ATTENDANCE / RETENTION
August 14, 2017 Dallas ISD Evaluation & Assessment (Office of Institutional Research) rpt_TEACHER 2017-18 Data Packet
10DAN D. ROGERS ELEMENTARY SCHOOL (203)

FemaleMigrant MaleAt RiskWhiteAfricanAmer
HispanicEcon
DisadvSpecialEduc
LEP All DistrictYearGradeNumber Tested(All Students)
State of Texas Assessment of Academic Readiness 3-8 (English): READING
PERCENTAGE APPROACHED GRADE LEVEL STANDARD
3-8 (EN) Read (1)
82.6 80.0
83.3 84.2
66.7 78.9
59.52017 83.3 62.5 84.2 74.1 * 76.5 81.4 4373.7
3
59.12015 * 100.0 70.6 87.1 * * 83.8 3772.7
58.12016 100.0 62.5 82.4 83.3 * 50.0 73.0 3762.5
68.4 68.4
53.8 50.0
81.3 64.7
56.42017 80.0 54.5 75.0 73.9 * 40.0 68.4 3840.0
4
55.92015 71.4 57.1 42.9 47.6 33.3 45.5 51.7 2937.5
62.62016 * 77.8 81.3 80.8 * 55.6 72.7 3362.5
87.5 84.2
86.7 75.0
100.0 87.5
71.72017 66.7 90.0 88.0 83.3 * 72.7 86.0 4373.7
5
74.62015 * 80.0 75.0 78.6 100.0 * 82.6 2362.5
70.62016 * 85.7 92.9 94.4 83.3 83.3 92.6 2788.9
80.3 77.6
76.1 69.8
80.0 76.9
62.72017 78.6 69.0 83.3 77.9 37.5 65.8 79.0 12464.2
3-5
63.52015 85.7 83.3 61.5 72.7 60.0 52.4 73.0 8958.7
63.92016 88.2 75.0 85.1 85.3 80.0 63.6 78.4 9773.8
NUMBER TESTED IN GRADES 3-5
66 58
46 43
45 52
23,0842017 28 6029 86 8 38 12453
22,4432015 14 3930 66 15 21 8946
22,5292016 17 4724 68 10 33 9742
August 14, 2017 Dallas ISD Evaluation & Assessment (Office of Institutional Research) rpt_STAAR38_E_read_per_app 2017-18 Data Packet
11DAN D. ROGERS ELEMENTARY SCHOOL (203)
FemaleMigrant MaleAt RiskWhiteAfricanAmer
HispanicEcon
DisadvSpecialEduc
LEP All DistrictYearGradeNumber Tested(All Students)
State of Texas Assessment of Academic Readiness 3-8 (English): READING
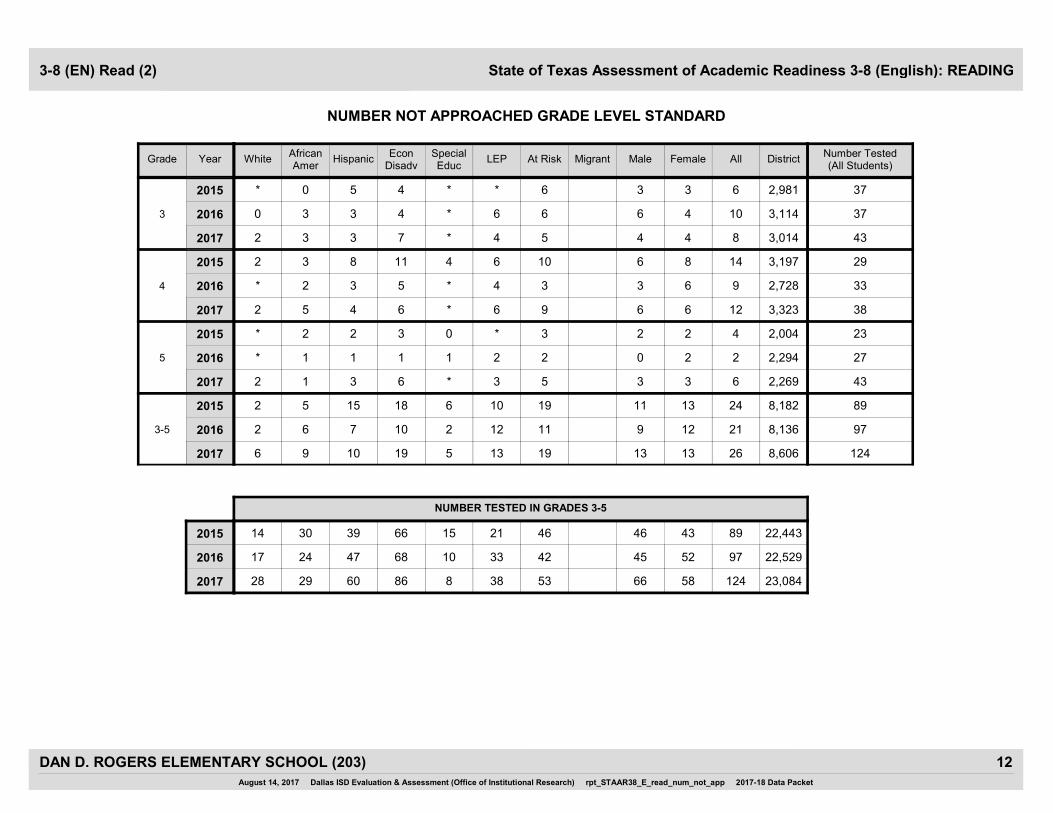
NUMBER NOT APPROACHED GRADE LEVEL STANDARD
3-8 (EN) Read (2)
4 4
3 3
6 4
3,0142017 2 3 3 7 * 4 8 435
3
2,9812015 * 0 5 4 * * 6 376
3,1142016 0 3 3 4 * 6 10 376
6 6
6 8
3 6
3,3232017 2 5 4 6 * 6 12 389
4
3,1972015 2 3 8 11 4 6 14 2910
2,7282016 * 2 3 5 * 4 9 333
3 3
2 2
0 2
2,2692017 2 1 3 6 * 3 6 435
5
2,0042015 * 2 2 3 0 * 4 233
2,2942016 * 1 1 1 1 2 2 272
13 13
11 13
9 12
8,6062017 6 9 10 19 5 13 26 12419
3-5
8,1822015 2 5 15 18 6 10 24 8919
8,1362016 2 6 7 10 2 12 21 9711
NUMBER TESTED IN GRADES 3-5
66 58
46 43
45 52
23,0842017 28 6029 86 8 38 12453
22,4432015 14 3930 66 15 21 8946
22,5292016 17 4724 68 10 33 9742
August 14, 2017 Dallas ISD Evaluation & Assessment (Office of Institutional Research) rpt_STAAR38_E_read_num_not_app 2017-18 Data Packet
12DAN D. ROGERS ELEMENTARY SCHOOL (203)

FemaleMigrant MaleAt RiskWhiteAfricanAmer
HispanicEcon
DisadvSpecialEduc
LEP All DistrictYearGradeNumber Tested(All Students)
State of Texas Assessment of Academic Readiness 3-8 (English): READING
PERCENTAGE MET GRADE LEVEL STANDARD
3-8 (EN) Read (3)
39.1 55.0
55.6 26.3
50.0 52.6
32.92017 50.0 12.5 57.9 33.3 * 41.2 46.5 4342.1
3
26.42015 * 46.2 29.4 41.9 * * 40.5 379.1
29.22016 87.5 37.5 52.9 54.2 * 25.0 51.4 3731.3
52.6 47.4
23.1 12.5
50.0 29.4
32.42017 60.0 36.4 56.3 52.2 * 40.0 50.0 3826.7
4
27.32015 28.6 14.3 14.3 19.0 0.0 9.1 17.2 296.3
28.62016 * 44.4 37.5 50.0 * 22.2 39.4 3325.0
45.8 42.1
40.0 37.5
45.5 18.8
38.22017 50.0 20.0 48.0 44.4 * 45.5 44.2 4331.6
5
29.22015 * 20.0 50.0 28.6 33.3 * 39.1 2312.5
36.32016 * 28.6 21.4 38.9 16.7 41.7 29.6 2727.8
45.5 48.3
41.3 23.3
48.9 34.6
34.62017 53.6 24.1 53.3 43.0 12.5 42.1 46.8 12434.0
3-5
27.72015 42.9 30.0 28.2 31.8 13.3 14.3 32.6 898.7
31.42016 58.8 37.5 38.3 48.5 10.0 30.3 41.2 9728.6
NUMBER TESTED IN GRADES 3-5
66 58
46 43
45 52
23,0842017 28 6029 86 8 38 12453
22,4432015 14 3930 66 15 21 8946
22,5292016 17 4724 68 10 33 9742
August 14, 2017 Dallas ISD Evaluation & Assessment (Office of Institutional Research) rpt_STAAR38_E_read_per_met 2017-18 Data Packet
13DAN D. ROGERS ELEMENTARY SCHOOL (203)
FemaleMigrant MaleAt RiskWhiteAfricanAmer
HispanicEcon
DisadvSpecialEduc
LEP All DistrictYearGradeNumber Tested(All Students)
State of Texas Assessment of Academic Readiness 3-8 (English): READING
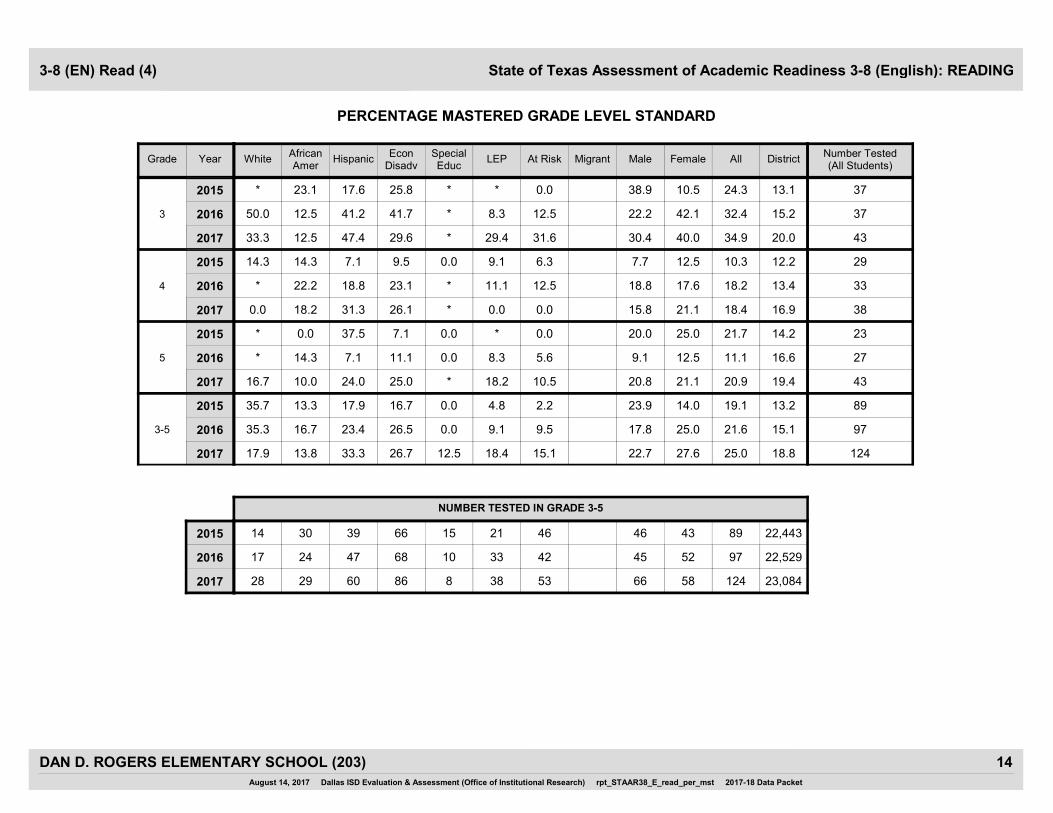
PERCENTAGE MASTERED GRADE LEVEL STANDARD
3-8 (EN) Read (4)
30.4 40.0
38.9 10.5
22.2 42.1
20.02017 33.3 12.5 47.4 29.6 * 29.4 34.9 4331.6
3
13.12015 * 23.1 17.6 25.8 * * 24.3 370.0
15.22016 50.0 12.5 41.2 41.7 * 8.3 32.4 3712.5
15.8 21.1
7.7 12.5
18.8 17.6
16.92017 0.0 18.2 31.3 26.1 * 0.0 18.4 380.0
4
12.22015 14.3 14.3 7.1 9.5 0.0 9.1 10.3 296.3
13.42016 * 22.2 18.8 23.1 * 11.1 18.2 3312.5
20.8 21.1
20.0 25.0
9.1 12.5
19.42017 16.7 10.0 24.0 25.0 * 18.2 20.9 4310.5
5
14.22015 * 0.0 37.5 7.1 0.0 * 21.7 230.0
16.62016 * 14.3 7.1 11.1 0.0 8.3 11.1 275.6
22.7 27.6
23.9 14.0
17.8 25.0
18.82017 17.9 13.8 33.3 26.7 12.5 18.4 25.0 12415.1
3-5
13.22015 35.7 13.3 17.9 16.7 0.0 4.8 19.1 892.2
15.12016 35.3 16.7 23.4 26.5 0.0 9.1 21.6 979.5
NUMBER TESTED IN GRADE 3-5
66 58
46 43
45 52
23,0842017 28 6029 86 8 38 12453
22,4432015 14 3930 66 15 21 8946
22,5292016 17 4724 68 10 33 9742
August 14, 2017 Dallas ISD Evaluation & Assessment (Office of Institutional Research) rpt_STAAR38_E_read_per_mst 2017-18 Data Packet
14DAN D. ROGERS ELEMENTARY SCHOOL (203)
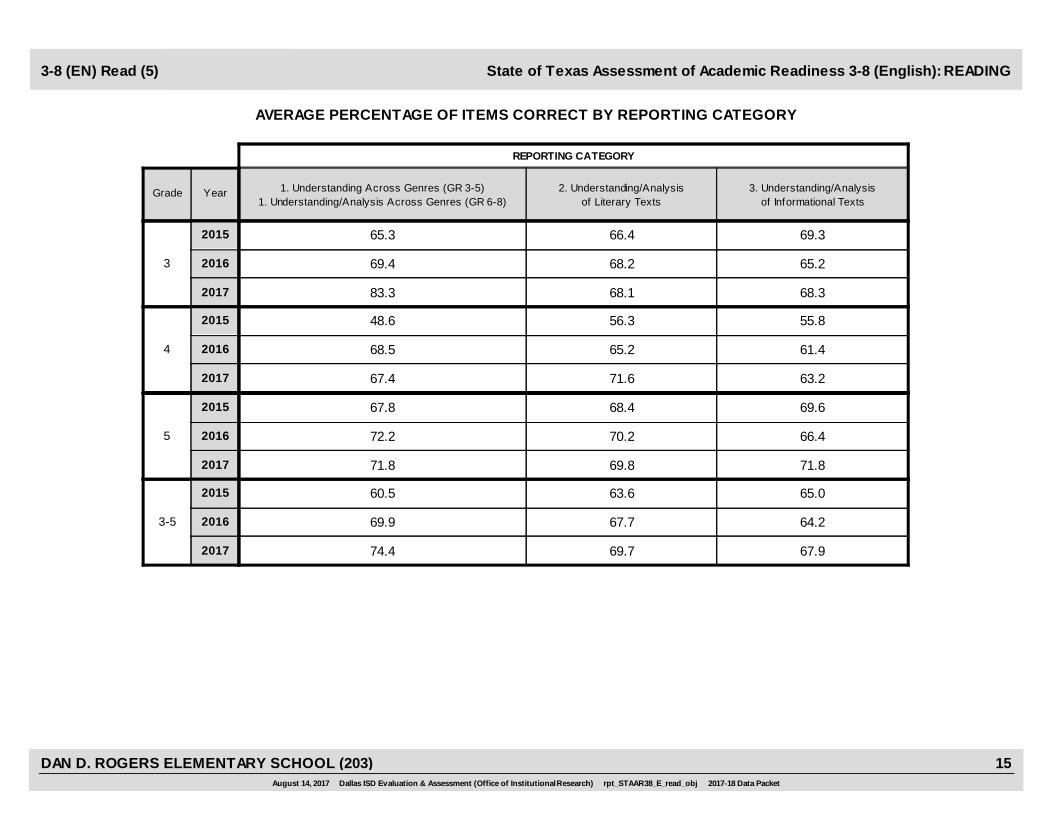
1. Understanding Across Genres (GR 3-5)1. Understanding/Analysis Across Genres (GR 6-8)
2. Understanding/Analysisof Literary Texts
3. Understanding/Analysisof Informational Texts
YearGrade
REPORTING CATEGORY
State of Texas Assessment of Academic Readiness 3-8 (English): READING
AVERAGE PERCENTAGE OF ITEMS CORRECT BY REPORTING CATEGORY
3-8 (EN) Read (5)
2017 83.3 68.1 68.3
2015 65.3 66.4 69.3
3 2016 69.4 68.2 65.2
2017 67.4 71.6 63.2
2015 48.6 56.3 55.8
4 2016 68.5 65.2 61.4
2017 71.8 69.8 71.8
2015 67.8 68.4 69.6
5 2016 72.2 70.2 66.4
2017 74.4 69.7 67.9
2015 60.5 63.6 65.0
3-5 2016 69.9 67.7 64.2
August 14, 2017 Dallas ISD Evaluation & Assessment (Office of Institutional Research) rpt_STAAR38_E_read_obj 2017-18 Data Packet
15DAN D. ROGERS ELEMENTARY SCHOOL (203)
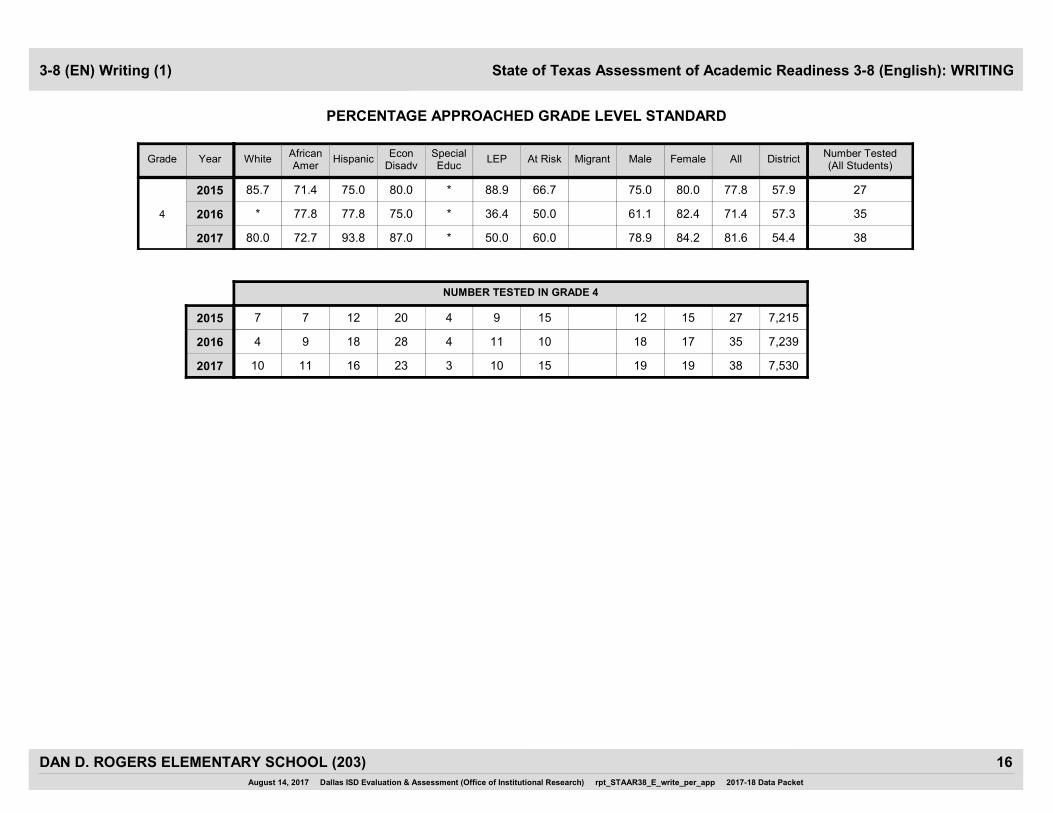
FemaleMigrant MaleAt RiskWhiteAfricanAmer
HispanicEcon
DisadvSpecialEduc
LEP All DistrictYearGradeNumber Tested(All Students)
State of Texas Assessment of Academic Readiness 3-8 (English): WRITING
PERCENTAGE APPROACHED GRADE LEVEL STANDARD
3-8 (EN) Writing (1)
78.9 84.2
75.0 80.0
61.1 82.4
54.42017 80.0 72.7 93.8 87.0 * 50.0 81.6 3860.0
4
57.92015 85.7 71.4 75.0 80.0 * 88.9 77.8 2766.7
57.32016 * 77.8 77.8 75.0 * 36.4 71.4 3550.0
NUMBER TESTED IN GRADE 4
19 19
12 15
18 17
7,5302017 10 1611 23 3 10 3815
7,2152015 7 127 20 4 9 2715
7,2392016 4 189 28 4 11 3510
August 14, 2017 Dallas ISD Evaluation & Assessment (Office of Institutional Research) rpt_STAAR38_E_write_per_app 2017-18 Data Packet
16DAN D. ROGERS ELEMENTARY SCHOOL (203)
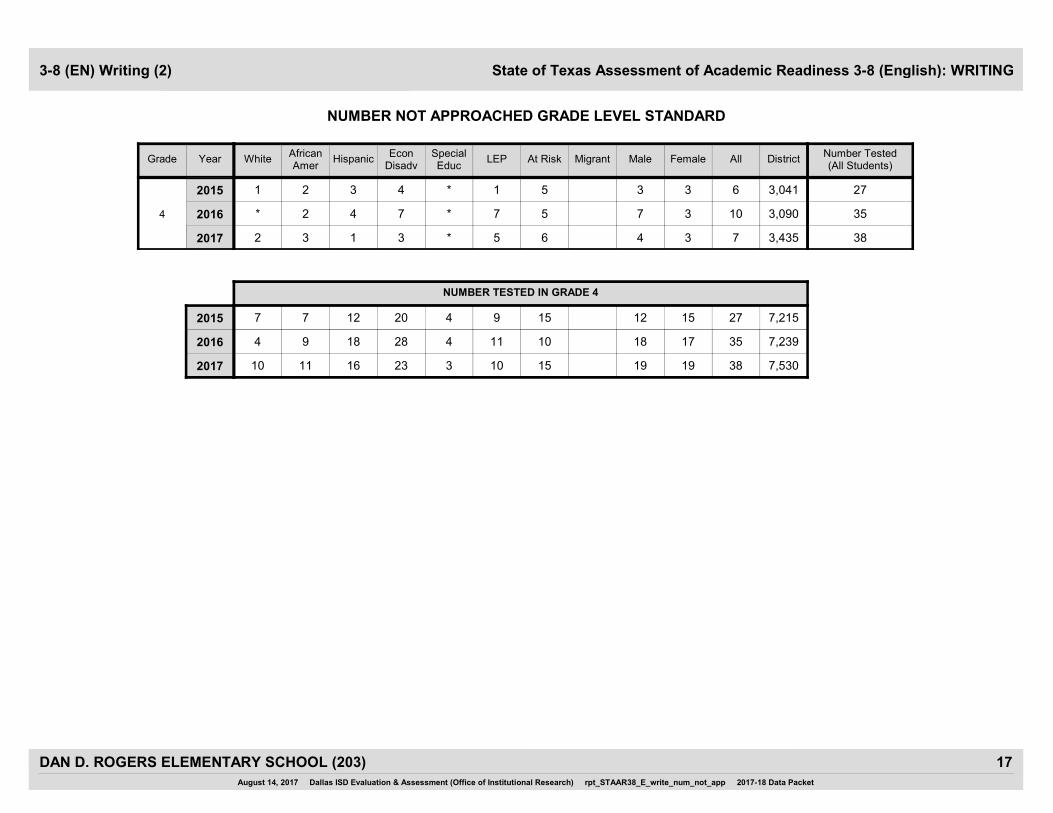
FemaleMigrant MaleAt RiskWhiteAfricanAmer
HispanicEcon
DisadvSpecialEduc
LEP All DistrictYearGradeNumber Tested(All Students)
State of Texas Assessment of Academic Readiness 3-8 (English): WRITING
NUMBER NOT APPROACHED GRADE LEVEL STANDARD
3-8 (EN) Writing (2)
4 3
3 3
7 3
3,4352017 2 3 1 3 * 5 7 386
4
3,0412015 1 2 3 4 * 1 6 275
3,0902016 * 2 4 7 * 7 10 355
NUMBER TESTED IN GRADE 4
19 19
12 15
18 17
7,5302017 10 1611 23 3 10 3815
7,2152015 7 127 20 4 9 2715
7,2392016 4 189 28 4 11 3510
August 14, 2017 Dallas ISD Evaluation & Assessment (Office of Institutional Research) rpt_STAAR38_E_write_num_not_app 2017-18 Data Packet
17DAN D. ROGERS ELEMENTARY SCHOOL (203)
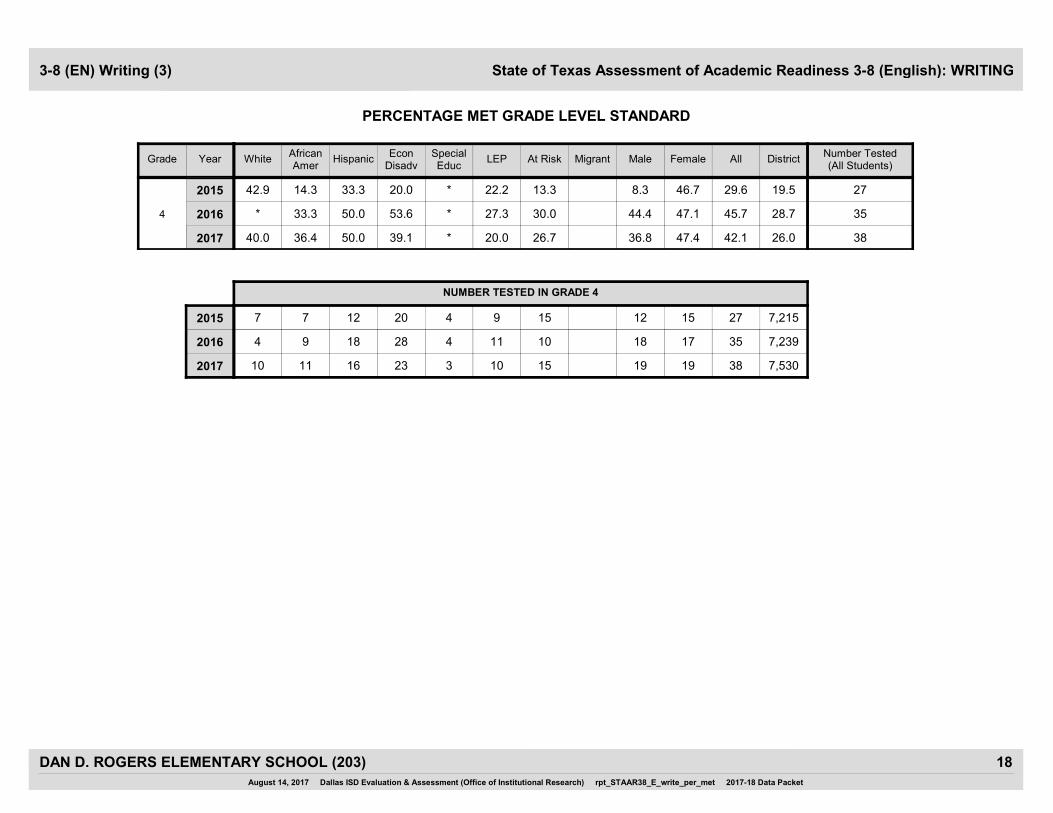
FemaleMigrant MaleAt RiskWhiteAfricanAmer
HispanicEcon
DisadvSpecialEduc
LEP All DistrictYearGradeNumber Tested(All Students)
State of Texas Assessment of Academic Readiness 3-8 (English): WRITING
PERCENTAGE MET GRADE LEVEL STANDARD
3-8 (EN) Writing (3)
36.8 47.4
8.3 46.7
44.4 47.1
26.02017 40.0 36.4 50.0 39.1 * 20.0 42.1 3826.7
4
19.52015 42.9 14.3 33.3 20.0 * 22.2 29.6 2713.3
28.72016 * 33.3 50.0 53.6 * 27.3 45.7 3530.0
NUMBER TESTED IN GRADE 4
19 19
12 15
18 17
7,5302017 10 1611 23 3 10 3815
7,2152015 7 127 20 4 9 2715
7,2392016 4 189 28 4 11 3510
August 14, 2017 Dallas ISD Evaluation & Assessment (Office of Institutional Research) rpt_STAAR38_E_write_per_met 2017-18 Data Packet
18DAN D. ROGERS ELEMENTARY SCHOOL (203)

FemaleMigrant MaleAt RiskWhiteAfricanAmer
HispanicEcon
DisadvSpecialEduc
LEP All DistrictYearGradeNumber Tested(All Students)
State of Texas Assessment of Academic Readiness 3-8 (English): WRITING
PERCENTAGE MASTERED GRADE LEVEL STANDARD
3-8 (EN) Writing (4)
10.5 31.6
0.0 0.0
22.2 23.5
7.42017 10.0 27.3 25.0 21.7 * 0.0 21.1 386.7
4
4.12015 0.0 0.0 0.0 0.0 * 0.0 0.0 270.0
10.92016 * 11.1 27.8 25.0 * 18.2 22.9 3520.0
NUMBER TESTED IN GRADE 4
19 19
12 15
18 17
7,5302017 10 1611 23 3 10 3815
7,2152015 7 127 20 4 9 2715
7,2392016 4 189 28 4 11 3510
August 14, 2017 Dallas ISD Evaluation & Assessment (Office of Institutional Research) rpt_STAAR38_E_write_per_mst 2017-18 Data Packet
19DAN D. ROGERS ELEMENTARY SCHOOL (203)
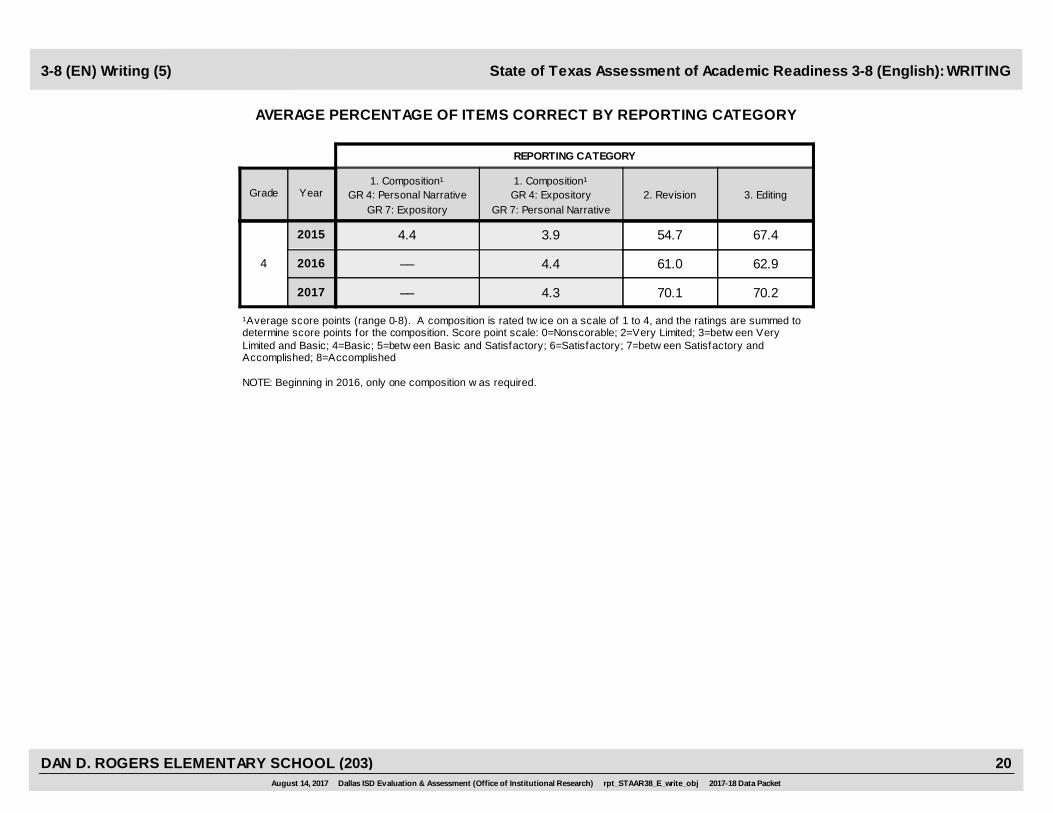
1. Composition¹GR 4: Expository
GR 7: Personal Narrative
1. Composition¹GR 4: Personal Narrative
GR 7: Expository2. Revision 3. EditingYearGrade
REPORTING CATEGORY
State of Texas Assessment of Academic Readiness 3-8 (English): WRITING
AVERAGE PERCENTAGE OF ITEMS CORRECT BY REPORTING CATEGORY
3-8 (EN) Writing (5)
4.3
3.9
4.4
2017 –– 70.1 70.2
2015 4.4 54.7 67.4
4 2016 –– 61.0 62.9
¹Average score points (range 0-8). A composition is rated tw ice on a scale of 1 to 4, and the ratings are summed to determine score points for the composition. Score point scale: 0=Nonscorable; 2=Very Limited; 3=betw een Very Limited and Basic; 4=Basic; 5=betw een Basic and Satisfactory; 6=Satisfactory; 7=betw een Satisfactory and Accomplished; 8=Accomplished
NOTE: Beginning in 2016, only one composition w as required.
August 14, 2017 Dallas ISD Evaluation & Assessment (Office of Institutional Research) rpt_STAAR38_E_write_obj 2017-18 Data Packet
20DAN D. ROGERS ELEMENTARY SCHOOL (203)

FemaleMigrant MaleAt RiskWhiteAfricanAmer
HispanicEcon
DisadvSpecialEduc
LEP All DistrictYearGradeNumber Tested(All Students)
State of Texas Assessment of Academic Readiness 3-8 (English): MATHEMATICS
PERCENTAGE APPROACHED GRADE LEVEL STANDARD
3-8 (EN) Math (1)
83.7 87.1
78.1 90.6
77.1 80.6
70.02017 83.3 62.5 88.0 81.5 * 87.5 85.1 7484.8
3
63.82015 * 84.6 84.1 87.7 * 81.3 84.4 6479.6
65.32016 100.0 75.0 80.4 85.2 * 71.7 78.9 7174.0
80.6 84.8
88.9 75.7
83.3 84.0
68.12017 70.0 72.7 89.4 88.2 * 80.5 82.6 6980.4
4
60.42015 85.7 85.7 79.6 82.1 42.9 80.4 81.3 6478.4
63.52016 * 66.7 94.7 87.2 * 83.9 83.6 5590.0
96.9 92.3
84.8 75.0
100.0 91.9
80.62017 83.3 81.8 100.0 94.1 * 96.0 94.8 5893.9
5
66.42015 * 45.5 89.2 87.2 66.7 88.2 81.1 5384.2
79.62016 * 85.7 96.1 98.1 85.7 95.8 95.3 6494.4
86.5 87.8
83.7 80.9
85.9 85.7
72.72017 78.6 73.3 91.9 87.8 50.0 86.8 87.1 20185.6
3-5
63.52015 92.9 71.0 83.8 85.5 50.0 83.0 82.3 18180.4
69.32016 88.2 75.0 90.0 90.3 78.6 84.0 85.8 19085.8
111 90
92 89
92 98
37,2782017 28 13630 156 10 114 201125
36,9652015 14 13031 152 16 112 181134
NUMBER TESTED IN GRADES 3-5
36,9592016 17 14024 155 14 125 190134
August 14, 2017 Dallas ISD Evaluation & Assessment (Office of Institutional Research) rpt_STAAR38_E_math_per_app 2017-18 Data Packet
21DAN D. ROGERS ELEMENTARY SCHOOL (203)
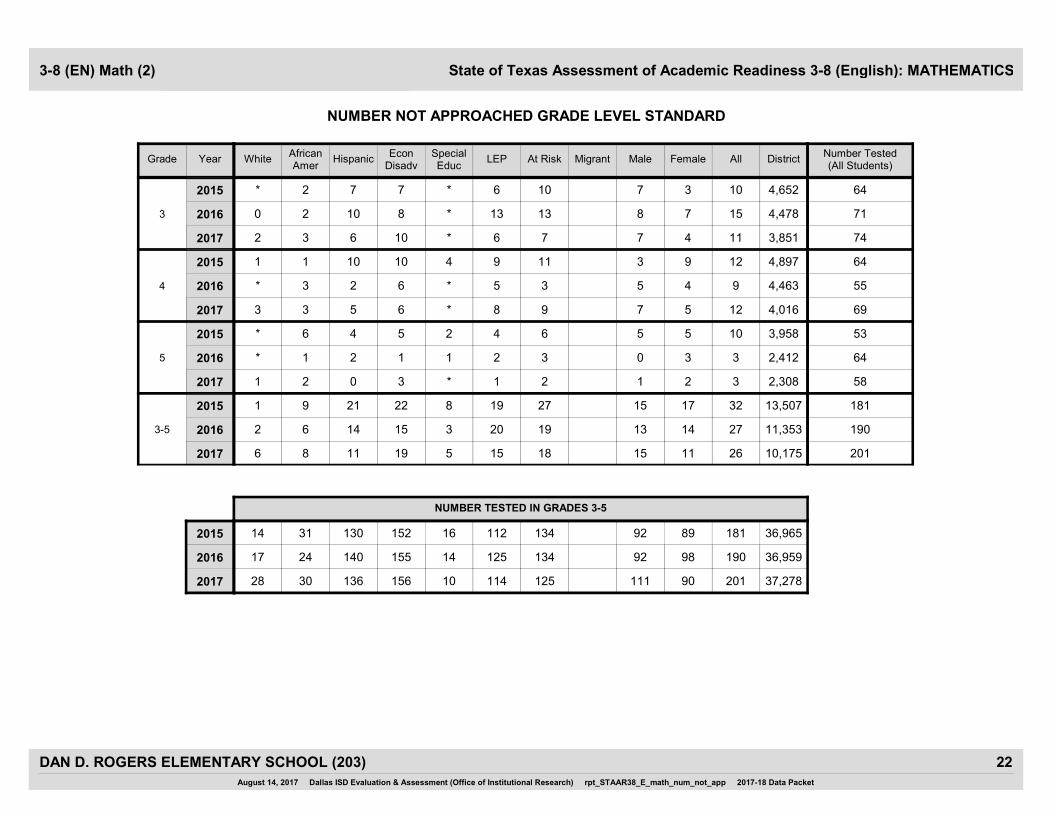
FemaleMigrant MaleAt RiskWhiteAfricanAmer
HispanicEcon
DisadvSpecialEduc
LEP All DistrictYearGradeNumber Tested(All Students)
State of Texas Assessment of Academic Readiness 3-8 (English): MATHEMATICS
NUMBER NOT APPROACHED GRADE LEVEL STANDARD
3-8 (EN) Math (2)
7 4
7 3
8 7
3,8512017 2 3 6 10 * 6 11 747
3
4,6522015 * 2 7 7 * 6 10 6410
4,4782016 0 2 10 8 * 13 15 7113
7 5
3 9
5 4
4,0162017 3 3 5 6 * 8 12 699
4
4,8972015 1 1 10 10 4 9 12 6411
4,4632016 * 3 2 6 * 5 9 553
1 2
5 5
0 3
2,3082017 1 2 0 3 * 1 3 582
5
3,9582015 * 6 4 5 2 4 10 536
2,4122016 * 1 2 1 1 2 3 643
15 11
15 17
13 14
10,1752017 6 8 11 19 5 15 26 20118
3-5
13,5072015 1 9 21 22 8 19 32 18127
11,3532016 2 6 14 15 3 20 27 19019
NUMBER TESTED IN GRADES 3-5
111 90
92 89
92 98
37,2782017 28 13630 156 10 114 201125
36,9652015 14 13031 152 16 112 181134
36,9592016 17 14024 155 14 125 190134
August 14, 2017 Dallas ISD Evaluation & Assessment (Office of Institutional Research) rpt_STAAR38_E_math_num_not_app 2017-18 Data Packet
22DAN D. ROGERS ELEMENTARY SCHOOL (203)
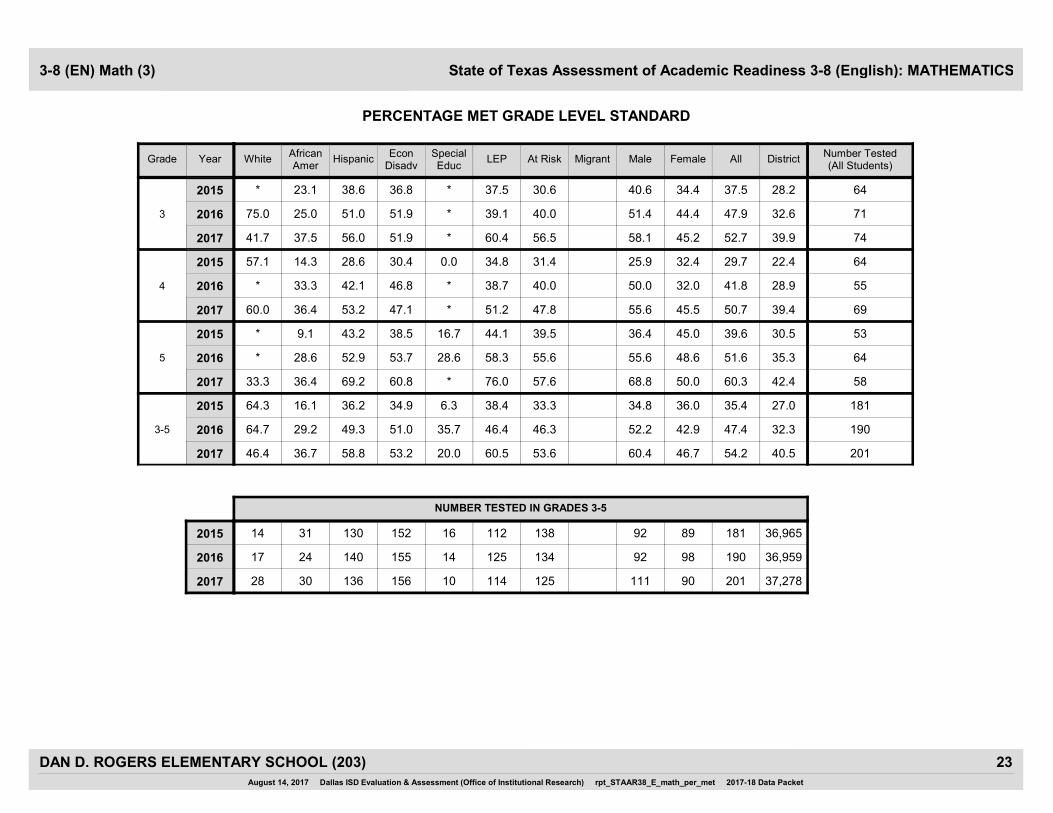
FemaleMigrant MaleAt RiskWhiteAfricanAmer
HispanicEcon
DisadvSpecialEduc
LEP All DistrictYearGradeNumber Tested(All Students)
State of Texas Assessment of Academic Readiness 3-8 (English): MATHEMATICS
PERCENTAGE MET GRADE LEVEL STANDARD
3-8 (EN) Math (3)
58.1 45.2
40.6 34.4
51.4 44.4
39.92017 41.7 37.5 56.0 51.9 * 60.4 52.7 7456.5
3
28.22015 * 23.1 38.6 36.8 * 37.5 37.5 6430.6
32.62016 75.0 25.0 51.0 51.9 * 39.1 47.9 7140.0
55.6 45.5
25.9 32.4
50.0 32.0
39.42017 60.0 36.4 53.2 47.1 * 51.2 50.7 6947.8
4
22.42015 57.1 14.3 28.6 30.4 0.0 34.8 29.7 6431.4
28.92016 * 33.3 42.1 46.8 * 38.7 41.8 5540.0
68.8 50.0
36.4 45.0
55.6 48.6
42.42017 33.3 36.4 69.2 60.8 * 76.0 60.3 5857.6
5
30.52015 * 9.1 43.2 38.5 16.7 44.1 39.6 5339.5
35.32016 * 28.6 52.9 53.7 28.6 58.3 51.6 6455.6
60.4 46.7
34.8 36.0
52.2 42.9
40.52017 46.4 36.7 58.8 53.2 20.0 60.5 54.2 20153.6
3-5
27.02015 64.3 16.1 36.2 34.9 6.3 38.4 35.4 18133.3
32.32016 64.7 29.2 49.3 51.0 35.7 46.4 47.4 19046.3
111 90
92 89
92 98
37,2782017 28 13630 156 10 114 201125
36,9652015 14 13031 152 16 112 181138
NUMBER TESTED IN GRADES 3-5
36,9592016 17 14024 155 14 125 190134
August 14, 2017 Dallas ISD Evaluation & Assessment (Office of Institutional Research) rpt_STAAR38_E_math_per_met 2017-18 Data Packet
23DAN D. ROGERS ELEMENTARY SCHOOL (203)

FemaleMigrant MaleAt RiskWhiteAfricanAmer
HispanicEcon
DisadvSpecialEduc
LEP All DistrictYearGradeNumber Tested(All Students)
State of Texas Assessment of Academic Readiness 3-8 (English): MATHEMATICS
PERCENTAGE MASTERED GRADE LEVEL STANDARD
3-8 (EN) Math (4)
34.9 19.4
25.0 15.6
17.1 19.4
19.92017 16.7 12.5 34.0 25.9 * 35.4 28.4 7432.6
3
9.02015 * 15.4 18.2 19.3 * 15.6 20.3 6414.3
12.52016 25.0 12.5 19.6 24.1 * 17.4 18.3 7116.0
44.4 30.3
18.5 21.6
26.7 16.0
22.12017 40.0 9.1 44.7 33.3 * 43.9 37.7 6939.1
4
10.12015 28.6 14.3 20.4 21.4 0.0 26.1 20.3 6423.5
14.62016 * 11.1 18.4 23.4 * 19.4 21.8 5520.0
25.0 11.5
15.2 15.0
18.5 18.9
19.32017 16.7 9.1 20.5 15.7 * 24.0 19.0 5818.2
5
11.82015 * 0.0 21.6 12.8 0.0 17.6 15.1 5315.8
13.92016 * 14.3 19.6 20.4 0.0 20.8 18.8 6418.5
35.1 21.1
19.6 18.0
20.7 18.4
20.42017 25.0 10.0 33.8 25.0 10.0 36.0 28.9 20131.2
3-5
10.32015 14.3 9.7 20.0 18.4 0.0 20.5 18.8 18118.1
13.62016 23.5 12.5 19.3 22.6 0.0 19.2 19.5 19017.9
NUMBER TESTED IN GRADE 3-5
111 90
92 89
92 98
37,2782017 28 13630 156 10 114 201125
36,9652015 14 13031 152 16 112 181138
36,9592016 17 14024 155 14 125 190134
August 14, 2017 Dallas ISD Evaluation & Assessment (Office of Institutional Research) rpt_STAAR38_E_math_per_mst 2017-18 Data Packet
24DAN D. ROGERS ELEMENTARY SCHOOL (203)
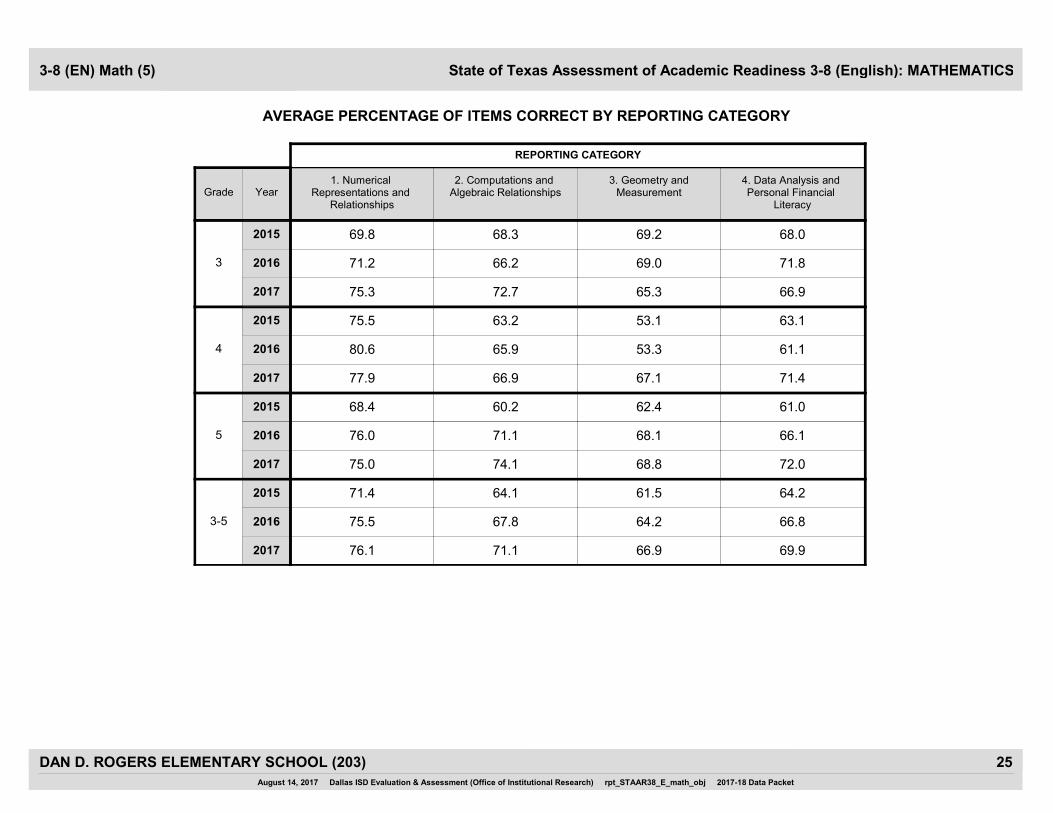
1. Numerical Representations and
Relationships
2. Computations and Algebraic Relationships
3. Geometry andMeasurement
4. Data Analysis and Personal Financial
Literacy
YearGrade
REPORTING CATEGORY
State of Texas Assessment of Academic Readiness 3-8 (English): MATHEMATICS
AVERAGE PERCENTAGE OF ITEMS CORRECT BY REPORTING CATEGORY
3-8 (EN) Math (5)
2017 75.3 72.7 65.3 66.9
2015 69.8 68.3 69.2 68.0
3 2016 71.2 66.2 69.0 71.8
2017 77.9 66.9 67.1 71.4
2015 75.5 63.2 53.1 63.1
4 2016 80.6 65.9 53.3 61.1
2017 75.0 74.1 68.8 72.0
2015 68.4 60.2 62.4 61.0
5 2016 76.0 71.1 68.1 66.1
2017 76.1 71.1 66.9 69.9
2015 71.4 64.1 61.5 64.2
3-5 2016 75.5 67.8 64.2 66.8
August 14, 2017 Dallas ISD Evaluation & Assessment (Office of Institutional Research) rpt_STAAR38_E_math_obj 2017-18 Data Packet
25DAN D. ROGERS ELEMENTARY SCHOOL (203)

FemaleMigrant MaleAt RiskWhiteAfricanAmer
HispanicEcon
DisadvSpecialEduc
LEP All DistrictYearGradeNumber Tested(All Students)
State of Texas Assessment of Academic Readiness 3-8 (English): SCIENCE
PERCENTAGE APPROACHED GRADE LEVEL STANDARD
3-8 (EN) Science (1)
84.4 80.8
60.6 55.0
81.5 64.9
65.92017 66.7 72.7 87.2 81.6 * 76.0 82.8 5872.7
5
57.12015 * 36.4 59.5 61.5 66.7 55.9 58.5 5355.3
66.12016 * 71.4 70.6 72.2 71.4 68.8 71.9 6467.3
NUMBER TESTED IN GRADE 5
32 26
33 20
27 37
9,7592017 6 3911 49 3 25 5833
9,4532015 4 3711 39 6 34 5338
9,6262016 5 517 54 7 48 6455
August 14, 2017 Dallas ISD Evaluation & Assessment (Office of Institutional Research) rpt_STAAR38_E_sc_per_app 2017-18 Data Packet
26DAN D. ROGERS ELEMENTARY SCHOOL (203)

FemaleMigrant MaleAt RiskWhiteAfricanAmer
HispanicEcon
DisadvSpecialEduc
LEP All DistrictYearGradeNumber Tested(All Students)
State of Texas Assessment of Academic Readiness 3-8 (English): SCIENCE
NUMBER NOT APPROACHED GRADE LEVEL STANDARD
3-8 (EN) Science (2)
5 5
13 9
5 13
33282017 2 3 5 9 * 6 10 589
5
40592015 * 7 15 15 2 15 22 5317
32632016 * 2 15 15 2 15 18 6418
NUMBER TESTED IN GRADE 5
32 26
33 20
27 37
9,7592017 6 3911 49 3 25 5833
9,4532015 4 3711 39 6 34 5338
9,6262016 5 517 54 7 48 6455
August 14, 2017 Dallas ISD Evaluation & Assessment (Office of Institutional Research) rpt_STAAR38_E_sc_num_not_app 2017-18 Data Packet
27DAN D. ROGERS ELEMENTARY SCHOOL (203)

FemaleMigrant MaleAt RiskWhiteAfricanAmer
HispanicEcon
DisadvSpecialEduc
LEP All DistrictYearGradeNumber Tested(All Students)
State of Texas Assessment of Academic Readiness 3-8 (English): SCIENCE
PERCENTAGE MET GRADE LEVEL STANDARD
3-8 (EN) Science (3)
56.3 38.5
33.3 30.0
48.1 16.2
33.02017 50.0 27.3 51.3 51.0 * 40.0 48.3 5836.4
5
21.82015 * 18.2 29.7 28.2 33.3 32.4 32.1 5328.9
26.72016 * 14.3 31.4 29.6 42.9 27.1 29.7 6425.5
NUMBER TESTED IN GRADE 5
32 26
33 20
27 37
9,7592017 6 3911 49 3 25 5833
9,4532015 4 3711 39 6 34 5338
9,6262016 5 517 54 7 48 6455
August 14, 2017 Dallas ISD Evaluation & Assessment (Office of Institutional Research) rpt_STAAR38_E_sc_per_met 2017-18 Data Packet
28DAN D. ROGERS ELEMENTARY SCHOOL (203)

FemaleMigrant MaleAt RiskWhiteAfricanAmer
HispanicEcon
DisadvSpecialEduc
LEP All DistrictYearGradeNumber Tested(All Students)
State of Texas Assessment of Academic Readiness 3-8 (English): SCIENCE
PERCENTAGE MASTERED GRADE LEVEL STANDARD
3-8 (EN) Science (4)
28.1 19.2
9.1 5.0
7.4 8.1
12.82017 16.7 9.1 25.6 28.6 * 20.0 24.1 5818.2
5
6.32015 * 9.1 8.1 5.1 16.7 5.9 7.5 535.3
6.72016 * 0.0 7.8 5.6 0.0 6.3 7.8 645.5
NUMBER TESTED IN GRADE 5
32 26
33 20
27 37
9,7592017 6 3911 49 3 25 5833
9,4532015 4 3711 39 6 34 5338
9,6262016 5 517 54 7 48 6455
August 14, 2017 Dallas ISD Evaluation & Assessment (Office of Institutional Research) rpt_STAAR38_E_sc_per_mst 2017-18 Data Packet
29DAN D. ROGERS ELEMENTARY SCHOOL (203)
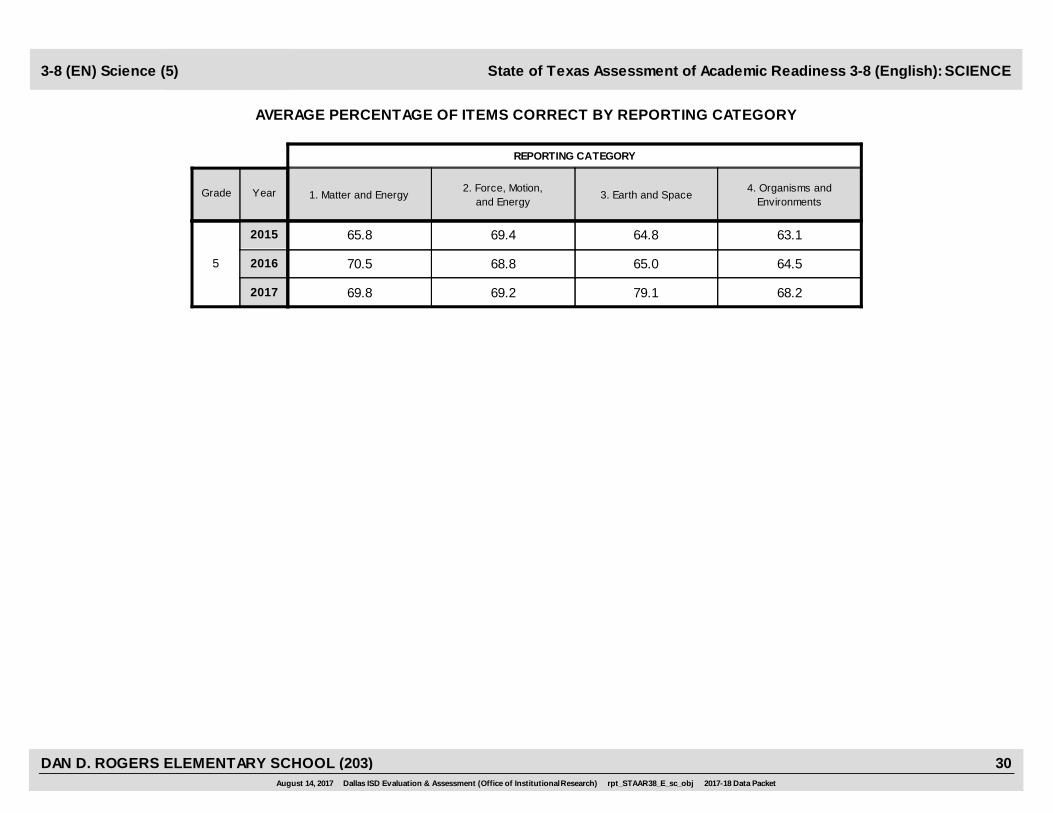
1. Matter and Energy2. Force, Motion,
and Energy3. Earth and Space
4. Organisms andEnvironments
YearGrade
REPORTING CATEGORY
State of Texas Assessment of Academic Readiness 3-8 (English): SCIENCE
AVERAGE PERCENTAGE OF ITEMS CORRECT BY REPORTING CATEGORY
3-8 (EN) Science (5)
2017 69.8 69.2 79.1 68.2
2015 65.8 69.4 64.8 63.1
5 2016 70.5 68.8 65.0 64.5
August 14, 2017 Dallas ISD Evaluation & Assessment (Office of Institutional Research) rpt_STAAR38_E_sc_obj 2017-18 Data Packet
30DAN D. ROGERS ELEMENTARY SCHOOL (203)
FemaleMigrant MaleAt RiskWhiteAfricanAmer
HispanicEcon
DisadvSpecialEduc
LEP All DistrictYearGradeNumber Tested(All Students)
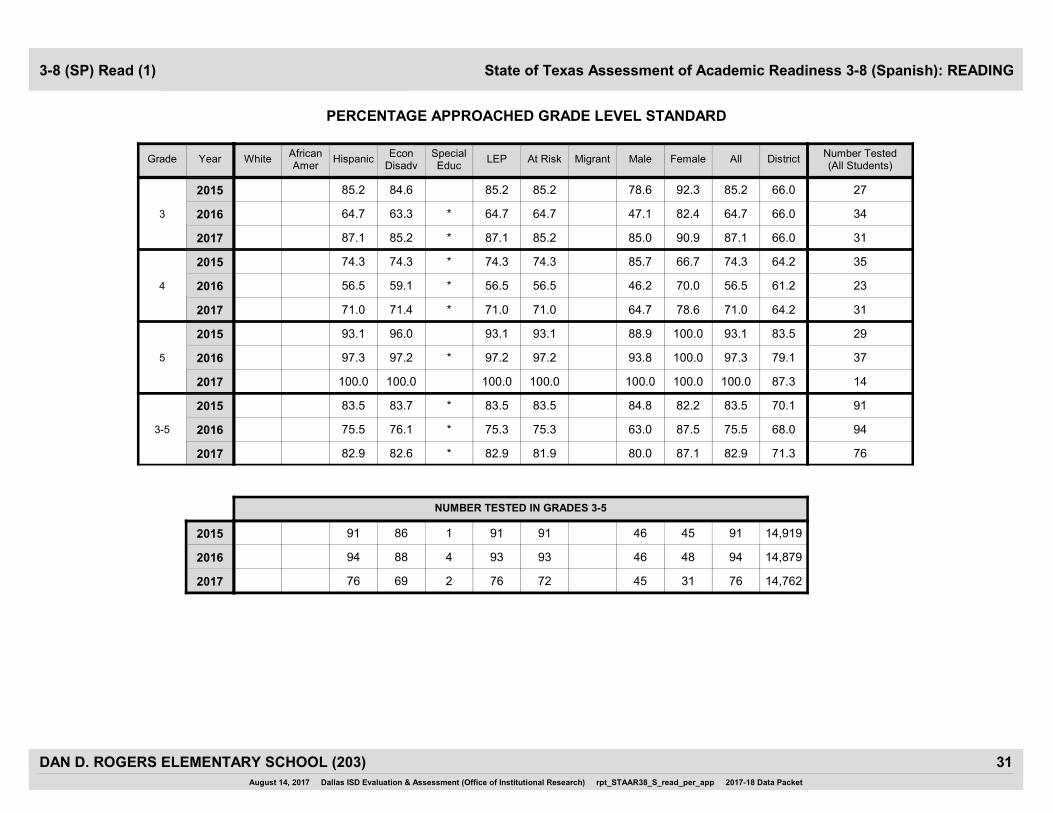
State of Texas Assessment of Academic Readiness 3-8 (Spanish): READING
PERCENTAGE APPROACHED GRADE LEVEL STANDARD
3-8 (SP) Read (1)
85.0 90.9
78.6 92.3
47.1 82.4
66.02017 87.1 85.2 * 87.1 87.1 3185.2
3
66.02015 85.2 84.6 85.2 85.2 2785.2
66.02016 64.7 63.3 * 64.7 64.7 3464.7
64.7 78.6
85.7 66.7
46.2 70.0
64.22017 71.0 71.4 * 71.0 71.0 3171.0
4
64.22015 74.3 74.3 * 74.3 74.3 3574.3
61.22016 56.5 59.1 * 56.5 56.5 2356.5
100.0 100.0
88.9 100.0
93.8 100.0
87.32017 100.0 100.0 100.0 100.0 14100.0
5
83.52015 93.1 96.0 93.1 93.1 2993.1
79.12016 97.3 97.2 * 97.2 97.3 3797.2
80.0 87.1
84.8 82.2
63.0 87.5
71.32017 82.9 82.6 * 82.9 82.9 7681.9
3-5
70.12015 83.5 83.7 * 83.5 83.5 9183.5
68.02016 75.5 76.1 * 75.3 75.5 9475.3
NUMBER TESTED IN GRADES 3-5
45 31
46 45
46 48
14,7622017 76 69 2 76 7672
14,9192015 91 86 1 91 9191
14,8792016 94 88 4 93 9493
August 14, 2017 Dallas ISD Evaluation & Assessment (Office of Institutional Research) rpt_STAAR38_S_read_per_app 2017-18 Data Packet
31DAN D. ROGERS ELEMENTARY SCHOOL (203)
FemaleMigrant MaleAt RiskWhiteAfricanAmer
HispanicEcon
DisadvSpecialEduc
LEP All DistrictYearGradeNumber Tested(All Students)
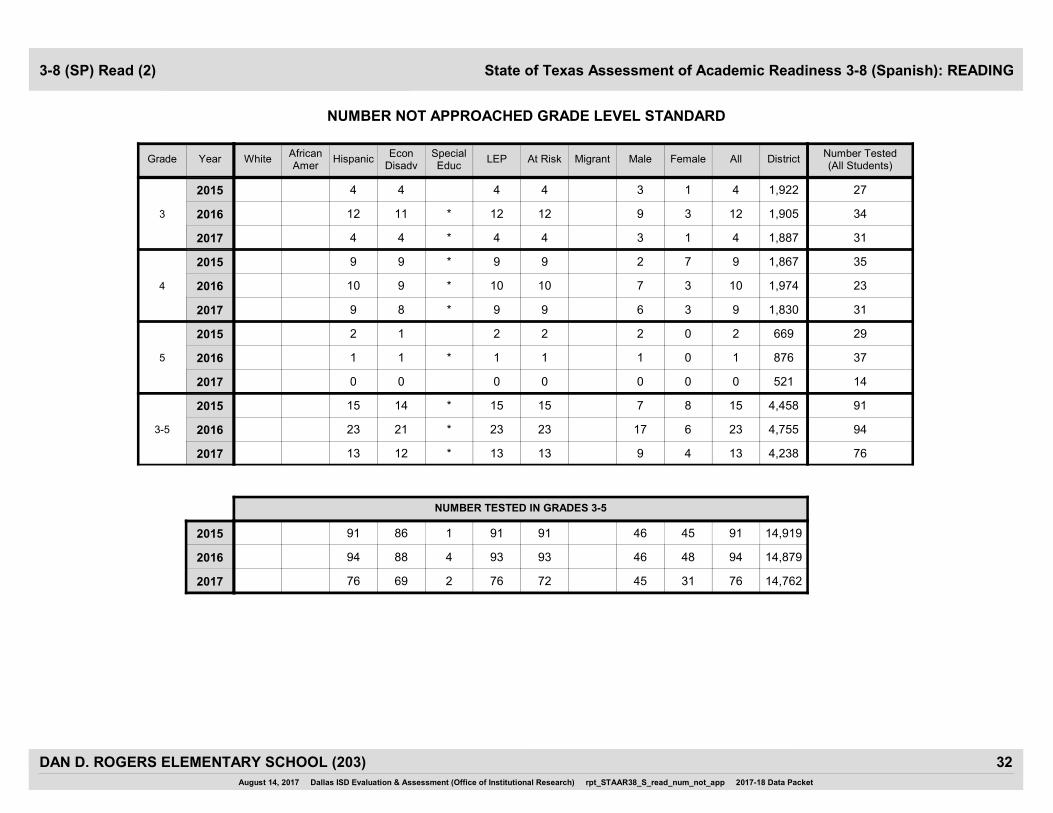
State of Texas Assessment of Academic Readiness 3-8 (Spanish): READING
NUMBER NOT APPROACHED GRADE LEVEL STANDARD
3-8 (SP) Read (2)
3 1
3 1
9 3
1,8872017 4 4 * 4 4 314
3
1,9222015 4 4 4 4 274
1,9052016 12 11 * 12 12 3412
6 3
2 7
7 3
1,8302017 9 8 * 9 9 319
4
1,8672015 9 9 * 9 9 359
1,9742016 10 9 * 10 10 2310
0 0
2 0
1 0
5212017 0 0 0 0 140
5
6692015 2 1 2 2 292
8762016 1 1 * 1 1 371
9 4
7 8
17 6
4,2382017 13 12 * 13 13 7613
3-5
4,4582015 15 14 * 15 15 9115
4,7552016 23 21 * 23 23 9423
NUMBER TESTED IN GRADES 3-5
45 31
46 45
46 48
14,7622017 76 69 2 76 7672
14,9192015 91 86 1 91 9191
14,8792016 94 88 4 93 9493
August 14, 2017 Dallas ISD Evaluation & Assessment (Office of Institutional Research) rpt_STAAR38_S_read_num_not_app 2017-18 Data Packet
32DAN D. ROGERS ELEMENTARY SCHOOL (203)
FemaleMigrant MaleAt RiskWhiteAfricanAmer
HispanicEcon
DisadvSpecialEduc
LEP All DistrictYearGradeNumber Tested(All Students)
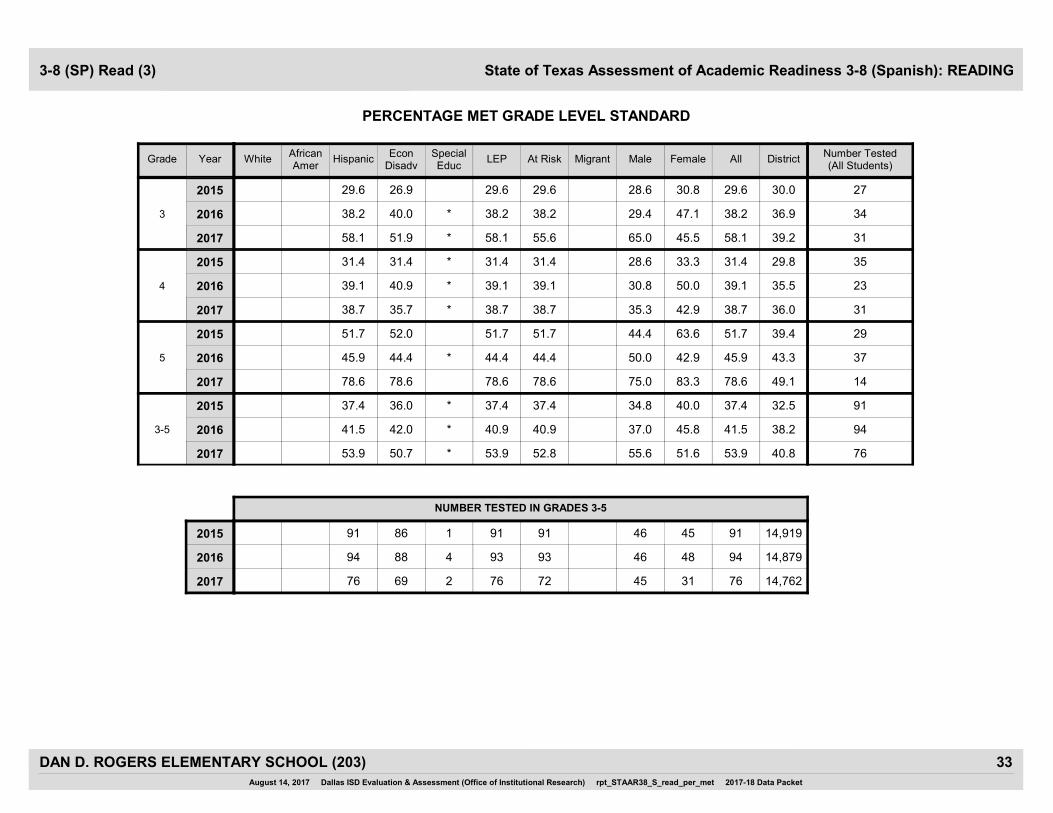
State of Texas Assessment of Academic Readiness 3-8 (Spanish): READING
PERCENTAGE MET GRADE LEVEL STANDARD
3-8 (SP) Read (3)
65.0 45.5
28.6 30.8
29.4 47.1
39.22017 58.1 51.9 * 58.1 58.1 3155.6
3
30.02015 29.6 26.9 29.6 29.6 2729.6
36.92016 38.2 40.0 * 38.2 38.2 3438.2
35.3 42.9
28.6 33.3
30.8 50.0
36.02017 38.7 35.7 * 38.7 38.7 3138.7
4
29.82015 31.4 31.4 * 31.4 31.4 3531.4
35.52016 39.1 40.9 * 39.1 39.1 2339.1
75.0 83.3
44.4 63.6
50.0 42.9
49.12017 78.6 78.6 78.6 78.6 1478.6
5
39.42015 51.7 52.0 51.7 51.7 2951.7
43.32016 45.9 44.4 * 44.4 45.9 3744.4
55.6 51.6
34.8 40.0
37.0 45.8
40.82017 53.9 50.7 * 53.9 53.9 7652.8
3-5
32.52015 37.4 36.0 * 37.4 37.4 9137.4
38.22016 41.5 42.0 * 40.9 41.5 9440.9
NUMBER TESTED IN GRADES 3-5
45 31
46 45
46 48
14,7622017 76 69 2 76 7672
14,9192015 91 86 1 91 9191
14,8792016 94 88 4 93 9493
August 14, 2017 Dallas ISD Evaluation & Assessment (Office of Institutional Research) rpt_STAAR38_S_read_per_met 2017-18 Data Packet
33DAN D. ROGERS ELEMENTARY SCHOOL (203)
FemaleMigrant MaleAt RiskWhiteAfricanAmer
HispanicEcon
DisadvSpecialEduc
LEP All DistrictYearGradeNumber Tested(All Students)
State of Texas Assessment of Academic Readiness 3-8 (Spanish): READING
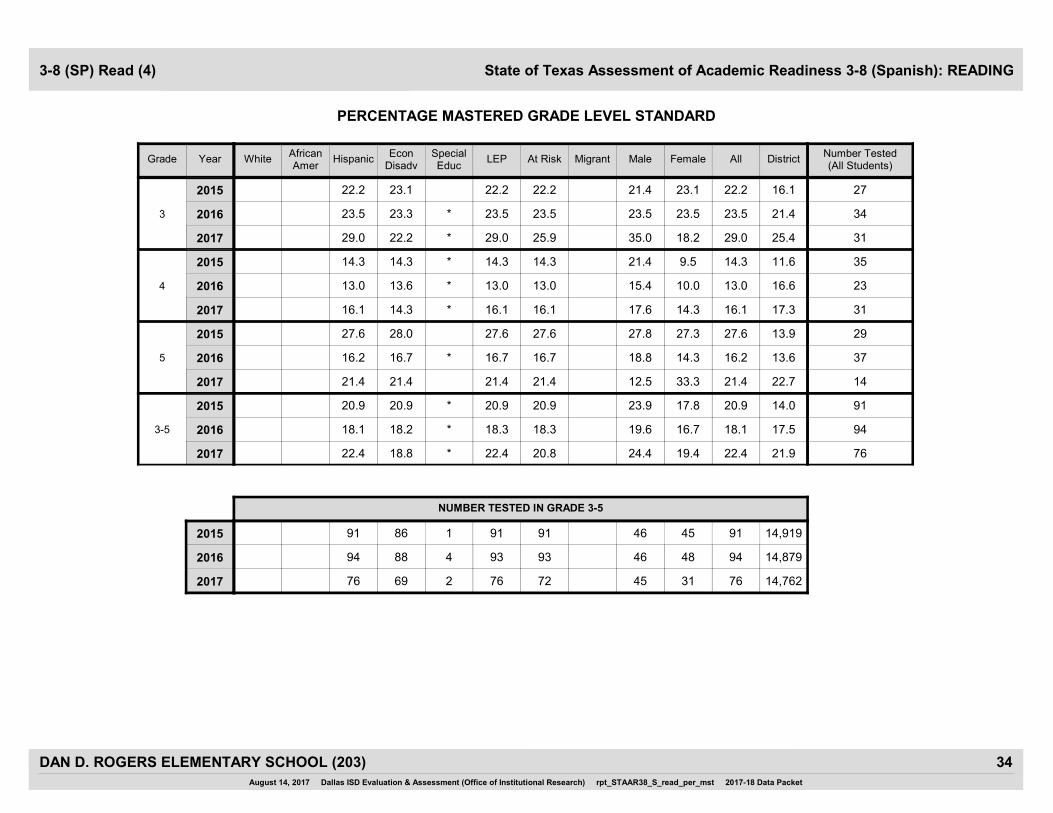
PERCENTAGE MASTERED GRADE LEVEL STANDARD
3-8 (SP) Read (4)
35.0 18.2
21.4 23.1
23.5 23.5
25.42017 29.0 22.2 * 29.0 29.0 3125.9
3
16.12015 22.2 23.1 22.2 22.2 2722.2
21.42016 23.5 23.3 * 23.5 23.5 3423.5
17.6 14.3
21.4 9.5
15.4 10.0
17.32017 16.1 14.3 * 16.1 16.1 3116.1
4
11.62015 14.3 14.3 * 14.3 14.3 3514.3
16.62016 13.0 13.6 * 13.0 13.0 2313.0
12.5 33.3
27.8 27.3
18.8 14.3
22.72017 21.4 21.4 21.4 21.4 1421.4
5
13.92015 27.6 28.0 27.6 27.6 2927.6
13.62016 16.2 16.7 * 16.7 16.2 3716.7
24.4 19.4
23.9 17.8
19.6 16.7
21.92017 22.4 18.8 * 22.4 22.4 7620.8
3-5
14.02015 20.9 20.9 * 20.9 20.9 9120.9
17.52016 18.1 18.2 * 18.3 18.1 9418.3
NUMBER TESTED IN GRADE 3-5
45 31
46 45
46 48
14,7622017 76 69 2 76 7672
14,9192015 91 86 1 91 9191
14,8792016 94 88 4 93 9493
August 14, 2017 Dallas ISD Evaluation & Assessment (Office of Institutional Research) rpt_STAAR38_S_read_per_mst 2017-18 Data Packet
34DAN D. ROGERS ELEMENTARY SCHOOL (203)
1. Understanding Across Genres 2. Understanding/Analysisof Literary Texts
3. Understanding/Analysisof Informational Texts
YearGrade
REPORTING CATEGORY
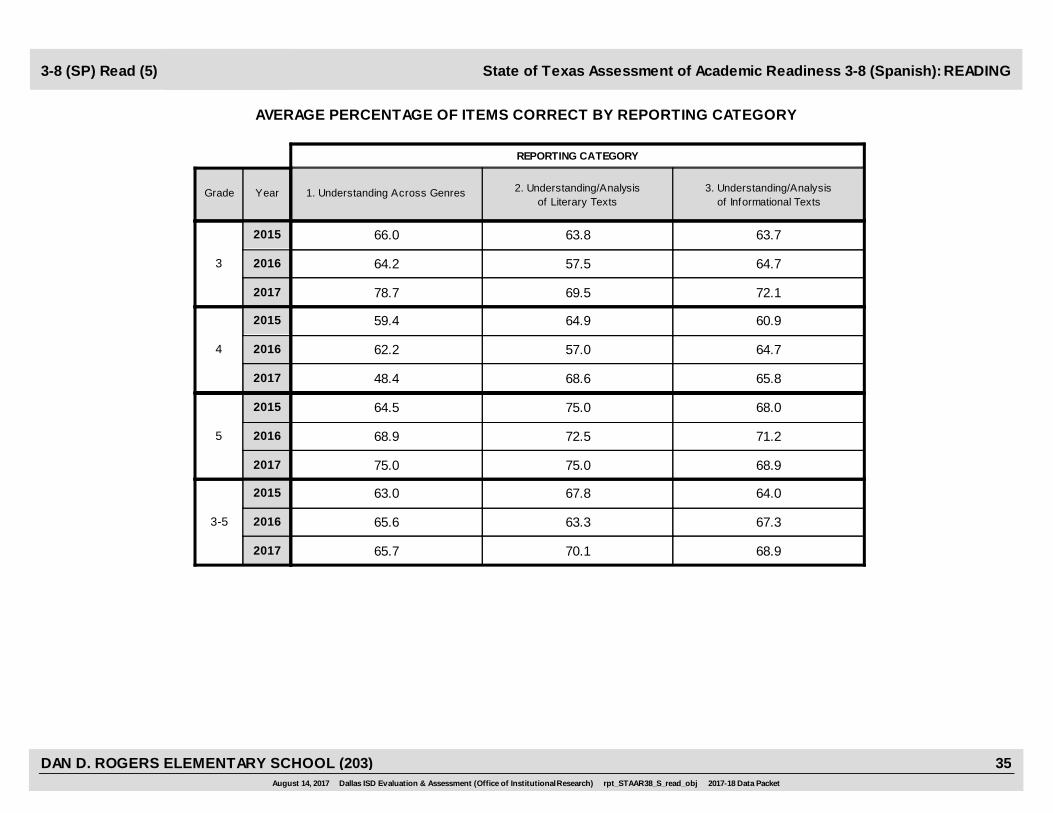
State of Texas Assessment of Academic Readiness 3-8 (Spanish): READING
AVERAGE PERCENTAGE OF ITEMS CORRECT BY REPORTING CATEGORY
3-8 (SP) Read (5)
2017 78.7 69.5 72.1
2015 66.0 63.8 63.7
3 2016 64.2 57.5 64.7
2017 48.4 68.6 65.8
2015 59.4 64.9 60.9
4 2016 62.2 57.0 64.7
2017 75.0 75.0 68.9
2015 64.5 75.0 68.0
5 2016 68.9 72.5 71.2
2017 65.7 70.1 68.9
2015 63.0 67.8 64.0
3-5 2016 65.6 63.3 67.3
August 14, 2017 Dallas ISD Evaluation & Assessment (Office of Institutional Research) rpt_STAAR38_S_read_obj 2017-18 Data Packet
35DAN D. ROGERS ELEMENTARY SCHOOL (203)
FemaleMigrant MaleAt RiskWhiteAfricanAmer
HispanicEcon
DisadvSpecialEduc
LEP All DistrictYearGradeNumber Tested(All Students)
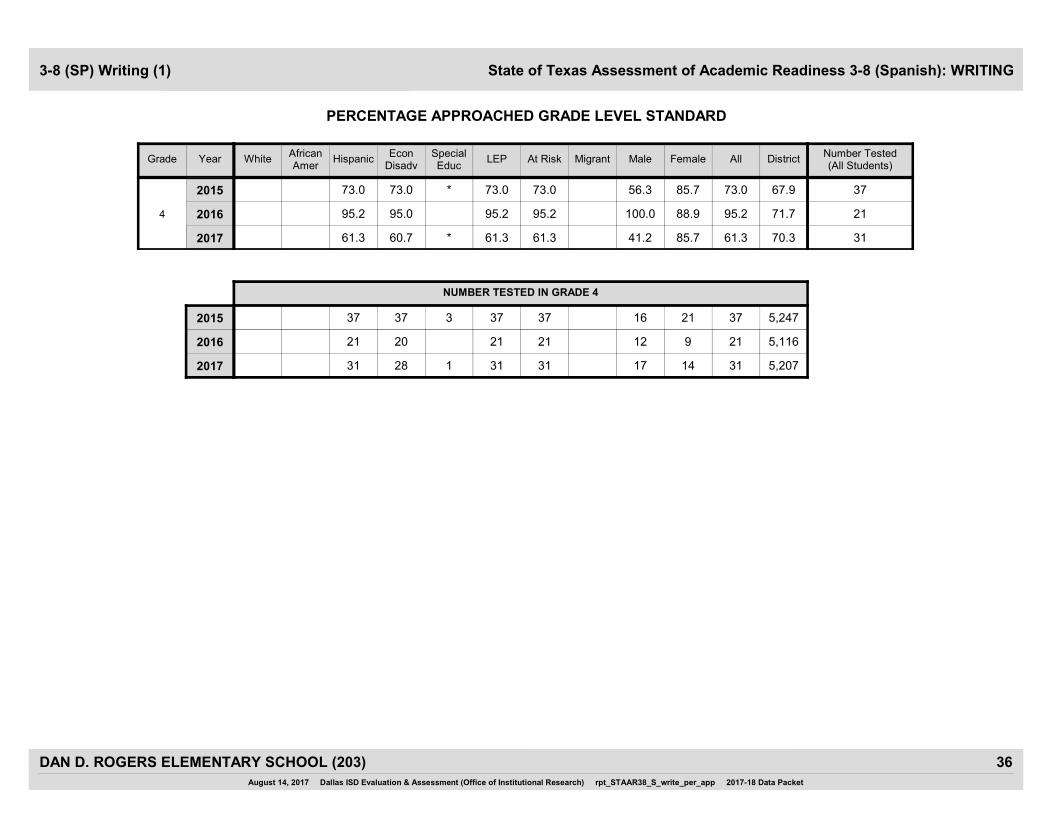
State of Texas Assessment of Academic Readiness 3-8 (Spanish): WRITING
PERCENTAGE APPROACHED GRADE LEVEL STANDARD
3-8 (SP) Writing (1)
41.2 85.7
56.3 85.7
100.0 88.9
70.32017 61.3 60.7 * 61.3 61.3 3161.3
4
67.92015 73.0 73.0 * 73.0 73.0 3773.0
71.72016 95.2 95.0 95.2 95.2 2195.2
NUMBER TESTED IN GRADE 4
17 14
16 21
12 9
5,2072017 31 28 1 31 3131
5,2472015 37 37 3 37 3737
5,1162016 21 20 21 2121
August 14, 2017 Dallas ISD Evaluation & Assessment (Office of Institutional Research) rpt_STAAR38_S_write_per_app 2017-18 Data Packet
36DAN D. ROGERS ELEMENTARY SCHOOL (203)

FemaleMigrant MaleAt RiskWhiteAfricanAmer
HispanicEcon
DisadvSpecialEduc
LEP All DistrictYearGradeNumber Tested(All Students)
State of Texas Assessment of Academic Readiness 3-8 (Spanish): WRITING
NUMBER NOT APPROACHED GRADE LEVEL STANDARD
3-8 (SP) Writing (2)
10 2
7 3
0 1
1,5482017 12 11 * 12 12 3112
4
1,6852015 10 10 * 10 10 3710
1,4492016 1 1 1 1 211
NUMBER TESTED IN GRADE 4
17 14
16 21
12 9
5,2072017 31 28 1 31 3131
5,2472015 37 37 3 37 3737
5,1162016 21 20 21 2121
August 14, 2017 Dallas ISD Evaluation & Assessment (Office of Institutional Research) rpt_STAAR38_S_write_num_not_app 2017-18 Data Packet
DAN D. ROGERS ELEMENTARY SCHOOL (203) 37
FemaleMigrant MaleAt RiskWhiteAfricanAmer
HispanicEcon
DisadvSpecialEduc
LEP All DistrictYearGradeNumber Tested(All Students)
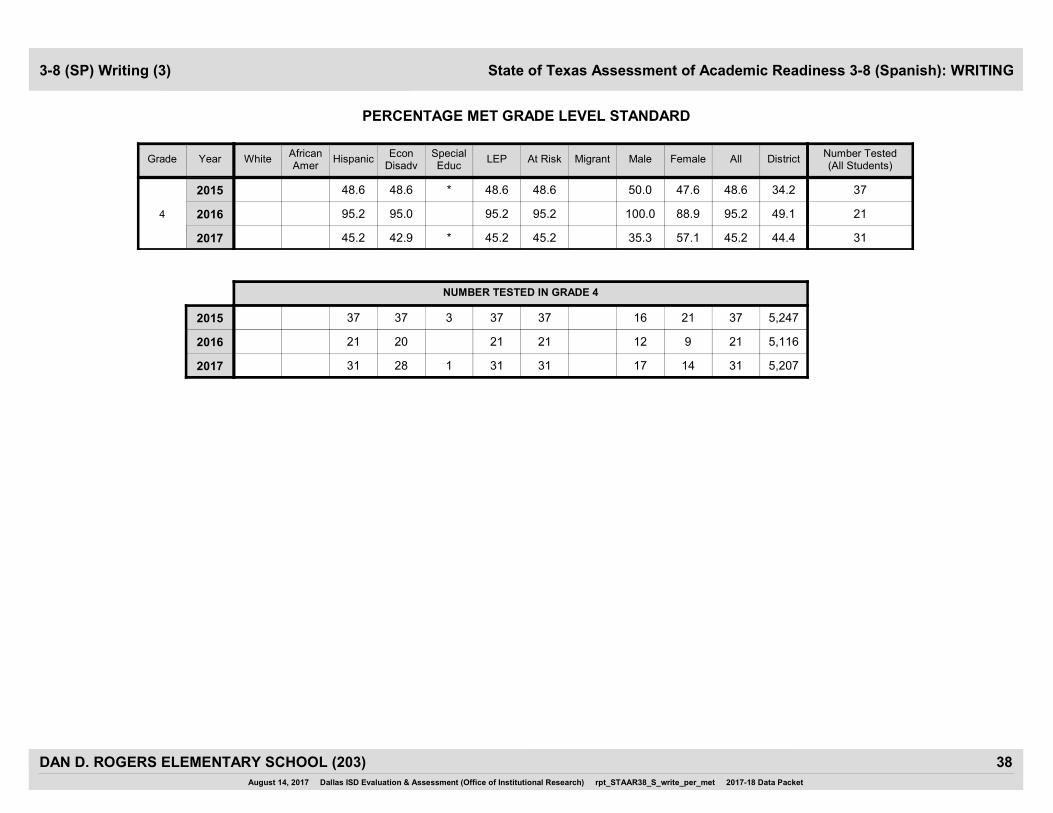
State of Texas Assessment of Academic Readiness 3-8 (Spanish): WRITING
PERCENTAGE MET GRADE LEVEL STANDARD
3-8 (SP) Writing (3)
35.3 57.1
50.0 47.6
100.0 88.9
44.42017 45.2 42.9 * 45.2 45.2 3145.2
4
34.22015 48.6 48.6 * 48.6 48.6 3748.6
49.12016 95.2 95.0 95.2 95.2 2195.2
NUMBER TESTED IN GRADE 4
17 14
16 21
12 9
5,2072017 31 28 1 31 3131
5,2472015 37 37 3 37 3737
5,1162016 21 20 21 2121
August 14, 2017 Dallas ISD Evaluation & Assessment (Office of Institutional Research) rpt_STAAR38_S_write_per_met 2017-18 Data Packet
38DAN D. ROGERS ELEMENTARY SCHOOL (203)

FemaleMigrant MaleAt RiskWhiteAfricanAmer
HispanicEcon
DisadvSpecialEduc
LEP All DistrictYearGradeNumber Tested(All Students)
State of Texas Assessment of Academic Readiness 3-8 (Spanish): WRITING
PERCENTAGE MASTERED GRADE LEVEL STANDARD
3-8 (SP) Writing (4)
17.6 21.4
6.3 4.8
25.0 44.4
14.42017 19.4 14.3 * 19.4 19.4 3119.4
4
7.22015 5.4 5.4 * 5.4 5.4 375.4
21.92016 33.3 35.0 33.3 33.3 2133.3
NUMBER TESTED IN GRADE 4
17 14
16 21
12 9
5,2072017 31 28 1 31 3131
5,2472015 37 37 3 37 3737
5,1162016 21 20 21 2121
August 14, 2017 Dallas ISD Evaluation & Assessment (Office of Institutional Research) rpt_STAAR38_S_write_per_mst 2017-18 Data Packet
39DAN D. ROGERS ELEMENTARY SCHOOL (203)
1. CompositionExpository¹
1. CompositionPersonal Narrative¹
2. Revision 3. EditingYearGrade
REPORTING CATEGORY
State of Texas Assessment of Academic Readiness 3-8 (Spanish): WRITING
AVERAGE PERCENTAGE OF ITEMS CORRECT BY REPORTING CATEGORY
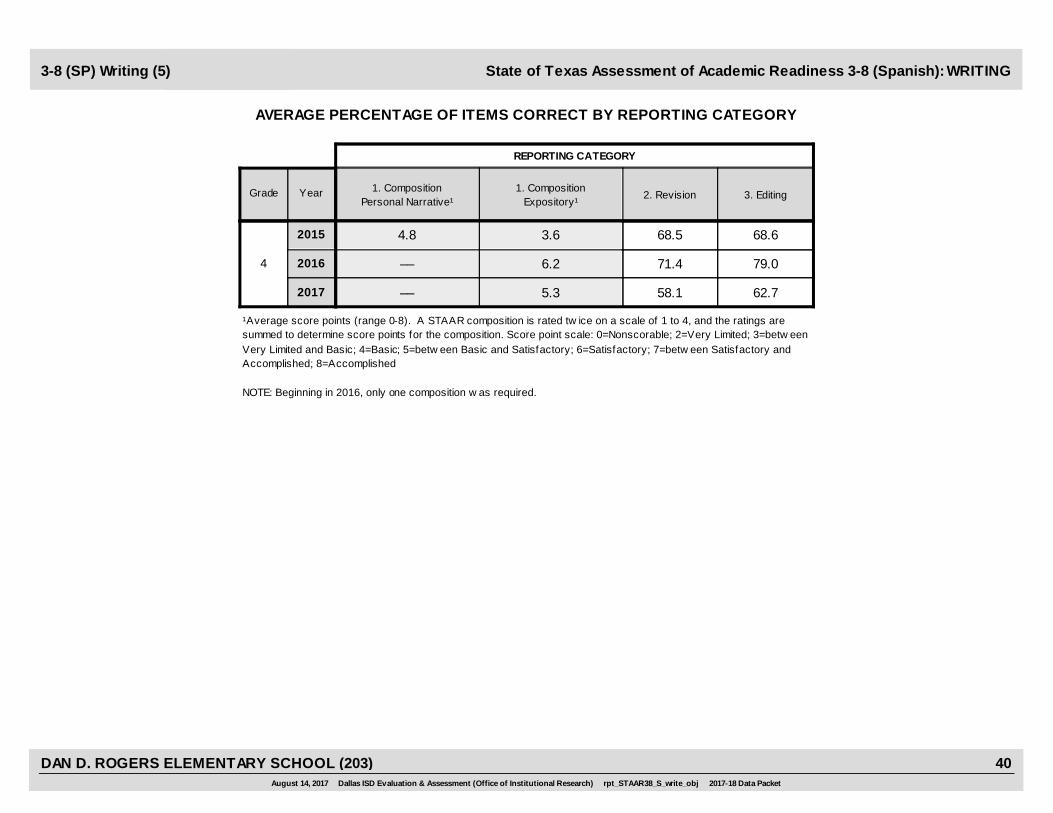
3-8 (SP) Writing (5)
5.3
3.6
6.2
2017 –– 58.1 62.7
2015 4.8 68.5 68.6
4 2016 –– 71.4 79.0
¹Average score points (range 0-8). A STAAR composition is rated tw ice on a scale of 1 to 4, and the ratings are summed to determine score points for the composition. Score point scale: 0=Nonscorable; 2=Very Limited; 3=betw een Very Limited and Basic; 4=Basic; 5=betw een Basic and Satisfactory; 6=Satisfactory; 7=betw een Satisfactory and Accomplished; 8=Accomplished
NOTE: Beginning in 2016, only one composition w as required.
August 14, 2017 Dallas ISD Evaluation & Assessment (Office of Institutional Research) rpt_STAAR38_S_write_obj 2017-18 Data Packet
40DAN D. ROGERS ELEMENTARY SCHOOL (203)
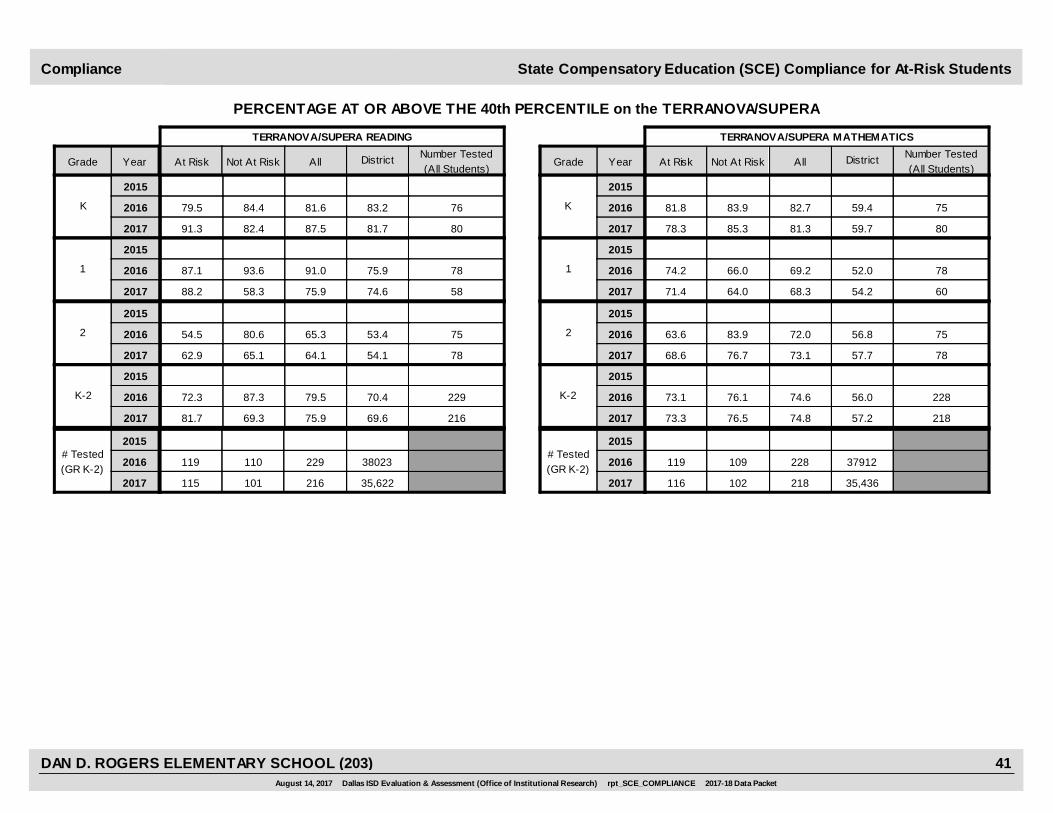
PERCENTAGE AT OR ABOVE THE 40th PERCENTILE on the TERRANOVA/SUPERA
Number Tested(All Students)
Number Tested(All Students)
DistrictAt Risk Not At Risk All DistrictYearGrade At Risk Not At Risk All
State Compensatory Education (SCE) Compliance for At-Risk StudentsCompliance
YearGrade
TERRANOVA/SUPERA MATHEMATICSTERRANOVA/SUPERA READING
2015
K
59.7 8081.72017 91.3 82.4 87.5 80 78.3 85.3 81.3
59.4 7583.22016 79.5 84.4 81.6 76 81.8 83.9 82.7
2015
K
2017
2016
2015
1
54.2 6074.62017 88.2 58.3 75.9 58 71.4 64.0 68.3
52.0 7875.92016 87.1 93.6 91.0 78 74.2 66.0 69.2
2015
1
2017
2016
2015
2
57.7 7854.12017 62.9 65.1 64.1 78 68.6 76.7 73.1
56.8 7553.42016 54.5 80.6 65.3 75 63.6 83.9 72.0
2015
2
2017
2016
2015
K-2
57.2 21869.62017 81.7 69.3 75.9 216 73.3 76.5 74.8
56.0 22870.42016 72.3 87.3 79.5 229 73.1 76.1 74.6
2015
K-2
2017
2016
35,6222017 115 101 216 35,436116 102 218
2015
380232016 119 110 229 37912119 109 228# Tested(GR K-2)
2017
2015
2016# Tested(GR K-2)
August 14, 2017 Dallas ISD Evaluation & Assessment (Office of Institutional Research) rpt_SCE_COMPLIANCE 2017-18 Data Packet
41DAN D. ROGERS ELEMENTARY SCHOOL (203)
FemaleMigrant MaleAt RiskWhite AfricanAmer
Hispanic EconDisadv
SpecialEduc
LEP All DistrictYearGrade Number Tested(All Students)
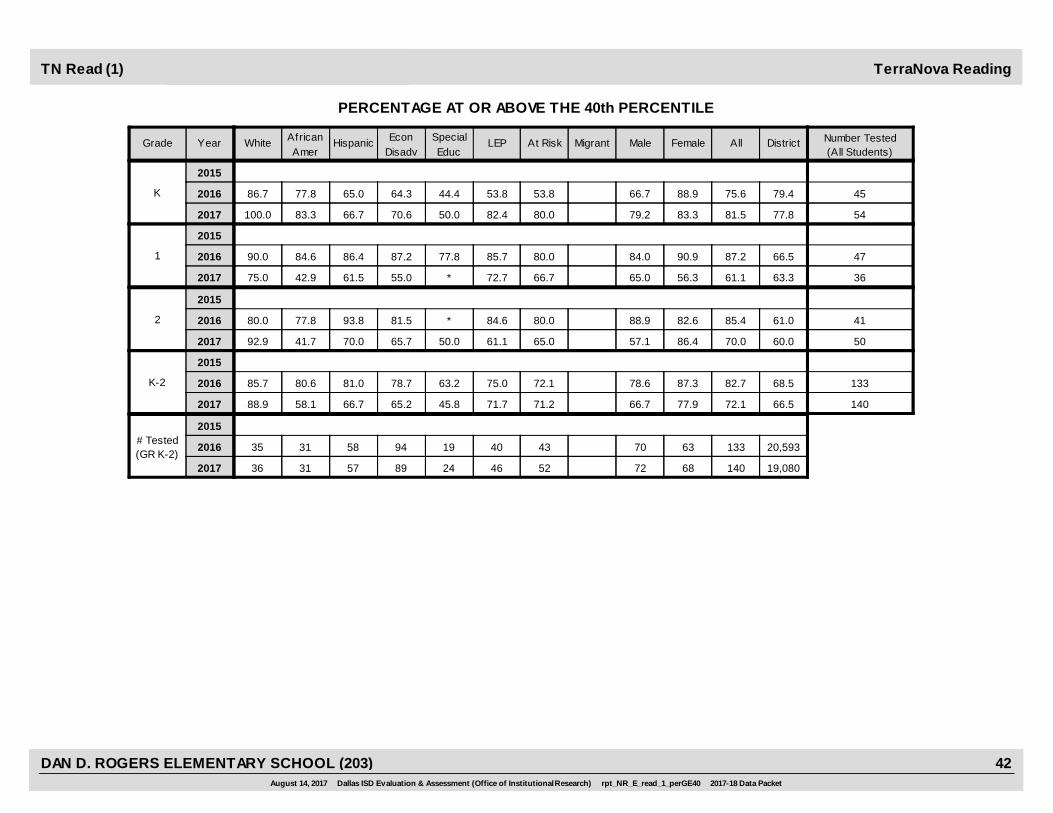
TerraNova ReadingTN Read (1)
PERCENTAGE AT OR ABOVE THE 40th PERCENTILE
79.2 83.3
66.7 88.9
77.82017 100.0 83.3 66.7 70.6 50.0 82.4 81.5 5480.0
K
2015
79.42016 86.7 77.8 65.0 64.3 44.4 53.8 75.6 4553.8
65.0 56.3
84.0 90.9
63.32017 75.0 42.9 61.5 55.0 * 72.7 61.1 3666.7
1
2015
66.52016 90.0 84.6 86.4 87.2 77.8 85.7 87.2 4780.0
57.1 86.4
88.9 82.6
60.02017 92.9 41.7 70.0 65.7 50.0 61.1 70.0 5065.0
2
2015
61.02016 80.0 77.8 93.8 81.5 * 84.6 85.4 4180.0
66.7 77.9
78.6 87.3
66.52017 88.9 58.1 66.7 65.2 45.8 71.7 72.1 14071.2
K-2
2015
68.52016 85.7 80.6 81.0 78.7 63.2 75.0 82.7 13372.1
72 68
70 63
19,0802017 36 5731 89 24 46 14052
2015# Tested(GR K-2)
20,5932016 35 5831 94 19 40 13343
August 14, 2017 Dallas ISD Evaluation & Assessment (Office of Institutional Research) rpt_NR_E_read_1_perGE40 2017-18 Data Packet
42DAN D. ROGERS ELEMENTARY SCHOOL (203)

FemaleMigrant MaleAt RiskWhite AfricanAmer
Hispanic EconDisadv
SpecialEduc
LEP All DistrictYearGrade Number Tested(All Students)
TerraNova ReadingTN Read (2)
NUMBER AT OR ABOVE THE 80th PERCENTILE
9 14
10 9
1,9952017 8 4 6 10 1 7 23 548
K
2015
2,3532016 9 4 5 9 2 4 19 454
7 4
8 7
1,5022017 4 2 4 4 * 2 11 362
1
2015
1,6052016 6 0 8 12 2 4 15 474
6 8
7 10
1,2982017 5 3 5 6 0 3 14 504
2
2015
1,3452016 4 3 6 8 * 3 17 414
22 26
25 26
4,7952017 17 9 15 20 2 12 48 14014
K-2
2015
5,3032016 19 7 19 29 5 11 51 13312
72 68
70 63
19,0802017 36 5731 89 24 46 14052
2015# Tested(GR K-2)
20,5932016 35 5831 94 19 40 13343
August 14, 2017 Dallas ISD Evaluation & Assessment (Office of Institutional Research) rpt_NR_E_read_2_nGE80 2017-18 Data Packet
DAN D. ROGERS ELEMENTARY SCHOOL (203) 43

FemaleMigrant MaleAt RiskWhite AfricanAmer
Hispanic EconDisadv
SpecialEduc
LEP All DistrictYearGrade Number Tested(All Students)
TerraNova LanguageTN Lang (1)
PERCENTAGE AT OR ABOVE THE 40th PERCENTILE
79.2 83.3
63.0 94.4
70.82017 100.0 66.7 75.0 70.6 50.0 76.5 81.5 5475.0
K
2015
72.62016 93.3 66.7 65.0 64.3 33.3 69.2 75.6 4569.2
65.0 50.0
68.0 68.2
48.92017 75.0 42.9 53.8 50.0 * 63.6 58.3 3658.3
1
2015
50.22016 80.0 46.2 72.7 64.1 44.4 78.6 68.1 4773.3
39.3 68.2
61.1 56.5
46.92017 57.1 25.0 65.0 45.7 33.3 44.4 52.0 5045.0
2
2015
46.72016 60.0 44.4 56.3 40.7 * 38.5 58.5 4140.0
59.7 70.6
64.3 71.4
54.82017 75.0 45.2 66.7 56.2 41.7 60.9 65.0 14059.6
K-2
2015
55.82016 80.0 51.6 65.5 57.4 36.8 62.5 67.7 13360.5
72 68
70 63
19,0762017 36 5731 89 24 46 14052
2015# Tested(GR K-2)
20,5702016 35 5831 94 19 40 13343
August 14, 2017 Dallas ISD Evaluation & Assessment (Office of Institutional Research) rpt_NR_E_lang_1_perGE40 2017-18 Data Packet
44DAN D. ROGERS ELEMENTARY SCHOOL (203)
FemaleMigrant MaleAt RiskWhite AfricanAmer
Hispanic EconDisadv
SpecialEduc
LEP All DistrictYearGrade Number Tested(All Students)
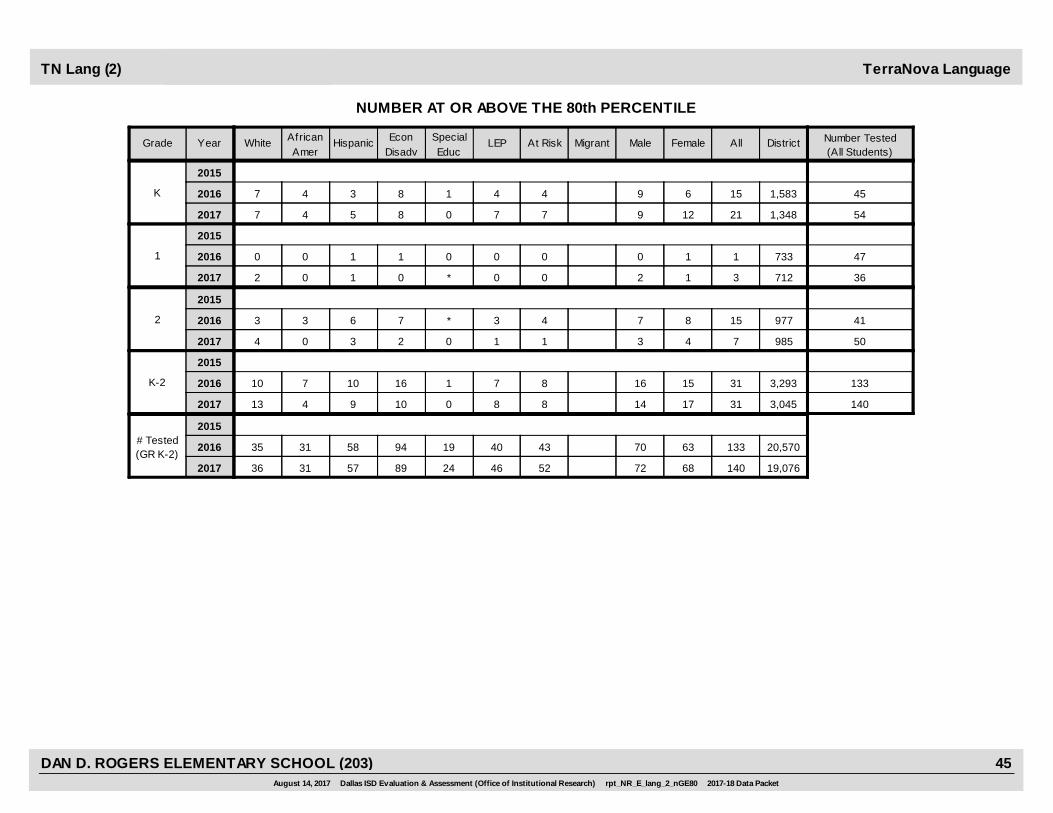
TerraNova LanguageTN Lang (2)
NUMBER AT OR ABOVE THE 80th PERCENTILE
9 12
9 6
1,3482017 7 4 5 8 0 7 21 547
K
2015
1,5832016 7 4 3 8 1 4 15 454
2 1
0 1
7122017 2 0 1 0 * 0 3 360
1
2015
7332016 0 0 1 1 0 0 1 470
3 4
7 8
9852017 4 0 3 2 0 1 7 501
2
2015
9772016 3 3 6 7 * 3 15 414
14 17
16 15
3,0452017 13 4 9 10 0 8 31 1408
K-2
2015
3,2932016 10 7 10 16 1 7 31 1338
72 68
70 63
19,0762017 36 5731 89 24 46 14052
2015# Tested(GR K-2)
20,5702016 35 5831 94 19 40 13343
August 14, 2017 Dallas ISD Evaluation & Assessment (Office of Institutional Research) rpt_NR_E_lang_2_nGE80 2017-18 Data Packet
DAN D. ROGERS ELEMENTARY SCHOOL (203) 45
FemaleMigrant MaleAt RiskWhite AfricanAmer
Hispanic EconDisadv
SpecialEduc
LEP All DistrictYearGrade Number Tested(All Students)
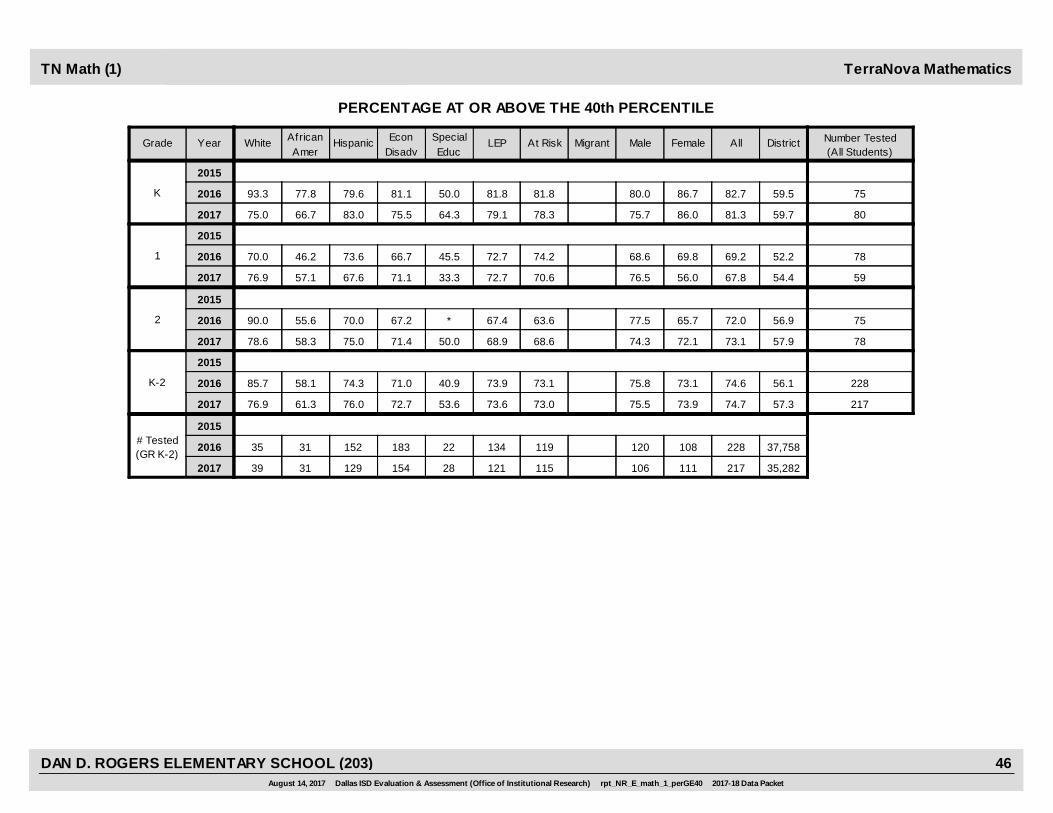
TerraNova MathematicsTN Math (1)
PERCENTAGE AT OR ABOVE THE 40th PERCENTILE
75.7 86.0
80.0 86.7
59.72017 75.0 66.7 83.0 75.5 64.3 79.1 81.3 8078.3
K
2015
59.52016 93.3 77.8 79.6 81.1 50.0 81.8 82.7 7581.8
76.5 56.0
68.6 69.8
54.42017 76.9 57.1 67.6 71.1 33.3 72.7 67.8 5970.6
1
2015
52.22016 70.0 46.2 73.6 66.7 45.5 72.7 69.2 7874.2
74.3 72.1
77.5 65.7
57.92017 78.6 58.3 75.0 71.4 50.0 68.9 73.1 7868.6
2
2015
56.92016 90.0 55.6 70.0 67.2 * 67.4 72.0 7563.6
75.5 73.9
75.8 73.1
57.32017 76.9 61.3 76.0 72.7 53.6 73.6 74.7 21773.0
K-2
2015
56.12016 85.7 58.1 74.3 71.0 40.9 73.9 74.6 22873.1
106 111
120 108
35,2822017 39 12931 154 28 121 217115
2015# Tested(GR K-2)
37,7582016 35 15231 183 22 134 228119
August 14, 2017 Dallas ISD Evaluation & Assessment (Office of Institutional Research) rpt_NR_E_math_1_perGE40 2017-18 Data Packet
46DAN D. ROGERS ELEMENTARY SCHOOL (203)
FemaleMigrant MaleAt RiskWhite AfricanAmer
Hispanic EconDisadv
SpecialEduc
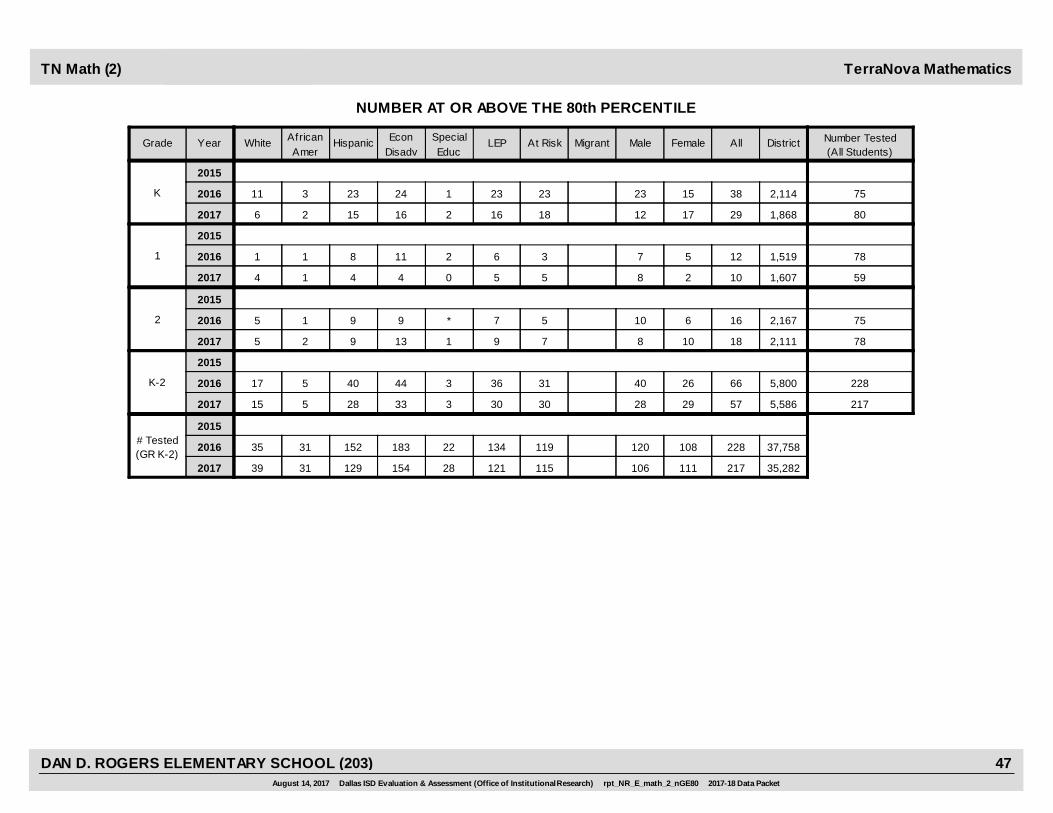
LEP All DistrictYearGrade Number Tested(All Students)
TerraNova MathematicsTN Math (2)
NUMBER AT OR ABOVE THE 80th PERCENTILE
12 17
23 15
1,8682017 6 2 15 16 2 16 29 8018
K
2015
2,1142016 11 3 23 24 1 23 38 7523
8 2
7 5
1,6072017 4 1 4 4 0 5 10 595
1
2015
1,5192016 1 1 8 11 2 6 12 783
8 10
10 6
2,1112017 5 2 9 13 1 9 18 787
2
2015
2,1672016 5 1 9 9 * 7 16 755
28 29
40 26
5,5862017 15 5 28 33 3 30 57 21730
K-2
2015
5,8002016 17 5 40 44 3 36 66 22831
106 111
120 108
35,2822017 39 12931 154 28 121 217115
2015# Tested(GR K-2)
37,7582016 35 15231 183 22 134 228119
August 14, 2017 Dallas ISD Evaluation & Assessment (Office of Institutional Research) rpt_NR_E_math_2_nGE80 2017-18 Data Packet
47DAN D. ROGERS ELEMENTARY SCHOOL (203)
FemaleMigrant MaleAt RiskWhite AfricanAmer
Hispanic EconDisadv
SpecialEduc
LEP All DistrictYearGrade Number Tested(All Students)
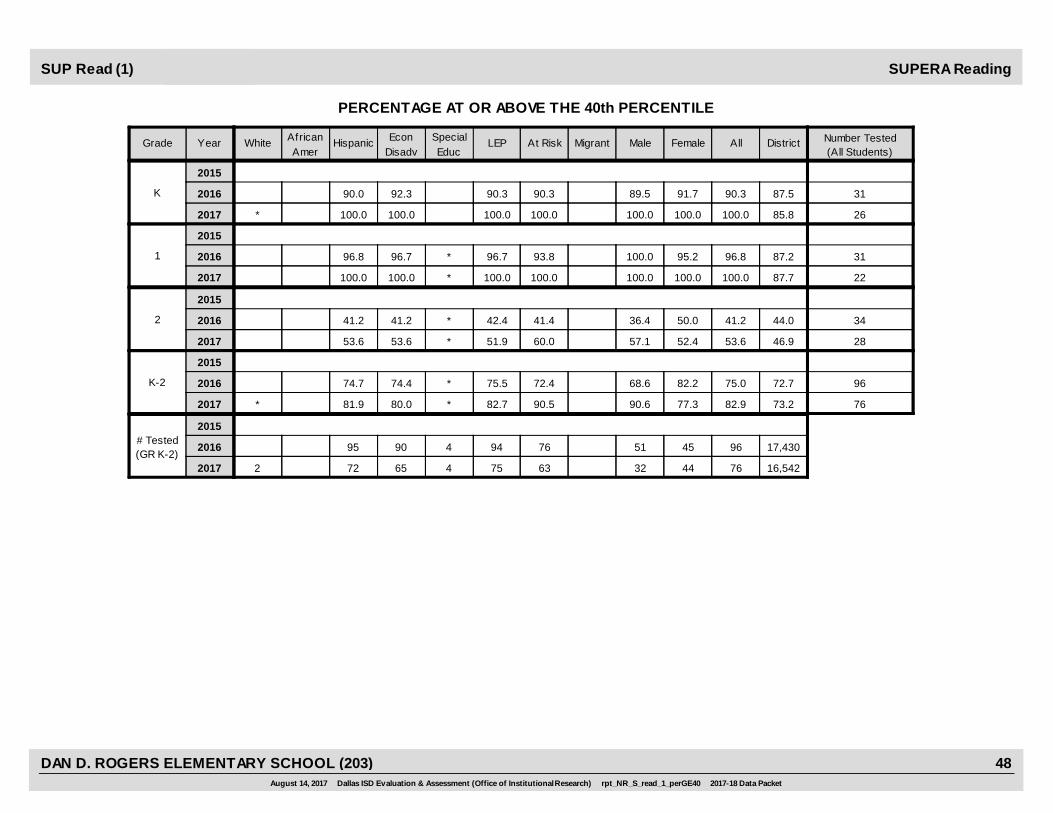
SUPERA ReadingSUP Read (1)
PERCENTAGE AT OR ABOVE THE 40th PERCENTILE
100.0 100.0
89.5 91.7
85.82017 * 100.0 100.0 100.0 100.0 26100.0
K
2015
87.52016 90.0 92.3 90.3 90.3 3190.3
100.0 100.0
100.0 95.2
87.72017 100.0 100.0 * 100.0 100.0 22100.0
1
2015
87.22016 96.8 96.7 * 96.7 96.8 3193.8
57.1 52.4
36.4 50.0
46.92017 53.6 53.6 * 51.9 53.6 2860.0
2
2015
44.02016 41.2 41.2 * 42.4 41.2 3441.4
90.6 77.3
68.6 82.2
73.22017 * 81.9 80.0 * 82.7 82.9 7690.5
K-2
2015
72.72016 74.7 74.4 * 75.5 75.0 9672.4
32 44
51 45
16,5422017 2 72 65 4 75 7663
2015# Tested(GR K-2)
17,4302016 95 90 4 94 9676
August 14, 2017 Dallas ISD Evaluation & Assessment (Office of Institutional Research) rpt_NR_S_read_1_perGE40 2017-18 Data Packet
48DAN D. ROGERS ELEMENTARY SCHOOL (203)
FemaleMigrant MaleAt RiskWhite AfricanAmer
Hispanic EconDisadv
SpecialEduc
LEP All DistrictYearGrade Number Tested(All Students)
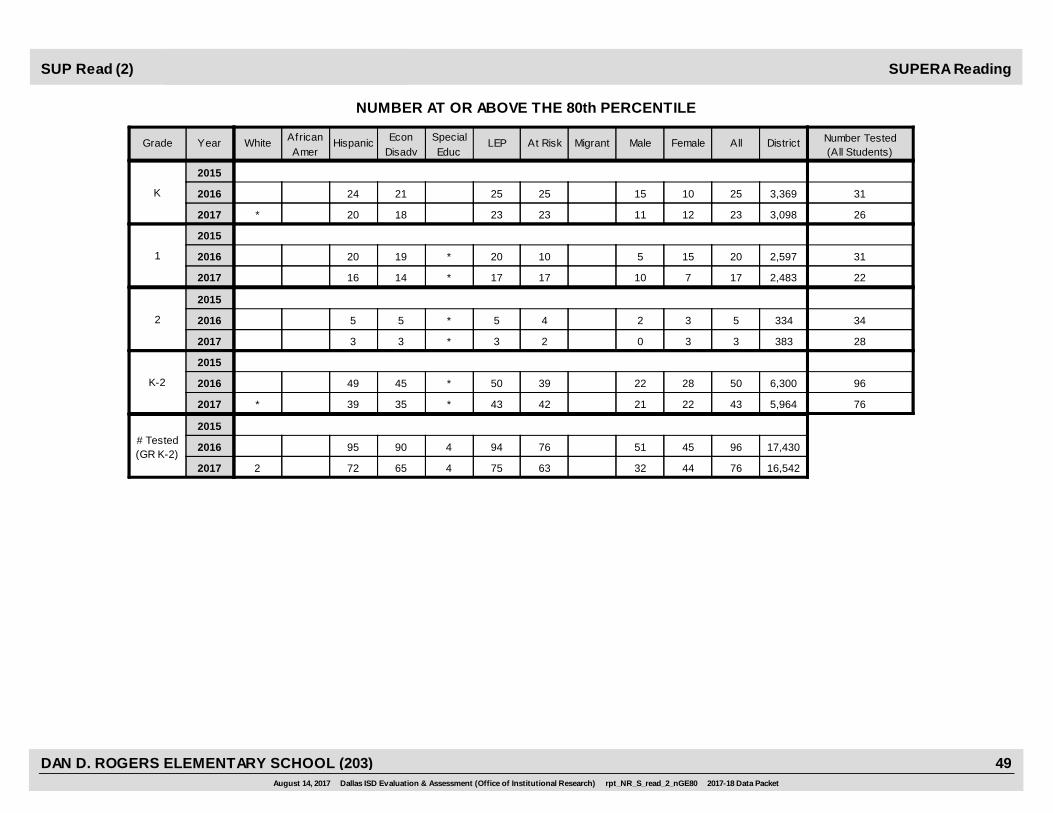
SUPERA ReadingSUP Read (2)
NUMBER AT OR ABOVE THE 80th PERCENTILE
11 12
15 10
3,0982017 * 20 18 23 23 2623
K
2015
3,3692016 24 21 25 25 3125
10 7
5 15
2,4832017 16 14 * 17 17 2217
1
2015
2,5972016 20 19 * 20 20 3110
0 3
2 3
3832017 3 3 * 3 3 282
2
2015
3342016 5 5 * 5 5 344
21 22
22 28
5,9642017 * 39 35 * 43 43 7642
K-2
2015
6,3002016 49 45 * 50 50 9639
32 44
51 45
16,5422017 2 72 65 4 75 7663
2015# Tested(GR K-2)
17,4302016 95 90 4 94 9676
August 14, 2017 Dallas ISD Evaluation & Assessment (Office of Institutional Research) rpt_NR_S_read_2_nGE80 2017-18 Data Packet
49DAN D. ROGERS ELEMENTARY SCHOOL (203)
FemaleMigrant MaleAt RiskWhite AfricanAmer
Hispanic EconDisadv
SpecialEduc
LEP All DistrictYearGrade Number Tested(All Students)
SUPERA LanguageSUP Lang (1)
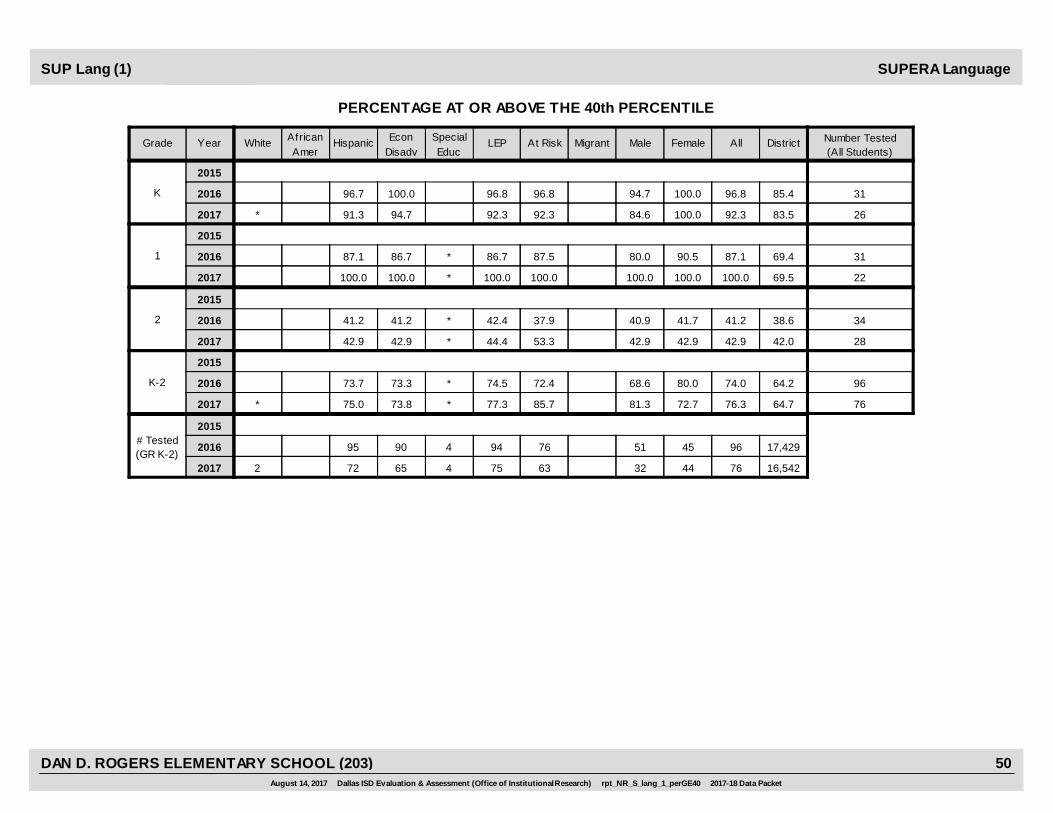
PERCENTAGE AT OR ABOVE THE 40th PERCENTILE
84.6 100.0
94.7 100.0
83.52017 * 91.3 94.7 92.3 92.3 2692.3
K
2015
85.42016 96.7 100.0 96.8 96.8 3196.8
100.0 100.0
80.0 90.5
69.52017 100.0 100.0 * 100.0 100.0 22100.0
1
2015
69.42016 87.1 86.7 * 86.7 87.1 3187.5
42.9 42.9
40.9 41.7
42.02017 42.9 42.9 * 44.4 42.9 2853.3
2
2015
38.62016 41.2 41.2 * 42.4 41.2 3437.9
81.3 72.7
68.6 80.0
64.72017 * 75.0 73.8 * 77.3 76.3 7685.7
K-2
2015
64.22016 73.7 73.3 * 74.5 74.0 9672.4
32 44
51 45
16,5422017 2 72 65 4 75 7663
2015# Tested(GR K-2)
17,4292016 95 90 4 94 9676
August 14, 2017 Dallas ISD Evaluation & Assessment (Office of Institutional Research) rpt_NR_S_lang_1_perGE40 2017-18 Data Packet
50DAN D. ROGERS ELEMENTARY SCHOOL (203)

FemaleMigrant MaleAt RiskWhite AfricanAmer
Hispanic EconDisadv
SpecialEduc
LEP All DistrictYearGrade Number Tested(All Students)
SUPERA ReadingSUP Lang (2)
NUMBER AT OR ABOVE THE 80th PERCENTILE
7 12
16 10
2,0632017 * 17 15 19 19 2619
K
2015
2,4302016 25 22 26 26 3126
5 3
3 5
9472017 8 8 * 8 8 228
1
2015
1,0012016 8 7 * 8 8 314
1 2
1 0
6552017 3 3 * 3 3 282
2
2015
6422016 1 1 * 1 1 340
13 17
20 15
3,6652017 * 28 26 * 30 30 7629
K-2
2015
4,0732016 34 30 * 35 35 9630
32 44
51 45
16,5422017 2 72 65 4 75 7663
2015# Tested(GR K-2)
17,4292016 95 90 4 94 9676
August 14, 2017 Dallas ISD Evaluation & Assessment (Office of Institutional Research) rpt_NR_S_lang_2_nGE80 2017-18 Data Packet
51DAN D. ROGERS ELEMENTARY SCHOOL (203)
Composite
2
Grade2016-17 Listening
N (%) Progressed
Number RatedBoth Years
2016 Level
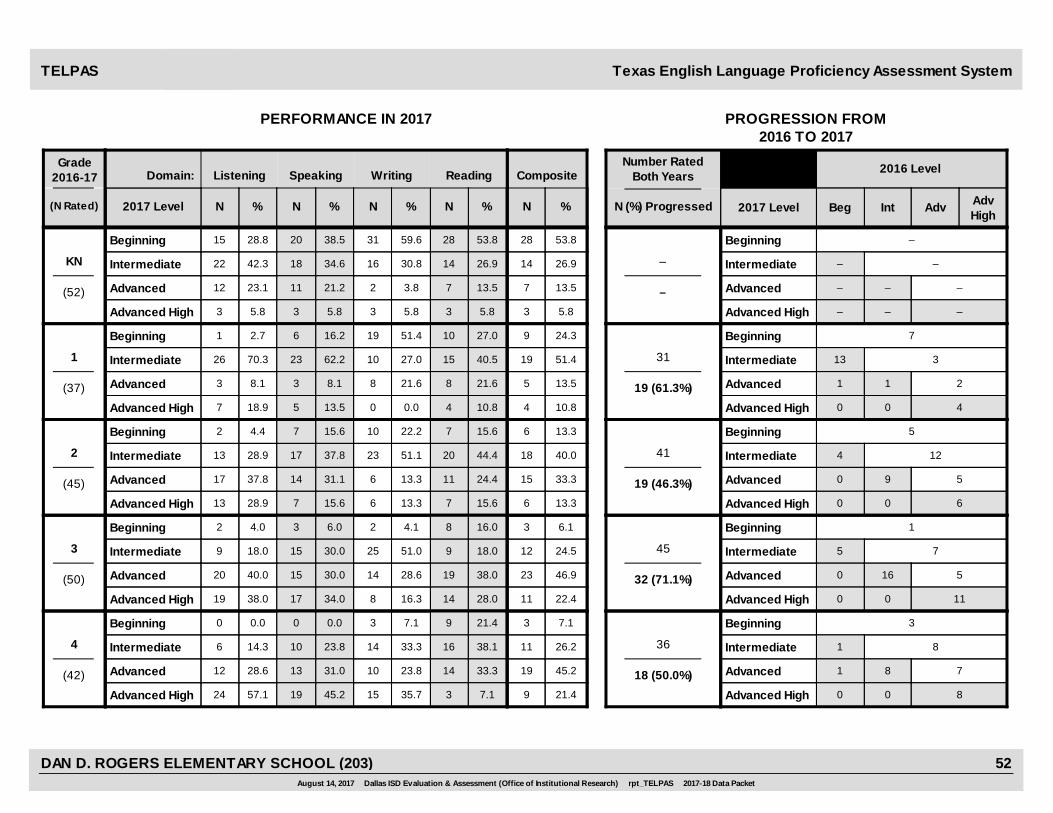
PERFORMANCE IN 2017 PROGRESSION FROM2016 TO 2017
Speaking Writing
% % %N N N(N Rated) 2017 Level N % 2017 Level
Domain:
IntBeg Adv AdvHigh
Texas English Language Proficiency Assessment Syste mTELPAS
Reading
%N
26.9
38.5
KN
15 28.8 20 31 59.6 28
(52)
Beginning
Intermediate
Advanced High
53.8 53.828
34.622 42.3 18 16 30.8 14 26.9 14
21.212 23.1 11 2 3.8 7 13.5 13.57
5.83 5.8 3 3 5.8 3 5.8 5.83
–
–
Beginning
Intermediate
Advanced
Advanced High
–
––
–
–
–
–
–
–
Advanced
51.4
16.2
1
1 2.7 6 19 51.4 10
(37)
Beginning
Intermediate
Advanced High
27.0 24.39
62.226 70.3 23 10 27.0 15 40.5 19
8.13 8.1 3 8 21.6 8 21.6 13.55
13.57 18.9 5 0 0.0 4 10.8 10.84
31
19 (61.3%)
Beginning
Intermediate
Advanced
Advanced High
7
313
1
0
1
0
2
4
Advanced
40.0
15.6
2
2 4.4 7 10 22.2 7
(45)
Beginning
Intermediate
Advanced High
15.6 13.36
37.813 28.9 17 23 51.1 20 44.4 18
31.117 37.8 14 6 13.3 11 24.4 33.315
15.613 28.9 7 6 13.3 7 15.6 13.36
41
19 (46.3%)
Beginning
Intermediate
Advanced
Advanced High
5
124
0
0
9
0
5
6
Advanced
24.5
6.0
3
2 4.0 3 2 4.1 8
(50)
Beginning
Intermediate
Advanced High
16.0 6.13
30.09 18.0 15 25 51.0 9 18.0 12
30.020 40.0 15 14 28.6 19 38.0 46.923
34.019 38.0 17 8 16.3 14 28.0 22.411
45
32 (71.1%)
Beginning
Intermediate
Advanced
Advanced High
1
75
0
0
16
0
5
11
Advanced
26.2
0.0
4
0 0.0 0 3 7.1 9
(42)
Beginning
Intermediate
Advanced High
21.4 7.13
23.86 14.3 10 14 33.3 16 38.1 11
31.012 28.6 13 10 23.8 14 33.3 45.219
45.224 57.1 19 15 35.7 3 7.1 21.49
36
18 (50.0%)
Beginning
Intermediate
Advanced
Advanced High
3
81
1
0
8
0
7
8
Advanced
August 14, 2017 Dallas ISD Evaluation & Assessm ent (Office of Institutional Research) rpt_TELP AS 2017-18 Data Packet
52DAN D. ROGERS ELEMENTARY SCHOOL (203)
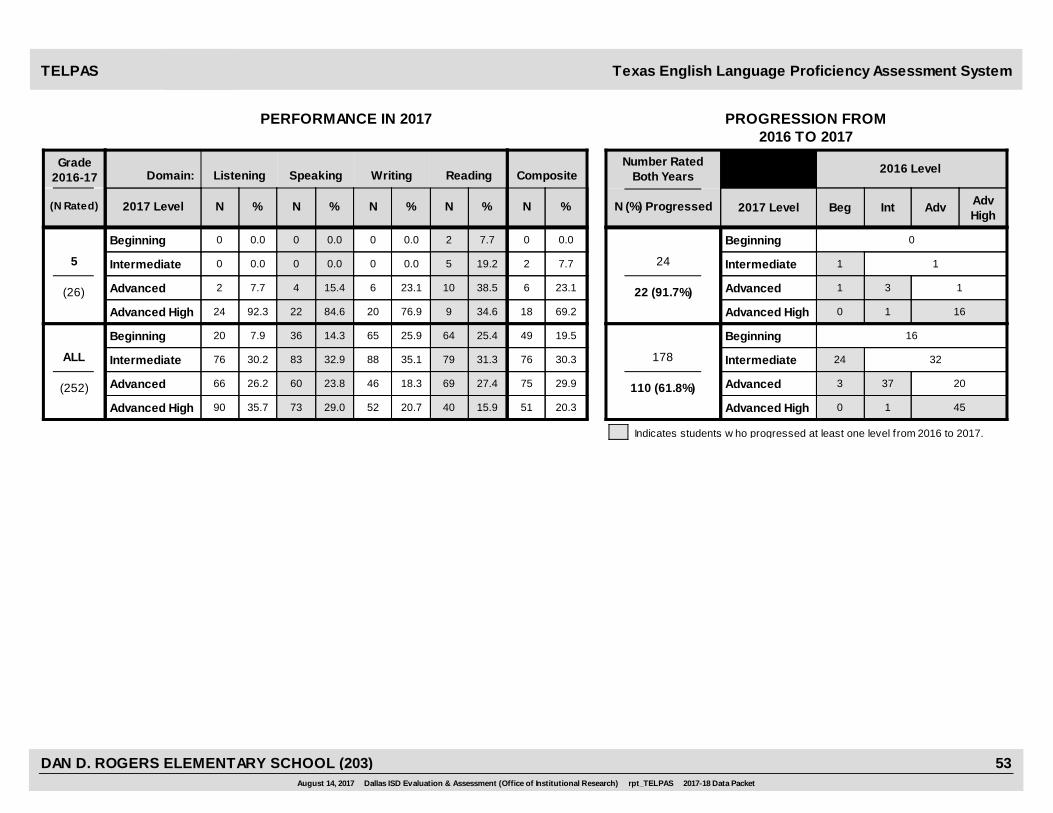
Composite
2
Grade2016-17 Listening
N (%) Progressed
Number RatedBoth Years
2016 Level
PERFORMANCE IN 2017 PROGRESSION FROM2016 TO 2017
Speaking Writing
% % %N N N(N Rated) 2017 Level N % 2017 Level
Domain:
IntBeg Adv AdvHigh
Texas English Language Proficiency Assessment Syste mTELPAS
Reading
%N
7.7
0.0
5
0 0.0 0 0 0.0 2
(26)
Beginning
Intermediate
Advanced High
7.7 0.00
0.00 0.0 0 0 0.0 5 19.2 2
15.42 7.7 4 6 23.1 10 38.5 23.16
84.624 92.3 22 20 76.9 9 34.6 69.218
24
22 (91.7%)
Beginning
Intermediate
Advanced
Advanced High
0
11
1
0
3
1
1
16
Advanced
30.3
14.3
ALL
20 7.9 36 65 25.9 64
(252)
Beginning
Intermediate
Advanced High
25.4 19.549
32.976 30.2 83 88 35.1 79 31.3 76
23.866 26.2 60 46 18.3 69 27.4 29.975
29.090 35.7 73 52 20.7 40 15.9 20.351
178
110 (61.8%)
Beginning
Intermediate
Advanced
Advanced High
16
3224
3
0
37
1
20
45
Advanced
Indicates students w ho progressed at least one level f rom 2016 to 2017.
August 14, 2017 Dallas ISD Evaluation & Assessm ent (Office of Institutional Research) rpt_TELP AS 2017-18 Data Packet
53DAN D. ROGERS ELEMENTARY SCHOOL (203)
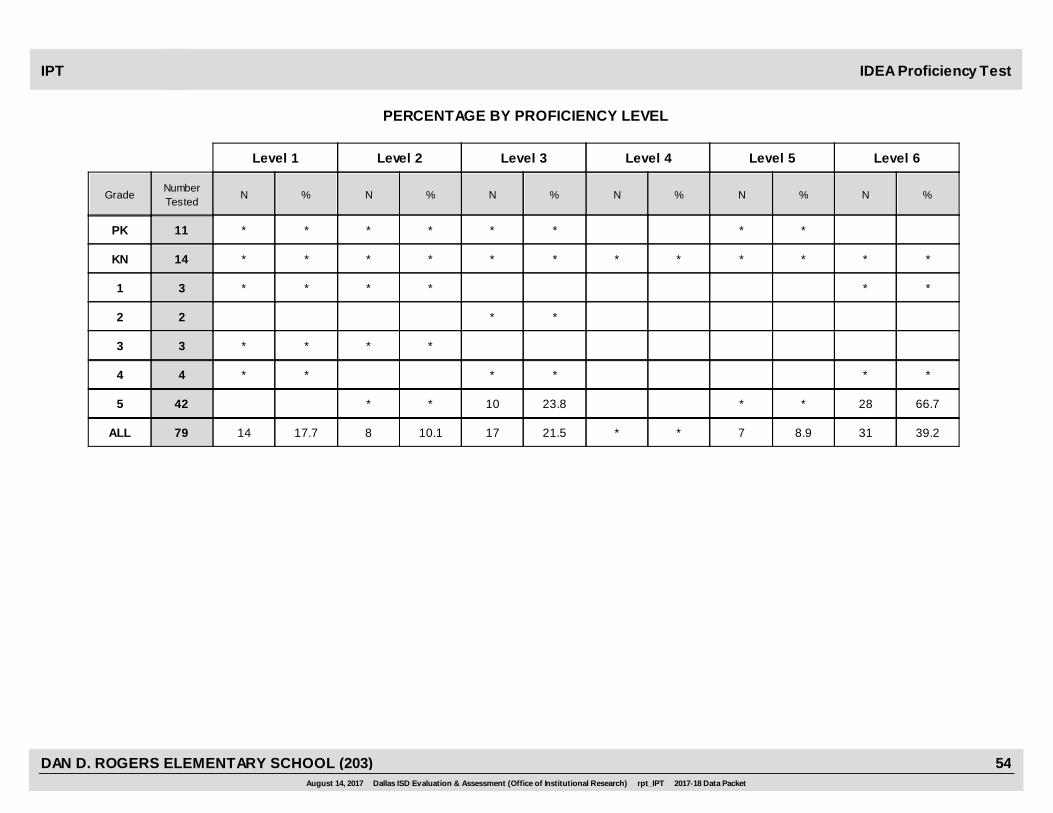
IDEA Proficiency Test
PERCENTAGE BY PROFICIENCY LEVEL
IPT
%NNumberTested
%NNNGrade N N %%%%
Level 6Level 5Level 4Level 3Level 2Level 1
********PK 11
*********** *KN 14
***** *1 3
**2 2
****3 3
***** *4 4
28** 23.8 10** 66.75 42
318.97** 21.5 17 10.18 17.7 14 39.2ALL 79
August 14, 2017 Dallas ISD Evaluation & Assessment (Office of Institutional Research) rpt_IPT 2017-18 Data Packet
54DAN D. ROGERS ELEMENTARY SCHOOL (203)
Course% Items Correct
CourseMark
ACP ACP
Averages % Passing District % Passing
Course Mark(no ACP)
ScaleScore
NumberTested
Course
Dallas ISD Assessments of Course PerformanceACP
Course% Items Correct
CourseMark
ACP ACP
Averages % Passing District % Passing
Course Mark(no ACP)
ScaleScore
NumberTested
Course
SEMESTER 1 TESTS SEMESTER 2 TESTS
Elementary School Exams
KINDERGARTEN MATHEMATICS KINDERGARTEN MATHEMATICS
90.9 91.9 95.0 85.6100
KINDERGARTEN MATHEMATICS SPANISH KINDERGARTEN MATHEMATICS SPANISH
* * * 83.32
KINDERGARTEN READING KINDERGARTEN READING
89.6 93.1 95.9 92.874
KINDERGARTEN READING SPANISH KINDERGARTEN READING SPANISH
91.7 93.6 92.9 94.528
GRADE 1 MATHEMATICS GRADE 1 MATHEMATICS
86.9 88.4 89.7 82.868
GRADE 1 MATHEMATICS SPANISH GRADE 1 MATHEMATICS SPANISH
* * * 89.21
GRADE 1 READING GRADE 1 READING
82.4 86.8 92.7 90.441
GRADE 1 READING SPANISH GRADE 1 READING SPANISH
93.6 93.6 100.0 91.428
GRADE 2 MATHEMATICS GRADE 2 MATHEMATICS
78.8 85.9 86.7 89.2 100.0 80.7 91.674
GRADE 2 MATHEMATICS SPANISH GRADE 2 MATHEMATICS SPANISH
* * * * * 62.9 *2
August 14, 2017 Dallas ISD Evaluation & Assessment (Office of Institutional Research) rpt_ACP 2017-18 Data Packet
55DAN D. ROGERS ELEMENTARY SCHOOL (203)
Course% Items Correct
CourseMark
ACP ACP
Averages % Passing District % Passing
Course Mark(no ACP)
ScaleScore
NumberTested
Course
Dallas ISD Assessments of Course PerformanceACP
Course% Items Correct
CourseMark
ACP ACP
Averages % Passing District % Passing
Course Mark(no ACP)
ScaleScore
NumberTested
Course
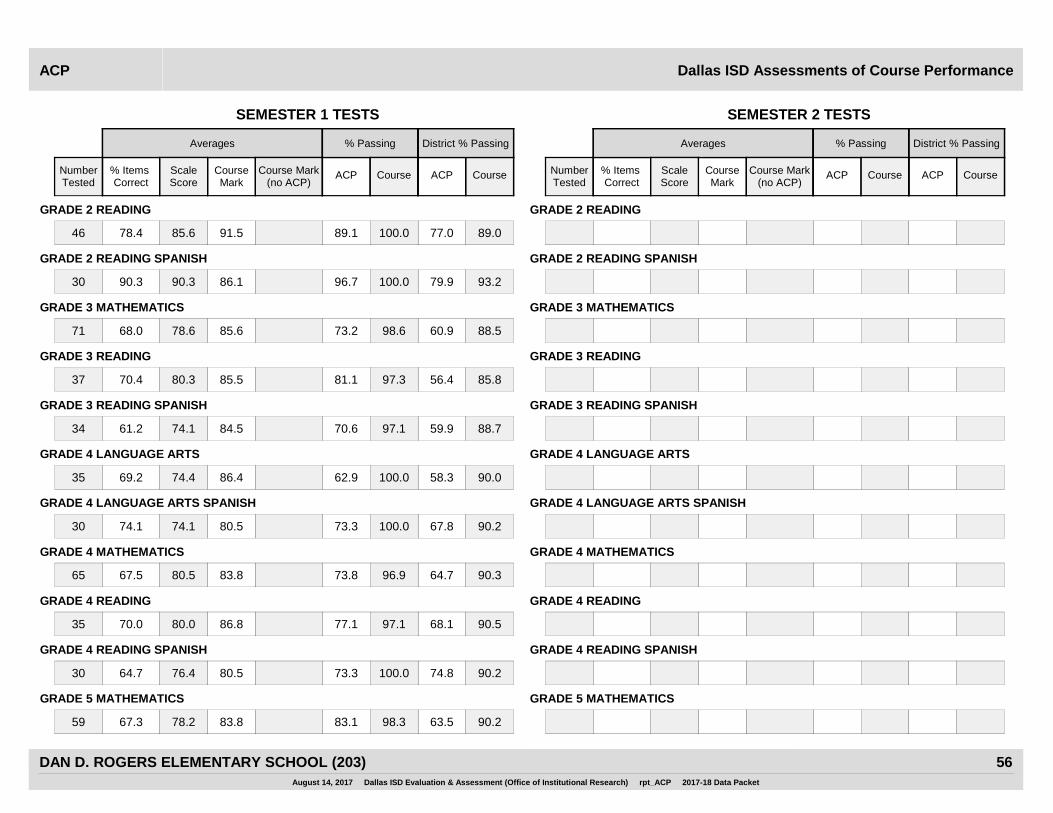
SEMESTER 1 TESTS SEMESTER 2 TESTS
GRADE 2 READING GRADE 2 READING
78.4 85.6 91.5 89.1 100.0 77.0 89.046
GRADE 2 READING SPANISH GRADE 2 READING SPANISH
90.3 90.3 86.1 96.7 100.0 79.9 93.230
GRADE 3 MATHEMATICS GRADE 3 MATHEMATICS
68.0 78.6 85.6 73.2 98.6 60.9 88.571
GRADE 3 READING GRADE 3 READING
70.4 80.3 85.5 81.1 97.3 56.4 85.837
GRADE 3 READING SPANISH GRADE 3 READING SPANISH
61.2 74.1 84.5 70.6 97.1 59.9 88.734
GRADE 4 LANGUAGE ARTS GRADE 4 LANGUAGE ARTS
69.2 74.4 86.4 62.9 100.0 58.3 90.035
GRADE 4 LANGUAGE ARTS SPANISH GRADE 4 LANGUAGE ARTS SPANISH
74.1 74.1 80.5 73.3 100.0 67.8 90.230
GRADE 4 MATHEMATICS GRADE 4 MATHEMATICS
67.5 80.5 83.8 73.8 96.9 64.7 90.365
GRADE 4 READING GRADE 4 READING
70.0 80.0 86.8 77.1 97.1 68.1 90.535
GRADE 4 READING SPANISH GRADE 4 READING SPANISH
64.7 76.4 80.5 73.3 100.0 74.8 90.230
GRADE 5 MATHEMATICS GRADE 5 MATHEMATICS
67.3 78.2 83.8 83.1 98.3 63.5 90.259
August 14, 2017 Dallas ISD Evaluation & Assessment (Office of Institutional Research) rpt_ACP 2017-18 Data Packet
56DAN D. ROGERS ELEMENTARY SCHOOL (203)
Course% Items Correct
CourseMark
ACP ACP
Averages % Passing District % Passing
Course Mark(no ACP)
ScaleScore
NumberTested
Course
Dallas ISD Assessments of Course PerformanceACP
Course% Items Correct
CourseMark
ACP ACP
Averages % Passing District % Passing
Course Mark(no ACP)
ScaleScore
NumberTested
Course
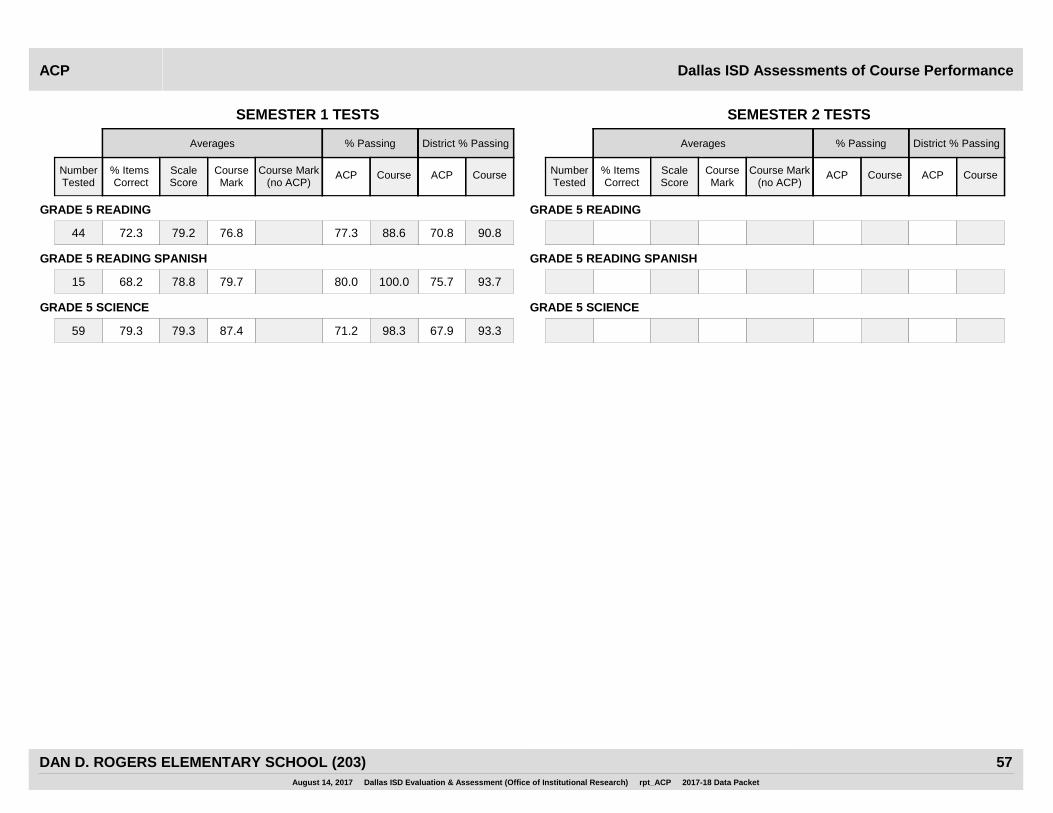
SEMESTER 1 TESTS SEMESTER 2 TESTS
GRADE 5 READING GRADE 5 READING
72.3 79.2 76.8 77.3 88.6 70.8 90.844
GRADE 5 READING SPANISH GRADE 5 READING SPANISH
68.2 78.8 79.7 80.0 100.0 75.7 93.715
GRADE 5 SCIENCE GRADE 5 SCIENCE
79.3 79.3 87.4 71.2 98.3 67.9 93.359
August 14, 2017 Dallas ISD Evaluation & Assessment (Office of Institutional Research) rpt_ACP 2017-18 Data Packet
57DAN D. ROGERS ELEMENTARY SCHOOL (203)