Embed Size (px)
Citation preview
p50c 10-Nov-04 1
A REVIEW OF DATA FUSION MODELS AND
ARCHITECTURES: TOWARDS ENGINEERING
GUIDELINES
Jaime Esteban1, Andrew Starr
1, Robert Willetts
1, Paul Hannah
1, Peter Bryanston-Cross
2
1The University of Manchester
School of Mechanical, Aerospace and Civil Engineering
Sackville Street,
Manchester, M60 1QD, UK
http://www.manchester.ac.uk
2University of Warwick
School of Engineering,
University of Warwick,
Coventry CV4 7AL, UK
ABSTRACT
This paper reviews the potential benefits that can be obtained by the implementation of data
fusion in a multi-sensor environment. A thorough review of the commonly used data fusion
frameworks is presented together with important factors that need to be considered during the
development of an effective data fusion problem-solving strategy. A system-based approach
is defined for the application of data fusion systems within engineering. Structured guidelines
for users are proposed.
KEYWORDS
Data fusion, Frameworks, Intelligent systems, Engineering guidelines
p50c 10-Nov-04 2
1 INTRODUCTION
To ensure that systems are operating within defined conditions, measurements are taken
which, when analysed, enable decisions to be made based on condition. These measurements
can produce data that are either very similar, often from the same sensor, or completely
different from different techniques. Experienced engineers and analysts have traditionally
undertaken the analysis of this data. However, with the increased computer power and
development of new and novel detection systems, the data produced needs to be handled in a
robust and logical manner. As such computer systems have been developed that are capable
of extracting meaningful information from the recorded data. The integration of data,
recorded from a multiple sensor system, together with knowledge, is known as data fusion.
Data fusion first appeared in the literature in the 1960s, as mathematical models for data
manipulation. It was implemented in the US in the 1970s in the fields of robotics and
defence. In 1986 the US Department of Defence established the Data Fusion Sub-Panel of the
Joint Directors of Laboratories (JDL) to address some of the main issues in data fusion and
chart the new field in an effort to unify the terminology and procedures. The present
applications of data fusion span a wide range of areas: maintenance engineering[1]
, robotics[2]
,
pattern recognition and radar tracking[3]
, mine detection[4]
and other military applications[5]
,
remote sensing[6]
, traffic control
[7],[8], aerospace systems
[9], law enforcement
[10], medicine,
finance, metrology [11]
, and geo-science.
Before undertaking a data fusion project a strategy needs to be established that can facilitate
the solution of the problem in a robust and organised manner. Since the applications of data
fusion are disparate, it is impossible to build a one-fits-all framework. Several generic
platforms are described in the literature, which accommodate the application at hand. The
p50c 10-Nov-04 3
purpose of this paper is to characterise the common ground among the various data fusion
frameworks available, and underline the importance of a robust strategy to analyse the data.
Some success has been achieved in the use of neural networks for generic multi-parameter
fusion, e.g. Taylor’s work on Kohonen networks [12]
, since the input vector, once normalised,
takes in data from many sources, and the methodology fits many problems. The scope of this
paper, however, is to examiner wider issues in the architecture, including frameworks,
procedures and guidelines.
2 MULTIPLE SENSOR ENVIRONMENTS
Decisions regarding the condition of a system are seldom based upon the output of a single
measurement parameter. More often, these decisions are made on the analysis of multiple
parameters either from the same type of sensor or from a completely separate and different
one. Thomopoulos[13]
gives a discussion regarding the advantages of multiple-sensor systems
over single-sensor systems. This discussion states that there are numerous advantages in
using multiple sensor systems including:
Higher signal-to-noise ratio;
Increased robustness and reliability in the evident of sensor failure;
Information regarding independent features in the system can be obtained;
Extended parameter coverage, rendering a more complete picture of the system;
Increased dimensionality of the measurement;
Improved resolution;
Reduced uncertainty;
Increased confidence;
p50c 10-Nov-04 4
Increased hypothesis discrimination with the aid of more complete information
arriving from multiple sensors;
Reduction in measurement time, and possibly costs - there is a trade off to consider in
this issue. Thus, an optimal number of sensors to extract the required information
from a system should be ideally pursued.
The number of sensors used is an important factor in the cost equation in terms of time,
money and effort and should be limited by the information gained. Therefore, there is a need
to establish a sensor performance criterion in order to assess the reliability of the
measurement system selected and, at the same time be able to assign weights of evidence in
the data analysis process. Richardson and Mash[14]
describe an analytical proof, which states
that in most situations decisions are more reliability made when there are more rather than
less sensors. However, the definition and calculation of the optimal number of sensors
required for a given system is complex and one that is beyond the scope of this paper.
3 ESTABLISHING A MULTIPLE SENSOR SYSTEM
The actual combination of sensors is dependant upon the requirements of the system.
However, a number of things need to be considered when defining the type of fusion
algorithm used and level at which fusion will occur. These include:
How are the sensors distributed?
What are the format, type and accuracy of the collected data?
What is the nature of the sensors used?
What is the resolution of the sensors used?
What is the computational capability at the sensors?
p50c 10-Nov-04 5
If identical sensors are used within the multi-sensor system then the data analysis process can
be done with minimal effort. This can enhance the reliability of the results provided by the
redundancy of the information. On the other hand, if different types of sensors are used then
the information collected needs to be formatted into a common form and aligned in the time
domain.
Data can be combined either as it arrives into the system or at a defined level within the
fusion process. The reliability of the data used within the fusion system will depend on the
sensors available and the methodology employed for the fusion of the data. The selection of
sensors as well as the number of sensors needed to increase the accuracy of the information
transferred depends on the problem at hand. Different types of sensors can be used depending
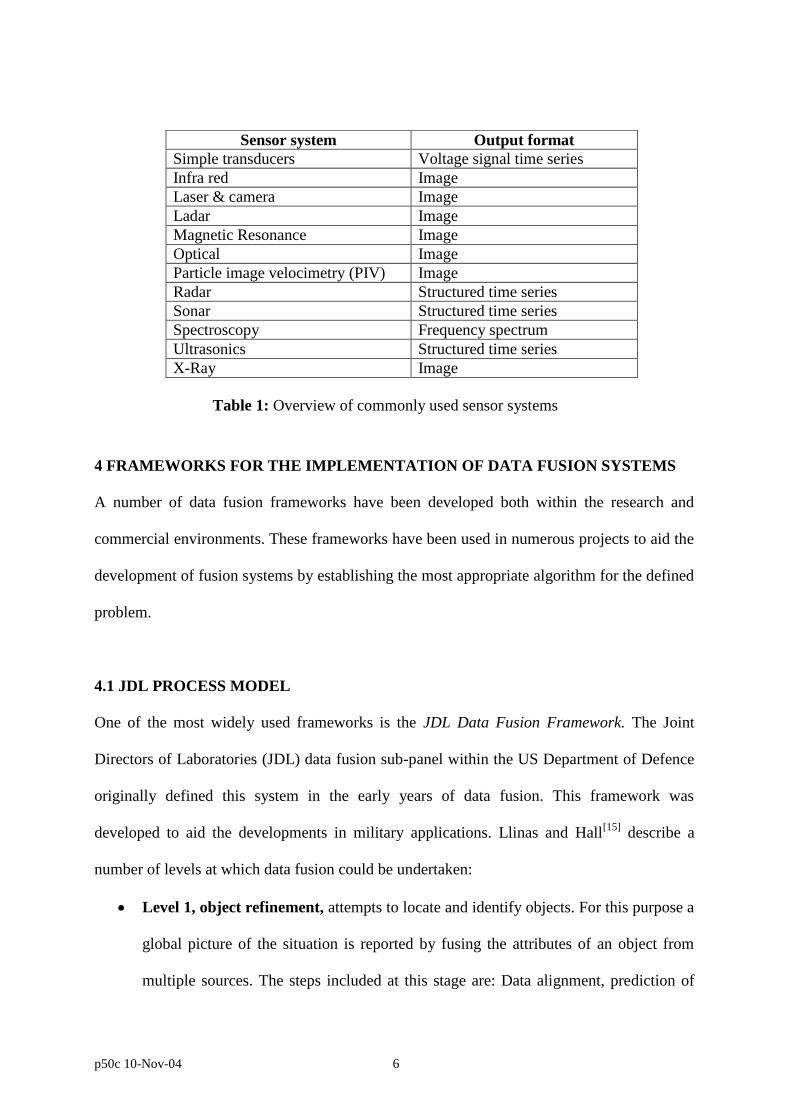
on the application and the output format sought. Table 1 gives a brief overview of sensors
typically used in data fusion. Sensors are usually classified according to their physical nature.
They are often based on the electromagnetic spectrum, sound waves, touch, odour, or the
absolute position of the system.
p50c 10-Nov-04 6
4 FRAMEWORKS FOR THE IMPLEMENTATION OF DATA FUSION SYSTEMS
A number of data fusion frameworks have been developed both within the research and
commercial environments. These frameworks have been used in numerous projects to aid the
development of fusion systems by establishing the most appropriate algorithm for the defined
problem.
4.1 JDL PROCESS MODEL
One of the most widely used frameworks is the JDL Data Fusion Framework. The Joint
Directors of Laboratories (JDL) data fusion sub-panel within the US Department of Defence
originally defined this system in the early years of data fusion. This framework was
developed to aid the developments in military applications. Llinas and Hall[15]
describe a
number of levels at which data fusion could be undertaken:
Level 1, object refinement, attempts to locate and identify objects. For this purpose a
global picture of the situation is reported by fusing the attributes of an object from
multiple sources. The steps included at this stage are: Data alignment, prediction of
Sensor system Output format
Simple transducers Voltage signal time series
Infra red Image
Laser & camera Image
Ladar Image
Magnetic Resonance Image
Optical Image
Particle image velocimetry (PIV) Image
Radar Structured time series
Sonar Structured time series
Spectroscopy Frequency spectrum
Ultrasonics Structured time series
X-Ray Image
Table 1: Overview of commonly used sensor systems
p50c 10-Nov-04 7
entity’s attributes (i.e. position, speed, type of damage, alert status, etc.), association
of data to entities, and refinement of entity’s identity.
Level 2, situation assessment, attempts to construct a picture from incomplete
information provided by level 1, that is, to relate the reconstructed entity with an
observed event (e.g. aircraft flying over hostile territory).
Level 3, threat assessment, interprets the results from level 2 in terms of the possible
opportunities for operation. It analyses the advantages and disadvantages of taking
one course of action over another.
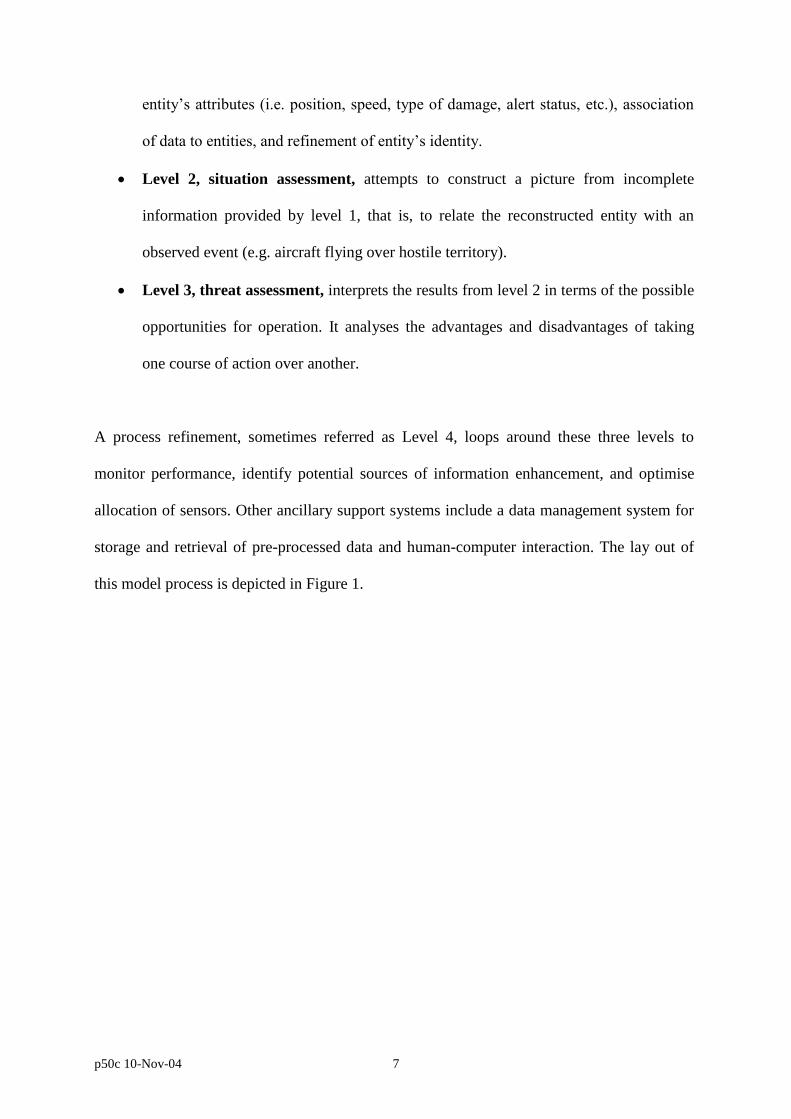
A process refinement, sometimes referred as Level 4, loops around these three levels to
monitor performance, identify potential sources of information enhancement, and optimise
allocation of sensors. Other ancillary support systems include a data management system for
storage and retrieval of pre-processed data and human-computer interaction. The lay out of
this model process is depicted in Figure 1.
p50c 10-Nov-04 8
The hierarchical distribution of the JDL model allows for the different levels to be broken
down into sub-levels. In this manner, level 1 could be further divided into four processes:
Data alignment, data association, object estimation, and object identity.
At the data alignment stage, the data is processed to attain a common spatial and
time frame;
The data association could be further divided as association performed among data
units of the same variable and between data units of different variables. At this stage
the degree of proximity among the variables is measured;
Object estimation, on the other hand, could be sub-divided in terms of the processing
approach taken (sequential or batch), parameter identification and estimate equations
available, best-fit function criteria, and the optimisation of best-fit function approach
sought. At this stage the data fusion centre estimates the object’s position, velocity,
or attributes;
The object identity stage could be subdivided into feature extraction, identity
declaration, and combination of identity declarations. At this stage a prediction of
the object’s identity or classification is declared.
Figure 1: The JDL data fusion framework
SOURCES
Sensors
Databases
Knowledge
Object refinement
Data alignment
Data association
Object estimation
Object identity
Situation assessment
Objects Events
Threat assessment
Trade-offs in
decision making
Data Fusion Centre
PROCESS REFINEMENT
USER
INTERFACE
p50c 10-Nov-04 9
At each of these lowest sub-levels, the mapping of different types of techniques could be
easily allocated, and selected according to the case at hand.
Fusion can be performed on raw data in the fusion centre (centralised process) or on pre-
processed locally fused data (decentralised process). A hybrid data fusion system, consisting
of the integration of both raw and pre-processed data, could also be considered. The
combination of the first three JDL levels into a blackboard data structure has been proposed
by Paradis[16]
. This framework is further integrated with a process refinement via fusion
agents, which act as fusion centres.
4.2 THOMOPOULOS ARCHITECTURE
Thomopoulos[13]
posed an architecture for data fusion consisting of three modules, each
integrating data at different levels or modules to integrate the data, namely:
Signal level fusion, where data correlation takes place through learning due to the
lack of a mathematical model describing the phenomenon being measured.
Evidence level fusion, where data is combined at different levels of inference based
on a statistical model and the assessment required by the user (e.g. decision making
or hypothesis testing).
Dynamics level fusion, where the fusion of data is done with the aid of an existing
mathematical model.
Depending upon the application, these levels of fusion can be implemented in a sequential
manner or interchangeably. If continuous health monitoring of a machine is the objective, the
combination of data could be done at the signal level, whilst higher order fusion (e.g.
evidence fusion) would need to be applied if a wide range of decisions ought to be made from
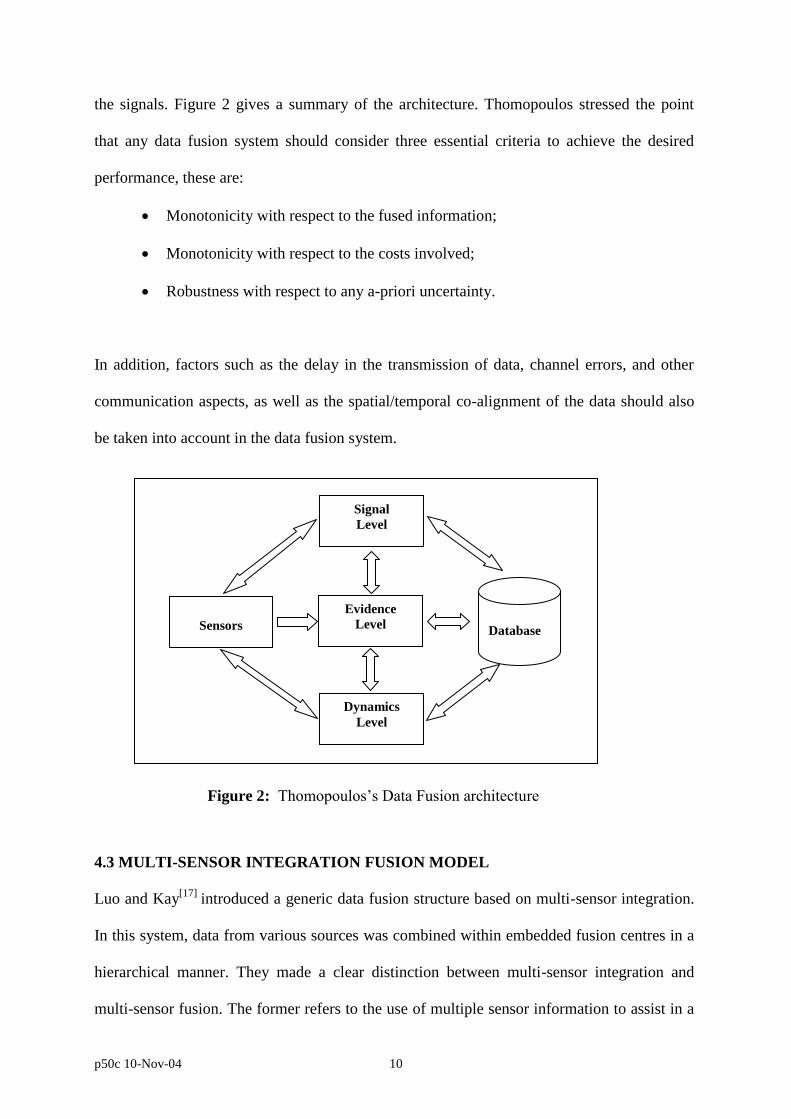
p50c 10-Nov-04 10
the signals. Figure 2 gives a summary of the architecture. Thomopoulos stressed the point
that any data fusion system should consider three essential criteria to achieve the desired
performance, these are:
Monotonicity with respect to the fused information;
Monotonicity with respect to the costs involved;
Robustness with respect to any a-priori uncertainty.
In addition, factors such as the delay in the transmission of data, channel errors, and other
communication aspects, as well as the spatial/temporal co-alignment of the data should also
be taken into account in the data fusion system.
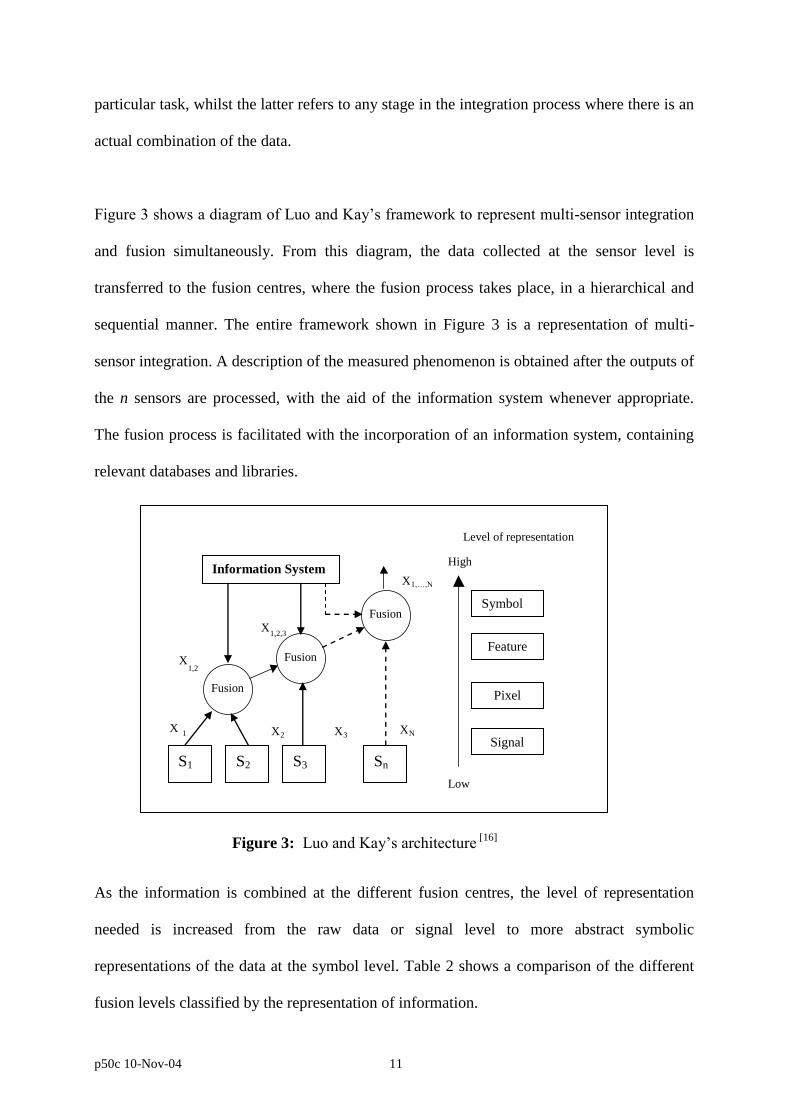
4.3 MULTI-SENSOR INTEGRATION FUSION MODEL
Luo and Kay[17]
introduced a generic data fusion structure based on multi-sensor integration.
In this system, data from various sources was combined within embedded fusion centres in a
hierarchical manner. They made a clear distinction between multi-sensor integration and
multi-sensor fusion. The former refers to the use of multiple sensor information to assist in a
Signal
Level
Dynamics
Level
Evidence
Level
Sensors
Database
Figure 2: Thomopoulos’s Data Fusion architecture
p50c 10-Nov-04 11
particular task, whilst the latter refers to any stage in the integration process where there is an
actual combination of the data.
Figure 3 shows a diagram of Luo and Kay’s framework to represent multi-sensor integration
and fusion simultaneously. From this diagram, the data collected at the sensor level is
transferred to the fusion centres, where the fusion process takes place, in a hierarchical and
sequential manner. The entire framework shown in Figure 3 is a representation of multi-
sensor integration. A description of the measured phenomenon is obtained after the outputs of
the n sensors are processed, with the aid of the information system whenever appropriate.
The fusion process is facilitated with the incorporation of an information system, containing
relevant databases and libraries.
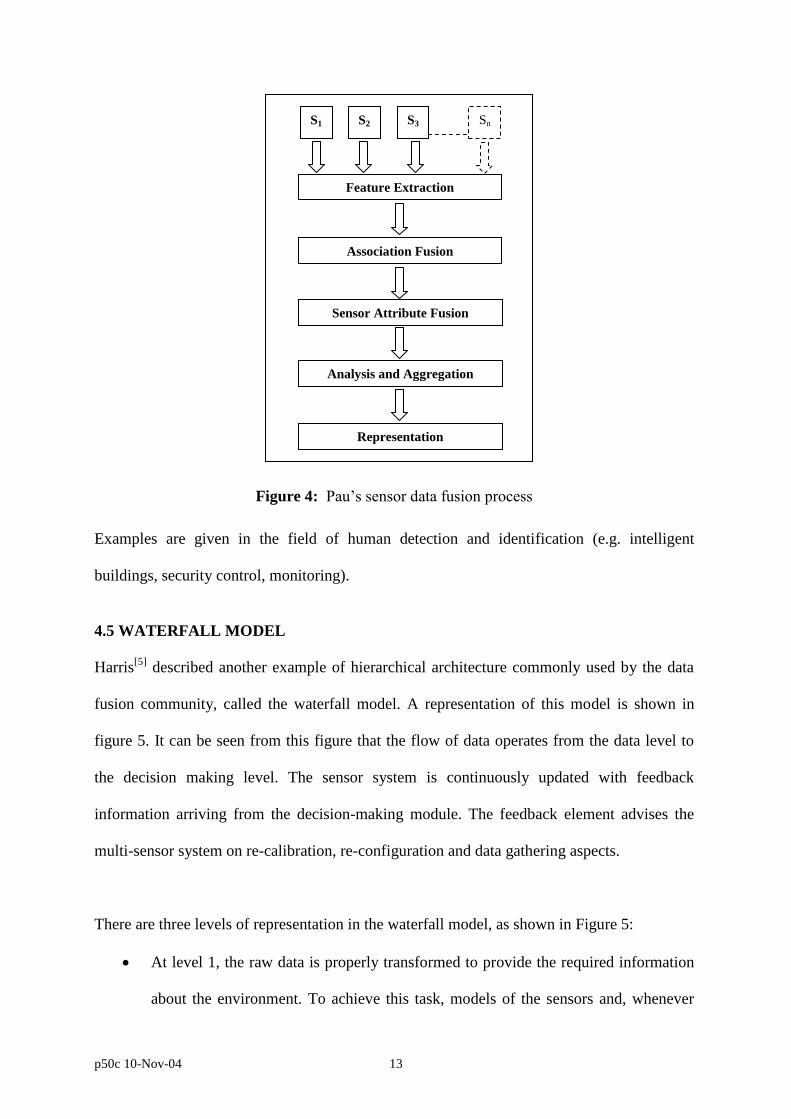
As the information is combined at the different fusion centres, the level of representation
needed is increased from the raw data or signal level to more abstract symbolic
representations of the data at the symbol level. Table 2 shows a comparison of the different
fusion levels classified by the representation of information.
Low
High
Level of representation
Fusion
Fusion
Fusion
X 1 X 2 X 3 X N
X 1,2
X 1,2,3
X 1,…,N Information System
S1 S2 S3 Sn
Symbol
Signal
Feature
Pixel
Figure 3: Luo and Kay’s architecture [16]
p50c 10-Nov-04 12
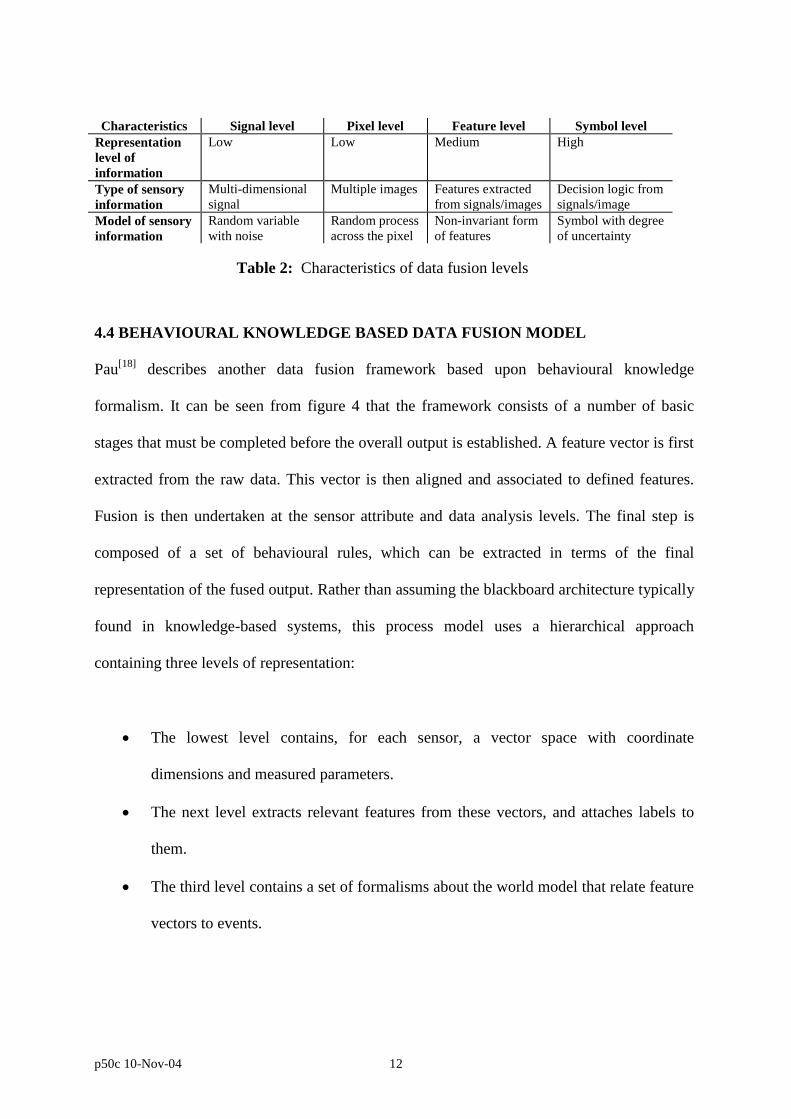
4.4 BEHAVIOURAL KNOWLEDGE BASED DATA FUSION MODEL
Pau[18]
describes another data fusion framework based upon behavioural knowledge
formalism. It can be seen from figure 4 that the framework consists of a number of basic
stages that must be completed before the overall output is established. A feature vector is first
extracted from the raw data. This vector is then aligned and associated to defined features.
Fusion is then undertaken at the sensor attribute and data analysis levels. The final step is
composed of a set of behavioural rules, which can be extracted in terms of the final
representation of the fused output. Rather than assuming the blackboard architecture typically
found in knowledge-based systems, this process model uses a hierarchical approach
containing three levels of representation:
The lowest level contains, for each sensor, a vector space with coordinate
dimensions and measured parameters.
The next level extracts relevant features from these vectors, and attaches labels to
them.
The third level contains a set of formalisms about the world model that relate feature
vectors to events.
Characteristics Signal level Pixel level Feature level Symbol level
Representation
level of
information
Low Low Medium High
Type of sensory
information
Multi-dimensional
signal
Multiple images Features extracted
from signals/images
Decision logic from
signals/image
Model of sensory
information
Random variable
with noise
Random process
across the pixel
Non-invariant form
of features
Symbol with degree
of uncertainty
Table 2: Characteristics of data fusion levels
p50c 10-Nov-04 13
Examples are given in the field of human detection and identification (e.g. intelligent
buildings, security control, monitoring).
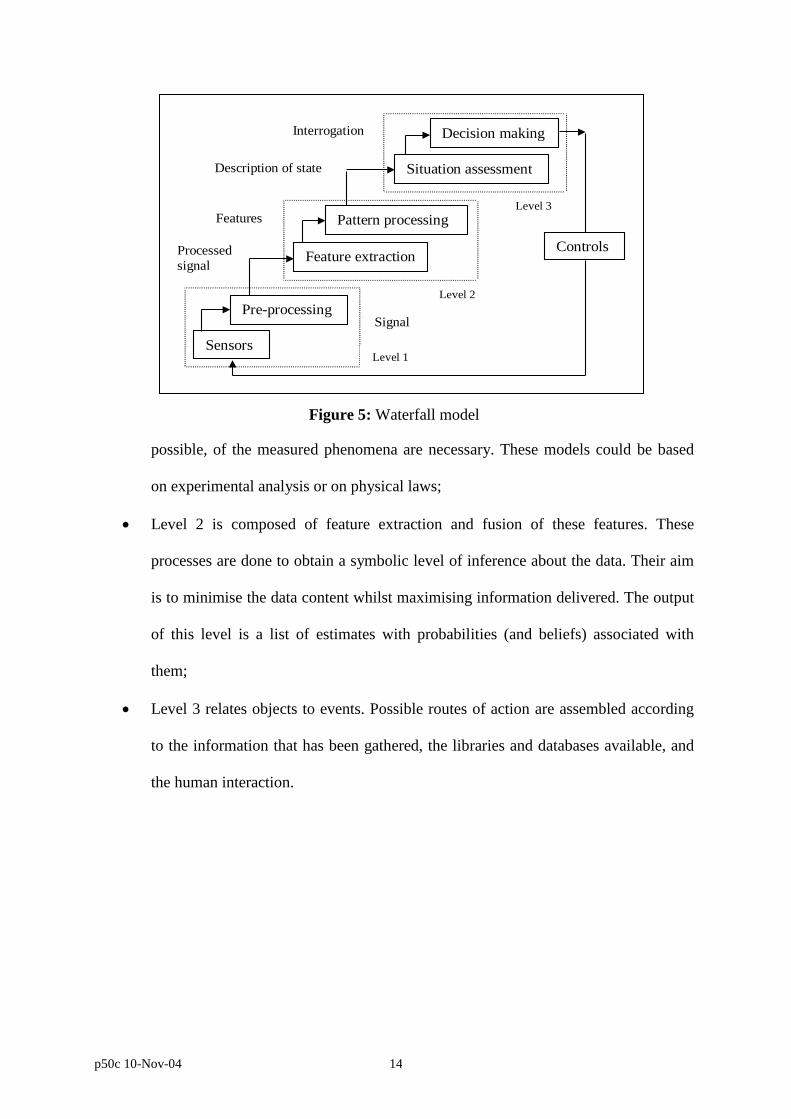
4.5 WATERFALL MODEL
Harris[5]
described another example of hierarchical architecture commonly used by the data
fusion community, called the waterfall model. A representation of this model is shown in
figure 5. It can be seen from this figure that the flow of data operates from the data level to
the decision making level. The sensor system is continuously updated with feedback
information arriving from the decision-making module. The feedback element advises the
multi-sensor system on re-calibration, re-configuration and data gathering aspects.
There are three levels of representation in the waterfall model, as shown in Figure 5:
At level 1, the raw data is properly transformed to provide the required information
about the environment. To achieve this task, models of the sensors and, whenever
S1 S2 S3 Sn
Feature Extraction
Association Fusion
Sensor Attribute Fusion
Analysis and Aggregation
Representation
Figure 4: Pau’s sensor data fusion process
p50c 10-Nov-04 14
possible, of the measured phenomena are necessary. These models could be based
on experimental analysis or on physical laws;
Level 2 is composed of feature extraction and fusion of these features. These
processes are done to obtain a symbolic level of inference about the data. Their aim
is to minimise the data content whilst maximising information delivered. The output
of this level is a list of estimates with probabilities (and beliefs) associated with
them;
Level 3 relates objects to events. Possible routes of action are assembled according
to the information that has been gathered, the libraries and databases available, and
the human interaction.
Sensors
Pre-processing
Feature extraction
Situation assessment
Pattern processing
Decision making
Signal
Processed
signal
Features
Description of state
Controls
Interrogation
Level 1
Level 2
Level 3
Figure 5: Waterfall model
p50c 10-Nov-04 15
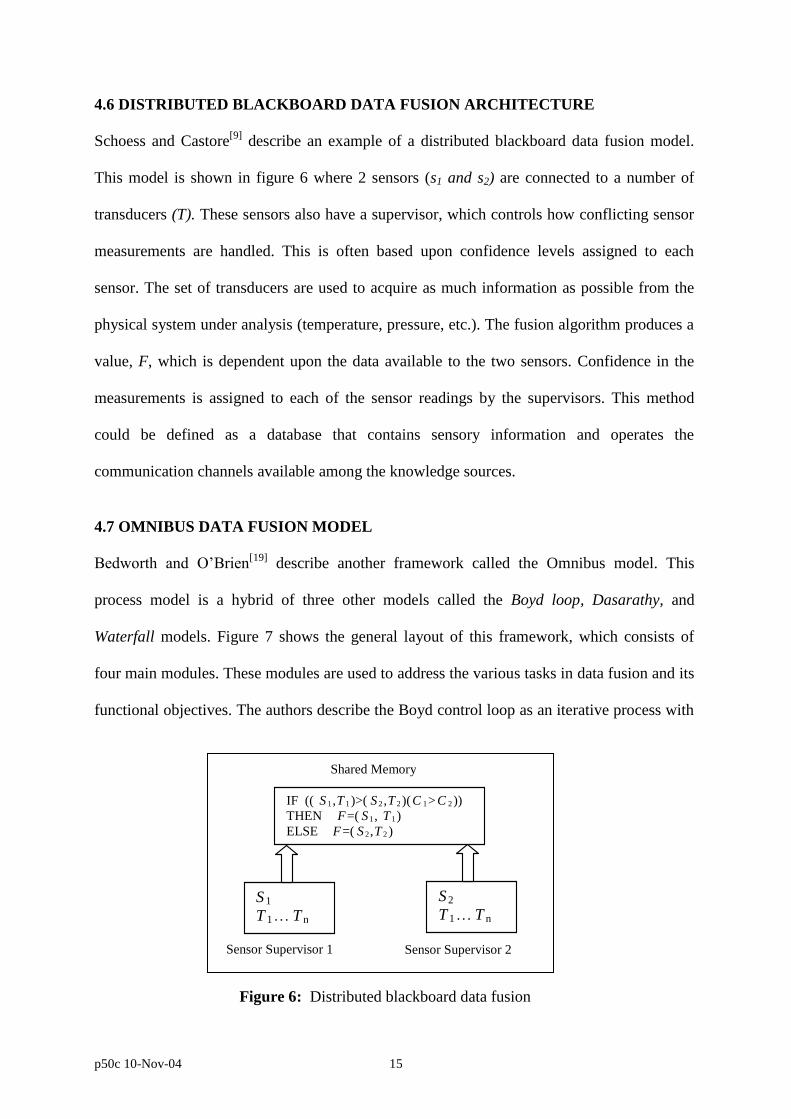
4.6 DISTRIBUTED BLACKBOARD DATA FUSION ARCHITECTURE
Schoess and Castore[9]
describe an example of a distributed blackboard data fusion model.
This model is shown in figure 6 where 2 sensors (s1 and s2) are connected to a number of
transducers (T). These sensors also have a supervisor, which controls how conflicting sensor
measurements are handled. This is often based upon confidence levels assigned to each
sensor. The set of transducers are used to acquire as much information as possible from the
physical system under analysis (temperature, pressure, etc.). The fusion algorithm produces a
value, F, which is dependent upon the data available to the two sensors. Confidence in the
measurements is assigned to each of the sensor readings by the supervisors. This method
could be defined as a database that contains sensory information and operates the
communication channels available among the knowledge sources.
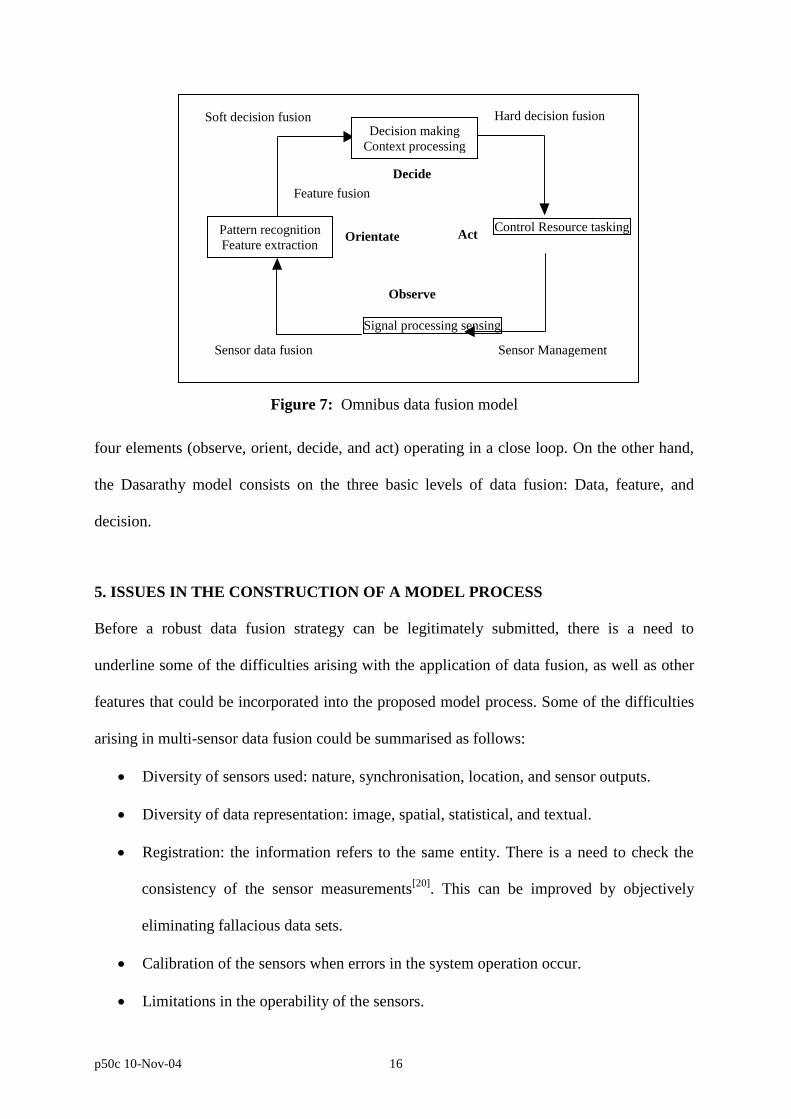
4.7 OMNIBUS DATA FUSION MODEL
Bedworth and O’Brien[19]
describe another framework called the Omnibus model. This
process model is a hybrid of three other models called the Boyd loop, Dasarathy, and
Waterfall models. Figure 7 shows the general layout of this framework, which consists of
four main modules. These modules are used to address the various tasks in data fusion and its
functional objectives. The authors describe the Boyd control loop as an iterative process with
S 1
T 1 … T n
Sensor Supervisor 1
S 2
T 1 … T n
Sensor Supervisor 2
IF (( S 1 , T 1 )>( S 2 , T 2 )( C 1 > C 2 ))
THEN F =( S 1 , T 1 )
ELSE F =( S 2 , T 2 )
Shared Memory
Figure 6: Distributed blackboard data fusion
p50c 10-Nov-04 16
four elements (observe, orient, decide, and act) operating in a close loop. On the other hand,
the Dasarathy model consists on the three basic levels of data fusion: Data, feature, and
decision.
5. ISSUES IN THE CONSTRUCTION OF A MODEL PROCESS
Before a robust data fusion strategy can be legitimately submitted, there is a need to
underline some of the difficulties arising with the application of data fusion, as well as other
features that could be incorporated into the proposed model process. Some of the difficulties
arising in multi-sensor data fusion could be summarised as follows:
Diversity of sensors used: nature, synchronisation, location, and sensor outputs.
Diversity of data representation: image, spatial, statistical, and textual.
Registration: the information refers to the same entity. There is a need to check the
consistency of the sensor measurements[20]
. This can be improved by objectively
eliminating fallacious data sets.
Calibration of the sensors when errors in the system operation occur.
Limitations in the operability of the sensors.
Signal processing sensing
Control Resource tasking
Sensor data fusion
Feature fusion
Soft decision fusion Hard decision fusion
Orientate Act
Observe
Decide
Decision making
Context processing
Pattern recognition
Feature extraction
Sensor Management
Figure 7: Omnibus data fusion model
p50c 10-Nov-04 17
Deficiencies in the statistical models of the sensors and limitations in the algorithm
development.
This is by no means an exhaustive list of problems and the practitioner needs to be aware of
the inherent difficulties arising in any data acquisition and data analysis tasks.
Some important architectural issues needed for the implementation of a process model for
data fusion are:
Network configuration of sensors: parallel or serial multi-sensor suite, or a
combination of the two. A parallel sensor arrangement is best suited for either
identical or dissimilar sensors. Serial sensor configurations are very practical when
one sensor delivers complementary information to the next.
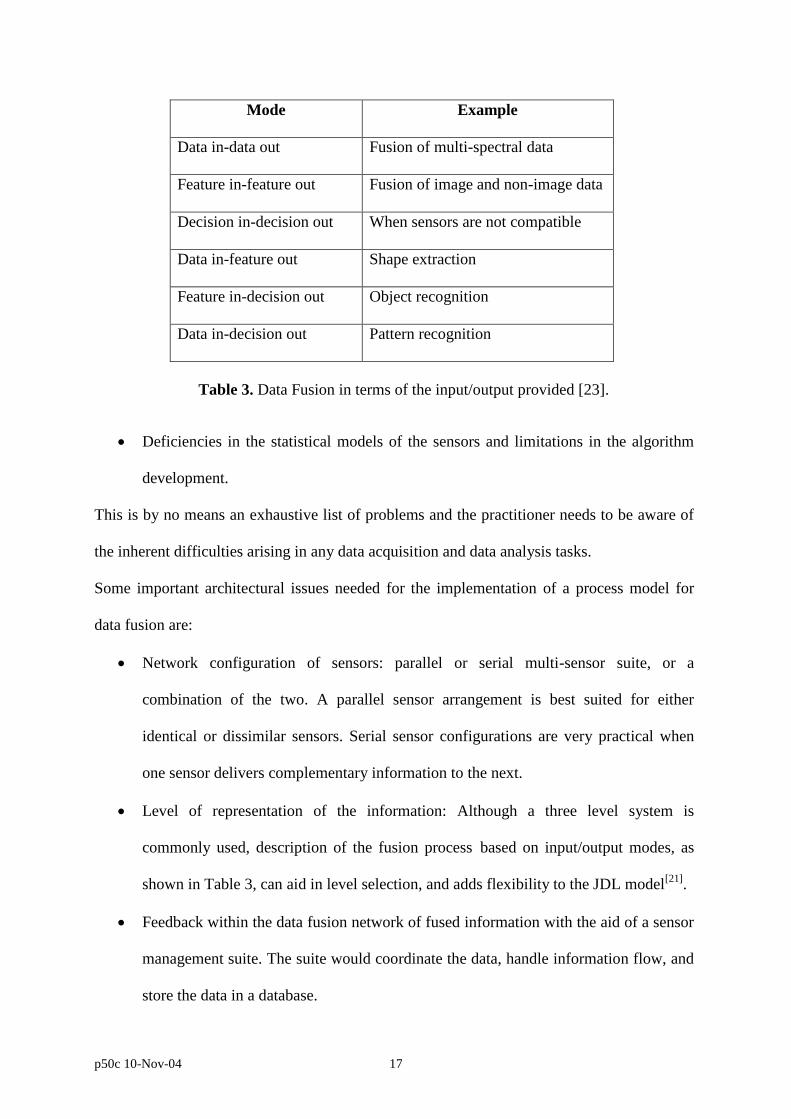
Level of representation of the information: Although a three level system is
commonly used, description of the fusion process based on input/output modes, as
shown in Table 3, can aid in level selection, and adds flexibility to the JDL model[21]
.
Feedback within the data fusion network of fused information with the aid of a sensor
management suite. The suite would coordinate the data, handle information flow, and
store the data in a database.
Mode Example
Data in-data out Fusion of multi-spectral data
Feature in-feature out Fusion of image and non-image data
Decision in-decision out When sensors are not compatible
Data in-feature out Shape extraction
Feature in-decision out Object recognition
Data in-decision out Pattern recognition
Table 3. Data Fusion in terms of the input/output provided [23].
p50c 10-Nov-04 18
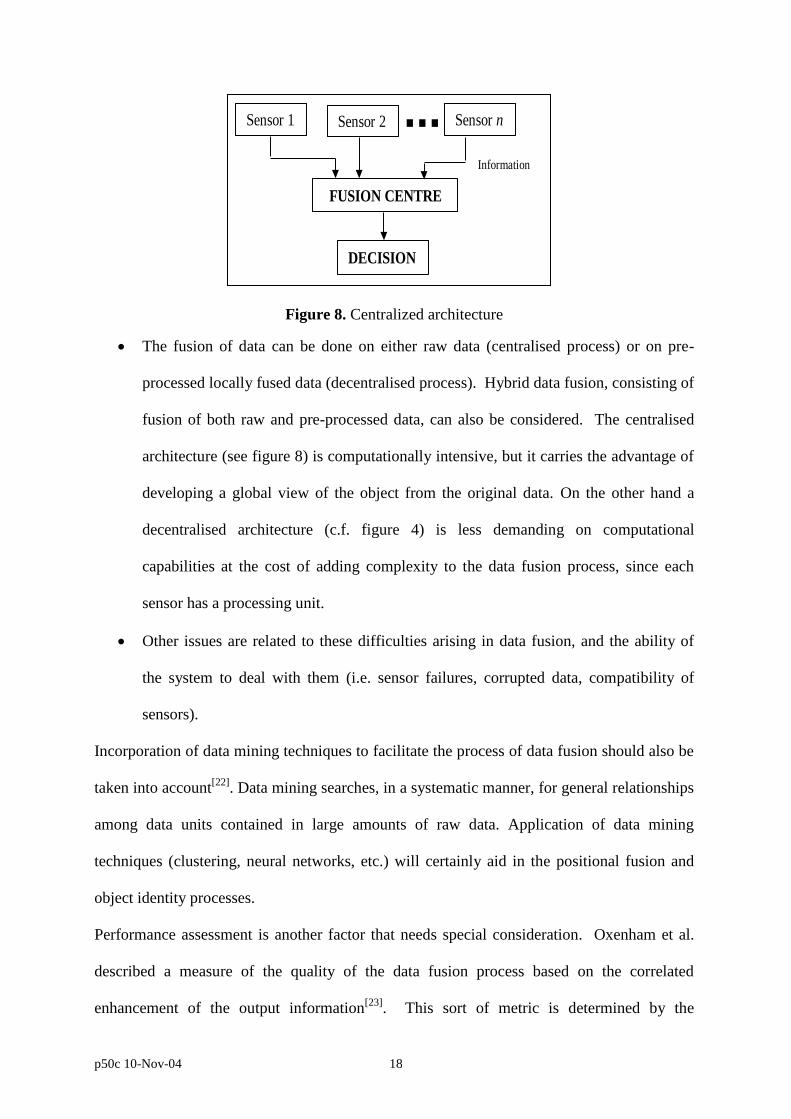
The fusion of data can be done on either raw data (centralised process) or on pre-
processed locally fused data (decentralised process). Hybrid data fusion, consisting of
fusion of both raw and pre-processed data, can also be considered. The centralised
architecture (see figure 8) is computationally intensive, but it carries the advantage of
developing a global view of the object from the original data. On the other hand a
decentralised architecture (c.f. figure 4) is less demanding on computational
capabilities at the cost of adding complexity to the data fusion process, since each
sensor has a processing unit.
Other issues are related to these difficulties arising in data fusion, and the ability of
the system to deal with them (i.e. sensor failures, corrupted data, compatibility of
sensors).
Incorporation of data mining techniques to facilitate the process of data fusion should also be
taken into account[22]
. Data mining searches, in a systematic manner, for general relationships
among data units contained in large amounts of raw data. Application of data mining
techniques (clustering, neural networks, etc.) will certainly aid in the positional fusion and
object identity processes.
Performance assessment is another factor that needs special consideration. Oxenham et al.
described a measure of the quality of the data fusion process based on the correlated
enhancement of the output information[23]
. This sort of metric is determined by the
Sensor 1 Sensor 2 Sensor n
FUSION CENTRE
DECISION
Information
Figure 8. Centralized architecture
p50c 10-Nov-04 19
uncertainty in the system: a decrease in uncertainty yields an increase in information
delivered. Kewley gives another measure of uncertainty, provided by the system, in terms of
ambiguity and vagueness[24]
.
6 A SYSTEM BASED STRATEGY: ENGINEERING GUIDELINES
The demands for data fusion processes in a wide range of applications have made possible
the proliferation of data fusion models. Providing a well-structured way to identify the
system under study, regardless of the nature of the data collected, would efficiently aid in the
subsequent implementation of the most convenient data fusion model. This generalised
approach would allocate the necessary resources to develop data fusion into systems, rather
than a data fusion system. Successful projections of particular data fusion models have been
presented in the literature.
The system-based approach to data fusion proposed by the authors is shown in Figure 9. This
framework was developed as part of a collaborative programme measuring flames within a
harsh combustion environment[25]
. It is not the authors’ intention to demonstrate applications
in this paper, but to examine the reasoning of the architecture. In particular, it is an attempt to
meet the requirements for engineering guidelines, the need for which was emphasised by
Hall[26]
. These are an important structure to link the terms of the practical problem with a
multi-level algorithmic solution, which is essential to the user community.
The defined framework uses three fundamental steps in the analysis of the system. These are
identification, estimation, and validation.

p50c 10-Nov-04 20
6.1 IDENTIFICATION
The identification process is aided, whenever appropriate, by the application of data mining
techniques. At this stage, inference about the system takes place, interrogating the various
factors used in the data fusion process:
What is the information gained by using data fusion? This would be the first question
one ought to ask before characterising a problem. It is important to identify
performance criteria to identify if the data fusion process is worth doing.
Understand the physical-chemical phenomenon under study: collect information
available by fusing people’s knowledge about the problem and propose a model
and/or state equations describing the phenomenon. If a model already exists, it should
be used and understood.
Know all your data sources (e.g. sensors, databases, libraries). Especially, identify
how the data have been collected, measuring techniques used, availability of
processed data, and other issues regarding the fine tuning of the data sources, such as
calibration, effects of human interaction, and missing data.
Data Mining
Identification
Info gained by data fusion
Know your data sources Understand the system
Analyse the data
Identify level of inference
Estimation Validation
Benchmark
Performance
assessment
Administration
Signal level Pixel level
Feature level
Symbol level
Positional fusion
Identity fusion
Sources
Data fusion centre
Figure 9: System-based data fusion architecture.
p50c 10-Nov-04 21
Analyse the data in more depth before mathematical manipulation takes place. Issues
to consider include:
checking and adjusting for the synchronisation of separate data streams;
identifying the true dimensionality, and trying ways to reduce it, without reducing
the information content;
identifying whether the data is concentrated or sparse, and hence choosing
appropriate methods for pre-processing;
checking the repeatability of measurements, and likely error;
examining the built-in redundancy of the sensor system to ensure a robust data
collection process.
Identify the dominant uncertainty in the system and whether this can be corrected or
minimised. Uncertainty could take three forms:
stochastic noise which cannot be corrected per se, but which could be
compensated statistically;
systematic error which might be corrected by calibration or modelling;
unknowns, e.g. the transfer function between the real state and the measured state
in a non-invasive measurement, or simply a missing parameter.
Identify the level at which fusion must take place. Usually, data collected from similar
sensors can be combined at the lowest level of inference, while data arriving from
dissimilar sensors must be fused at higher levels. Fusion at a feature level, or
integration of knowledge for decision-making, always occurs at a higher level.
6.2 ESTIMATION
Once a thorough identification of the system has been made, the process continues with the
estimation of the data at the appropriate level of inference. Two taxonomies have been
p50c 10-Nov-04 22
selected to select the data fusion algorithm in order to deal with a range of data sources,
including time series and images:
A four level hierarchy consisting of signal, pixel, feature, and symbol levels.
At the signal and pixel levels of fusion, data correlation takes place due to the lack
of a mathematical model describing the phenomenon being measured. The main
difference between the two is the nature of the data analysed.
At the feature level fusion, features are extracted from the raw data and then
combined.
At the symbol level fusion, the data is combined with the aid of a mathematical
model and the analysis is based on statistical and logical inference.
A classical JDL model of data fusion including positional fusion. This will attempt
to determine the location and kinematic information of an entity. Following on from
this is will identity the level of fusion required to transform the raw data into a
meaningful representation of the system.
Both of these fusion processes complement each other, i.e. positional fusion could be
exercised to facilitate the process of identity fusion, and vice versa. This taxonomy maps very
closely the analytical processing needs found in the engineering community, e.g. positional
fusion techniques can track down the location of the damage in a system, while identity
fusion can aid in identifying the type of damage.
After the core hierarchical architecture has been selected according to the type of data and
application at hand, algorithm selection is made at each levels. The information obtained at
the identification stage will aid in this task.
6.3 VALIDATION
p50c 10-Nov-04 23
The processed data and the fused information is confirmed at the validation stage, where
performance assessment and a benchmark procedure are implemented:
Assessment on the performance of the data fusion model can be made measuring the
uncertainty content in the solution (e.g. a probability measure, false alarm rate, or
classification of accuracy);
Build-up a benchmark procedure to improve the output results from the data fusion
model, and to properly allocate the most optimal techniques.
The information gained at the validation stage can be passed onto the administration function
of the model. In this manner, knowledge can be transferred and proper adjustments can be
made to the model (e.g. sensor calibration, fusion techniques, measured parameters). The
framework can then be most optimally mapped onto the problem at hand, leading to a
sensible and methodical way to extract meaningful information from the measured
phenomenon.
p50c 10-Nov-04 24
7 CONCLUSIONS
This paper reviewed some of the most widely used architectures for the implementation of
data fusion solutions to problems from different industries, for example defence, maintenance
and medical. Other issues, not normally treated in detail on the framework literature, are also
considered. The methodology behind successful implementation of data fusion solutions is
examined in detail. The main observations are that:
the architecture chosen is critical to successful data fusion;
stepwise implementation including identification, estimation and validation is
important for consistency, and to avoid presumptive choices;
tailoring of the methodology, and bespoke choice of technology, based on gathered
information and data from a variety of physical and human sources, is likely to lead to
an optimal solution.
The authors have developed a flexible systems-based approach to data fusion which is used
for a range of dissimilar sensor inputs, including time series and image arrays. The
methodology allows models and information to be combined, and does not pre-determine the
fusion technology. Engineering guidelines have been proposed which assist the practitioner
in information gathering and decision-making. The guidelines also propose methods for
validating the solutions but these need further testing.
8 ACKNOWLEDGEMENTS
This work was supported by the INTErSECT Faraday Partnership and EPSRC as part of
project GR/M44484 “The Application of Data Fusion to a Multi Sensored Intelligent
Engine”. The authors gratefully acknowledge the assistance of the following partners: Corus,
National Physical Laboratory, QinetiQ, Rolls-Royce, and Wolfson Maintenance; and
p50c 10-Nov-04 25
particularly of Dr Mark Bedworth, Mr Graham Hesketh, Prof. John Macintyre, and Mrs Jane
O’Brien in the preparation of the guidelines.
9 REFERENCES
1. Edwards, I., Gross, X. E., Lowden, D. W. & Strachan, P. Fusion of NDT data. British
Journal of NDT, 35 (12): 710-713.
2. Ayari, I. & Haton, J. P. A framework for multi-sensor data fusion. Proc. IEEE
Symposium on Emerging Technologies and Factory Automation 1995, 2: 51-59.
3. Linn, R. J. & Hall, D.L. A survey of data fusion systems. Proc. SPIE Conf. on Data
Structure and Target Classification, 1991: 13-36.
4. Cremer, F., den Breejes, E. & Klamer, S. Sensor fusion for anti-personnel land mines
detection. Proc. of 3rd
Eurofusion Conf. Oct. 1998: 63-70.
5. Harris C. J., Bailey A. & Dodd, T. J. Multi-sensor data fusion in defence and aerospace.
Aeronautical Journal. 102 (1015): 229-244.
6. Bruzzone, L., Fernandez, D. & Vernazza G. Data fusion experience: from industrial
visual inspection to space remote-sensing application. Proc. Academic and Industrial
Cooperation in Space research, Vienna, 4-6 Nov. 1998 (ESA SP-432): 147-151.
7. Nigay, L. & Coutaz, J. A generic platform for addressing the multimodal challenge. Proc.
Conf. Human Factors in Computing Systems. 1995, 1: 98-105.
8. Sentinella, D.J. & Raines, A. G. Real time data fusion. IEE Colloquium (Digest) 55: 5/1-
5/3.
9. Schoess J. & Castore, G. A distributed sensor architecture for advanced aerospace
systems. Proc. SPIE, 932, Sensor Fusion 1988: 74-86.
10. Pau, L. F. Behavioral knowledge in sensor/data fusion systems. Journal of Robotic
Systems, 7 (3): 295-308.
p50c 10-Nov-04 26
11. Kelly, G. Data fusion: From metrology to process measurement. NPL Internal report
INTErSECT and summarised at [25].
12. Taylor, O., MacIntyre, J., 1998, Adaptive local fusion systems for novelty detection and
diagnostics in condition monitoring, Proc. SPIE v 3376, p 210-218, ISSN: 0277-786X
13. Thomopoulos, S. C. Sensor integration and data fusion. Proc. SPIE 1198, Sensor Fusion
II: Human and Machine Strategies, 1989: 178-191.
14. Richardson, J. M., and Mash, K. A. Fusion of multisensor data. International Journal of
Robotics Research, Dec. 1988, 7(6): 78-96.
15. Llinas, J. & Hall, D. L. An introduction to multi-sensor data fusion. Proc. IEEE
International Symposium on Circuits and Systems 1998, 6: 537-540.
16. Paradis, S., Roy, J. & Treurniet, W. 1998. Integration of all data fusion levels using a
blackboard architecture. Proc. of 3rd
Eurofusion Conf. Oct. 1998: 195-202.
17. Luo, R., and Kay, M. 1988. Multisensor integration and fusion: Issues and approaches.
SPIE Sensor Fusion, 931: 42-49.
18. Pau, L. F. 1988. Sensor data fusion. Journal of Intelligent and Robotic Systems 1:103-
116.
19. Bedworth, M. and O'Brien, J, 1999, The Omnibus model: a new model of data fusion?.
Proc. 2nd Intl. Conf. on Information Fusion, Sunnyvale
20. Hackett, J. K. & Shah, M. Multi-sensor fusion: a perspective. IEEE CH2876-1/90: 1324-
1330.
21. Varshney, P. K. Multi-sensor data fusion. Electronics and Communication Engineering
Journal Dec. 1997, 9(6): 245-253
22. Waltz, E. L. Information understanding: integrating data fusion and data mining
processes. Proc. IEEE International Symposium on Circuits and Systems 1998, 6:553-556

p50c 10-Nov-04 27
23. Oxenham, M. G., Kewley, D. J. & Nelson, M. J. Performance assessment of data fusion
systems. Proc. Australian Data Fusion Symp. 1996: 36-41.
24. Kewley, D. J. A model for evaluating data fusion systems. IEEE 1058-6393/93: 273-277.
25. http://www.eng.man.ac.uk/mech/merg/Research/Dfast/intersect.html
26. Hall, D L, Garga A K, 1999, Pitfalls in data fusion (and how to avoid them), Proc.
Eurofusion 99 Stratford on Avon UK