Embed Size (px)
Citation preview
Data Dashboard 2011
WASHINGTON STATE SCHOOL DIRECTORS’ ASSOCIATION
WSSDA Members
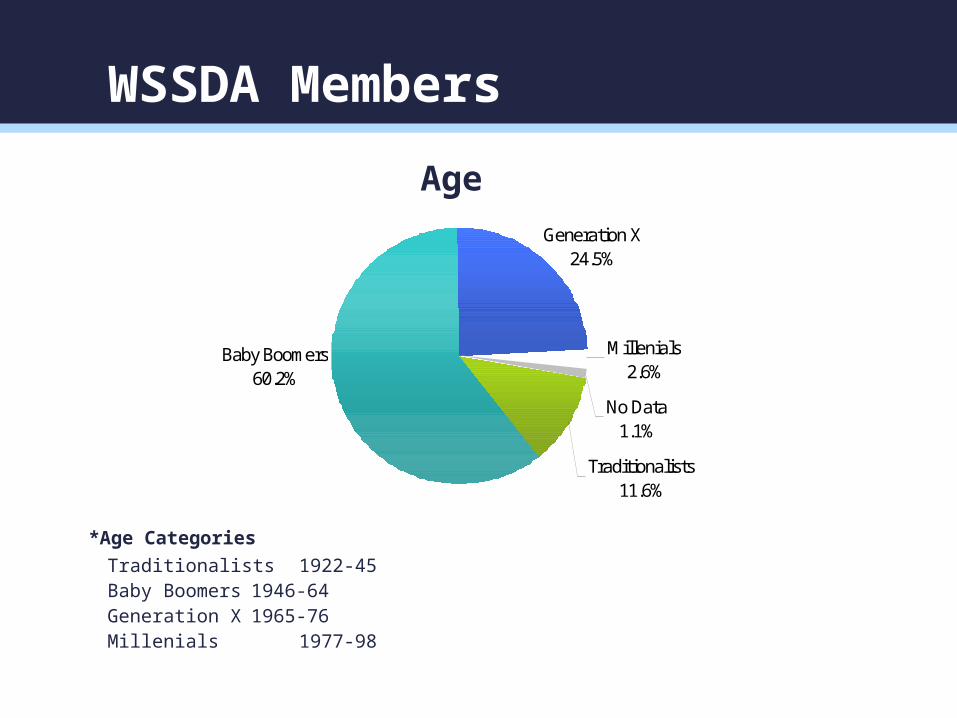
Traditionalists 1922-45Baby Boomers 1946-64Generation X 1965-76Millenials 1977-98
*Age Categories
Traditionalists11.6%
Millenials2.6%
No Data1.1%
Generation X24.5%
Baby Boomers60.2%
Age
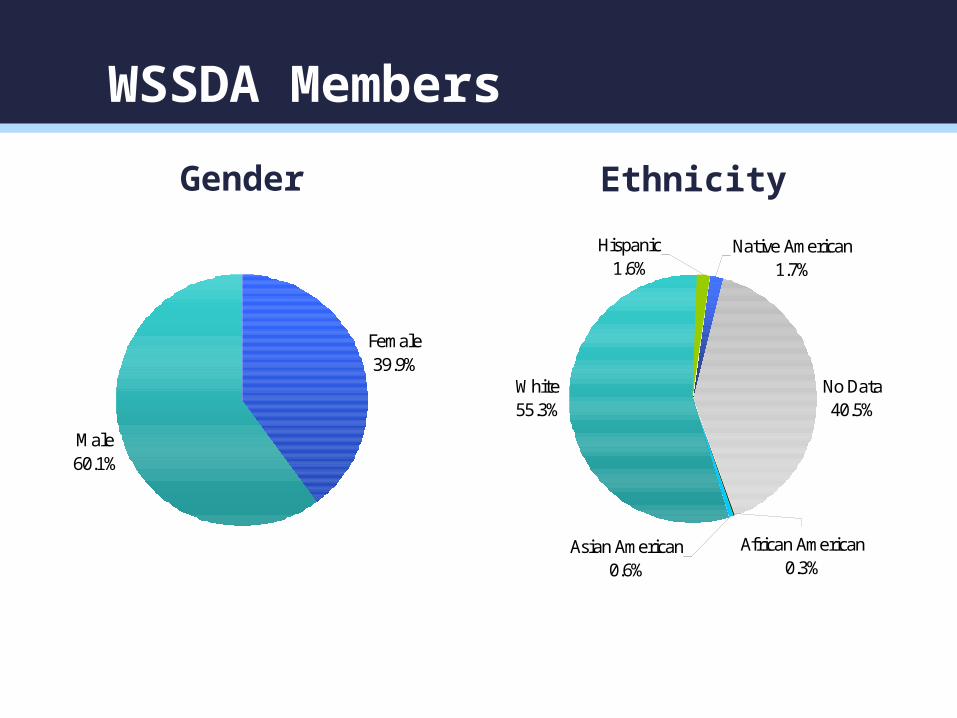
Female39.9%
Male60.1%
Native American1.7%
No Data40.5%
White55.3%
African American0.3%
Asian American0.6%
Hispanic1.6%
Gender Ethnicity
WSSDA Members
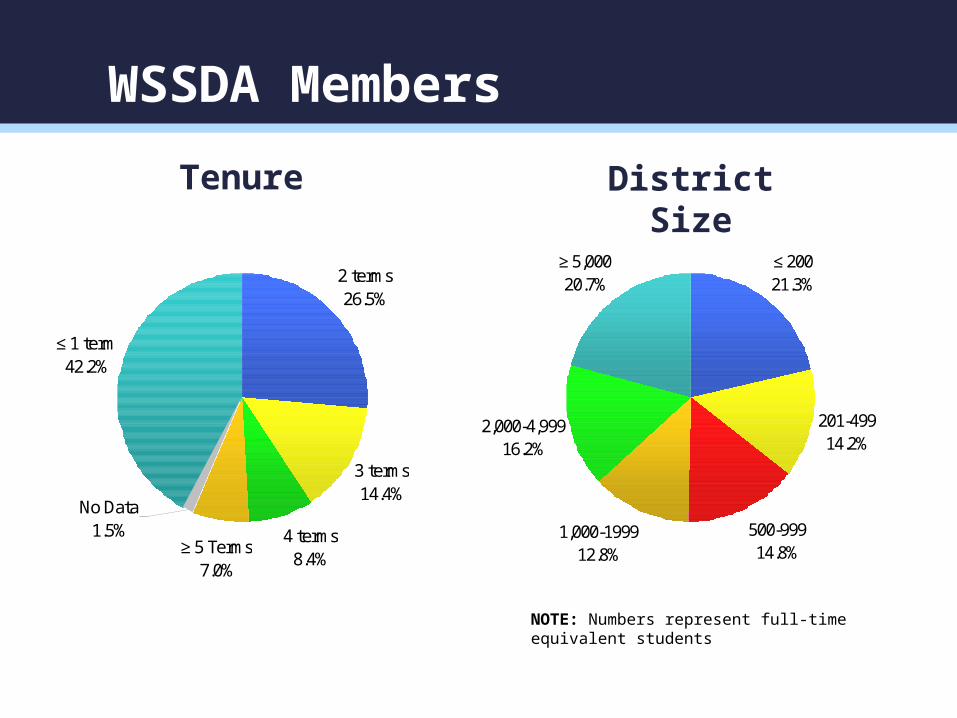
2 terms26.5%
3 terms14.4%
4 terms8.4%
≥ 5 Terms7.0%
≤ 1 term42.2%
No Data1.5%
≤ 20021.3%
201-49914.2%
500-99914.8%
1,000-199912.8%
2,000-4,99916.2%
≥ 5,00020.7%
Tenure District Size
WSSDA Members
NOTE: Numbers represent full-time equivalent students
Goal 1: Organizational Development WSSDA’s organizational structure and culture effectively and efficiently serve school directors and their districts.
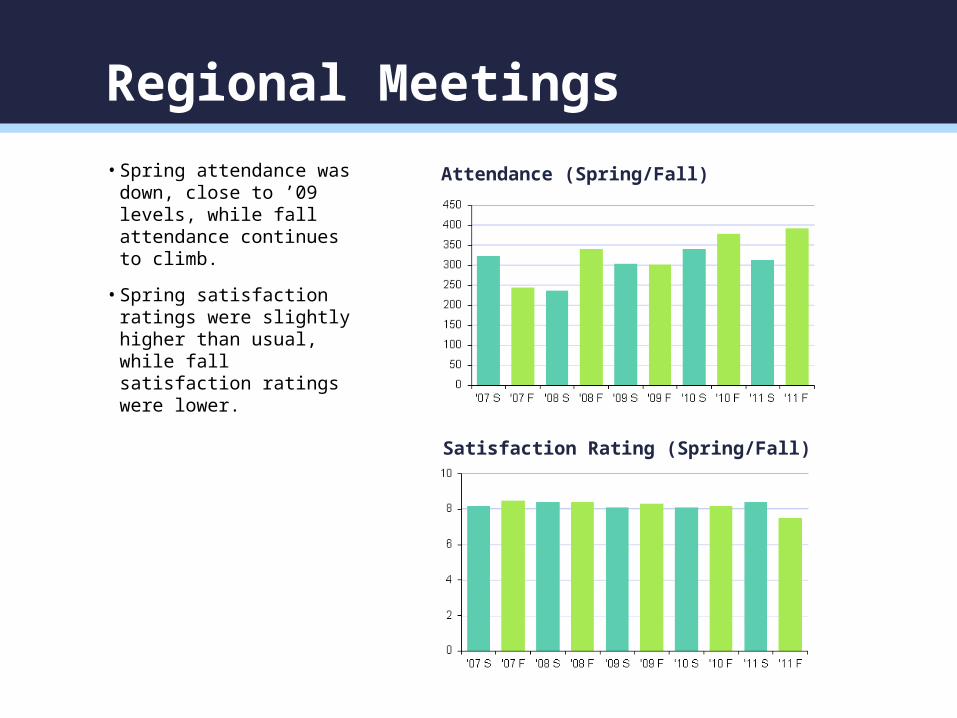
• Spring attendance was down, close to ’09 levels, while fall attendance continues to climb.
• Spring satisfaction ratings were slightly higher than usual, while fall satisfaction ratings were lower.
Regional Meetings
Attendance (Spring/Fall)
Satisfaction Rating (Spring/Fall)
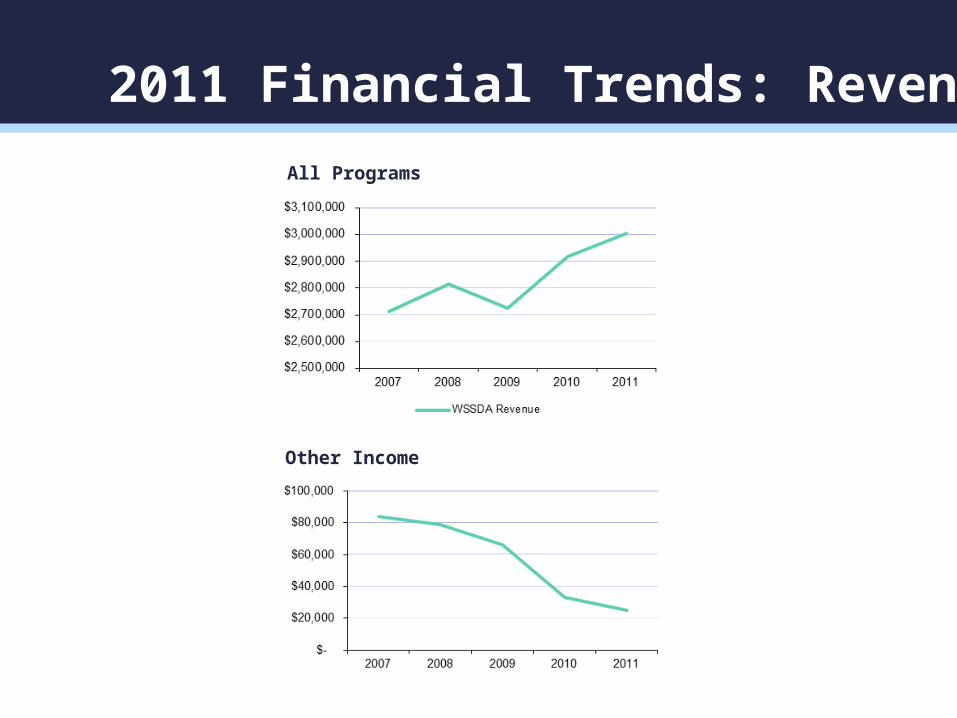
All Programs
2011 Financial Trends: Revenue
Other Income
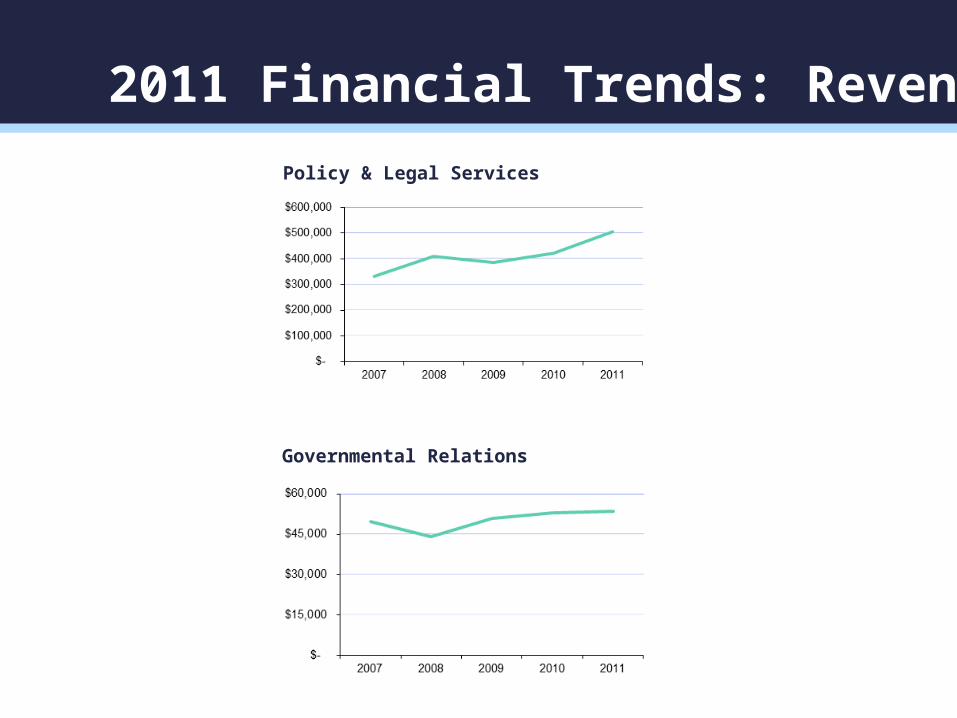
Policy & Legal Services
2011 Financial Trends: Revenue
Governmental Relations
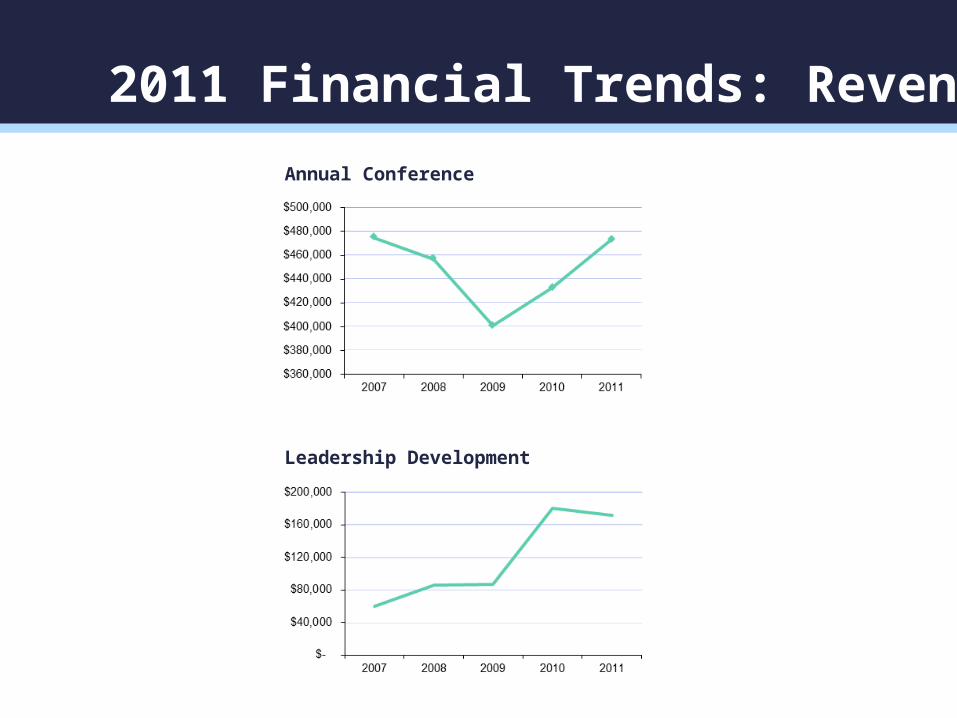
Annual Conference
2011 Financial Trends: Revenue
Leadership Development
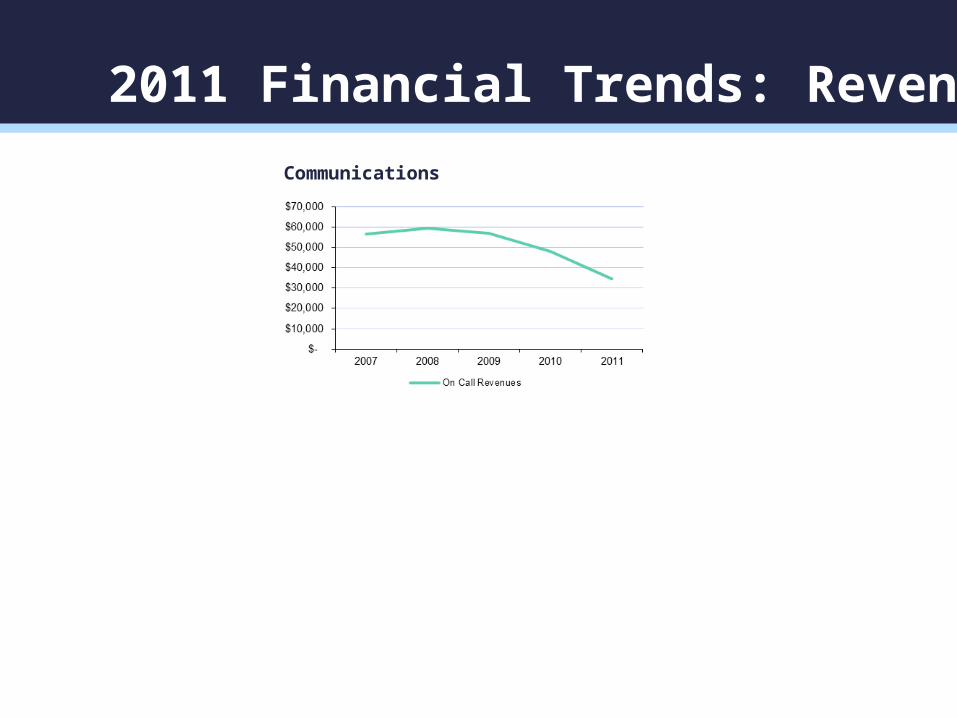
Communications
2011 Financial Trends: Revenue
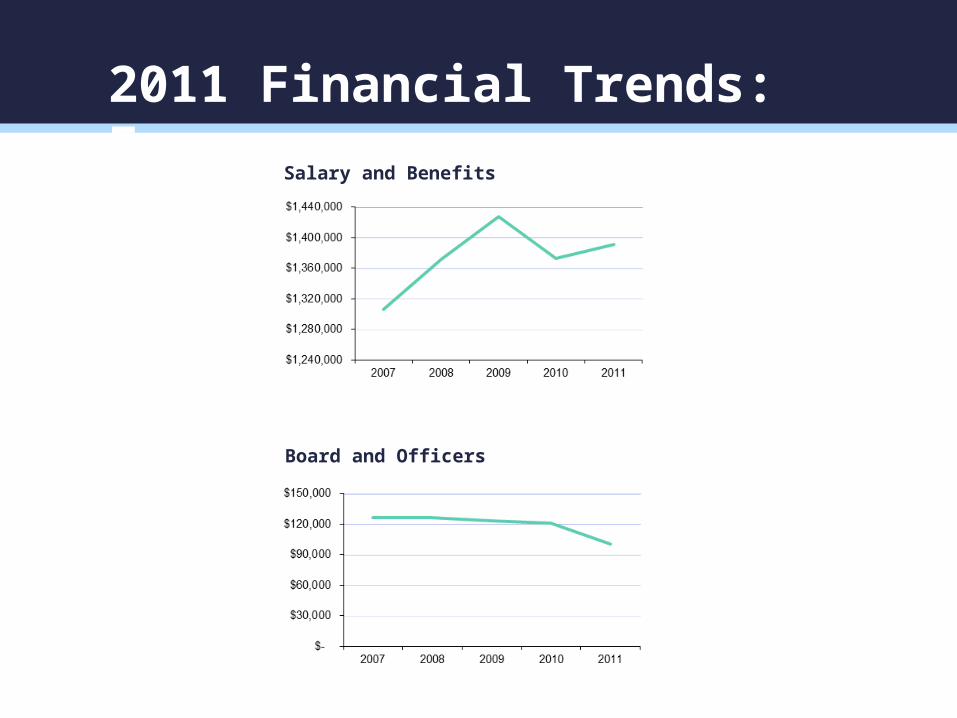
2011 Financial Trends: Expenses
Salary and Benefits
Board and Officers
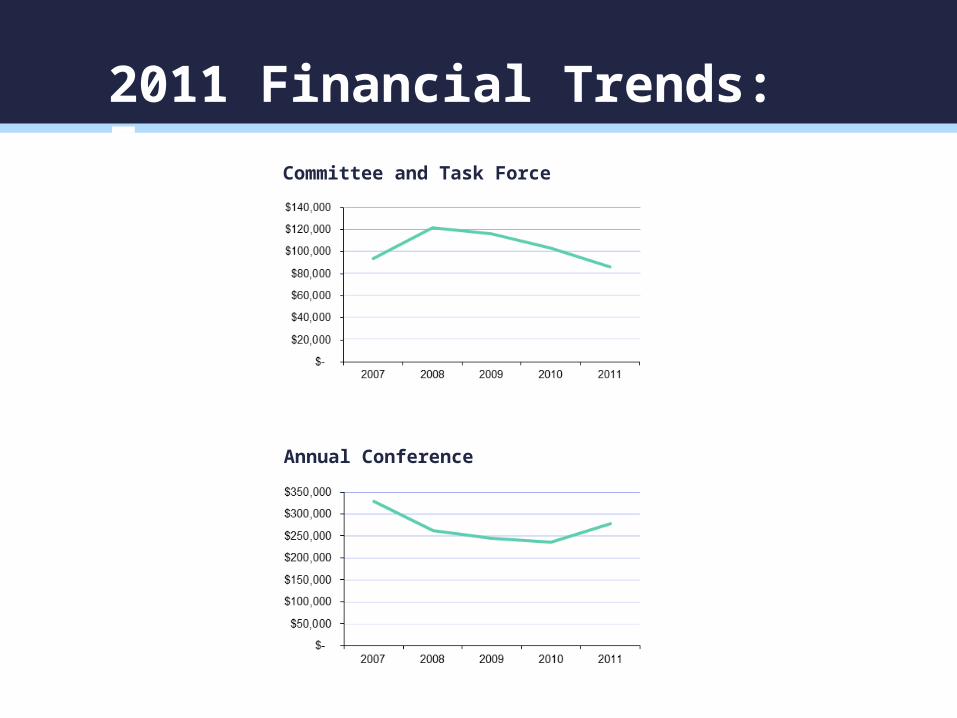
Committee and Task Force
2011 Financial Trends: Expenses
Annual Conference
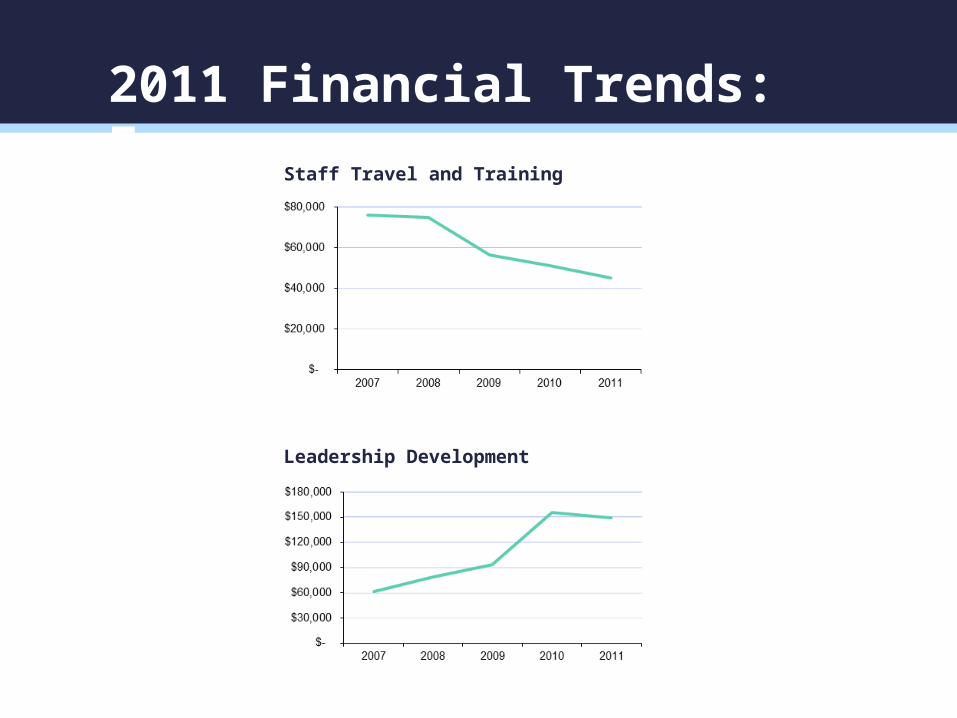
Staff Travel and Training
2011 Financial Trends: Expenses
Leadership Development
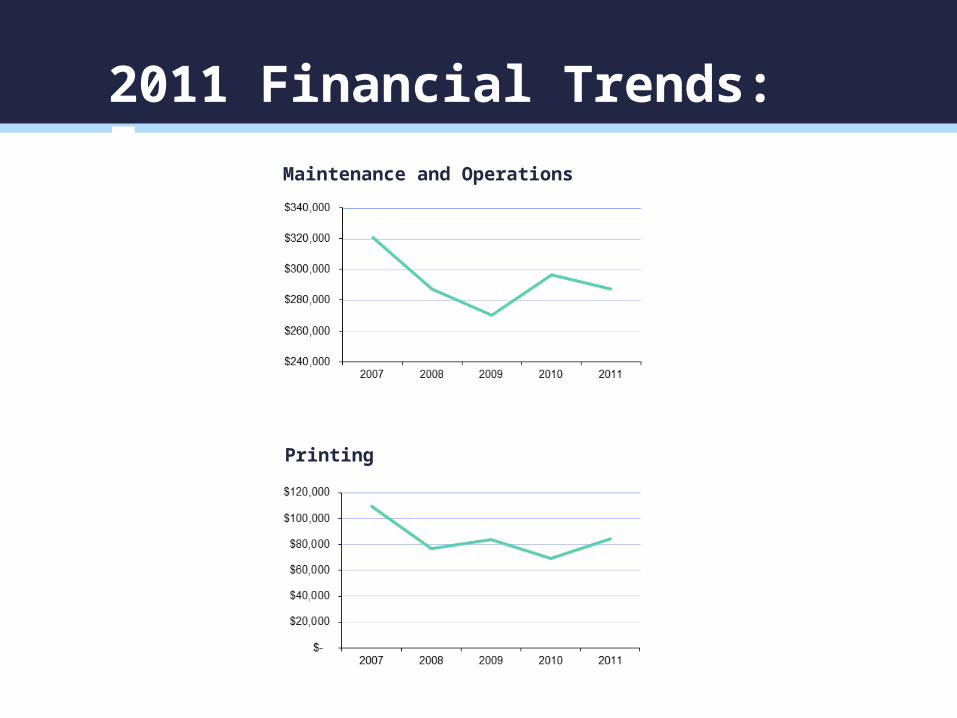
Maintenance and Operations
2011 Financial Trends: Expenses
Printing
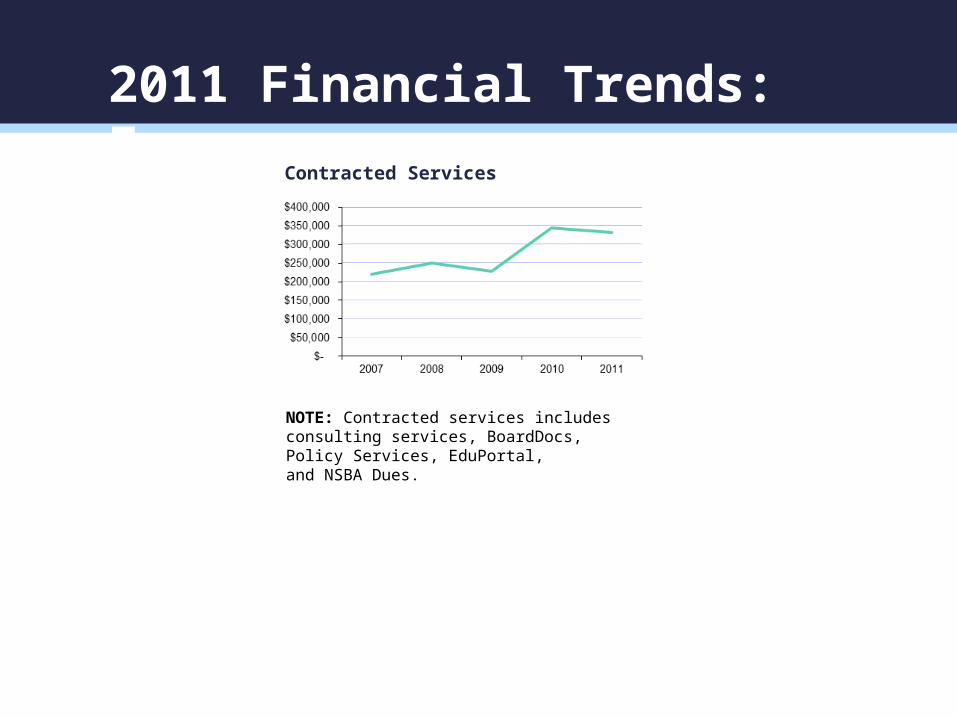
Contracted Services
2011 Financial Trends: Expenses
NOTE: Contracted services includes consulting services, BoardDocs, Policy Services, EduPortal, and NSBA Dues.
WSSDA is the premier provider of accessible and relevant professional development to build school directors’ leadership skills.
Goal 2: Leadership Development
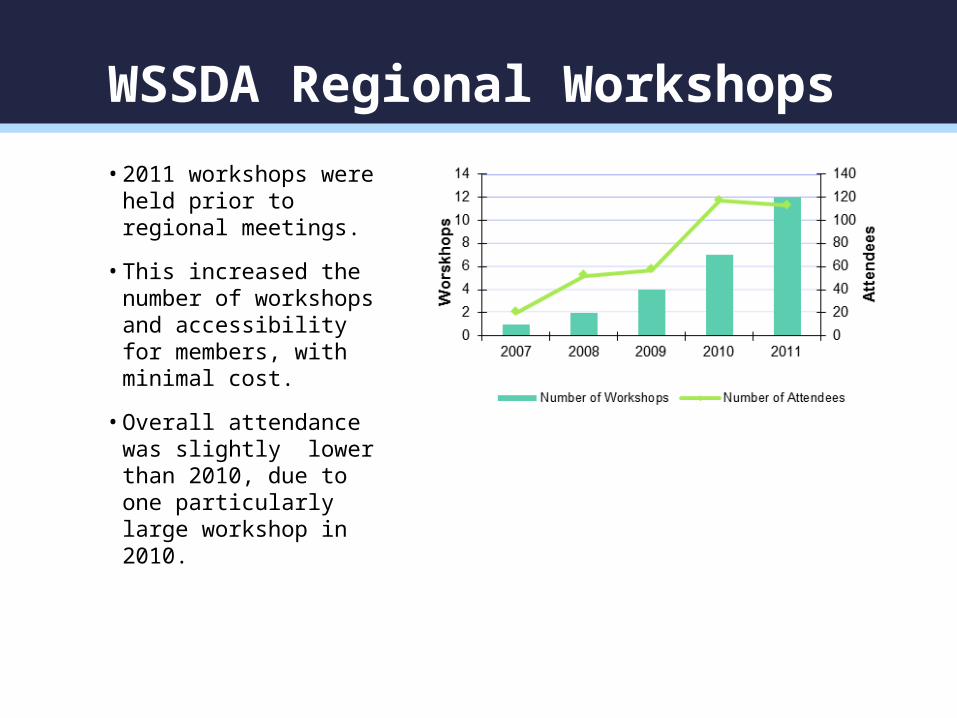
WSSDA Regional Workshops
• 2011 workshops were held prior to regional meetings.
• This increased the number of workshops and accessibility for members, with minimal cost.
• Overall attendance was slightly lower than 2010, due to one particularly large workshop in 2010.
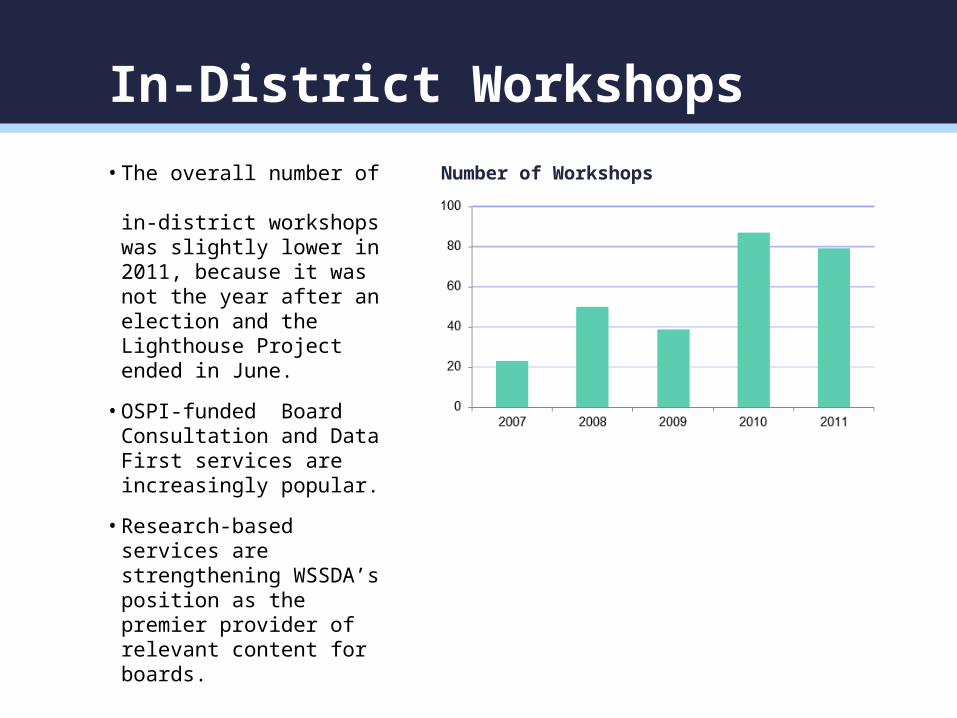
• The overall number of in-district workshops was slightly lower in 2011, because it was not the year after an election and the Lighthouse Project ended in June.
• OSPI-funded Board Consultation and Data First services are increasingly popular.
• Research-based services are strengthening WSSDA’s position as the premier provider of relevant content for boards.
In-District Workshops
Number of Workshops
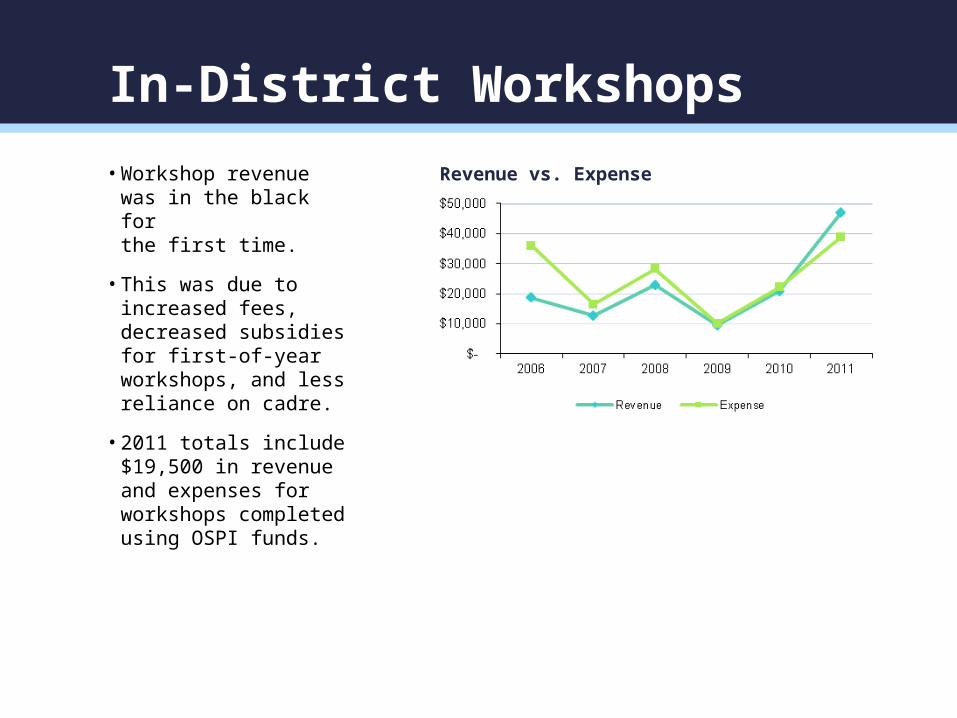
• Workshop revenue was in the black for the first time.
• This was due to increased fees, decreased subsidies for first-of-year workshops, and less reliance on cadre.
• 2011 totals include $19,500 in revenue and expenses for workshops completed using OSPI funds.
Revenue vs. Expense
In-District Workshops
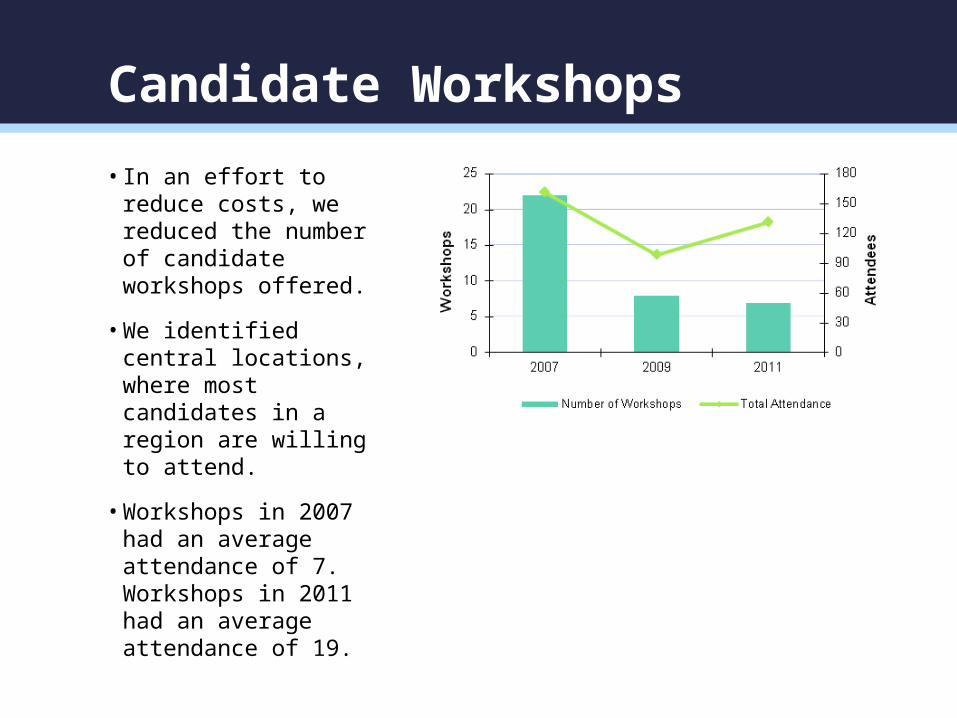
• In an effort to reduce costs, we reduced the number of candidate workshops offered.
• We identified central locations, where most candidates in a region are willing to attend.
• Workshops in 2007 had an average attendance of 7. Workshops in 2011 had an average attendance of 19.
Candidate Workshops
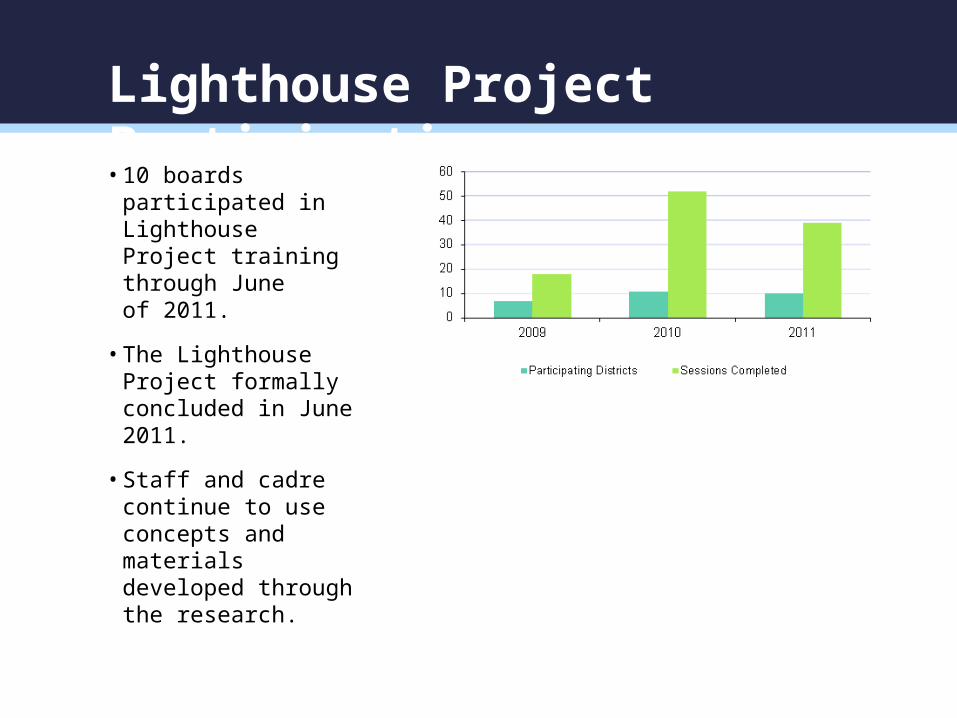
• 10 boards participated in Lighthouse Project training through June of 2011.
• The Lighthouse Project formally concluded in June 2011.
• Staff and cadre continue to use concepts and materials developed through the research.
Lighthouse Project Participation
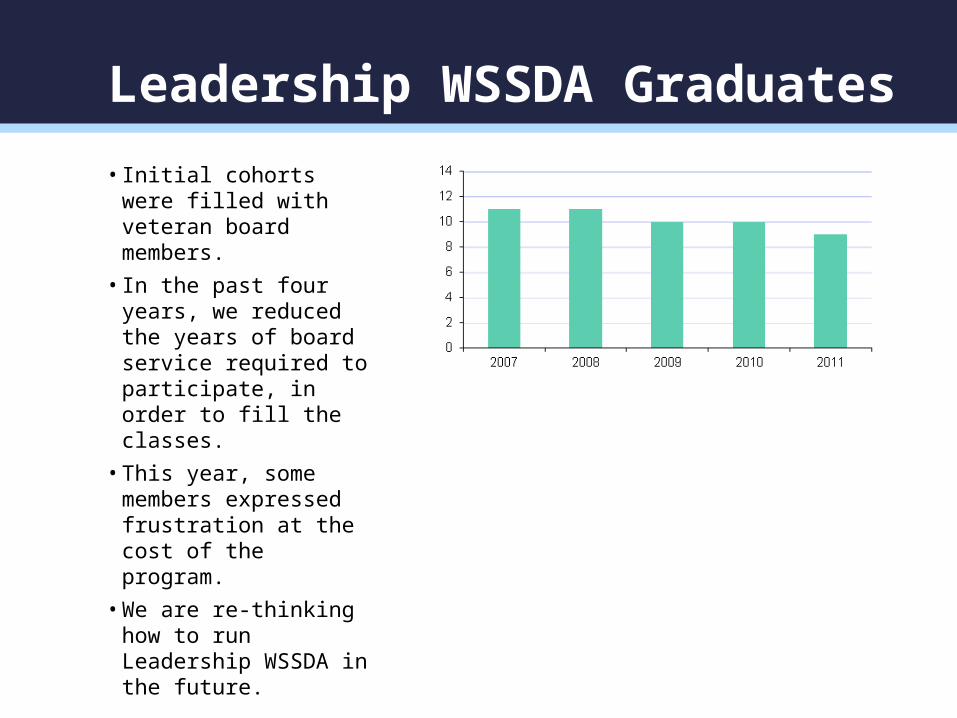
• Initial cohorts were filled with veteran board members.
• In the past four years, we reduced the years of board service required to participate, in order to fill the classes.
• This year, some members expressed frustration at the cost of the program.
• We are re-thinking how to run Leadership WSSDA in the future.
Leadership WSSDA Graduates
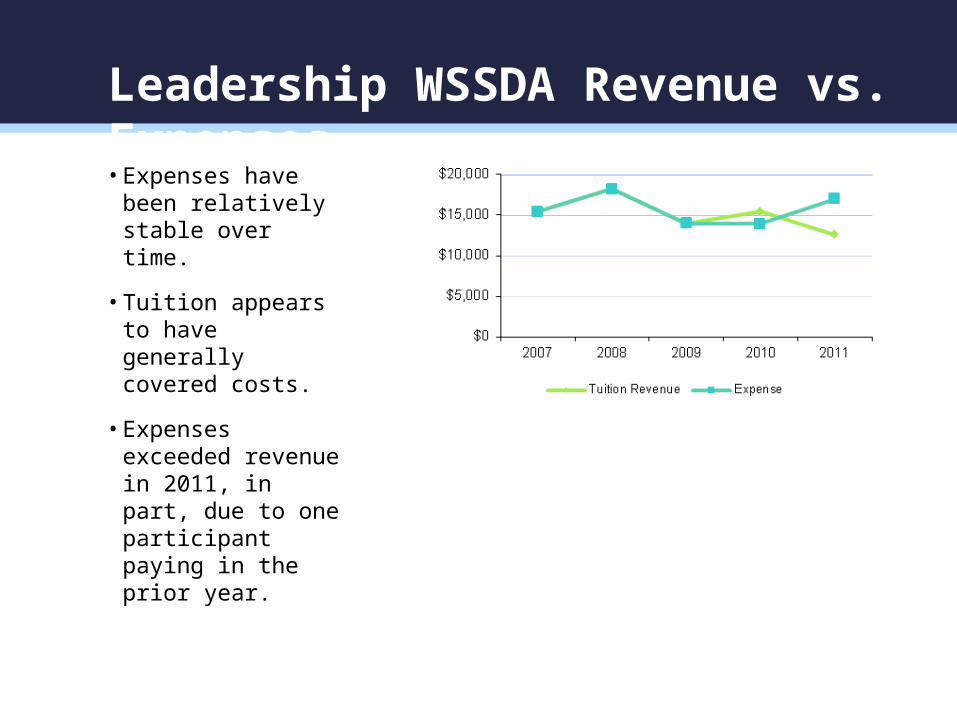
• Expenses have been relatively stable over time.
• Tuition appears to have generally covered costs.
• Expenses exceeded revenue in 2011, in part, due to one participant paying in the prior year.
Leadership WSSDA Revenue vs. Expenses
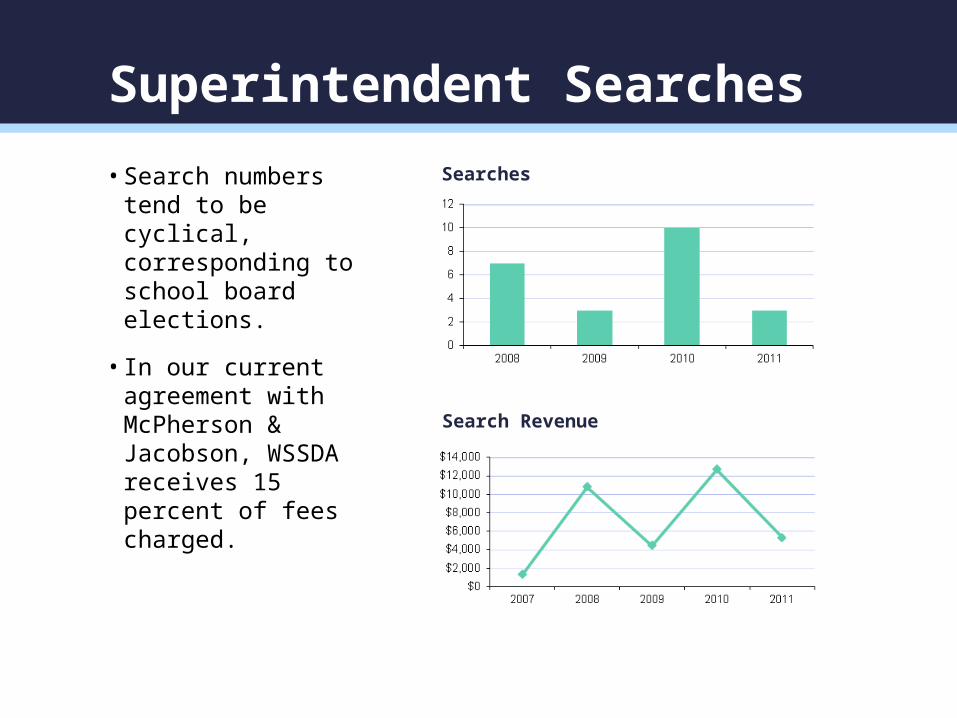
• Search numbers tend to be cyclical, corresponding to school board elections.
• In our current agreement with McPherson & Jacobson, WSSDA receives 15 percent of fees charged.
Searches
Search Revenue
Superintendent Searches
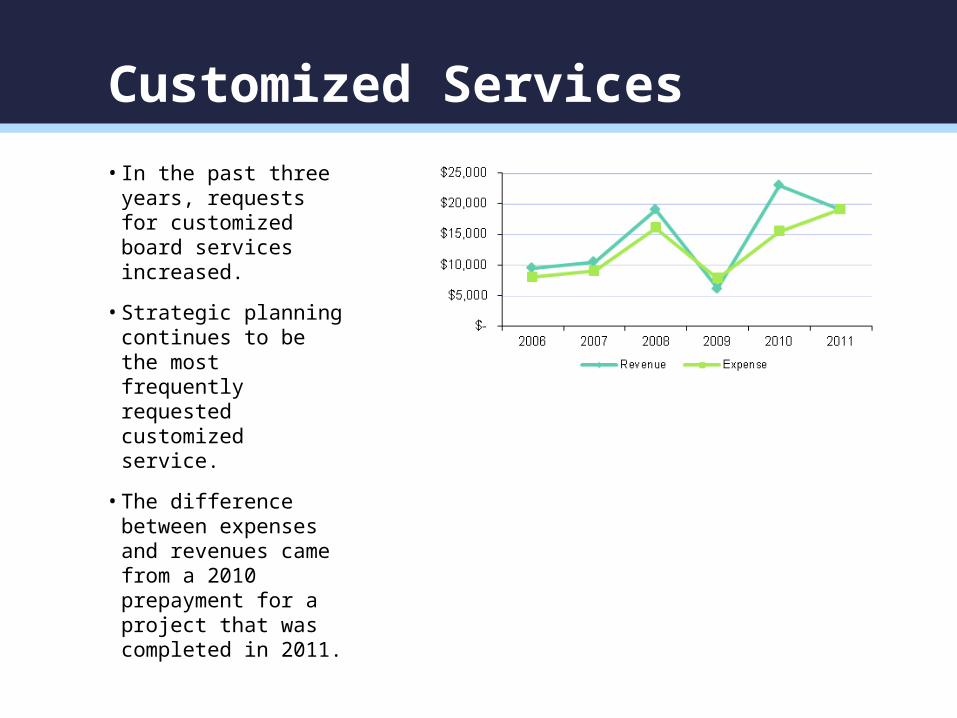
• In the past three years, requests for customized board services increased.
• Strategic planning continues to be the most frequently requested customized service.
• The difference between expenses and revenues came from a 2010 prepayment for a project that was completed in 2011.
Customized Services
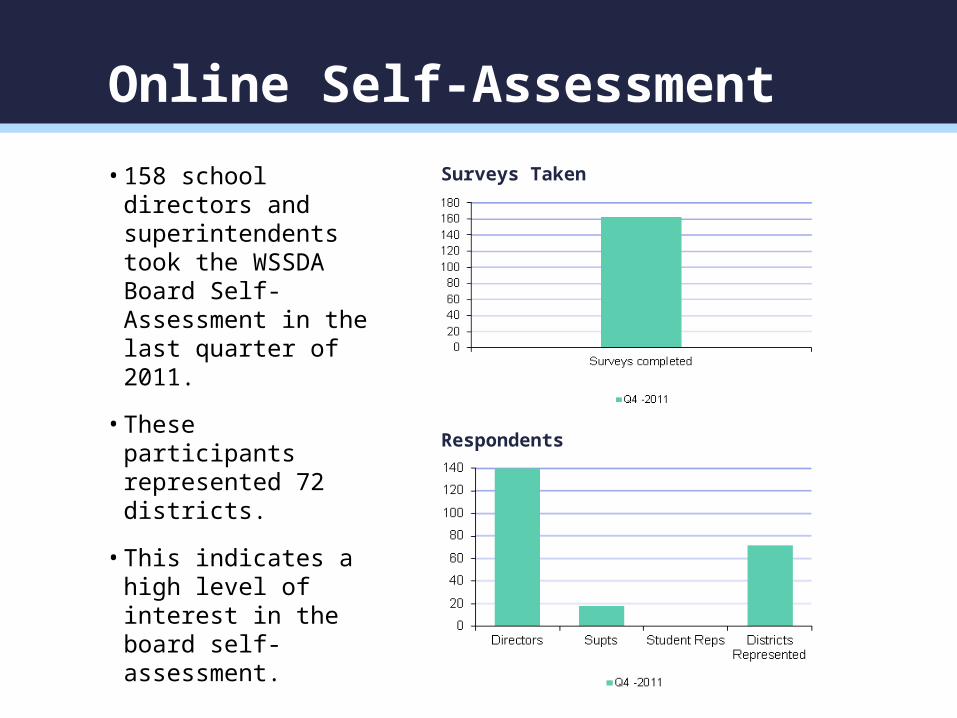
• 158 school directors and superintendents took the WSSDA Board Self-Assessment in the last quarter of 2011.
• These participants represented 72 districts.
• This indicates a high level of interest in the board self-assessment.
Surveys Taken
Respondents
Online Self-Assessment
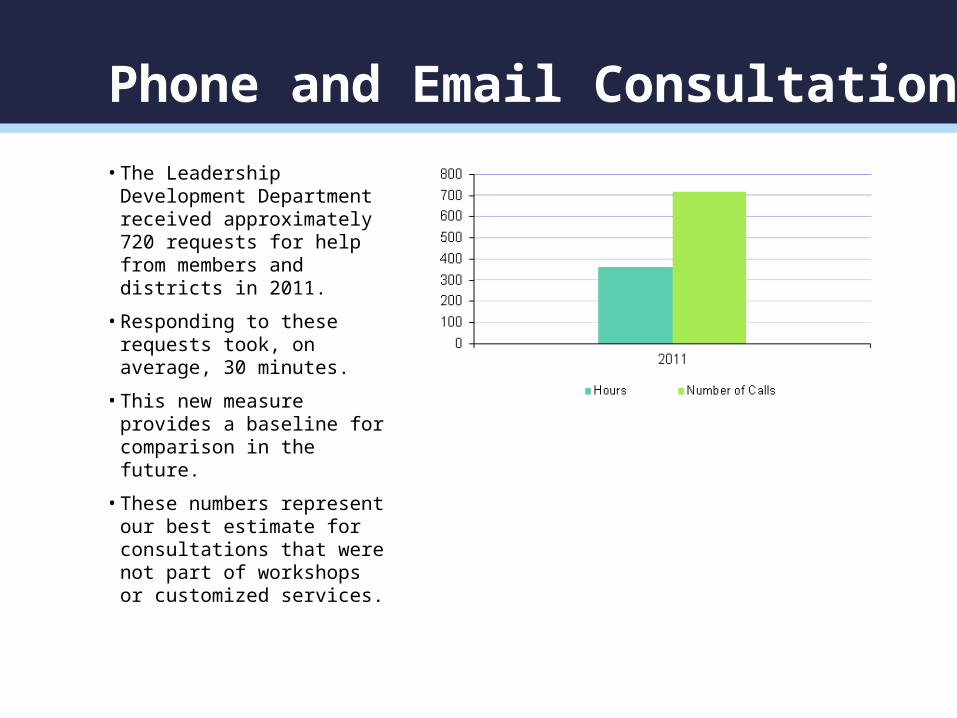
• The Leadership Development Department received approximately 720 requests for help from members and districts in 2011.
• Responding to these requests took, on average, 30 minutes.
• This new measure provides a baseline for comparison in the future.
• These numbers represent our best estimate for consultations that were not part of workshops or customized services.
Phone and Email Consultation
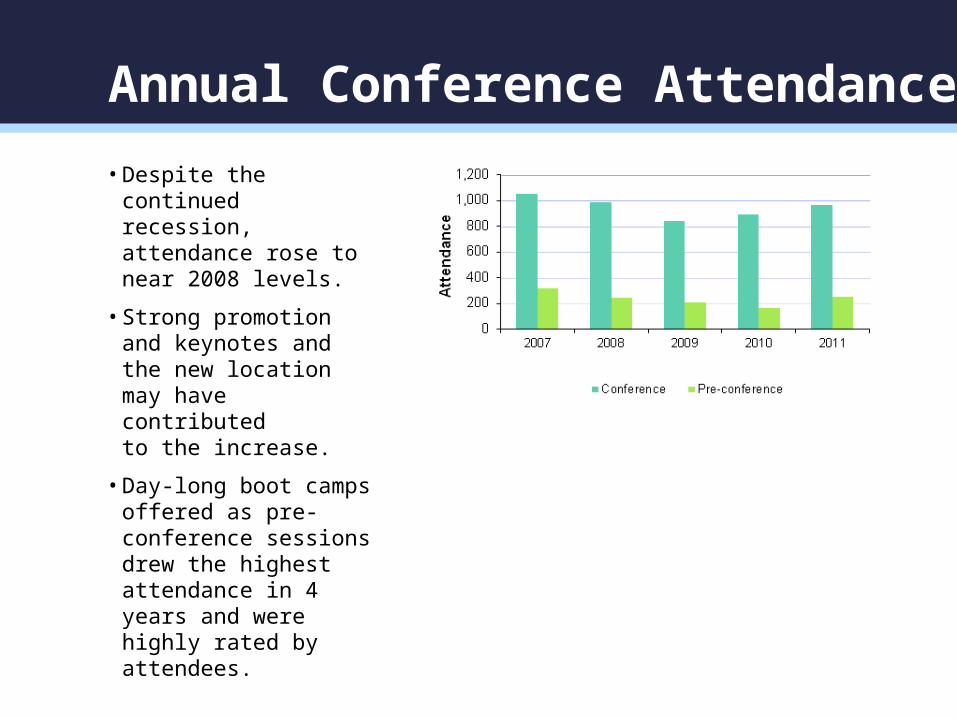
• Despite the continued recession, attendance rose to near 2008 levels.
• Strong promotion and keynotes and the new location may have contributed to the increase.
• Day-long boot camps offered as pre-conference sessions drew the highest attendance in 4 years and were highly rated by attendees.
Annual Conference Attendance
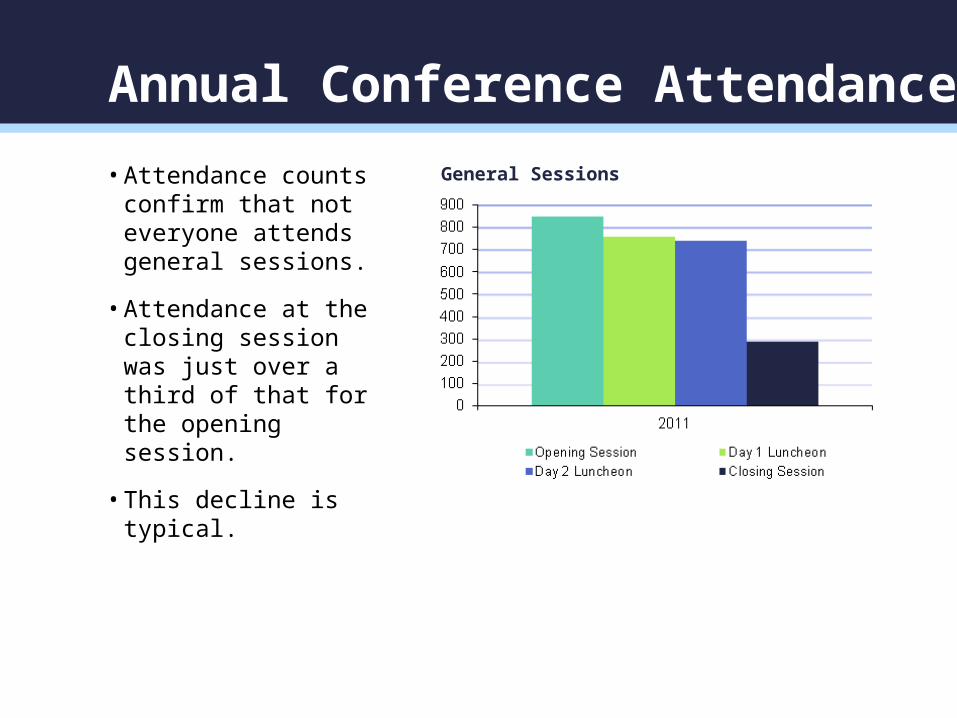
• Attendance counts confirm that not everyone attends general sessions.
• Attendance at the closing session was just over a third of that for the opening session.
• This decline is typical.
General Sessions
Annual Conference Attendance
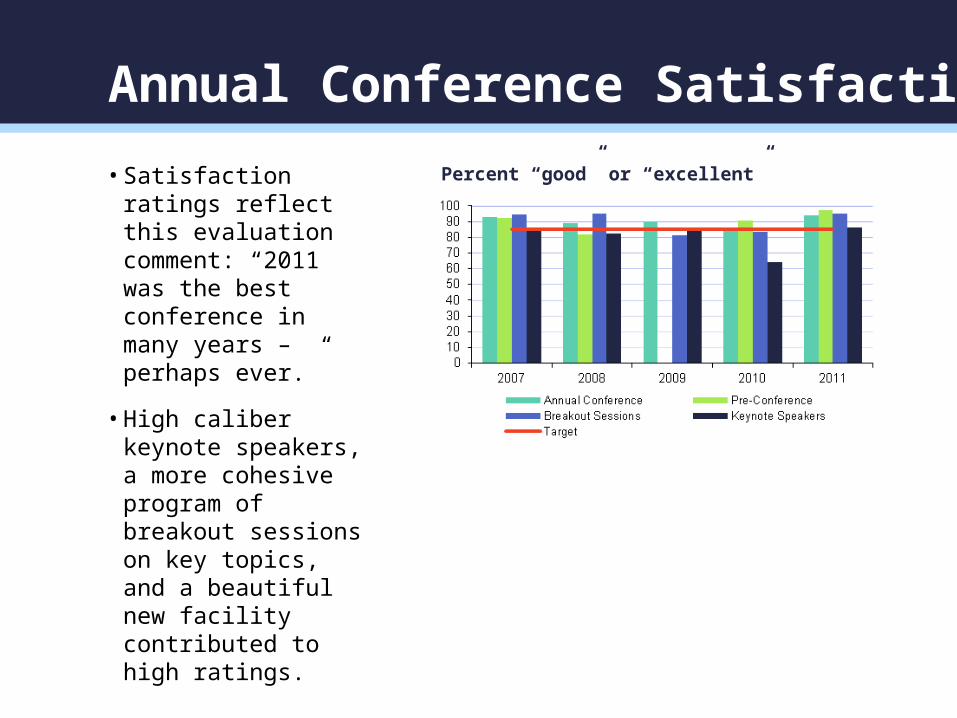
• Satisfaction ratings reflect this evaluation comment: “2011 was the best conference in many years – perhaps ever.”
• High caliber keynote speakers, a more cohesive program of breakout sessions on key topics, and a beautiful new facility contributed to high ratings.
Percent “good” or “excellent”
Annual Conference Satisfaction
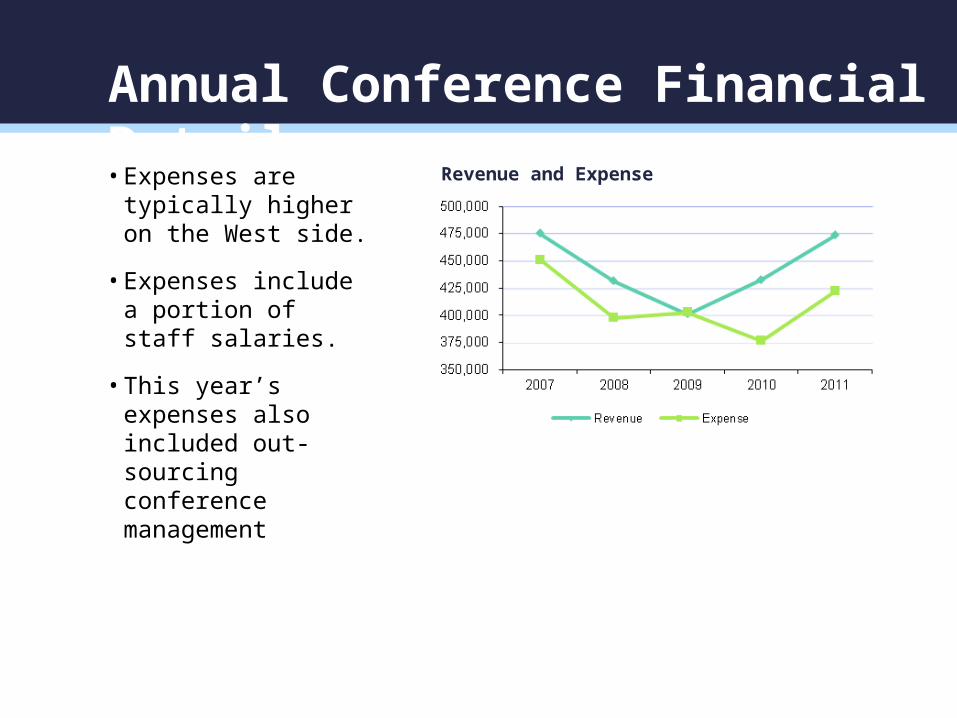
• Expenses are typically higher on the West side.
• Expenses include a portion of staff salaries.
• This year’s expenses also included out-sourcing conference management
Revenue and Expense
Annual Conference Financial Details
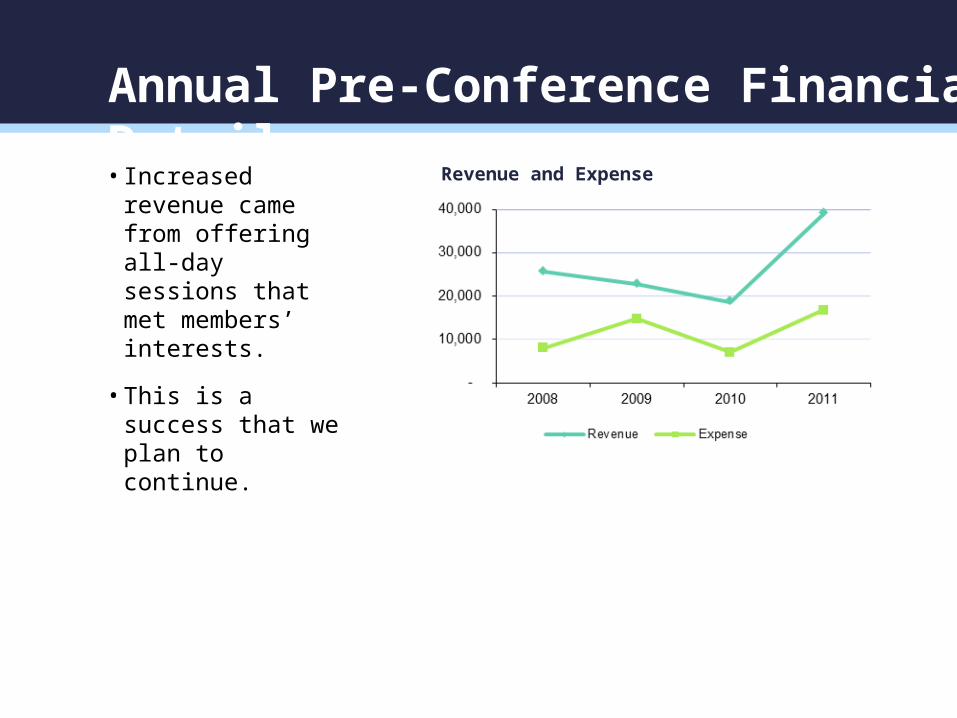
• Increased revenue came from offering all-day sessions that met members’ interests.
• This is a success that we plan to continue.
Revenue and Expense
Annual Pre-Conference Financial Details
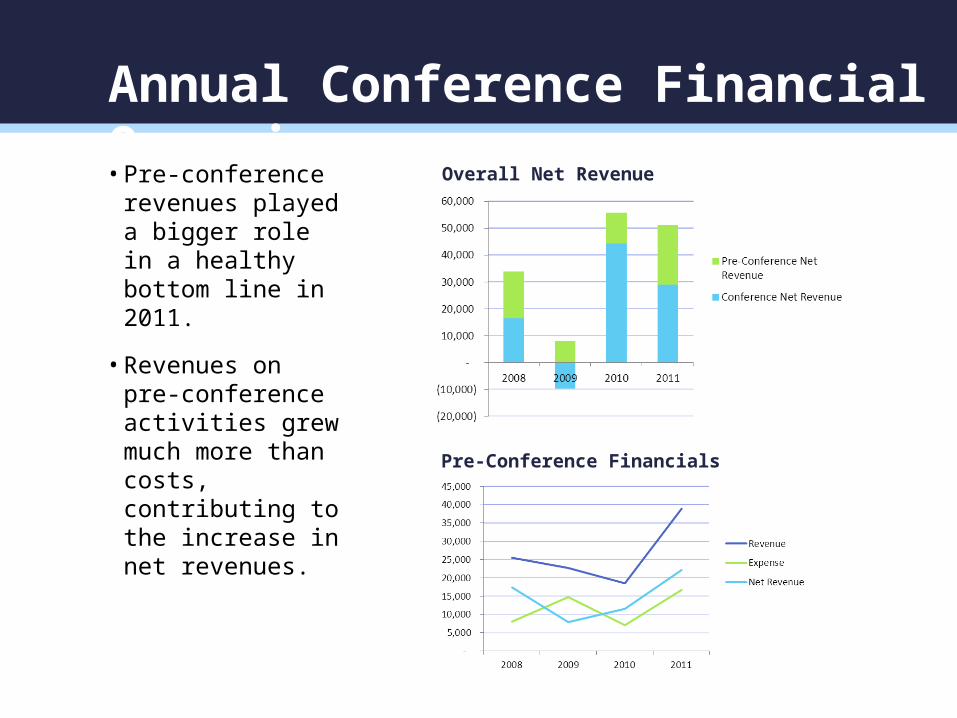
• Pre-conference revenues played a bigger role in a healthy bottom line in 2011.
• Revenues on pre-conference activities grew much more than costs, contributing to the increase in net revenues.
Overall Net Revenue
Pre-Conference Financials
Annual Conference Financial Overview
Goal 3: AdvocacyWSSDA and its members exert a positive influence on public education policy. Serving as a unified voice for local school directors, WSSDA fosters effective relationships with other policy makers and organizations to help advance an agenda that supports our legislative proposals and priorities.
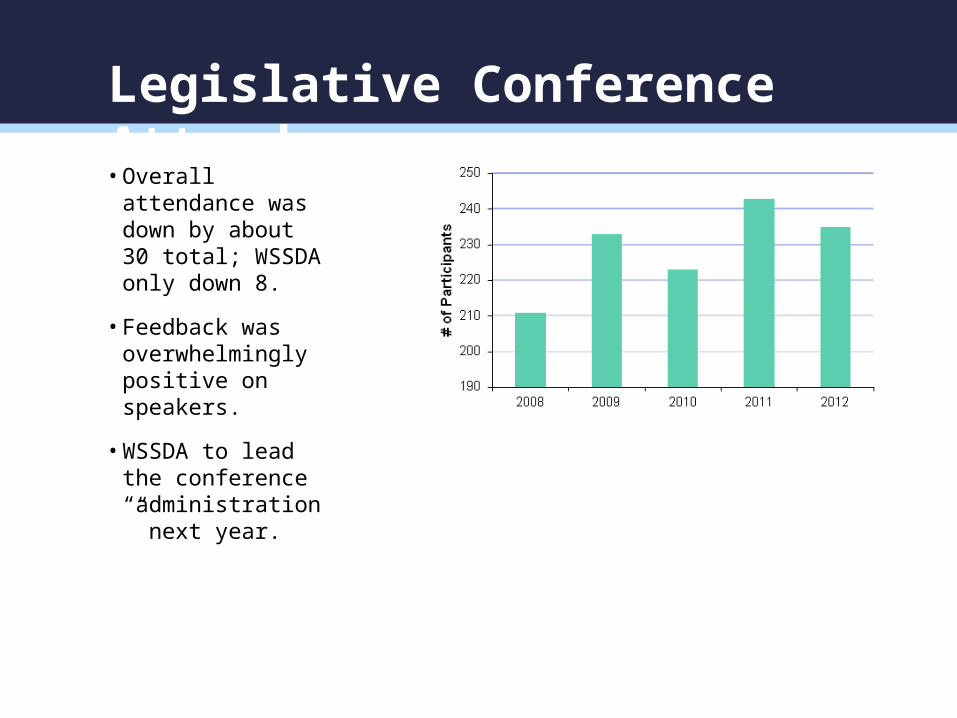
• Overall attendance was down by about 30 total; WSSDA only down 8.
• Feedback was overwhelmingly positive on speakers.
• WSSDA to lead the conference “administration” next year.
Legislative Conference Attendance
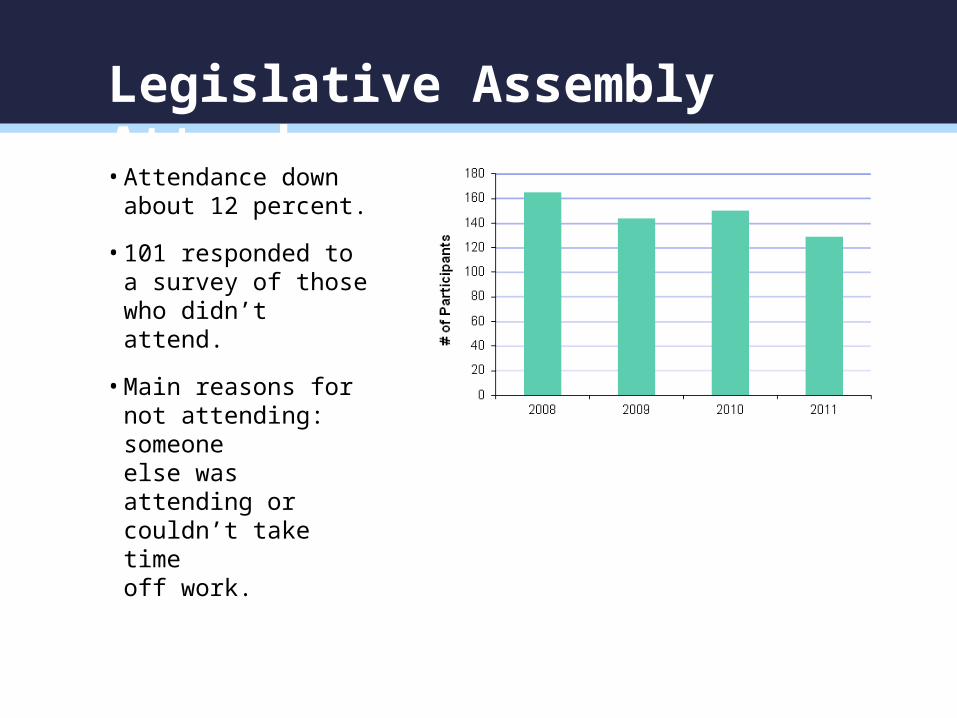
• Attendance down about 12 percent.
• 101 responded to a survey of those who didn’t attend.
• Main reasons for not attending: someone else was attending or couldn’t take time off work.
Legislative Assembly Attendance
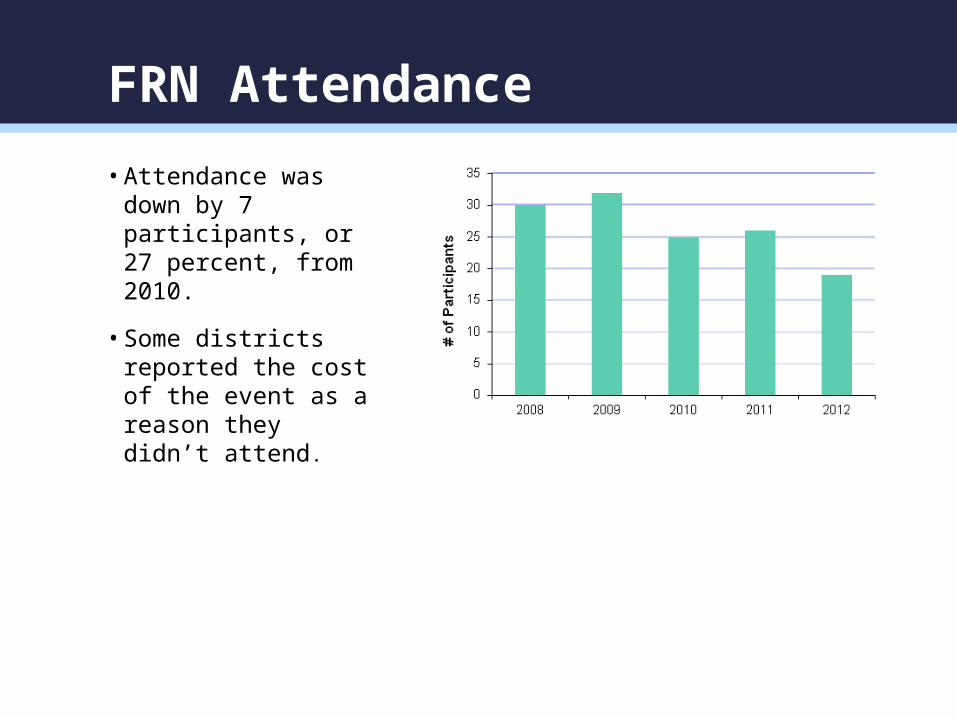
• Attendance was down by 7 participants, or 27 percent, from 2010.
• Some districts reported the cost of the event as a reason they didn’t attend.
FRN Attendance
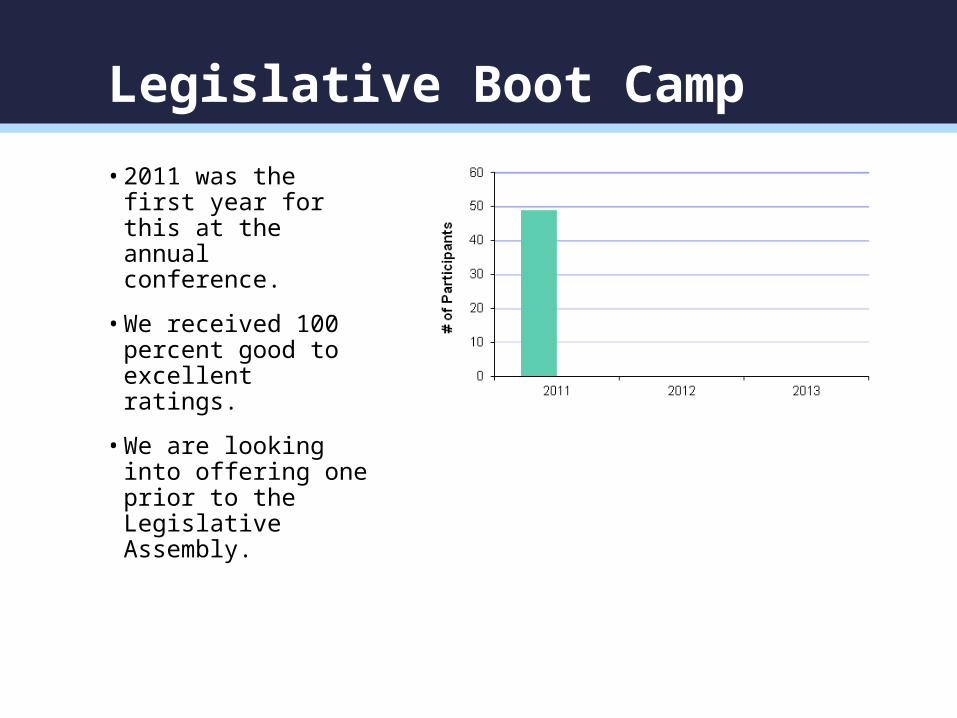
• 2011 was the first year for this at the annual conference.
• We received 100 percent good to excellent ratings.
• We are looking into offering one prior to the Legislative Assembly.
Legislative Boot Camp
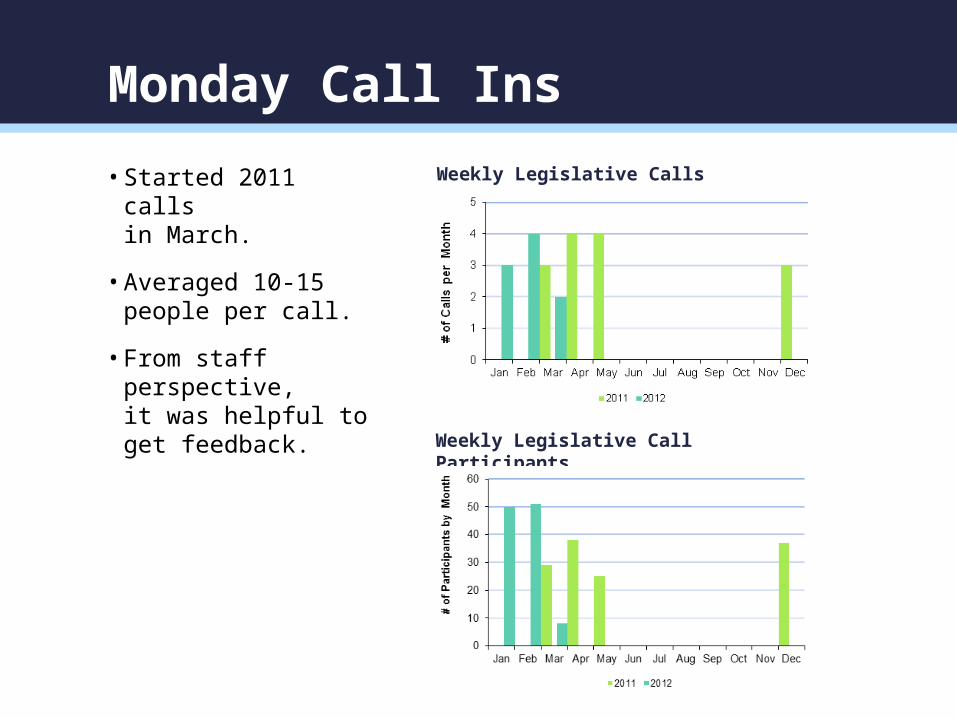
• Started 2011 calls in March.
• Averaged 10-15 people per call.
• From staff perspective, it was helpful to get feedback.
Weekly Legislative Calls
Weekly Legislative Call Participants
Monday Call Ins
Goal 4: GovernanceWSSDA is the foremost source to assist school boards in the ethical performance of their governance responsibility to support student learning in a safe, secure and respectful learning environment.
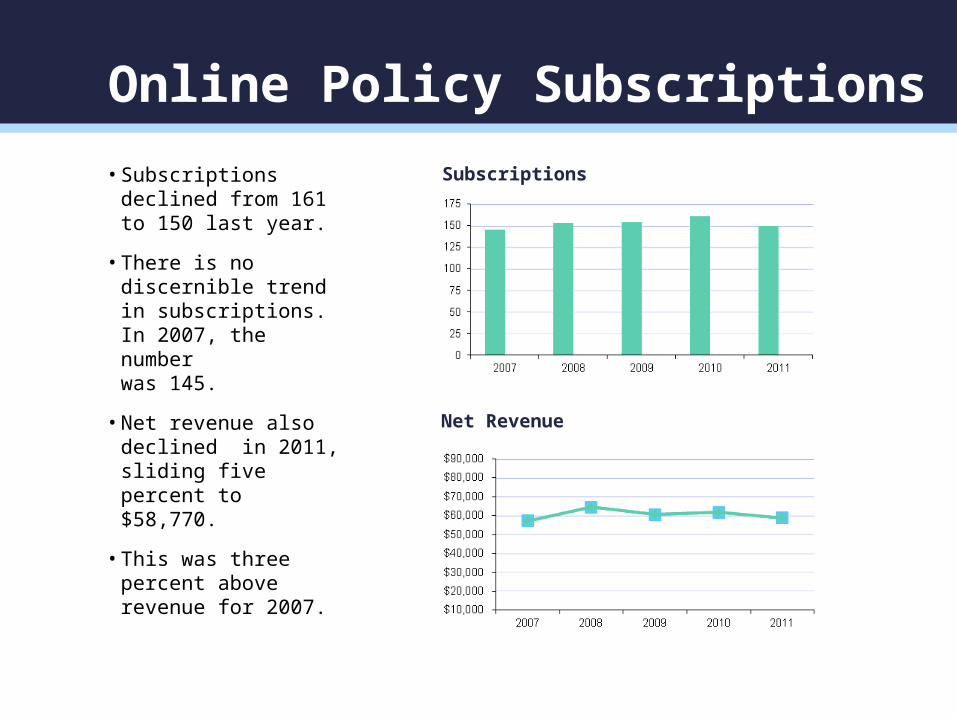
• Subscriptions declined from 161 to 150 last year.
• There is no discernible trend in subscriptions. In 2007, the number was 145.
• Net revenue also declined in 2011, sliding five percent to $58,770.
• This was three percent above revenue for 2007.
Subscriptions
Net Revenue
Online Policy Subscriptions
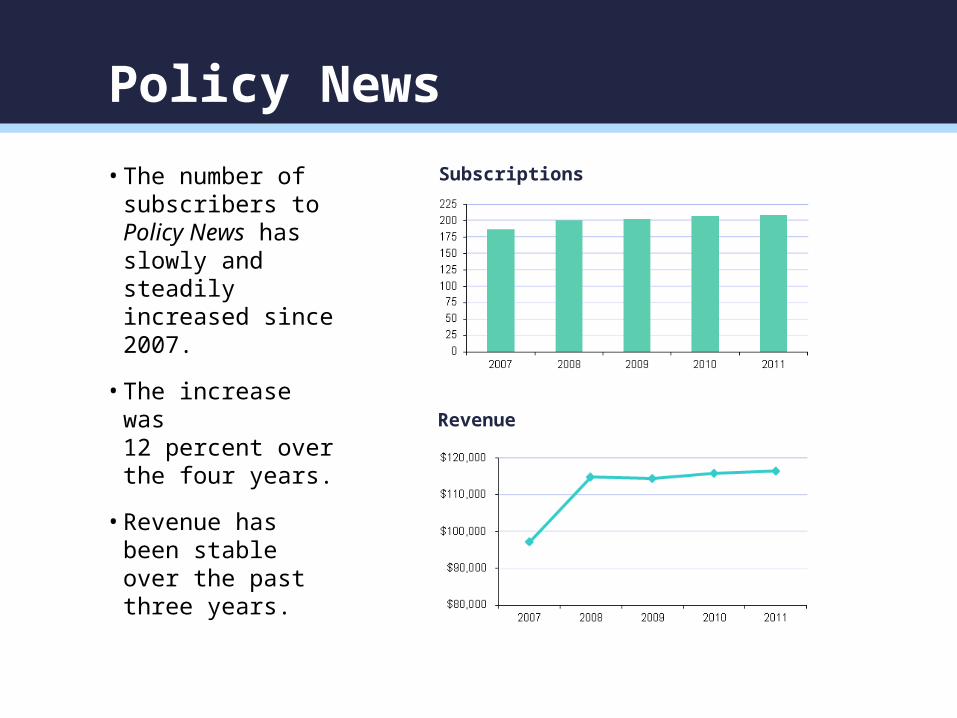
• The number of subscribers to Policy News has slowly and steadily increased since 2007.
• The increase was 12 percent over the four years.
• Revenue has been stable over the past three years.
Subscriptions
Revenue
Policy News
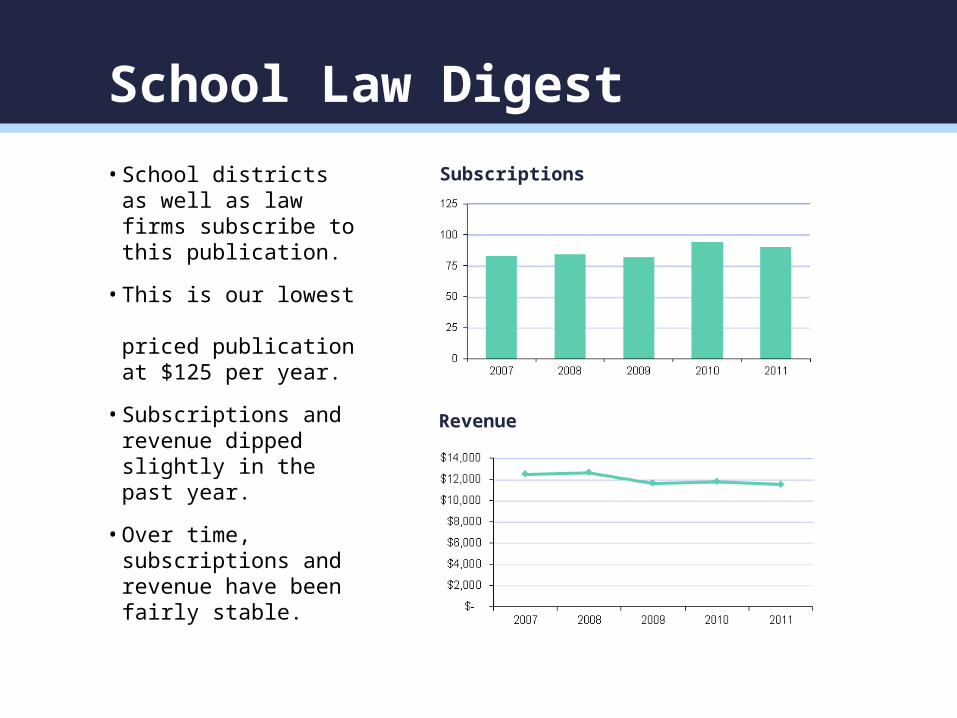
• School districts as well as law firms subscribe to this publication.
• This is our lowest priced publication at $125 per year.
• Subscriptions and revenue dipped slightly in the past year.
• Over time, subscriptions and revenue have been fairly stable.
Subscriptions
Revenue
School Law Digest
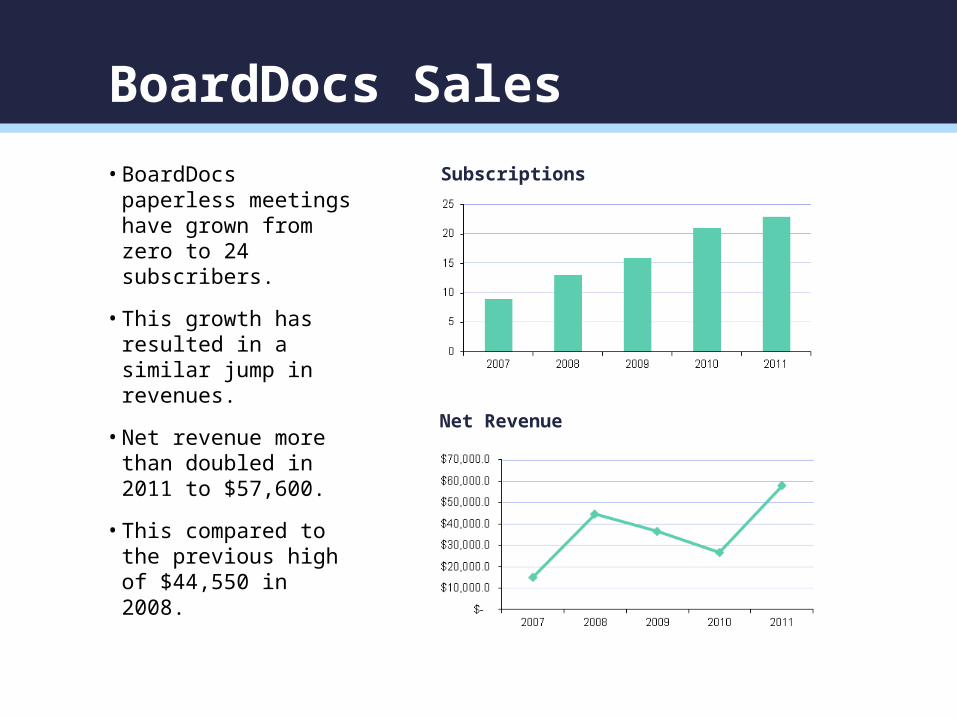
• BoardDocs paperless meetings have grown from zero to 24 subscribers.
• This growth has resulted in a similar jump in revenues.
• Net revenue more than doubled in 2011 to $57,600.
• This compared to the previous high of $44,550 in 2008.
Subscriptions
Net Revenue
BoardDocs Sales
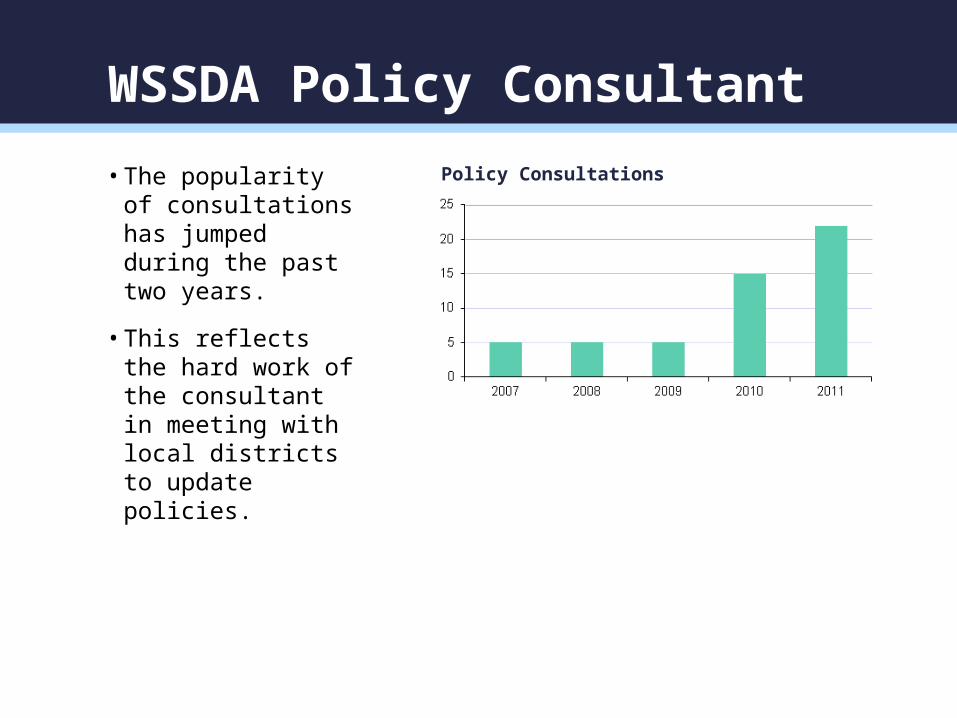
• The popularity of consultations has jumped during the past two years.
• This reflects the hard work of the consultant in meeting with local districts to update policies.
Policy Consultations
WSSDA Policy Consultant
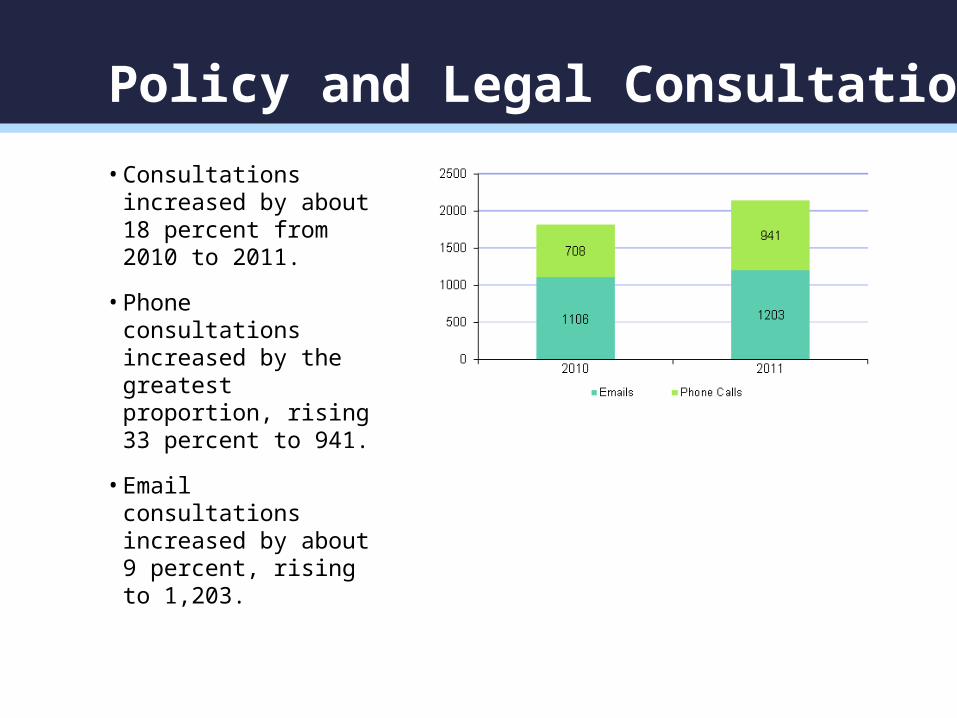
• Consultations increased by about 18 percent from 2010 to 2011.
• Phone consultations increased by the greatest proportion, rising 33 percent to 941.
• Email consultations increased by about 9 percent, rising to 1,203.
Policy and Legal Consultations
Goal 5: CommunicationsSchool directors rely on WSSDA as a recognized provider of relevant, concise, timely information on education issues and association activities, and as a voice for greater awareness of the importance of local school district governance.
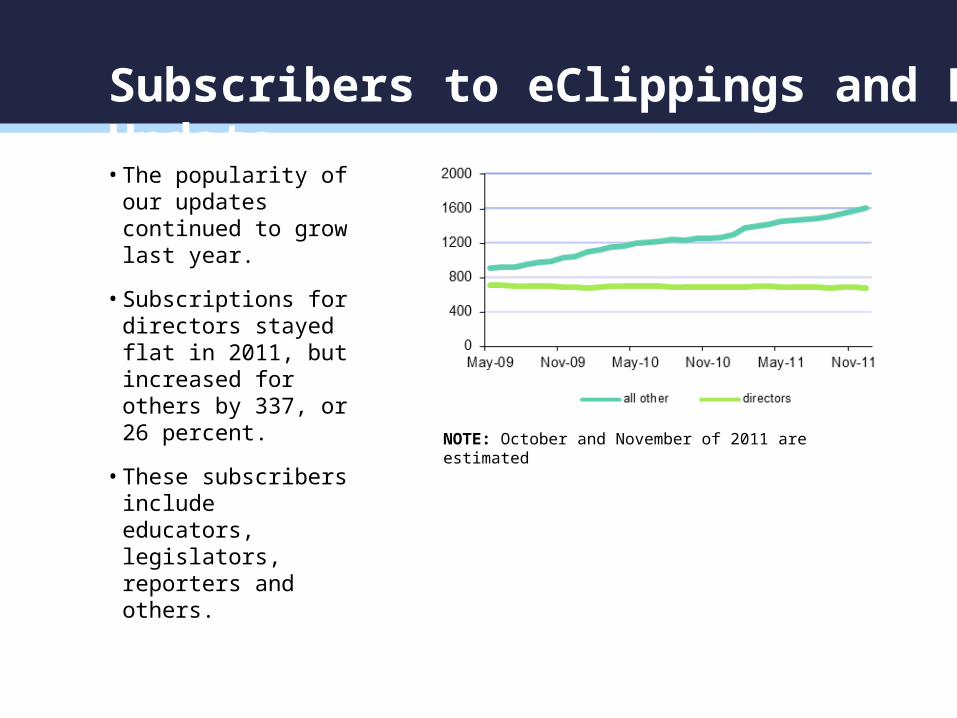
• The popularity of our updates continued to grow last year.
• Subscriptions for directors stayed flat in 2011, but increased for others by 337, or 26 percent.
• These subscribers include educators, legislators, reporters and others.
NOTE: October and November of 2011 are estimated
Subscribers to eClippings and Leg Update
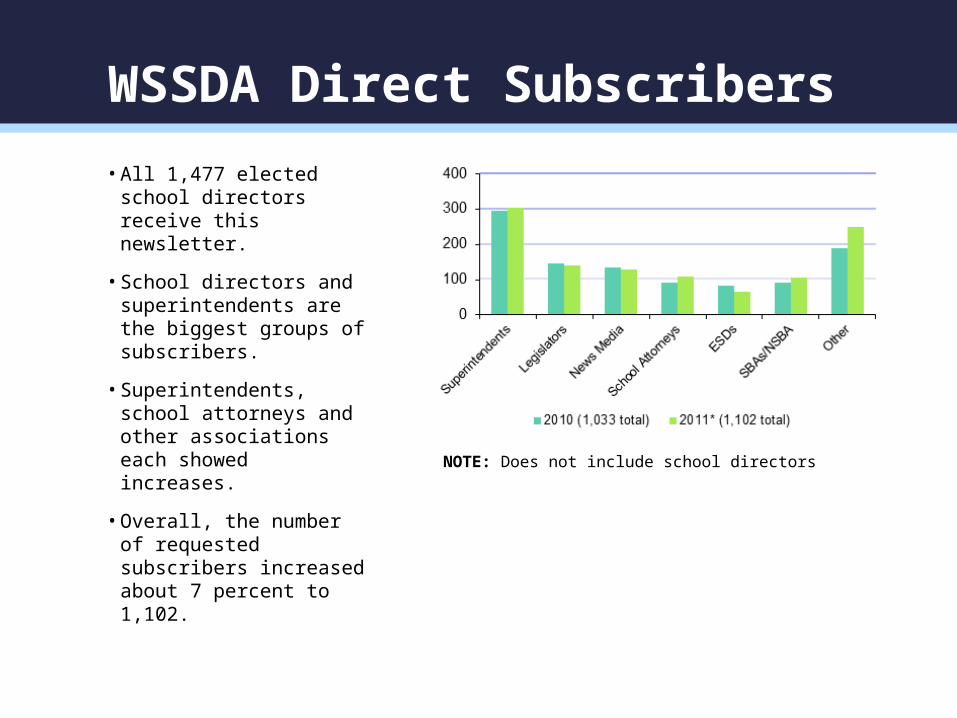
• All 1,477 elected school directors receive this newsletter.
• School directors and superintendents are the biggest groups of subscribers.
• Superintendents, school attorneys and other associations each showed increases.
• Overall, the number of requested subscribers increased about 7 percent to 1,102.
NOTE: Does not include school directors
WSSDA Direct Subscribers
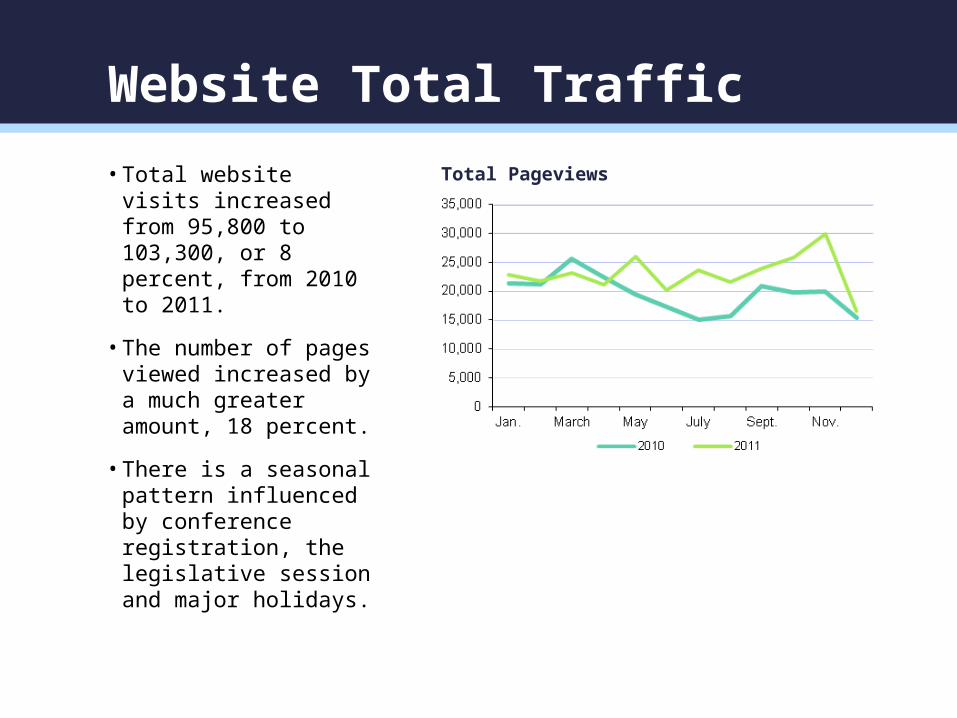
• Total website visits increased from 95,800 to 103,300, or 8 percent, from 2010 to 2011.
• The number of pages viewed increased by a much greater amount, 18 percent.
• There is a seasonal pattern influenced by conference registration, the legislative session and major holidays.
Total Pageviews
Website Total Traffic
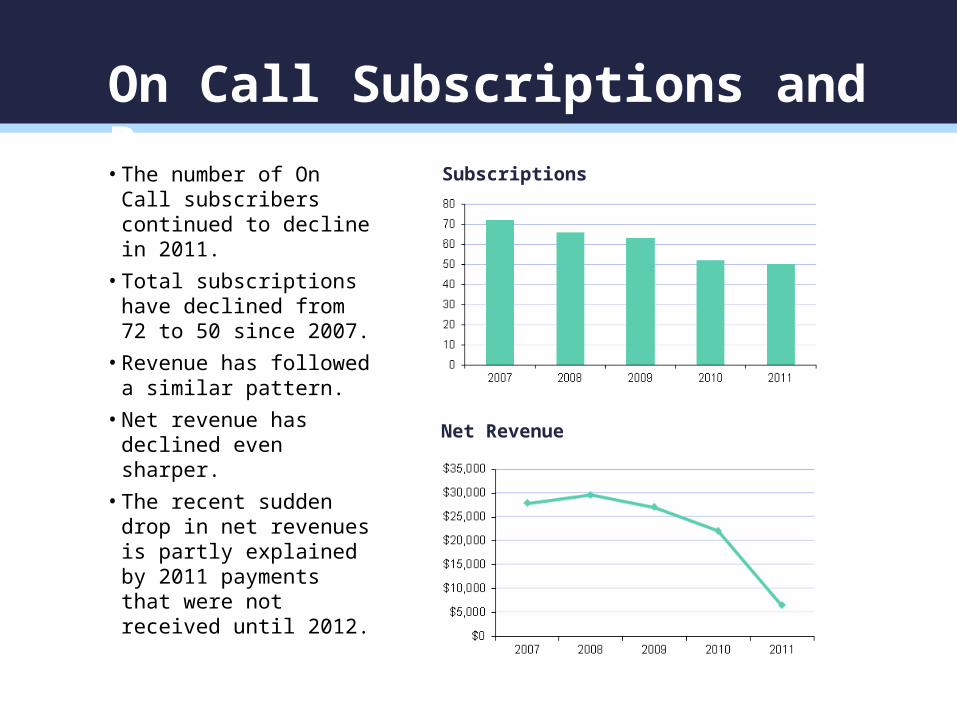
• The number of On Call subscribers continued to decline in 2011.
• Total subscriptions have declined from 72 to 50 since 2007.
• Revenue has followed a similar pattern.
• Net revenue has declined even sharper.
• The recent sudden drop in net revenues is partly explained by 2011 payments that were not received until 2012.
Subscriptions
Net Revenue
On Call Subscriptions and Revenue