Embed Size (px)
Citation preview

Das Human-Kapital:
A Theory of the Demise of the Class Structure ∗
Oded Galor and Omer Moav†
August 22, 2005
Abstract
This paper suggests that the demise of the capitalists-workers class structure was a socio-economic transformation orchestrated by the capitalists in reaction to the increasing importanceof the human capital of workers in sustaining their profit rates. Physical capital accumulationin the early stages of industrialization enhanced the importance of human capital in productionand generated incentives for capitalists to support the provision of public education for themasses, planting the seeds for the demise of the existing class structure. The theory is supportedby the voting patterns on England’s education reform of 1902.Keywords: Industrial Revolution, Human Capital, Class Structure, Education Reforms
JEL Classification Numbers: B10, O10, O40
∗The authors are grateful for comments from two anonymous referees, the Editor, Fabrizio Zilibotti, Daron Ace-moglu, Josh Angrist, George Akerlof, Jordi Caballe, Edward Glaeser, Claudia Goldin, Herschel Grossman, LarryKatz, Victor Lavy, Joram Mayshar, Joel Mokyr, Daniele Paserman, Jim Robinson, David Weil and seminar partic-ipants at the NBER Summer Institute, the Euroconference on Innovation, Economic Growth, Barcelona, DIGIT,Vienna, 2001, CEPR Conference, Copenhagen, 2001, AEA, 2002, and CEPR Conference, Paris, 2003. Paula Green,Daniel Meija, Ruti Polachek, Tamar Roth, Analia Schlosser, and Dietrich Vollrath provided excellent research assis-tance . The Authors’ research was supported by the ISF. Galor’s research is supported by NSF Grant SES-0004304.
†Galor: Department of Economics, Brown University, Providence RI 02912, USA, and Department of Economics,Hebrew University, Jerusalem 91905, Israel; e-mail Oded [email protected]. Moav: Hebrew University, ShalemCenter, and CEPR; e-mail: [email protected]
0
“The history of society is the history of struggles between social classes”
Karl Marx
1 Introduction
This paper suggests that a significant driving force in the demise of the European capitalists-
workers class structure was a socio-economic transformation orchestrated by the capitalists in
reaction to the increasing importance of the human capital of workers in sustaining their profit
rates. The accumulation of physical capital in the early stages of industrialization enhanced the
importance of human capital in the production process and generated an incentive for the capitalists
to support the provision of public education for the masses, planting the seeds for the demise of
the existing class structure.
Existing theories about the demise of the capitalists-workers class structure focus on the role
of a class struggle in this significant change. According to the Marxist theory, capital accumulation
and the associated decline in profit rates would intensify the degree of exploitation of workers and
would bring about a class struggle between workers and capitalists that would eventually terminate
the existing class society. The recent political economy literature, discussed in the next section, ac-
cepts the basic Marxist premise regarding the significant role of the rising tension between workers
and capitalists in the changes of the class structure. It suggests, however, that social and political
reforms in Western Europe during the 19th century were an outcome of deliberate concessions by
the elite designed to avert political instability, expropriation, and possibly a revolution.
In contrast to this viewpoint, we argue that a significant force in the demise of the class
structure was a by-product of a productive cooperation between capitalists and workers. According
to the theory, in the early stages of industrialization, when physical capital was the prime engine of
economic growth, societies were marked by a stable class structure characterized by a dichotomous
ownership on factors of production. Due to capital-skill complementarity, the accumulation of
physical capital by the capitalists increased the importance of human capital in sustaining the rate
of return to physical capital and brought about a non-altruistic change in the attitude of capitalists
towards the provision of public education for the masses.1 The capitalists found it beneficial to
support universal publicly financed education, enhancing the participation of the working class
in the process of human and physical capital accumulation, leading to a widening of the middle
class and to the eventual demise of the capitalists-workers class structure.2 Thus, we argue that
1Since firms have limited incentive to invest in the general human capital of their workers, in the presence ofcredit market imperfections, the level of education would be suboptimal unless it would be financed publicly.
2Indeed, the second phase of the Industrial Revolution was associated with a widening middle class of white-collarworkers, skilled artisans, and independent entrepreneurs (Cameron (1989, p. 213)). Moreover, the development ofthe middle class was encouraged by industrialists who demanded not only a more educated labor force but an
1
Karl Marx’s highly influential prediction about the inevitable class struggle due to declining profit
rates stemmed from an under-appreciation of the role that human capital eventually played in the
production process.
The theory is based on three central elements. First, the production process is characterized
by capital-skill complementarity.3 Capitalists therefore benefit from the aggregate accumulation
of human capital in society. Second, human capital is inherently embodied in individuals and its
accumulation is characterized by decreasing marginal returns at the individual level. The aggregate
stock of human capital, is therefore, larger if its accumulation is widely spread among individuals in
society. Capitalists therefore gain from a universal provision of education. Third, in the absence of
public education, investment in human capital is suboptimal due to borrowing constraints. Public
education therefore enhances investment in human capital by the masses, and may therefore benefit
the capitalists as well as the workers.4
The theory suggests that the utilitarian support of capitalists for the provision of universal
public education was instrumental for the rapid formation of human capital and was therefore
a catalyst, and possibly even a necessary condition, for the demise of the class society. The
support for public education is unanimous among workers and capitalists who carry its prime
financial burden.5 That is, due to the coexistence of credit market imperfections and capital-skill
complementarity, the redistribution associated with public education is Pareto improving.6
The willingness of the capitalists to support universal public education rather than selective
industrial education captures two of the underlying forces in the complementarity between human
capital and physical capital. First, it appears that in the second phase of the Industrial Revolution
the increase in basic literacy that was associated with universal primary education raised labor
productivity. Second, investment in universal primary education generated a wider talent pool for
intermediate class of people who could serve in managerial and marketing positions (Anderson (1975, p.193)).3See Goldin and Katz (1998) for evidence regarding capital-skill complementarity.4See Galor and Zeira (1993), Benabou (1996), Durlauf (1996), and Galor and Moav (2004) for the effect of credit
market imperfections on investment in human capital and economic growth in an unequal society. In particular,Galor and Moav (2004) offer a unified account for the effect of income inequality on the process of development.They argue that the replacement of physical capital accumulation by human capital accumulation as a prime engineof economic growth changed the qualitative impact of inequality on the process of development. In the absence of aneffective cooperation in the provision of public schooling, equality alleviates the adverse effect of credit constraintsand promotes human capital accumulation and economic growth.
5The distribution of the cost of education between workers and capitalists may differ across countries due todifferences in their socio-political structure as well as their stage of development. Nevertheless, regardless of thedistribution of political power in society, in light of the importance of nourishment and health for human capitalformation and labor supply, capitalists are unlikely to impose the prime financial burden on the working class aslong as wages do not significantly exceed the subsistence level of consumption.
6This result is related to Benabou (2000), who demonstrates that when capital and insurance markets are imper-fect, policies which redistribute wealth from richer to poorer individuals can have a positive net effect on aggregateoutput and growth. Unlike the current study in which the support for growth-enhancing redistribution via pub-lic education is unanimous, in Benabou (2000) redistributions are only supported by a wide consensus in a fairlyhomogeneous society but face strong opposition in an unequal one. See Benabou (2002) as well.
2
advanced industrial and managerial occupations, benefiting the production process at the higher
end.
Our thesis implies that a conflict of interest would emerge between owners of factors of
production that differ in their degree of complementary with human capital. In particular, the
theory suggests that a conflict of interest about the timing of the implementation of growth en-
hancing educational policies would emerge primarily among the economic elites - industrialists and
landowners - rather than between the ruling elite and the masses.7
Historical evidence presented in Section 3 suggests that, consistent with the proposed theory,
the process of industrialization enhanced the importance of human capital in production and
induced the capitalists to lobby for the provision of universal public education. Furthermore, as
suggested by the theory, the acquisition of human capital by the working class in the second phase
of the Industrial Revolution and the associated increase in wages, in particular relative to the
return to capital, brought about a gradual demise of the capitalist-workers class distinction.
The basic premise of this research, regarding the positive attitude of the capitalists towards
education reforms, is examined based on the voting patterns on the Balfour Act of 1902 — the
proposed education reform in the UK that marked the consolidation of a national education system
and the creation of a publicly supported secondary school system. Variations in the support of MPs
for the Balfour Act would reflect the variations in the skill intensity in the counties they represent.
Higher support for the Balfour Act would be expected from MPs who represent industrial skill-
intensive counties. The empirical analysis supports the main hypothesis. It establishes that there
exists a significant positive effect of skill-intensiveness of the industrial sector in a county on the
propensity of the MPs to vote in favor of the education reform proposed by the Balfour Act of
1902.
2 Related Literature
The effect of social conflict on political and educational reforms was examined by Bowles and Gintis
(1975), Grossman (1994), Grossman and Kim (1999), Acemoglu and Robinson (2000), Bourguignon
and Verdier (2000), and Bertocchi and Spagat (2004), among others. They argue that reforms and
redistribution from the elite to the masses diminish the tendency for socio-political instability and
predation, and may therefore stimulate investment and economic growth. In particular, several
studies examine the potential benefits for the elite from educational reforms. Bourguignon and
7Galor, Moav and Vollrath (2003) examine the effect of a conflict of interest between capitalists and landownerson education reforms. They establish theoretically and empirically the existence of a negative effect of land inequalityon public expenditure on education. Their findings support the thesis of this paper, demonstrating that even in thepresence of a class of landowners, cooperation between workers and capitalists, in the context of education reforms,may emerge.
3
Verdier (2000) suggest that if political participation is determined by the education (socioeconomic
status) of citizens, the elite may not find it beneficial to subsidize universal public education despite
the existence of positive externalities from human capital. Grossman and Kim (1999) argue that
education decreases predation, and Bowles and Gintis (1975) suggest that educational reforms are
designed to sustain the existing social order, by displacing social problems into the school system.
In contrast, we argue that a significant force in the demise of the class structure was a
by-product of a productive cooperation between capitalists and workers, rather than an outcome
of a divisive class struggle. Mutually beneficial reforms are also considered by Lizzeri and Persico
(2004) and Doepke and Zilibotti (2005). Lizzeri and Persico (2004) argue that provision of public
services may have served the interest of the elite as well as masses, and therefore the extension
of franchise redirects resources from wasteful redistribution to public goods. Doepke and Zilibotti
(2005) argue that child labor regulation may benefit capitalists by inducing parents to educate
their children, increasing the average skill of the work force. Although they place emphasize on
the political preference of the working class, since historically unions rather than factory owners
were the main active campaigners for child labor regulation, the success of the unions’ action may
have been possible only because of diminished opposition from industrialists.
3 Historical Evidence
Historical evidence suggests that, consistent with the proposed theory, a significant driving force
in the demise of the capitalists-workers class structure was the eagerness of the capitalists to invest
in the education of workers in reaction to the increasing importance of human capital in sustaining
their profit rates. In particular, Section 3.1 presents evidence that the process of industrialization
enhanced the importance of human capital in production and induced the capitalists to lobby
for the provision of universal public education. Section 3.2 provides evidence demonstrating that
the accumulation of human capital by the working class in the second phase of the Industrial
Revolution was associated with an increase in wages, in particular relative to the return to capital,
in line with a fading capitalists-workers class distinction. Finally, Section 3.3 presents evidence
that dispels an alternative hypothesis that political reforms during the 19th century shifted the
balance of power towards the working class and enabled workers to implement education reforms
against the will of the capitalists.
3.1 Industrial Development and Education Reforms
Evidence suggests that the experience of the Western World throughout the various phases of the
Industrial Revolution is consistent with the hypothesis of this research about the link between
industrial development and educational reforms. The process of industrialization was character-
4
ized by a gradual increase in the relative importance of human capital for the production process
(Abramovitz 1993). In the first phase of the Industrial Revolution, human capital had a limited
role in the production process. Education was motivated by a variety of reasons, such as religion,
social control, moral conformity, socio-political stability, social and national cohesion, military ef-
ficiency, and the Age of Enlightenment. The extensiveness of public education was therefore not
necessarily correlated with industrial development and it differed across countries due to political,
cultural, social, historical and institutional factors.8 In the second phase of the Industrial Revolu-
tion, education reforms were designed primarily to satisfy the increasing skill requirements in the
process of industrialization, reflecting the interest of capitalists in human capital formation and
thus in the provision of public education.9 The evidence suggests that in Western Europe, the
economic interests of capitalists were indeed a significant driving force behind the implementation
of educational reforms.10
3.1.1 England
In the first phase of the Industrial Revolution (1760-1830), consistent with the proposed hypothesis,
capital accumulation increased significantly without a corresponding increase in the supply of
skilled labor.11 In contrast, literacy rates evolved rather slowly and the state devoted virtually no
resources to raising the level of literacy of the masses.12 During the first stages of the Industrial
Revolution, literacy was largely a cultural skill or a hierarchical symbol and had limited demand in
the production process (Mitch (1992), and Mokyr (1993, 2001)). For instance, in 1841 only 4.9%
of male workers and only 2.2% of female workers were in occupations in which literacy was strictly
required (Mitch (1992, pp. 14-15)). During this period, an illiterate labor force could operate the
existing technology, and economic growth was not impeded by educational retardation.13 Workers
developed skills primarily through on-the-job training, and child labor was highly valuable (Kirby
2003).
The development of a national public system of education in England lagged behind that of
8For instance, Sandberg (1979) argues that the level of human capital in Sweden prior to 1850 was larger thanthe level that would have been justified by its stage of development.
9The form of human capital that was complementary to physical capital was rather broad, including literacy,quantitative abilities, and general knowledge, as well as work habits, such as punctuality, discipline, manners, anddiligence (Graff 1987).10One could argue that the rise in income during the second phase of the industrial revolution brought about an
increase in education since people view education as a normal consumption good. The evidence that we provide inthis section clarifies that the mechanism that we underlined is a significant force behind the accumulation of humancapital during this period.11For instance, the investment ratio increased from 6% in 1760 to 11.7% in the year 1831 (Crafts (1985, p. 73)).12Cipolla (1969), Stone (1969), and Schofield (1973), and Cressy (1980) show that literacy rates have increased
during the first phase of the industrial revolution but at a slower rate than in the second phase.13Some have argued that the low skill requirements even declined over this period. For instance, Sanderson (1995,
p. 89) suggests that “One thus finds the interesting situation of an emerging economy creating a whole range of newoccupations which require even less literacy and education than the old ones.”
5
the continental countries by nearly half a century (Sanderson (1995, pp. 2-10)).14 Britain’s early
industrialization occurred without a direct state intervention in the development of the minimal
skills that were required in production (Green (1990, pp. 293-294)). Furthermore, as argued by
Landes (1969, p. 340) “although certain workers - supervisory and office personnel in particular
- must be able to read and do the elementary arithmetical operations in order to perform their
duties, large share of the work of industry can be performed by illiterates as indeed it was especially
in the early days of the industrial revolution.”
England initiated a sequence of reforms in its education system since the 1830s and literacy
rates gradually increased. The process was initially motivated by a variety of reasons such as
religion, enlightenment, social control, moral conformity, socio-political stability, and military effi-
ciency, as was the case in other European countries (e.g., Germany, France, Holland, Switzerland)
that had supported public education much earlier.15 However, in light of the modest demand for
skills and literacy by the capitalists, the level of governmental support was rather small.16
In the second phase of the Industrial Revolution, consistent with the proposed hypothesis,
the demand for skilled labor in the growing industrial sector markedly increased (Cipolla 1969 and
Kirby 2003) and the proportion of children aged 5 to 14 in primary schools increased from 11%
in 1855 to 25% in 1870 (Flora et al. (1983)).17 In light of the industrial competition from other
countries, capitalists started to recognize the importance of technical education for the provision
of skilled workers. As noted by Sanderson (1995, pp. 10-13), “reading ...enabled the efficient func-
tioning of an urban industrial society laced with letter writing, drawing up wills, apprenticeship
indentures, passing bills of exchange, and notice and advertisement reading.” Manufacturers ar-
gued that: “universal education is required in order to select, from the mass of the workers, those
who respond well to schooling and would make a good foreman on the shop floor” (Simon (1987,
p. 104)). Furthermore, in 1824, Alexander Galloway, the master-engineer, reported: “I have found
from the mode of managing my business, by drawings and written descriptions, a man is not of
much use to me unless he can read and write. If a man applies for work, and says he cannot read
14For instance, in his parliamentary speech in defense of his 1837 education bill, the Whig politician, HenryBrougham, reflected upon this gap: “It cannot be doubted that some legislative effort must at length be made toremove from this country the opprobrium of having done less for education of the people than any of the morecivilized nations on earth” (Green (1990, pp.10-11)).15Wiener (1981), as well as others, argued in contrast, that the educational system in Britain was initially designed
to accentuate and perpetuate class differences, however, with “little attention or status to industrial pursuits” (p.24). This pre-existing motivation for education had therefore a limited effect on the relative earnings of the eliteand is thus tangential to the hypothesis derived in this paper. Thus, although the aspects of education that weredesigned to accentuate class differences may have affected the social characteristics of the elite and the masses, theyhave not counterbalanced the trend towards the gradual participation of the decedents of the working class in theaccumulation of physical and human capital.16Even in 1869 the government funded only one-third of school expenditure (Green, 1990, pp. 6-7).17Job advertisements, for instance, suggest that literacy became an increasingly desired characteristic for employ-
ment as of the 1850s (Mitch (1993, p. 292)).
6
and write, he is asked no more questions.” (Thompson, 1968).
As it became apparent that skills were necessary for the creation of an industrial society,
capitalists had an increasing interest in the level of education of the masses.18 Initially the
capitalists established the factory schools in order to educate the children they employed. The
Factory Acts of 1802 and 1833 made it mandatory for some manufacturers to set up such schools.
These laws were poorly enforced and the factory schools were not widespread, nor were they well
received. (Cameron (1989, p. 216-217), Cipolla (1969, p. 66-69), Smelser (1991)). The pure laissez-
faire policy failed in developing a proper educational system and capitalists demanded government
intervention in the provision of education. As James Kitson, a Leeds iron-master and advocate
of technical education explained to the Select Committee on Scientific Instruction (1867-1868):
“. . . the question is so extensive that individual manufacturers are not able to grapple with it, and
if they went to immense trouble to establish schools they would be doing it in order that others
may reap the benefit” (Green, 1990, p. 295).
An additional turning point in the attitude of capitalists towards public education was the
Paris Exhibition of 1867, where the limitations of English scientific and technical education became
clearly evident. Unlike the 1851 exhibition in which England won most of the prizes, the English
performance in Paris was rather poor; of the 90 classes of manufacturers, Britain dominated
only in 10. Lyon Playfair, who was one of the jurors, reported that: “a singular accordance of
opinion prevailed that our country has shown little inventiveness and made little progress in the
peaceful arts of industry since 1862.” This lack of progress “upon which there was most unanimity
conviction is that France, Prussia, Austria, Belgium and Switzerland possess good systems of
industrial education and that England possesses none” (Green (1990, p. 296)).
The government established various parliamentary investigations into the relationship be-
tween science, industry, and education, that, according to the proposed theory, were designed
to address the capitalists’ outcry about the necessity of universal public education. A sequence
of reports by these committees in the years 1868-1882, underlined the inadequate training for
supervisors, managers and proprietors, as well as workers (Green (1990, pp. 297-298)). In par-
ticular, W. E. Forster, the Vice President of the committee of the Council of Education told The
House of Commons: “Upon the speedy provision of elementary education depends our industrial
prosperity...if we leave our work-folk any longer unskilled...they will become overmatched in the
competition of the world” (Hurt (1971, pp. 223-224)). They proposed to organize a state inspec-
tion of elementary and secondary schools and to provide efficient education geared towards the
specific needs of its consumers. In particular, The Royal Commission on Technical Education of
18As hypothesized in this paper, there was a growing consensus among workers and capitalists about the virtues ofreform. The labor union movement was increasingly calling for a national system of non-sectarian education (Green,1990, p. 302).
7
1882 confirmed that England was being overtaken by the industrial superiority of Prussia, France
and the United States and recommended the introduction of technical and scientific education into
secondary schools.
As argued in the proposed theory, it appears that the government gradually yielded to the
pressure by capitalists and increased its contributions to elementary as well as higher education.
In the 1870 Education Act, (prior to the significant extension of the franchise of 1884 that made
the working class the majority in most industrial counties), the government assumed responsibility
for ensuring universal elementary education, although it did not provide either free or compulsory
education at the elementary level. (Green, (1990, p. 299)). School enrollment of 10-year-olds
increased from 40% in 1870 to 100% in 1900, the literacy rate among men, increased from 65% in
the first phase of the Industrial Revolution, to nearly 100% at the end of the 19th century (Clark
(2002)), and the proportion of children aged 5 to 14 in primary schools increased significantly in
the second half of the 19th century, from 11% in 1855 to 74% in 1900 (Flora et al. (1983)). Finally,
the 1902 Balfour Act marked the consolidation of a national education system and created state
secondary schools (Ringer (1979)). Furthermore, science and its application in technology gained
prominence (Mokyr (1990, 2002)). New universities were established with a strong emphasis on
professional training in the medical, legal, engineering and economic studies (Sanderson (1995, p.
47)).
3.1.2 Continental Europe
The early development of public education occurred in the western countries of continental Europe
(e.g., Prussia, France, Sweden, and the Netherlands) well before the Industrial Revolution. The
process was motivated by a variety of reasons, such as religion, enlightenment, social control, moral
conformity, socio-political stability, social and national cohesion, and military efficiency (Scott
(1977), Graff (1987)). As was the case in England, massive educational reforms occurred in the
second half of the 19th century due to the rising demand for skills in the process of industrialization
(Cipolla 1969). Technical and scientific education had been vigorously promoted as an essential
element of competitiveness and economic growth (Green (1990, pp. 293-294)).
In France, indeed, the initial development of the education system occurred well before the
Industrial Revolution, but the process was intensified and transformed to satisfy industrial needs in
the second phase of the Industrial Revolution. The early development of elementary and secondary
education in the 17th and 18th centuries was dominated by the church and religious orders. Some
state intervention in technical and vocational training was designed to reinforce development in
commerce, manufacturing and military efficiency. After the French Revolution, the state estab-
lished universal primary schools. Nevertheless, enrolment rates remained rather low. The state
8
concentrated on the development of secondary and higher education with the objective of produc-
ing an effective elite to operate the military and governmental apparatus. Secondary education
remained highly selective, offering general and technical instruction largely to the middle class
(Green (1990, pp. 135-137 and 141-142)). Legislative proposals during the National Convention
quoted by Cubberley (1920, pp. 514-517) are revealing about the underlying motives for education
in this period: “. . . Children of all classes were to receive that first education, physical, moral and
intellectual, the best adapted to develop in them republican manners, patriotism, and the love of
labor. . . They are to be taken into the fields and workshops where they may see agricultural and
mechanical operations going on. . . ”
The process of industrialization in France and the associated increase in the demand for
skilled labor, as well as the breakdown of the traditional apprenticeship system, significantly af-
fected the attitude towards education. State grants for primary schools were gradually increased
in the 1830s and legislation made an attempt to provide primary education in all regions, extend
the higher education, and provide teacher training and school inspections. The number of com-
munities without schools fell by 50% from 1837 to 1850 and as the influence of industrialists on
the structure of education intensified, education became more stratified according to occupational
patterns (Anderson (1975 p. 15, 31)). The eagerness of capitalists for rapid education reforms was
reflected by the organization of industrial societies that financed schools specializing in chemistry,
design, mechanical weaving, spinning, and commerce (Anderson (1975, p 86, 204)).
As was the case in England, industrial competition led industrialists to lobby for the provision
of public education. The Great Exhibition of 1851 and the London Exhibition of 1862 created the
impression that the technological gap between France and other European nations was narrowing
and that French manufacturers ought to invest in the education of their labor force to maintain
their technological superiority. Subsequently, the reports on industrial education by commissions
established in the years 1862 to 1865 reflected the plea of industrialists for the provision of industrial
education on a large scale and for the implementation of scientific knowledge in the industry. “The
goal of modern education. . . can no longer be to form men of letters, idle admirers of the past,
but men of science, builders of the present, initiators of the future.”19 (Anderson (1975, p. 194)).
Education reforms in France were extensive in the second phase of the Industrial Revolution, and
by 1881 a universal, free, compulsory and secular primary school system had been established and
technical and scientific education further emphasized. Illiteracy rates among conscripts tested at
the age of 20 declined gradually from 38% in 1851-55 to 17% in 1876-80 (Anderson (1975, p. 158)),
and the proportion of children aged 5 to 14 in primary schools increased from 51% in 1850 to 86%
in 1901 (Flora et al. (1983)).
19L’Enseignement professionnel, ii (1864), p. 332, quoted in Anderson (1975).
9
In Prussia, as well, the initial steps towards compulsory education took place at the beginning
of the 18th century well before the Industrial Revolution. Education was viewed at this stage
primarily as a method to unify the state (Schleunes 1989 and Tipton 2003). In the second part
of the 18th century, education was made compulsory for all children aged 5 to 13. Nevertheless,
these regulations were not strictly enforced due to the lack of funding associated with the difficulty
of taxing landlords for this purpose, and due to the loss of income from child labor.20 At the
beginning of the 19th century, motivated by the need for national cohesion, military efficiency,
and trained bureaucrats, the education system was further reformed, making education a secular
activity and compulsory for a three-year period, and reconstituting the Gymnasium as a state
institution providing nine years of education for the elite (Cubberly (1920)).
The process of industrialization in Prussia and the associated increase in the demand for
skilled labor led to significant pressure for educational reforms and thereby to the implementation
of universal elementary schooling (Green 1990). Taxes were imposed to finance the school system
and teachers’ training and certification were established. Secondary schools started to serve indus-
trial needs as well. The Realschulen, which emphasized the teaching of mathematics and science,
was gradually adopted, and vocational and trade schools were founded. Total enrolment in sec-
ondary school increased six fold from 1870 to 1911 (Flora et al. (1983)). “School courses...had
the function of converting the occupational requirements of public administration, commerce and
industry into educational qualifications...” (Muller (1987, pp. 23-24)). Furthermore, the Industrial
Revolution significantly affected the nature of education in German universities. German indus-
trialists who perceived advanced technology as the competitive edge that could boost German
industry, lobbied for reforms in the operation of universities, and offered to pay to reshape their
activities so as to favor their interest in technological training and industrial applications of basic
research (McClelland (1980, p. 300-301)).
Similarly, the structure of education in the Netherlands and Belgium reflected the interest
of capitalists in the skill formation of the masses. In the Netherlands, as early as the 1830s, indus-
trial schools were established and funded by private organizations, representing industrialists and
entrepreneurs. Ultimately, in the latter part of the 19th century, the state, urged by industrialists
and entrepreneurs, started to support these schools (Wolthuis (1999, pp. 92-93, 119, 139-140, 168,
171-172)). In Belgium, primary education was backward in comparison with other European coun-
tries and a compulsory education system was established only at the beginning of the 20th century,
when illiteracy rate was 19%. Nevertheless, industrial development prompted the establishment of
the industrial school as of 1818, financed by local industrialists. These schools expanded rapidly
20Indicative of the realization by the elite that education was more significant for the urban production process isthe statement by Frederick II in 1979 about education: “...if they learn too much they will run off to the cities tobecome secretaries or some such things.” (Schleunes 1989).
10
in the midst of the 19th century (Mallinson (1963)).
3.1.3 United States
The process of industrialization in the US also increased the importance of human capital in the
production process. Evidence provided by Abramowitz and David (2000) and Goldin and Katz
(2001) suggests that over the period 1890-1999, the contribution of human capital accumulation to
the growth process of the United States nearly doubled.21 As argued by Goldin (1999), the rise of
the industrial, business and commerce sectors in the late 19th and early 20th centuries increased the
demand for managers, clerical workers, and educated sales personnel who were trained in account-
ing, typing, shorthand, algebra, and commerce. Furthermore, in the late 1910s, technologically
advanced industries demanded blue-collar craft workers who were trained in geometry, algebra,
chemistry, mechanical drawing, etc. The structure of education was transformed in response to
industrial development and the increasing importance of human capital in the production process,
and high schools adapted to the needs of the modern workplace of the early 20th century. Total
enrolment in public secondary schools increased 70-fold from 1870 to 1950 (Kurian 1994).
Nevertheless, due to differences in the structure of education finance in the US in comparison
to European countries, capitalists in the US had only limited incentives to lobby for the provision
of education and support it financially. Unlike the central role that government funding played in
the provision of public education in European countries, the evolution of the education system in
the US was based on local initiatives and funding. The local nature of the education initiatives
in the US induced community members, in urban as well as rural areas, to play a significant role
in advancing their schooling system. Capitalists, however, faced limited incentives to support the
provision of education within a county in an environment where labor was mobile across counties
and the benefits from educational expenditure in one county may be reaped by employers in other
counties.
3.2 Schooling, Factor Prices and Inequality
The main hypothesis of this research suggests that in the first phase of the Industrial Revolution,
prior to the implementation of significant education reforms, physical capital accumulation was
the prime engine of economic growth and the concentration of capital among the capitalist class
widened wealth inequality. Once education reforms were implemented, however, the significant
increase in the return to labor relative to capital, as well as the significant increase in the real
21It should be noted that literacy rates in the US were rather high prior to this increase in the demand forskilled labor. Literacy rates among the white population were already 89% in 1870, 92% in 1890, and 95% in 1910(Engerman and Sokoloff (2000)). Education in earlier periods was motivated by social control, moral conformity,and social and national cohesion, as well as required skills for trade and commerce.
11
return to labor and the associated accumulation of assets by the workers, brought about a decline
in inequality and eventually the demise of the European 19th century class structure.22
The theory predicts that in the first phase of the Industrial Revolution, prior to the imple-
mentation of education reforms, capital accumulation brought about a gradual increase in wages
along with an increase in the wage-rental ratio. Education reforms in the second phase of the
Industrial Revolution are expected to generate a sharp increase in real wages along with a sharp
increase in the wage-rental ratio. Finally, wealth inequality is predicted to widen in the first phase
of the Industrial Revolution and to reverse its course in the second phase, once significant education
reforms have been implemented.
Indeed, evidence from the UK supports this hypothesis. As depicted in Figures 1(c) and
1(d), based on the data set of Clark (2002, 2003), real wages as well as the wage-rental ratio
increase dramatically from 1870 well into the 20th century.23 These changes in factor prices reflect
the increase in enrolment rates, as depicted in Figure 1(a) (in particular the process of education
reforms from 1830 to 1870 and its consolidation in the Education Act of 1870) and its delayed effect
on the skill level per worker.24 Thus, it appears that the demise of the class structure is indeed
associated with the significant changes that occurred around 1870 in the relative returns to the main
factors of production possessed by capitalists and workers.25 As documented in the controversial
study by Williamson (1985) about the evolution of inequality in the time period 1823-1915, wealth
inequality in the UK reached a peak around 1870 and declined thereafter (Figure 1(b)), in close
association with the patterns of enrolment rates and factor prices.26
Similar patterns of the effect of education on factor prices and therefore on inequality are
22The rise in inequality in mature stages of development due to skilled or ability-biased technological change (e.g.,Katz and Murphy (1992), Galor and Tsiddon (1997), Acemoglu (1998), Caselli (1999), and Galor and Moav (2000))does not reflect a reversal in the demise of the class structure. It is not related to class association as reflectedpartly by increased intergenerational mobility (e.g., Galor and Tsiddon (1997), Maoz and Moav (1999), Hassler andRodriguez-Mora (2000)).23Clark (2003) constructs three series for wages in England over this period. Farm wage, Helper Wage, and
Craftsmen Wage. Figures 1(c) and 1(d) are based on Helper wage. (Craftsmen wage generate similar time path).Farm wage appears less relevant given the focus of the paper. Moreover, it should be noted that the return to capitalincreased moderately over this period, despite the increase in the supply of capital, reflecting technological progress,population growth, and accumulation of human capital.24It should be noted that although the demand for skill labor increased in the process, the skill premium is rather
stable over this period (Clark 2003). The lack of clear evidence about the increase in the return to human capital overthis period is not an indication for the absence of a significant increase in the demand for human capital. However,the significant increase in schooling that took place in the 19th century, and in particular the introduction of publiceducation that lowered the cost of education, generated a significant increase in the supply of educated workers andoperated towards a reduction in the return to human capital.25Throughout the period 1873-1913 in which real wages increase significantly, the growth rate of output per capita
is explained entirely by the contributions of physical and human capital accumulation. Thus, TFP growth is zeroover this period, depicting a marked decline over a 0.6% annual TFP growth in the period 1856-1873. (Mattews etal. (1982)). An increase in labor-augmenting technological change is therefore not a viable explanation for relativeand absolute increases in real wages and the decline in inequality in the UK over this period.26Feinstien (1988), criticizes Williamson’s methodology of data construction, but does not provide an alternative
that refutes the hump shape evolution of inequality over this period.
12
observed in France as well. As argued by Morrisson and Snyder (2000), wealth inequality in France
increased during the first half of the 19th century, and as depicted in Figure 2(b), started to decline
in the last decades of the 19th century in close association with the patterns of enrolment rates
and factor prices, depicted in Figures 2(a), 2(c) and 2(d). The decline in inequality in France
appears to be associated with the significant changes in the relative returns to the main factors
of production possessed by capitalists and workers in the second part of the 19th century. As
depicted in Figures 2(c) and 2(d), based on the data presented in Levy-Leboyer and Bourguignon
(1990), real wages as well as the wage-rental ratio increase significantly as of 1860, reflecting the
effect of the increase in enrolment rates on the skill level per worker.
The German experience is consistent with this pattern as well. Inequality in Germany started
to decline towards the end of the 19th century (Morrisson and Snyder (2000)) in association with a
significant increase in the real wages and in the wage-rental ratio from the 1880s (Spree (1977) and
Berghahn (1994)), which is in turn related to the provision of industrial education in the second
half of the 19th century.
The link between the expansion of education and the reduction in inequality is present in
the US as well. Wealth inequality in the US, which increased gradually from colonial times until
the second half of the 19th century, reversed its course at the turn of the century and maintained
its declining pattern during the first half of the 20th century (Lindert and Williamson (1976)). As
argued by Goldin (2001), the emergence of the “new economy” in the early 20th century increased
the demand for educated workers. The creation of publicly funded mass modern secondary schools
from 1910 to 1940 provided general and practical education, contributed to workers productivity
and opened the gates for college education. This expansion facilitated social and geographic
mobility and generated a large decrease in inequality in economic outcomes.
3.3 The Timing of Educational and Political Reforms
This research suggests that education reforms were initiated by the capitalists in reaction to the
increasing importance of human capital in sustaining their profit rates. An alternative hypothesis
may be that political reforms during the 19th century shifted the balance of power towards the
working class, and enabled workers to implement education reforms against the will of the elite.27
The evidence, however, does not support this alternative hypothesis.
Education reforms took place in autocratic states that did not relinquish political power
throughout the 19th century, and major reforms occurred in societies in the midst of the process of
democratization well before the stage at which the working class constituted the majority among
27See for instance, Acemoglu and Robinson (2000), where the extension of the franchise during the 19th centuryis viewed as a commitment devise to ensure future income redistribution from the elite to the masses.
13
the voters. In particular, the most significant education reforms in the UK were completed before
the voting majority shifted to the working class. The patterns of education and political reforms in
the UK during the 19th century are depicted in Figure 3(a). The Reform Act of 1832 nearly doubled
the total electorate, but nevertheless only 13% of the voting-age population was enfranchised. The
artisans, the working classes, and some sections of the lower middle classes remained outside of
the political system. The franchise was extended further in the Reform Acts of 1867 and 1884 and
the total electorate nearly doubled in each of these episodes. However, working-class voters did
not become the majority in all urban counties until 1884 (Craig (1989)).
The onset of England’s education reforms, and in particular, the fundamental Education
Act of 1870 and its major extension in 1880 occurred prior to the political reforms of 1884 that
made the working class the majority in most counties. As depicted in Figure 3(a), a trend of
significant increase in primary education was established well before the extension of the franchise
in the context of the 1867 and 1884 Reform Acts. In particular, the proportion of children aged 5
to 14 in primary schools increased five-fold (and surpassed 50%) over the three decades prior to the
qualitative extension of the franchise in 1884 in which the working class was granted a majority
in all urban counties. Furthermore, the political reforms do not appear to have any effect on the
pattern of education reform. In fact, the average growth rate of education attendance from decade
to decade over the period 1855 to 1920 reaches a peak at around the Reform Act of 1884 and starts
declining thereafter.28
Similar pattern occurred in other European countries. In France the expanding pattern of
education preceded the major political reform that gave the voting majority to the working class.
The patterns of education and political reforms in France during the 19th century are depicted in
Figure 3(b). Prior to 1848, restrictions limited the electorate to less than 2.5% of the voting-age
population. The 1848 revolution led to the introduction of nearly universal voting rights for males.
Nevertheless, the proportion of children aged 5 to 14 in primary schools doubled (and exceeded
50%) over the two decades prior to the qualitative extension of the franchise in 1848 in which the
working class was granted a majority among voters. Furthermore, the political reforms of 1848
do not appear to have any effect on the pattern of education expansion. Political reforms in the
Netherlands did not affect the trend of education expansion and the proportion of children aged
5 to 14 in primary schools exceeded 60% well before the major political reforms of 1887 and 1897.
Similarly, the trends of political and education reforms in Sweden, Italy, Norway, Prussia and
Russia do not lend credence to the alternative hypothesis.
28It is interesting to note, however, that the abolishment of education fees in nearly all elementary schools occursonly in 1891, after the Reform Act of 1884, suggesting that the political power of the working class may have affectedthe distribution of education cost across the population, but consistent with the proposed thesis, the decision toeducate the masses was taken independently of the political power of the working class.
14
4 The Basic Structure of the Model
Consider a closed overlapping-generations economy in a process of development. In every period the
economy produces a single homogeneous good that can be used for consumption and investment.
The good is produced using physical capital and human capital. Output per-capita grows over
time due to the accumulation of these factors of production.29 The stock of physical capital in
every period is the output produced in the preceding period net of consumption and human capital
investment, whereas the stock of human capital in every period is determined by the aggregate
level of public education in the preceding period.30
4.1 Production of Final Output
Production occurs within a period according to a neoclassical, constant-returns-to-scale, production
technology. The output produced at time t, Yt, is
Yt = F (Kt,Ht) ≡ Htf(kt) = AHtkαt ; kt ≡ Kt/Ht; α ∈ (0, 1), (1)
where Kt and Ht are the quantities of physical capital and human capital (measured in efficiency
units) employed in production at time t, and A is the level of technology.31 The production func-
tion, f(kt), is therefore strictly monotonic increasing, strictly concave satisfying the neoclassical
boundary conditions that assure the existence of an interior solution to the producers’ profit-
maximization problem.
Producers operate in a perfectly competitive environment. Given the wage rate per efficiency
unit of labor, wt, and the rate of return to capital, rt , producers in period t choose the level of
employment of capital, Kt, and efficiency units of labor, Ht, so as to maximize profits. That
is, {Kt,Ht} = argmax [Htf(kt) − wtHt − rtKt]. The producers’ inverse demand for factors of29Earlier growth models that focus on the role of physical and human capital in the process of development include,
for instance, Lucas (1988), Caballe and Santos (1993) and Mulligan and Sala-i-Martin (1993). These models abstractfrom the analysis of income heterogeneity and credit market imperfections, and therefore, do not study the incentivesof the rich to subsidize the education of the poor.30The model abstracts from international factor movements. Land abundance in America have generated incentives
for outflow of labor from Europe to America, intensifying the problem of labor scarcity and preventing the use oflabor inflow (rather than investment in human capital) as a remedy for labor scarcity. In contrast, as argued byTaylor (1999) and O’Rourke, Taylor and Williamson (1996), international capital outflow from Britain was significantduring the 19th century and hence could alleviate some of the need to invest in human capital in order to sustainthe profit rates.31The introduction of technological progress would accelerate the rise in wages and may eventually trigger the
demise of the class structure even in the absence of education reforms. Nevertheless, educational reforms would havea significant role in expediting the process. Moreover, it should be noted, that consistent with empirical evidenceTFP growth over the relevant period for this study is negligible and output growth is based primarily on factoraccumulation, as underlined in the proposed theory.
15
production is therefore
rt = f 0(kt) = αAkα−1t ≡ r(kt);
wt = f(kt)− f 0(kt)kt = (1− α)Akαt ≡ w(kt).(2)
4.2 Individuals
In every period a generation which consists of a continuum of individuals of measure 1 is born. Each
individual has a single parent and a single child. Individuals, within as well as across generations,
are identical in their preferences and innate abilities. They may differ, however, in their family
wealth and thus, due to borrowing constraints, in their capability to finance investment in human
capital in the absence of public education.
Individuals live for two periods. In the first period of their lives individuals devote their
entire time for the acquisition of human capital. The acquired level of human capital increases if
their time investment is supplemented with capital investment in education. In the second period
of their lives, individuals supply their efficiency units of labor and allocate the resulting wage
income, along with their interest income, between consumption and transfers to their children.
An individual i born in period t (a member i of generation t) receives a parental transfer, bit,
in the first period of life. A fraction τ t ≥ 0 of this capital transfer is collected by the governmentin order to finance public education, whereas a fraction 1 − τ t is saved for future consumption.
Individuals devote their first period for the acquisition of human capital. Education is provided
publicly free of charge.32 The acquired level of human capital increases with the real resources
invested in public education. The number of efficiency units of labor of each member of generation
t in period t + 1, ht+1, is a strictly increasing, strictly concave function of the government real
expenditure on education per member of generation t, et.33
ht+1 = h(et), (3)
where h(0) = 1, h0(0) = γ < ∞, and limet→∞ h0(et) = 0. The assumption that the slope of
the production function of human capital is finite at the origin along with the assumption that
each individual has a minimal level of human capital, h(0) > 0, even in the absence of a real
expenditure on education, assure that under some market conditions investment in human capital
32As will become apparent, once the level of public education is chosen, individuals have no incentive to acquireprivate education. In particular, in early stages of development, when the tax rate τ t equals zero, individuals do notacquire education.33A more realistic formulation would link the cost of education to (teachers) wages, which may vary in the process
of development. For instance, ht+1 = h(et/wt) implies that the cost of education is a function of the number ofefficiency units of teachers that are used in the education of each individual i. As can be derived from section 3.4,under both formulations the optimal expenditure on education, et, is an increasing function of the capital-labor ratioin the economy, and the qualitative results are therefore identical.
16
is not optimal.34
In the second period life, a member i of generation t supplies the acquired efficiency units
of labor, ht+1, at the competitive market wage, wt+1. In addition, the individual receives the gross
return on savings, (1− τ t)bitRt+1. The individual’s second period income, I
it+1, is therefore
Iit+1 = wt+1h(et) + (1− τ t)bitRt+1, (4)
where due to complete capital depreciation Rt+1 ≡ rt+1 ≡ R(kt+1).Preferences of a member i of generation t are defined over second period consumption, cit+1,
and the transfer to their offspring, bit+1.35 They are represented by a non-homothetic, log-linear
utility function that generates the property that the average propensity to bequest is an increasing
function of wealth:36
uit = (1− β) log cit+1 + β log(θ + bit+1), (5)
where β ∈ (0, 1) and θ > 0.37
Hence, a member i of generation t allocates second period income between consumption,
cit+1, and transfers to the offspring, bit+1. That is,
cit+1 + bit+1 ≤ Iit+1. (6)
The individual chooses the level of second period consumption, cit+1, and a non-negative transfer
to the offspring, bit+1, so as to maximize the utility function subject to the second period budget
constraint (6).38
34These assumptions are necessary in order to assure that in the early stage of development the sole engine ofgrowth is physical capital accumulation and there is no incentive to invest in human capital. It permits, therefore,a sharp presentation of the results regarding institutional transition. The typically assumed Inada condition (i.e., γis infinite) is designed to simplify the exposition by avoiding a corner solution, but it is not a realistic assumption.35For simplicity we abstract from first period consumption. It may be viewed as part of the consumption of the
parent.36This utility function represents preferences under which the saving rate is an increasing function of wealth. This
classical feature (e.g., Keynes (1920), Lewis (1954), Kaldor (1957)) is consistent with empirical evidence. Dynan,Skinner and Zeldes (2004) find a strong positive relationship between personal saving rates and lifetime income inthe United States. They argue that their findings are consistent with models in which precautionary saving andbequest motives drive variations in saving rates across income groups. Furthermore, Tomes (1981) and Menchikand David (1983) find evidence that the marginal propensity to bequeath increases with wealth. The choice of anon-homothetic utility function is necessary to assure that Workers do not invest in physical capital prior to theestablishment of public schooling. A choice of a homothetic utility function would not affect the results regardingthe effect of capital skill-complementarity on institutional transition, but it would imply that the demise of theclass structure would have necessarily occurred even in the absence of education reforms. Nevertheless, even underhomothetic preferences, educational reforms would have a significant role in expediting the process.37This form of altruistic bequest motive (i.e., the “joy of giving”) is the common form in the recent literature on
income distribution and growth. It is supported empirically by Altonji, Hayashi and Kotlikoff (1997). Utility fromafter tax transfers would reduce intergenerational transfers but would not affect the qualitative results. In particular,under utility from net transfers equation (7) below would be
bit+1 = b(Iit+1, τ t+1) ≡
⎧⎨⎩ β(Iit+1 − θ/(1− τ t+1)) if Iit+1 > θ/(1− τ t+1);
0 if Iit+1 ≤ θ/(1− τ t+1),38It should be noted that the transfer, bit+1, is necessarily non-negative due to the assumption that the offspring
has no income in the first period of life.
17
Hence the optimal transfer of a member i of generation t is:
bit+1 = b(Iit+1) ≡
⎧⎨⎩β(Iit+1 − θ) if Iit+1 > θ;
0 if Iit+1 ≤ θ,(7)
where θ ≡ θ(1− β)/β.
4.3 Physical Capital, Human Capital, and Output
This section demonstrates that the stocks of physical and human capital and therefore the level of
output are determined by the aggregate level of intergenerational transfers, the level of taxation,
and governmental expenditure on public education, in the preceding period.
Let Bt denote the aggregate level of intergenerational transfers in period t. A fraction τ t of
this capital transfer is collected by the government in order to finance public education, whereas
a fraction 1 − τ t is saved for future consumption.39 The capital stock in period t + 1, Kt+1, is
therefore
Kt+1 = (1− τ t)Bt, (8)
whereas the government tax revenues are τ tBt.
Since population is normalized to 1, the education expenditure per young individual in
period t, et, is
et = τ tBt, (9)
and the stock of human capital in period t+ 1, Ht+1, is therefore
Ht+1 = h(et) = h (τ tBt) . (10)
Hence, the capital-labor ratio kt+1 ≡ Kt+1/Ht+1 is
kt+1 =(1− τ t)Bth(τ tBt)
≡ k(τ t, Bt), (11)
where k(0, Bt) = Bt, ∂k(τ t, Bt)/∂τ t < 0, ∂k(τ t, Bt)/∂Bt > 0, 40 and the output per-worker in
period t+ 1 is
yt+1 = A[(1− τ t)Bt]αh (τ tBt)
1−α ≡ y(τ t, Bt). (12)
39As will become apparent, this linear tax structure is the simplest structure that would generate the transitionfrom a class society. It assures that the chosen level of taxation is independent of the structure of the political system.That is, independent of the distribution of political power or voting rights among members of society. Furthermore,Capitalists could have not effectively forced the poor to finance their own education due to the proximity of theincome of the poor to the subsistence level of consumption and the positive effect of income of the outcome of theeducation process.40∂k(τ t, Bt)/∂Bt > 0 if and only if h(et)− h0(et)et > 0, which is satisfied given the strict concavity of h(et) and
the positivity of h(0).
18
4.4 Optimal Taxation
This section derives the optimal tax rate and therefore the optimal expenditure on education from
the viewpoint of each individual in society. It demonstrates that as long as taxation is used in
order to finance public schooling, there is a consensus in society regarding the desirable tax rate.
If the government would be engaged in direct transfers from the rich to the poor in addition to
the provision of public schooling, then a conflict would emerge between the classes regarding the
desirable tax rate. This would perhaps add some realism, but would obscure unnecessarily the
focus on the role of cooperative forces in the demise of the class structure.
Given that the indirect utility function is a strictly increasing function of the individual’s
second period wealth, the optimal tax rate, τ it, from the viewpoint of member i of generation t,
(and hence the optimal expenditure on education, et = τ itBt from the viewpoint of this individual,
given Bt) would maximize the individual’s second period wealth, Iit+1.
τ it = argmax[wt+1h(τitBt) + (1− τ it)b
itRt+1], (13)
where wt+1 = w(kt+1) and Rt+1 = R(kt+1).
As follow from (13), noting (2) and (11) the optimal tax rate from the viewpoint of a member
i of generation t, τ it, is given by41
w(kt+1)h0(τ itBt) = R(kt+1) for τ it > 0;
w(kt+1)γ ≤ R(kt+1) for τ it = 0,(14)
where kt+1 = k(τ t, Bt). Hence, given Bt, τit is determined independently of b
it, and is therefore
identical for all i.42 That is τ it = τ∗t for all i. Furthermore, there exists a unique capital-labor ratioek, below which τ it = 0. That is, R(ek) = w(ek)γ.
Lemma 1 (a) The optimal tax rate in period t, τ∗t , is identical from the viewpoint of all member
of generation t and is uniquely determined.
τ∗t = τ(Bt)
⎧⎨⎩> 0 for Bt > ek= 0 for Bt ≤ ek;
41Substituting (2) and (11) into (13),
τ it = argmax(1− τ it)αh(τ itBt)
1−αBtα[1− α+ αbit/Bt].
The conditions in (14) follow from the optimization problem above, using (2).42The unanimous agreement on the tax rate is a result of the linear tax rate and the unit elasticity of substitution
between human and physical capital in production. Given a Cobb-Douglas production function, the shares oflabor and capital are constant and wage and capital income are therefore maximized if output is maximized. If theelasticity of substitution would be larger than unity, then the poor would prefer higher taxes, whereas if the elasticityof substitution is smaller than unity, then the rich would prefer higher taxes.
19
ek = α/(1− α)γ.
(b) The optimal expenditure on public education, et = τ(Bt)Bt ≡ e(Bt) from the viewpoint
of each member of generation t is strictly increasing in Bt, for Bt > ek.Proof. Noting (2), (11) and (14) it follows from the properties of h(τ tBt) that τ
∗t is uniquely
determined by Bt and e0(Bt) > 0, where as follows from the definition of ek and (2), ek = α/(1−α)γ.
¤Hence, since the optimal tax rate in period t is identical from the viewpoint of each member
of generation t, it follows that under any political structure, the chosen tax rate in period t is
τ t = τ∗t = τ(Bt). (15)
Proposition 1 The tax rate in period t, τ t is
τ t
⎧⎨⎩> 0 for kt+1 > ek= 0 for kt+1 ≤ ek.
Proof. Since h(0) = 1, it follows from (11) (14) and Lemma 1 that kt+1 = Bt for Bt ≤ ek andhence for kt+1 ≤ ek. Thus the Proposition follows. ¤
Corollary 1 The chosen level of taxation in every period maximizes output per-worker in the
following period. That is,
τ t = argmax yt+1 ≡ argmax y(τ t, Bt).
Proof. Maximizing y(τ t, Bt) with respect to τ t yield the optimality conditions given by
(14). That is, the optimality conditions for the desired level of taxation from the viewpoint of each
individual. ¤Hence, as long as the rate of return to human capital is lower than the rate of return on
physical capital (i.e., as long as kt+1 ≤ ek) the chosen level of investment in public education is zero— the level of investment that maximizes output per-worker. Once the rate of return to human
capital equals the rate of return on physical capital (i.e., once kt+1 > ek) the chosen investment inpublic education is positive and it maximizes output per-worker.
4.5 The Dynamical System
This section derives the properties of the dynamical system that governs the evolution of the
economy in the transition from a class society to a classless society. It demonstrates that the
evolution of the economy is fully determined by the evolution of intergenerational transfer within
classes in society.
20
Suppose that in period 0 the economy consists of two groups of individuals in their first
period of their lives - Capitalists and workers. They are identical in their preferences and differ
only in their initial wealth. The Capitalists, denoted by R (Rich), are a fraction λ of all individuals
in society, who equally own the entire initial stock of wealth. The Workers, denoted by P (Poor),
are a fraction 1 − λ of all individuals in society, who have no ownership over the initial physical
capital stock.43 Since individuals are initially homogenous within a group, the uniqueness of the
solution to their optimization problem assures that their offspring who acquire the same level of
education and are taxed equally are homogenous as well . Hence, in every period a fraction λ of
all adults are homogenous descendents of the Capitalists, denoted by members of group R, and a
fraction 1− λ are homogenous descendents of Workers, denoted by members of group P .
The optimization of groups P and R of generation t − 1 in period t > 0, determines the
aggregate intergenerational transfers in period t, Bt.
Bt = λbRt + (1− λ)bPt ≡ B(bRt , bPt ), (16)
where bit is the intergenerational transfer of each member of group i in period t; i = P,R.
Hence, the capital-labor ratio in period t+1, kt+1,is fully determined by the intergenerational
transfers of the two groups. As follows from (11), (15), (16), and Proposition 1,
kt+1 =[1− τ(Bt)]Bth[τ(Bt)Bt]
≡ κ(bRt , bPt ), (17)
where as follows from (2) and (14), and the properties of (11), ∂κ/∂bit > 0, i = R,P. Furthermore,
κ(0, 0) = 0 (since in the absence of transfers and hence savings the capital stock in the subsequent
period is zero).
Since members of group R equally own the entire initial stock of wealth in period 0 and
members of group P have no ownership over the initial stock of wealth, it follows that bR0 > 0 and
bp0 = 0.
Lemma 2 If bR0 <ek/λ then k1 < ek and thus there is no investment in public education in period
0.
Proof. Since bp0 = 0, (11),(16) and Lemma 1, given the properties of (3), imply that
k1 = B0 = λbR0 . Hence, it follows that k1 <ek and thus, as follows from Proposition 1, τ0 = 0. ¤
Consistently with empirical evidence about the process of development, it is therefore as-
sumed that
bR0 <ek/λ, (A1)
43As will become apparent this class distinction will dissipate over time. In particular, descendents of the workingclass will ultimately own some physical capital.
21
namely, there is no investment in public education in the early stage of development.
The evolution of transfers within each group i = R,P, as follows from (7), is given by
bit+1 = max{β[w(kt+1)h(τ(Bt)Bt)) + (1− τ(Bt))bitR(kt+1)− θ], 0}; i = R,P. (18)
Since kt+1 = κ(bRt , bPt ), and Bt = B(b
Rt , b
Pt ), the evolution of transfers of each of the two groups is
fully determined by the evolution of transfers of both types of dynasties. Namely,
bit+1 = max{β[w(κ(bRt , bPt ))h(τ(B(bRt , bPt ))B(bRt , bPt ))) + (1− τ(B(bRt , bPt )))b
itR(κ(b
Rt , b
Pt ))− θ], 0}(19)
≡ ψi(bRt , bPt ); i = R,P. (20)
Thus, the dynamical system is uniquely determined by the joint-evolution of the intergen-
erational transfers of Workers, P and Capitalists, R. Hence, the evolution of the economy is given
by the sequence {bPt , bRt }∞t=0 that satisfies in every period
bPt+1 = ψP (bRt , bPt );
bRt+1 = ψR(bRt , bPt ),
(21)
where bp0 = 0 and bR0 > 0.
5 The Process of Development
This section analyzes the endogenous demise of the Capitalists-Workers class structure as the
economy evolves from early to mature stages of development. As will become apparent, if additional
plausible restrictions are imposed on the basic model, the economy endogenously evolves through
two fundamental regimes:
• Regime I: This early stage of development, is characterized by a stable class structure. Cap-italists generate a higher rate of return from a direct investment in physical capital, rather
than from supporting the education of Workers that would complement their capital in the
production process. Capitalists therefore have no incentive to financially support the educa-
tion of the Workers.
• Regime II: These later stages of development are characterized by the onset of the grad-ual demise of the Capitalists-Workers class structure. The importance of human capital in
sustaining the profits of Capitalists increases sufficiently. The Capitalists find it beneficial
to financially support public education, and ultimately Workers, as well as Capitalists, are
engaged in physical capital accumulation.
22
5.1 Regime I: Physical Capital Accumulation
This early stage of development is characterized by a stable class structure. Capitalists generate a
higher rate of return from a direct investment in physical capital, rather than from supporting the
education of Workers that would complement their capital in the production process. Capitalists
therefore have no incentive to financially support the education of the Workers.
Regime I is defined as the time interval 0 ≤ t < et, where et + 1 is the first period in whichthe capital labor ratio exceeds ek (i.e., et is the first period in which investment in human capitaltakes place). In this early stage of development the capital-labor ratio in period t + 1, kt+1,
which determines the investment in public education in period t, is lower than ek. As follows fromProposition 1 and Corollary 1, the tax rate is zero, there is no public education, and both groups
of individuals acquire only basic skills. That is, Ht+1 = h(0) = 1.
Let k be the level of the capital-labor ratio such that w(k) = θ. As follows from (4), k is the
critical level of the capital-labor ratio in time t+1 below which in the absence of public investment
in education in period t individuals who do not receive transfers from their parents in period t do
not transfer income to their offspring in period t+ 1. That is, Iit+1 ≤ θ and therefore bit+1 = 0.
In order to assure that investment in human capital will begin in a period where the poor
do not invest in physical capital, it is assumed therefore that44
ek ≤ k. (A2)
As follows from (2), k = [θ/(1− α)A]1/α. Since ek = α/(1−α)γ, Assumption A2 implies therefore
that γ > (αα(1− α)1−αA/θ)1/α.
Lemma 3 Under Assumptions A1 and A2, there are no intergenerational transfers among workers
(i.e., bPt = 0) as long as public education is not established, i.e.,
bPt = 0 for 1 ≤ t ≤ etProof. As follows from Proposition 1, the definition of et, and Assumption A1 that assures
that et > 1, for 0 ≤ t < et, there is no investment in public education and hence ht+1 = 1.
Hence, since Assumption A2 implies that kt ≤ k and therefore w(kt) ≤ θ, it follows that bPt+1 =
max[β[w(kt+1)− θ] , 0] = 0 if bPt = 0. Since bP0 = 0 it follows therefore that b
Pt = 0 for 1 ≤ t ≤ et. ¤
The capital-labor ratio in period t+1, as follows from (16), (17), proposition 1, and Lemma
3, is
kt+1 = κ(bRt , 0) = λbRt for t ∈ [0,et) (22)
44This assumption is designed to simplify the presentation of the results. As will become apparent, even ifAssumption A2 would be violated, the Capitalists would have an incentive to support the education of Workers.
23
and the level of output per-worker in period t+ 1, yt+1, as follows from (1) and (22), is45
yt+1 = A[λbRt ]
α for t ∈ [0,et). (23)
The Dynamics of Output Per-Worker
The evolution of output per-worker in Regime I is driven in this regime by physical capital
accumulation. The income of the Workers is not sufficiently high to permit intergenerational
transfers and therefore savings, and the evolution of intergenerational transfers among Capitalists
determines therefore the accumulation of physical capital and thus the growth of output per-worker
over Regime I.
The evolution of the intergenerational transfers in the economy, as follows from (21) and Lemma
3, are
bRt+1 = ψR(bRt , 0) = max[β[w(λbRt ) + b
Rt R(λb
Rt )− θ], 0];
bPt+1 = 0,
⎫⎬⎭ for t ∈ [0,et) (24)
where bR0 > 0 is given. Hence in Regime I the dynamical system is fully determined by the evolution
of transfers across members of group R.
Hence, the evolution of the entire dynamical system in Regime I can be represented by
the evolution of output per-worker. Since the aggregate income of the Capitalists (group R) is
(λ(1−α)+α)yt, (where α is the share of capital in total output that is fully owned by the Capitalistsand λ(1− α) is the labor share
of group R), it follows from (7), (23) and (24) that the evolution of output per-worker in
the time period t ∈ [0,et) isyt+1 = max [A{β{[λ(1− α) + α]yt − λθ}}α, 0] ≡ φI(yt), for yt ∈ [0, ey), (25)
where ey = Aekα.In order to assure that the economy would ultimately take off from Regime I to Regime
II (i.e., in order to assure that consistently with empirical evidence the process of development is
marked by human capital accumulation) it is assumed that the technology is sufficiently productive.
That is,
A > eA (A3)
where eA is the critical level of technology such that φI(ey) = ey.4645Note that since the size of the population is 1, Yt+1 = yt+1.46As follows from (25), eA = [1+ λ(1−α)αβγαθα−α]/[β(α+ (1−α)λ)]. It should be noted that a sufficiently high
level of A that satisfies Assumption A3 does not violate Assumption A2. An increase in A and γα holding theirratio unchanged, does not affect A2 and increases A relative to eA.
24
Figure 4 depicts the properties of φI(yt) over the interval yt ∈ (0, ey], as established in thefollowing Lemma and Corollary.
Lemma 4 Under Assumptions A2 and A3, there exists y ∈ (0, ey); ey = Aekα, such that the proper-ties of φI(yt) in the interval yt ∈ [0, ey] are
φI(yt) = 0 for yt ≤ y∂φI(yt)/∂yt > 0 for y < yt ≤ ey∂2φI(yt)/∂[yt]
2 < 0 for y < yt ≤ eyφI(yt) > yt for yt = ey
Proof. As follows from (25), φI(yt) = 0 for yt ≤ y = λθ/(λ(1 − α) + α), and ∂φI(yt)/∂yt > 0,
and ∂2φI(yt)/∂[yt]2 < 0 for y < yt ≤ ey = A{α/[(1 − α)γ]}α. Consistently with Assumption A2,
there exist a sufficiently small γ such that ey > y.47 Furthermore, Assumption A3 assures that
φI(yt) > yt for yt = ey ¤
Corollary 2 Under Assumptions A2 and A3, the dynamical system φI(yt) has two steady-state
equilibria in the interval yt ∈ [0, ey]; A locally stable steady-state, y = 0, and an unstable steady-
state, yu ∈ (y, ey).As follows from the Corollary, if yt < yu then output per worker contract over time and
the system converges to the steady-state equilibrium y = 0. If yt > yu then output per worker
expands over the entire interval (yu, ey], crossing into Regime II. Hence, in order to assure that
the process of development takes off it is assumed that
y0 ∈ (yu, ey). (A4)
implying that bR0 ∈ ([yu/Aλα]1/α, [ey/Aλα]1/α) = ([yu/Aλα]1/α,ek/λ). Hence, Assumption A1 is asubset of Assumption A4.
Thus, in Regime I, output per-capita increases monotonically over time due to the process of
capital accumulation. Consistent with historical evidence, the wage-rental ratio, which is uniquely
determined by the capital-labor ratio, increases as well. Moreover, the accumulation of physical
capital by the Capitalists in Regime I raises gradually the potential role of the education of the
Workers in sustaining the profit rates of the Capitalists. Ultimately, the Capitalists find it ben-
eficial to support public education, and the economy enters into Regime II where the process of
development is fueled by human capital accumulation as well as physical capital accumulation.
47If γ < γ < γ where γ = [αα(1−α)1−αA/θ]1/α < γ = [αα(1−α)1−αA/θ+α1+α(1−α)−αA/λθ]1/α, then Assump-tion A2 and ey > y are satisfied simultaneously. Furthermore, as discussed in the previous footnote, Assumptions A3and ey > y are mutually consistent.
25

5.2 Regime II: Education and the Decline of the Class Structure
These later stages of development are characterized by the onset of the gradual demise of the
Capitalists-Workers class structure. The importance of human capital in sustaining the profits
of Capitalists increases sufficiently. The Capitalists find it beneficial to financially support public
education, and ultimately Workers, as well as Capitalists, are engaged in physical capital accumu-
lation.
5.2.1 Stage I: The Birth of Public Schooling
In Stage I of Regime II, the economy witnesses the birth of public education. The Capitalists
invest in human capital as well as in physical capital, whereas workers acquire education financed
by the Capitalists. The wage income, however, is not sufficiently high so as to permit physical
capital accumulation by the Workers.
Stage I of Regime II is defined as the time interval et ≤ t < bt, where bt is the first time periodin which Workers (group P ) are engaged in intergenerational transfers, permitting physical capital
accumulation by the offspring. Although workers acquire education financed by the Capitalists,
their income level is not sufficiently high so as to permit transfer to their offspring.
The capital-labor ratio in period t+1, as follows from (16), (17), proposition 1, and Lemma
3,
kt+1 = κ(bRt , 0) =(1− τ t)λb
Rt
h(τ tλbRt )for t ∈ [et,bt). (26)
where ∂κ(bRt , 0)/∂bRt > 0. The level of output per-worker in period t+ 1, yt+1, as follows from (1)
and (26), is
yt+1 = A[(1− τ t)λbRt ]
α[h(τ tλbRt )]
1−α for t ∈ [et,bt). (27)
The Dynamics of Output Per-Worker
The evolution of output per-worker in Stage I of Regime II is driven by the accumulation
of human capital as well as physical capital. The income of the Workers is still not sufficiently
high to permit intergenerational transfers. Intergenerational transfers among the Capitalists are
the sole source of physical capital accumulation, as well as of governmental expenditure on public
education, and they determine therefore the growth of output per-worker over Stage I of Regime
II.
The evolution of the economy in the time interval et ≤ t < bt, as follows from (21), is given by
bRt+1 = ψR(bRt ; 0) = β[w(kt+1)h(τ tλbRt ) + (1− τ t)b
Rt R(kt+1)− θ]
bPt+1 = ψP (bRt ; 0) = 0
⎫⎬⎭ for t ∈ [et,bt), (28)
where kt+1 = κ(bRt , 0).
26
Hence, the evolution of the entire dynamical system in Stage I of Regime II can be represented
by the evolution of output per-worker. Since the aggregate income of the Capitalists (group R) is
(λ(1−α) +α)yt, as is the case in Regime I, it follows from (7) (23) and (28) that the evolution of
output per-worker in the time period t ∈ [et,bt) is,yt+1 = A{(1− τ t)β{[λ(1− α) + α]yt − λθ}}α{h(τ tβ{[λ(1− α) + α]yt − λθ})}1−α
≡ φII(yt) for yt ∈ [ey, by), (29)
where ey = Aekα, τ t = argmaxφII(yt), and by = θ/(1 − α), is the critical level of the output per-
worker such that the income level of individuals who do not receive transfer from their parents
(i.e., members of group P ) equals θ. As follows from (4), as long as yt < by, the Workers (membersof group P ) do not transfer income to their offspring. Hence, since ey = A{α/[(1−α)γ]}α, it followsfrom assumption A2 that by > ey.
In order to assure that the economy would ultimately take off from Stage I to Stage II within
Regime II it is assumed that the technology is sufficiently productive. That is,
A ≥ bA ≡ θ1−α
ααβα (1− α)1−α(A5)
where as established in the following Lemma, bA is a sufficiently high level of technology such thatφII(by) > by.48
If Assumption A5 is violated then there are two feasible scenarios. The economy may
converge to a steady-state equilibrium in the interval (ey, by) with public education, where individualsare identical in their level of human capital and in their wage income, but they differ in their
level of wealth. Alternatively, the economy may proceed, nevertheless, to a long-run steady-state
equilibrium above by, where offspring of the Capitalists and the Workers are indistinguishable.Figure 4 depicts the properties of φII(yt) over the interval yt ∈ [ey, by], as derived in the
following Lemma and Corollary.
Lemma 5 Under Assumptions A2, A3 and A5, the properties of φII(yt) in the interval yt ∈ [ey, by]are
∂φII(yt)/∂yt> 0
∂2φII(yt)/∂y2t< 0
∂φII(y)/∂yt= ∂φI(y)/∂ytφII(yt) > yt
Proof.
∂φII(yt)/∂yt > 0 and ∂2φII(yt)/∂y2t < 0, and ∂φII(y)/∂yt = ∂φI(y)/∂yt as follows from (29) and
(25) noting that h(e) is strictly concave and τ t = argmax yt+1.
48Assumptions A3 and A5 imply that A ≥ max[ eA, bA], where, eA > bA↔ γ >hθ1−αβ(α+(1−α)λ)−ααβα(1−α)1−α
λθα2αβ1+α(1−α)
i1/α.
27
Since τ t = argmax yt+1, it follows from Lemma 4 that φII(ey) = φI(ey) > ey. Moreover, for yt ∈ [ey, by],
yt+1 = φII(yt) > A{β{[λ(1 − α) + α]yt − λθ}}α (i.e., yt+1 is larger than the output per workerfor τ t = 0.) Since (1 − α)yt ≤ θ for yt ∈ [ey, by], it follows that A{β{[λ(1 − α) + α]yt − λθ}}α ≥A [β (yt − θ)]α . Hence, noting that by = θ/(1−α), it follows that φII(yt) > A
³βθα1−α
´α, and therefore
φII(by) > by if A³ βθα1−α
´α> θ
1−α and thus if A >bA(which is satisfied by A5. Thus, since φII(ey) > ey,
φII(by) > by and ∂2φII(yt)/∂y2t < 0, it follows that φ
II(yt) > yt for all yt ∈ [ey, by]. ¤
Corollary 3 The dynamical system φII(yt) has no steady-state equilibria in the interval yt ∈ [ey, by].The dynamical system φII(yt) has no steady-state equilibria in the interval yt ∈ [ey, by] and
the transfers within each dynasty of type R expand over the entire interval crossing into Stage II.
Hence, in Stage I of Regime II, the economy witnesses the birth of public education. The
Capitalists invest in physical capital, and workers as well as the Capitalists acquire education
financed by the Capitalists. The wage income, however, is not sufficiently high so as to permit
physical capital accumulation by the Workers. During Stage I of Regime II, the accumulation
of physical and human capital increases wage income further, and ultimately the economy enters
Stage II of Regime II in which the wage income is sufficiently high so as to permit the accumulation
of physical capital by the Workers.
5.2.2 Stage II: The Demise of the Class Society
The accumulation of physical and human capital during Stage I of Regime II, increases wage
income further and ultimately, the economy enters Stage II of Regime II in which the wage income
is sufficiently high so as to permit the accumulation of physical capital by the Workers.
Stage II of Regime II is defined as t ≥ bt. In this time interval all individuals acquire educationand transfer income to their offspring.
The level of output per-worker in Stage II of Regime II, exceeds by and the wage income ofall members of society exceeds θ. Hence, it follows from (16) and (7), that
Bt = λbRt + (1− λ)bPt = β[yt − θ]. (30)
The capital-labor ratio in period t+ 1, as follows from (11) and (30), is therefore
kt+1 =(1− τ t)β[yt − θ]
h(τ tβ[yt − θ])for t ∈ [bt,∞). (31)
and the level of output per-worker in period t+ 1, yt+1, as follows from (1) and (31), is
yt+1 = A[(1− τ t)β[yt − θ]]α[h(τ tβ[yt − θ])]1−α for yt > by. (32)
28
The Evolution of Output Per-Worker
The evolution of output per-worker in Stage II of Regime II is driven by the accumulation of
human capital as well as physical capital. The income of the Workers is sufficiently high to permit
intergenerational transfers and the Workers as well as the Capitalists contribute to physical capital
accumulation and governmental expenditure on public education, and they determine therefore the
growth of output per-worker over Stage II of Regime II.
The evolution of output per worker in Stage II of Regime II is independent of the distribution
of intergenerational transfers across classes and hence the evolution of the economy can be fully
characterized by the evolution of output per-worker. As follows from (1) and (31), the evolution
of output per worker over the time interval t > bt isyt+1 = A[(1− τ t)β[yt − θ]]α[h(τ tβ[yt − θ])]1−α ≡ φIII(yt) for yt > by. (33)
where τ t = argmaxφIII(yt), and therefore ∂φ
III(yt)/∂yt > 0. Furthermore, ∂φII(y)/∂yt < ∂φIII(y)/∂yt,
and it follows from the concavity and the boundary conditions of h(e) and the aggregate production
function that ∂2φIII(yt)/∂y2t < 0, and limyt→∞ ∂φIII(yt)/∂yt = 0.
Figure 4 depicts the properties of φI(yt),φII(yt),φ
III(yt) over the interval yt ∈ [ey, by]. Itshould be noted that while the function is smooth at y, (i.e., when pubic education is adopted)
since existing resources are optimally reallocated between investments in human and physical
capital, there is a kink at y (i.e., when workers start investing in physical capital) due to the fact
that a larger fraction of income and the marginal propensity to save increases.
Corollary 4 Under A2-A5, output per worker yt increases monotonically in Stage II of Regime
II and converges to a steady-state equilibrium y > by.Proof. Follows directly from the properties of φIII(yt). ¤
Proposition 2 Under A2-A5, the economy converges to a steady-state equilibrium in which the
income gap between the offspring of the Capitalists and the Workers is eliminated.
Proof. As follows from the properties of (9),(15),(30),(31) and Corollary 4, noting that limyt→∞ dφIII(yt)/dyt =
0, the economy converges to a unique steady-state vector (y, k, τ , h). Since
bit+1 = β[w(kt+1)ht+1 + (1− τ t)bitR(kt+1)− θ] for t > bt , i = P.R (34)
where as follows from (14) ht+1 = h(kt+1) and τ t = τ(kt+1) and therefore
bit+1 = ζ(bit, kt+1). (35)
29
Hence, given k it follows that, in the steady state, bi = biwhere b
i= ζ(b
i, k), otherwise (since
∂ζ(bi, k)/∂bi ≥ 0) either [bi decreases (increases) for all i and thus k decreases (increases)] or
[bR increases indefinitely and bP decreases to zero, and thus k increases] in contradiction to the
stationarity of k. Hence, bR= ζ(b
R, k), b
P= ζ(b
P, k), and k = κ(b
R, bP). Since ζ(bi, k) =
β[hw(k)− θ+(1− τ)R(k)bit], and since in Stage II of Regime II , h(e)w(k)− θ > 0, it follows form
the existence of bi, that (1− τ)R(k) < 1 and therefore bi is unique for all i; bi = β[hw(k)− θ]/[1−β(1− τ)R(k)]. ¤
The growth of income per capita in the two stages of Regime II is an outcome of physical and
human capital accumulation. Moreover, the capital-labor ratio increases, and hence, as observed
historically, the wage-rental ratio increases as well.49
In Stage II of Regime II the economy witnesses the demise of the class society. The de-
scendents of Workers as well as Capitalists acquire human capital as well as physical capital, the
income gap between the classes narrows and vanishes in the long-run, and class characteristics
fade.
5.3 Analysis
In Regime I, physical capital is scarce, the contribution of human capital to the production process
does not justify investment in human capital, and the process of development is fueled by capital
accumulation. The wage rate is lower than the critical level that would enable individuals who
do not own any capital to engage in intergenerational transfers (and thus savings). Workers,
therefore, consume their entire wages; they are not engaged in saving, capital accumulation, and
intergenerational transfers. Their descendents, therefore, are also unable to engage in saving and
intergenerational transfers and Workers are in a temporary steady-state equilibrium in which there
is no investment in either physical or human capital. In contrast, the income of the Capitalists,
who own the entire stock of capital in the economy, is sufficiently high, permitting intergenerational
transfers and capital accumulation. Intergenerational transfers among the Capitalists increase over
time and the stock of physical capital in the economy, therefore, increases as well. During this
regime, physical capital accumulation by the Capitalists decreases the return to physical capital and
the importance of potential human capital formation in sustaining the return to capital increases.
However, as long as the Capitalists generate a higher rate of return from a direct investment in
physical capital, rather than from supporting the education of Workers, which would complement
49The rise in k, despite the accumulation of human capital is a result of the concavity of the human capitalproduction function. Suppose not. If k would decline over time, the return to capital would rise and the return toeducation would decline, bringing about a reduction in investment in education and a rise in investment in physicalcapital and thus an increase in k, in contradiction to the assumed reduction in k.
30
their capital in the production process, the qualitative structure of the economy remains unchanged.
The Workers remains in a poverty trap, the Capitalists get richer, and the process of development
is based solely on physical capital accumulation.
The accumulation of physical capital by the Capitalists in Regime I gradually raises the
potential role of the education of the Workers in sustaining the profit rates of the Capitalists.
Ultimately, the Capitalists find it beneficial to support public education, and the economy en-
ters Regime II where the process of development is fueled by human as well as physical capital
accumulation.
Regime II is subdivided into two stages. In Stage I of Regime II, the economy witnesses
the birth of public education. The Capitalists invest in physical capital, and workers, as well as
the Capitalists acquire education financed by the Capitalists. The wage income, however, is not
high enough to permit physical capital accumulation by the Workers. During Stage I of Regime
II, the accumulation of physical and human capital increases wage income further, and ultimately
the economy enters Stage II of Regime II in which the wage income is high enough to permit the
accumulation of physical capital by the Workers.
In Stage II of Regime II the economy witnesses the demise of the class society. The de-
scendents of Workers as well as Capitalists acquire human capital as well as physical capital, the
income gap between the classes narrows, vanishing in the long-run, and class characteristics fade.
6 Evidence from the Balfour Act — UK 1902
The basic premise of this research, regarding the positive attitude of the capitalists towards educa-
tion reforms, is examined based on the voting patterns on the Balfour Act of 1902 — the proposed
education reform in the UK that marked the consolidation of a national education system and the
creation of a publicly supported secondary school system. Although the formal model abstracts
from heterogeneity in the degree of complementarity between human and physical capital in dif-
ferent industries and thus does not permit for a conflict of interests among capitalists about the
timing of education reforms, the theory implies that variations in the degree of complementarity
between human capital and physical capital and land in various industries would induce variations
in the level of support for education reforms among capitalists and landowners. In particular, vari-
ations in the support of MPs for the Balfour Act would reflect the variations in the skill intensity
in the counties they represent. Higher support for the Balfour Act would be expected from MPs
who represent industrial skill-intensive counties.
We construct a data set gathered from a variety of historical sources on the third (and final)
31
vote on the Balfour act.50 The data, as described in detail in the Appendix, combines the home
district and party affiliation for each MP with his voting record on the Balfour Act. In addition,
the data includes county level data on the percentage of employment in skill-intensive industries,
income per capita, degree of urbanization, and religious affiliation.
As is apparent from Table 1, which summarizes the voting patterns on the Balfour Act
according to party affiliation, Conservatives and Unionists were predominantly supportive of the
Balfour Act while Liberals were predominantly opposed. Nevertheless, variations in the voting
patterns within each of the parties due to a significant number of abstentions, is sufficient for a
significant identification.
We perform Ordered Probit regressions to examine the effect of the percentage of employ-
ment in industrial skill-intensive sectors in each MP’s county on the voting patterns on the Balfour
Act. As documented in Table 2, there exists a significant positive effect of the percentage of em-
ployment in industrial skill-intensive sectors in a county on the propensity of their MPs to vote in
favor of the education reform proposed by the Balfour Act of 1902.
Regression (1) in Table 2 examines the effect of the employment in industrial skill-intensive
sectors in each MP’s county on the voting patterns on the Balfour Act, controlling for county’s
per-capita income. Consistent with the main hypothesis of this research, the regression shows a
significant positive effect of the ratio of employment in industrial skill-intensive sectors in each
MP’s county on the propensity to vote for the proposed education reform.
The proposed Balfour Act of 1902 provided a role for the Anglican Church in the provision
of education. As a result the non-conformists objected to the Act. In Regression (2), therefore,
we control for the percentage of non-conformists in each county. The regression indeed shows a
significant negative effect of the fraction of non-conformists in the county on the support for the
Act by the MPs representing that county. Nevertheless, the effect of the ratio of employment in
industrial skill-intensive sectors on the vote remains significantly positive.
In Regression (3) we add dummy variables to control for counties in Scotland and Wales.
Scotland and Wales tended to view themselves as independent nations within the UK. This may
have led them to vote systematically for or against certain measures based solely on nationalistic
grounds (e.g., being against universal education because it imposes “English” education). Since
counties in Scotland and Wales were characterized by lower income, a higher fraction of Catholics, a
50In previous education acts, the third and final vote was conducted by voice, and no record exists of the distributionof votes across MPs. Some records of votes on various amendments for these education bills do exist, but it is notpossible to specify clearly which of the votes were crucial, or whether an affirmative vote is actually in support ofthe ultimate education bill.
32
smaller urban sector, and a smaller skill-intensive industrial sector, relative to England, excluding
these controls might cause omitted variable biases in the other coefficient estimates. However,
despite the incorporation of the Scotland and Wales dummies, the effect of the ratio of employment
in industrial skill-intensive sectors on the vote remains significantly positive.
In Regression (4) we control for party affiliation. As is apparent from Table 1, there is a
strong correlation between party affiliation and voting patterns: Conservatives and Unionists were
predominantly supportive of the Balfour Act while Liberals were predominantly opposed. Indeed,
the regression shows that affiliation with the Liberal party has a highly significant negative effect
on the support for the Balfour Act, and affiliation with the Conservative party therefore has
a highly significant positive effect on the support for the Act. Nevertheless, the effect of the
ratio of employment in industrial skill-intensive sectors on the vote remains significantly positive.
Further, as established in Table 3, the ratio of employment in industrial skill-intensive sectors has
a significantly positive effect on the support for the Conservative party, which, in turn, supports
the education act.
Finally, in Regression (5) of Table 2, we control for the percentage of the urban population
within each county. This is an attempt to separate between demand for education that stems
from skill-intensive industrial development, and other sources of demand for education in an urban
environment. In particular, support for public education may reflect the desire to reduce crime,
which is prevalent in an urban environment.51. Interestingly, urbanization has no significant effect
on the support for the education act and the effect of the weight of the skill-intensive industrial
sector remains significantly positive.
Table 3 reports the results of probit regressions of the effect of the ratio of employment in
the skill-intensive industrial sector in each MP’s county on party affiliation, controlling for the
percentage of employment in skill-intensive industries, per-capita income, degree of urbanization,
and religious affiliation in each county, and incorporating the Scotland and Wales dummies. It
shows that the ratio of employment in the skill-intensive industrial sector in each MP’s county has
a significant positive effect on affiliation with the Conservative party.52
Hence, it is apparent from Tables 2 and 3 that the ratio of employment in the skill-intensive
industrial sector has a significant positive impact on the vote on the Balfour Act through two
channels. The first is the direct channel, holding party constant. The second is through its
51Unfortunately, direct crime statistics at the county level are unavailable for this period.52Adjusting the probit results to obtain marginal effects, we find that a one percentage point increase in the ratio
of employment in the industrial sector raises the probability of belonging to the Liberal party by approximately 1.7percentage points.
33
influence on the MP’s party itself.53
7 Concluding Remarks
We argue that capital accumulation in the process of industrialization gradually intensified the
relative scarcity of skilled labor and generated an incentive for human capital accumulation. Due
to the complementarity between physical and human capital in production, the capitalists were
among the prime beneficiaries of the accumulation of human capital by the masses. They therefore
had the incentive to support the provision of public education that improved their economic well-
being, contributing significantly to the demise of the existing class structure. Thus, in contrast
to the conventional wisdom, the theory suggests that the demise of the capitalists-workers class
structure was affected significantly by the outcome of a productive cooperation between capitalists
and workers, rather than an outcome of a divisive class struggle. The basic premise of this research,
regarding the positive attitude of capitalists towards education reforms, is supported empirically
by a newly constructed data set on the voting patterns on England’s education reform proposed
in the Balfour Act of 1902.
The political reforms that accompanied the education reforms in Europe during the 19th
century, may be viewed as either an attempt by the capitalists to broaden the coalition that
supports vocational public education, against the wishes of the clergy and the landlords for whom
human capital was less complementary in production,54 or as a by-product of the educational
reforms that made political inequality harder to sustain or justify. One may argue that political
reforms during the 19th century shifted the balance of power towards the working class and enabled
workers to implement education reforms against the will of the capitalists. The evidence, however,
does not support this alternative hypothesis. Education reforms took place in autocratic states
that did not relinquish political power throughout the 19th century, and major reforms occurred in
societies in the midst of the process of democratization well before the stage in which the working
class constituted the majority among the voters.
53It should be noted that the voting patterns of the industrial-intensive counties on alternative bills in the same yeardiffered significantly. In particular, the share of employment in the industrial sector is an insignificant explanatoryvariable for the 1902 vote on an income tax bill using an ordered probit with the same set of controls. This resultsuggests that representatives from industrial-intensive counties do not vote uniformly on each bill.54Cultural differences across societies may have resulted in the failure of some societies to adopt efficient institutions
(e.g., Greif (1994)). Therefore, the timing of education reforms relative to the process of development may differacross countries.
34
Data Appendix
Vote on the Balfour Act — The voting record of each MP on the Balfour Act is gathered from
the supplement to the British Parliamentary Papers, the Division Lists. The record specifies who
voted in favor of and who voted against the bill.55 The list of the names and home districts of each
of the British MPs during the vote on the Balfour Act is collected from The British Parliamentary
Papers. Party affiliation for each MP during the vote on the Balfour Act is taken from Who’s Who
of British Parliament.56
Income per capita — Income per capita in each county is estimated for each county using
income tax data. Source: Hechter (2001).
Percent in skill-intensive occupations — the proportion of the population in a county that is
employed in skill-intensive industrial occupations. Sources: British Regional Employment Statis-
tics, 1901, Lee (1979) and Hechter (2001).57 Based on the British Regional Employment Statistics,
1901, Hechter divides the total employment in each county into four categories: Agricultural, Man-
ufacturing, Middle Class, and Civil Servant. The Middle Class category consists of skill-intensive
manufacturing occupations (Mechanical Engineering, Instrument Engineering, Electrical Engineer-
ing, Distributive Trades, Insurance/Banking/Finance, Professional and Scientific, and Miscella-
neous). Employment in theses occupations is used in the regression to capture the percentage of
employment in skill-intensive occupations.
Percent non-conformists — the proportion of the population in a county that is non-conformists.
Source: Hechter (2001).
Percent urban — the proportion of the population in a county that resides in urban areas.
Source: Hechter (2001).
55Any member not listed abstained. Of the 562 MPs, 226 abstained.56We used only those MPs in either the Liberal or Conservative parties, the dominant parties of the time. The
only other party of significance was the Unionist party, but membership in this party was not mutually exclusivewith the other two. Many members of the Liberal and Conservative parties were Unionists as well. In addition,there are a number of Unionist-only members. Excluding pure Unionists and other members of smaller parties, weremove 101 MPs from the sample. In addition, we were unable to locate party affiliation data on six of the MPs,and removed them from the sample.57The British Regional Employment Statistics provides a breakdown of employment by industry in each county
in the UK, an area that encompasses several districts. Unfortunately, the employment data is not at a district leveland each MP was therefore assigned the percentage appropriate to the county within which his district existed.
35
References
[1] ABRAMOVITZ, M. (1993), “The Search of the Sources of Growth: Areas of Ignorance, Oldand New”, Journal of Economic history, 53, 217-243.
[2] ABRAMOVITZ, M. and DAVID, P.A. (2000), “American Macroeconomic Growth in the Eraof knowledge-Based Progress: The Long-Run Perspective”, ENGERMAN, S.L. and GALL-MAN, R.E. (eds.), The Cambridge Economic History of the United States (Cambridge; NewYork NY: Cambridge University Press).
[3] ACEMOGLU, D. (1998), “Why Do New Technologies Complement Skills? Directed TechnicalChange and Wage Inequality”, Quarterly Journal of Economics, 113, 1055-1089.
[4] ACEMOGLU, D. and ROBINSON, J. A. (2000), “Why Did the West Extend the Fran-chise? Democracy, Inequality and Growth in Historical Perspective”, Quarterly Journal ofEconomics, 115, 1167-1199.
[5] ALTONJI, J. G., HAYASHI, F. and KOTLIKOFF, L. J. (1997), “Parental Altruism and InterVivos Transfers: Theory and Evidence”, Journal of Political Economy, 105, 1121- 1166.
[6] ANDERSON, R. D. (1975), Education in France 1848-1870. (Oxford: Clarendon Press).
[7] BENABOU, R. (1996), “Inequality and Growth”, NBER Macroeconomics Annual, 11, 11-74.
[8] BENABOU, R. (2000), “Unequal Societies: Income Distribution and the Social Contract”,American Economic Review, 90, 96-129.
[9] BENABOU, R. (2002), “Tax and Education Policy in a Heterogeneous-Agent Economy: Whatlevels of Redistribution Maximize Growth and Efficiency?”, Econometrica, 70, 481-517.
[10] BERGHAHN, V. R. (1994): Imperial Germany, 1871-1914, Economy, Society, Culture andPolitics (Providence: Berghahn Books).
[11] BERTOCCHI, G., and SPAGAT, M. (2004), “The Evolution of Modern Educational Systems:Technical Vs. General Education, Distributional Conflict and Growth,” Journal of Develop-ment Economics, 73, 559-582.
[12] BOURGUIGNON, F. and VERDIER, T. (2000), “Oligarchy, Democracy, Inequality andGrowth”, Journal of Development Economics, 62, 285-313.
[13] BOWEN, J. (1981), A History of Western Education. Vol. 3: The Modern West Europe andthe New World (New York: St. Martin’s Press).
[14] BOWLES, S., and GINTIS, H. (1975), “Capitalism and Education in the United States”,Socialist Revolution, 5, 101-138.
[15] CABALLE, J., and SANTOS, M. (1993), “On Endogenous Growth with Physical and HumanCapital”, Journal of Political Economy, 101, 1042-1067.
[16] CAMERON, R. (1989), A Concise Economic History of the World from Paleolithic Times tothe Present (Oxford: Oxford University Press).
[17] CASELLI, F. (1999), “Technological Revolutions”, American Economic Review, 89, 78-102.
[18] CIPOLLA, C. M. (1969), Literacy and Development in the West (Harmondsworth: PenguinBooks).
[19] CLARK, G. (2003), “The Condition of the Working-Class in England, 1200-2000: MagnaCarta to Tony Blair”, UC Davis.
36
[20] CLARK, G. (2002), “Farmland Rental Values and Agrarian History: England and Wales,1500-1912,” European Review of Economic History, 6, 281-309.
[21] CRAIG, F. W. S. (1989), British Electoral Facts, 1832-1987 (Brookfield: Gower Press).
[22] CRESSY, D. (1980) Literacy and the Social Order: Reading and Writing in Tudor and StuartEngland (Cambridge: Cambridge University Press).
[23] CUBBERLY, E. P. (1920), The History of Education (Cambridge: Cambridge UniversityPress).
[24] DOEPKE, M. and ZILIBOTTI, F. (2005), “The Macroeconomics of Child Labor Regulation”,American Economic Review, forthcoming.
[25] DURLAUF, S. N. (1996), “A Theory of Persistent Income Inequality”, Journal of EconomicGrowth, 1, 75-94.
[26] DYNAN, K.E., SKINNER, J. and ZELDES, S. (2004), “Do the Rich Save More?” Journal ofPolitical Economy, 112, 397-444.
[27] ENGERMAN, S. and SOKOLOFF, K. L. (2000), “Factor Endowment, Inequality, and Pathsof Development among New World Economies,” UCLA.
[28] FERNANDEZ, R. and ROGERSON, R. (1996), “Income Distribution, Communities, and theQuality of Public Education”, Quarterly Journal of Economics, 111, 135-164.
[29] FIELD, A. (1976), “Educational Reform and Manufacturing Development in Mid-NineteenthCentury Massachusetts”, Journal of Economic History, 36, 263-266.
[30] FEINSTEIN, C. (1988), “The Rise and Fall of the Williamson Curve”, Journal of EconomicHistory 48, 699—729.
[31] FLORA, P., KRAUS, F. and PFENNING, W. (1983), State, Economy and Society in WesternEurope 1815-1975, Vol. I. (Chicago: St. James Press).
[32] GALOR, O. and ZEIRA, J. (1993), “Income Distribution and Macroeconomics”, Review ofEconomic Studies, 60, 35-52.
[33] GALOR, O. and TSIDDON, D. (1997), “Technological Progress, Mobility, and Growth”,American Economic Review, 87, 363-82.
[34] GALOR, O. and MOAV, O. (2000), “Ability Biased Technological Transition, Wage Inequalityand Growth”, Quarterly Journal of Economics, 115, 469-498.
[35] GALOR, O. and MOAV, O. (2004) “From Physical to Human Capital: Inequality in theProcess of Development”, Review of Economic Studies, 71, 1001-1026.
[36] GALOR, O., MOAV, O. and VOLRATH, D. (2003), “Land Inequality and the Emergence ofHuman Capital Promoting Institutions” Brown University.
[37] GOLDIN, C. (1999), “Egalitarianism and the Returns to Education During the Great Trans-formation of American Education”, Journal of Political Economy, 107, S65-S94.
[38] GOLDIN, C. and KATZ, L.F. (1998), “The Origins of Technology-Skill Complementary”,Quarterly Journal of Economics, 113, 693-732.
[39] GOLDIN, C. and KATZ, L.F. (2001), “The Legacy of U.S. Educational Leadership: Notes onDistribution and Economic Growth in the 20th Century”, American Economic Review, 91,18-23.
37
[40] GRAFF H. J. (1987), The labyrinths of literacy: reflections on literacy past and present.(London: Falmer Press).
[41] GREEN, A. (1990), Education and State Formation (New York: St. Martin’s Press).
[42] GREIF, A. (1994), “Cultural Beliefs and the Organization of Society - A Historical and The-oretical Reflection on Collectivist and Individualist Societies”, Journal of Political Economy,102, 912-950.
[43] GROSSMAN, H. I. (1994), “Production, Appropriation, and Land-Reform”, American Eco-nomic Review, 84, 705-712.
[44] GROSSMAN, H. I. and Kim, M. (1999), “Education Policy: Egalitarian or Elitist?” BrownUniversity.
[45] HASSLER, J. and RODRIGUEZ MORA, J. (2000), “Intelligence, Social Mobility, andGrowth”, American Economic Review, 90, 888-908.
[46] HECHTER, M. (2001), Internal Colonialism Study: National Integration in the British Isles,1851-1966 (Ann Arbor: Inter-University Consortium for Political and Social Research).
[47] HURT, J. (1971), Education in Evolution (London: Paladin).
[48] KALDOR, N. (1957), “A Model of Economic Growth”, Economic Journal, 67, 591-624.
[49] KATZ, L. F. and MURPHY, K. M. (1992), “Changes in Relative Wages 1963-1987: Supplyand Demand Factors”, Quarterly Journal of Economics, 107, 35-78.
[50] KIRBY, P. (2003), Child Labor in Britain, 1750-1870 (Basingstoke: Palgrave-MacMillan).
[51] KOSSMAN E. H. (1978), The Low Countries 1780-1940 (Oxford: Clarendon Press).
[52] KURIAN, G. T. (1994), Datapedia of the U.S. 1790-2000, America Year by Year. (Lonham,MD: Bernan Press).
[53] KEYNES, J.M. (1920), “The Economic Consequences of the Peace” (London: Macmillan andCo. Limited).
[54] LANDES, D. S. (1969), The Unbound Prometheus. Technological Change and Industrial De-velopment in Western Europe from 1750 to the Present (Cambridge: Cambridge UniversityPress.)
[55] LEE, C. (1979), British Regional Employment Statistics,1841-1971 (Cambridge: CambridgeUniversity Press).
[56] LEVY-LEBOYER, M., and BOURGUIGNON, F. (1990), The French Economy in the Nine-teenth Century (Cambridge: Cambridge University Press).
[57] LEWIS, W.A. (1954), “Economic Development with Unlimited supply of Labor”, The Manch-ester School, 22, 139-91.
[58] LINDERT, P. H., and WILLIAMSON, J. G. (1976), “Three Centuries of American Inequal-ity”, Research in Economic History, 1, 69-123.
[59] LIZZERI, A and PERSICO, N. (2004), “Why Did the Elites Extend the Suffrage? Democracyand the Scope of Government, With an Application to Britain’s Age of Reform”, QuarterlyJournal of Economics, 119, 707 - 765.
[60] MALLINSON, V. (1963), Power & Politics in Belgian Education 1815 to 1961 (London:Heinemann Educational Books).
38
[61] MAOZ, Y.D. and MOAV, O. (1999), “Intergenerational Mobility and the Process of Develop-ment”, Economic Journal, 109, 677-97.
[62] MATTHEWS, R.C., FEINSTEIN, C.H. and ODLING-SMEE, J.C. (1982), British EconomicGrowth 1856-1973 (Stanford: Stanford University Press).
[63] McCLELLAND, C. E. (1980), State, Society, and University in Germany: 1700-1914 (Cam-bridge: Cambridge University Press).
[64] MENCHIK, P. and DAVID, M. (1983), “Income Distribution, Lifetime Savings, and Be-quests”, American Economic Review, 73, 672—690.
[65] MITCH, D. (1992), The Rise of Popular Literacy in Victorian England: the Influence ofPrivate Choice and Public Policy (Philadelphia: University of Pennsylvania Press).
[66] MITCH, D. (1993), “The Role of Human Capital in the First Industrial Revolution,” Mokyr,J. (ed.) The British Industrial Revolution: An Economic Perspective (Boulder: WestviewPress) 267-307.
[67] MOKYR, J. (1990) The Lever of Riches (New York: Oxford University Press).
[68] MOKYR, J. (1993), “The New Economic History and the Industrial Revolution”, Mokyr,J. (ed.), The British Industrial Revolution: an Economic Perspective (Boulder Colorado:Westview Press), 1-131.
[69] MOKYR, J. (2001), “The Rise and Fall of the Factory System: Technology, Firms, andHouseholds since the Industrial Revolution, Carnegie-Rochester Conference Series On PublicPolicy, 55, 1-45.
[70] MOKYR, J. (2002), The Gifts of Athena: Historical Origins of the Knowledge Economy(Princeton: Princeton University Press).
[71] MORRISSON, C. and SNYDER, W. (2000), “Income Inequalities in France from the EarlyEighteenth Century to 1985”, Revue Economique, 51, 119-154.
[72] MULLER, D. K. (1987), “The Process of Systematization: the Case of German SecondaryEducation”, MULLER, D. K., RINGER, F. and SIMON, B. (eds.), The Rise of the ModernEducational System (Cambridge: Cambridge University Press).
[73] MULLIGAN, C. B. and SALA-I-MARTIN, X. (1993), “Transitional Dynamics in Two SectorModels of Endogenous Growth”, Quarterly Journal of Economics, 108, 739-773.
[74] O’ROURKE, K. H., TAYLOR, A. M. and WILLIAMSON, J. G. (1996), “Factor Price Con-vergence in the Late Nineteenth Century”, International Economic Review, 37, 499-530.
[75] RINGER, F. (1979), Education and Society in Modern Europe (Bloomington: Indiana Uni-versity Press).
[76] SANDBERG, L. G. (1979), “The Case of the Impoverished Sophisticate: Human Capitaland Swedish Economic Growth before World War I”, The Journal of Economic History, 39,225-241.
[77] SANDERSON, M. (1995), Education, Economic Change and Society in England 1780-1870(Cambridge: Cambridge University Press).
[78] SCHLEUNES, K. A. (1989), Schooling and Society: The politics of Education in Prussia andBavaria 1750-1900 (Providence: Berg Publishers).
[79] SCOTT, F. D. (1977), Sweden: The Nation’s History (Minneapolis: University of MinnesotaPress).
39
[80] SIMON, B. (1987), “Systematization and Segmentation in Education: the Case of England”MULLER, D. K., RINGER, F. and SIMON, B.(eds.), The Rise of the Modern EducationalSystem (Cambridge: Cambridge University Press).
[81] SMELSER, N. (1991), Social Paralysis and Social Change: British Working-Class Educationin the Nineteenth Century (Berkeley: University of California Press).
[82] SPREE, R. (1977), Die Wachstumszyklen der deutschen Wirtschaft von 1840 bis 1880 (Berlin:Dunker & Humboldt).
[83] TAYLOR, A. M. (1999), “Sources of Convergence in the Late Nineteenth Century”, EuropeanEconomic Review, 43, 1621-1645.
[84] THOMPSON, E.P. (1968), The Making of the English Working Class (London: Penguin).
[85] TIPTON, F. B. (2003), A History of Modern Germany since 1815, (Berkeley: University ofCalifornia Press)
[86] TOMES, N. (1981), “The Family, Inheritance and the Intergenerational Transmission of In-equality”, Journal of Political Economy, 89, 928-958.
[87] WIENER, M. J. (1981), English Culture and the Decline of the Industrial Spirit, 1850-1980(Cambridge: Cambridge University Press).
[88] WILLIAMSON, J. G. (1985), Did British Capitalism Breed Inequality? (Boston: Allen &Unwin).
[89] WOLTHUIS, J. (1999), Lower Technical Education in the Netherlands 1798-1993: the Riseand Fall of a Subsystem (http://www.ub.rug.nl/eldoc/dis/ppsw/j.wolthuis/titlecon.pdf.).
40
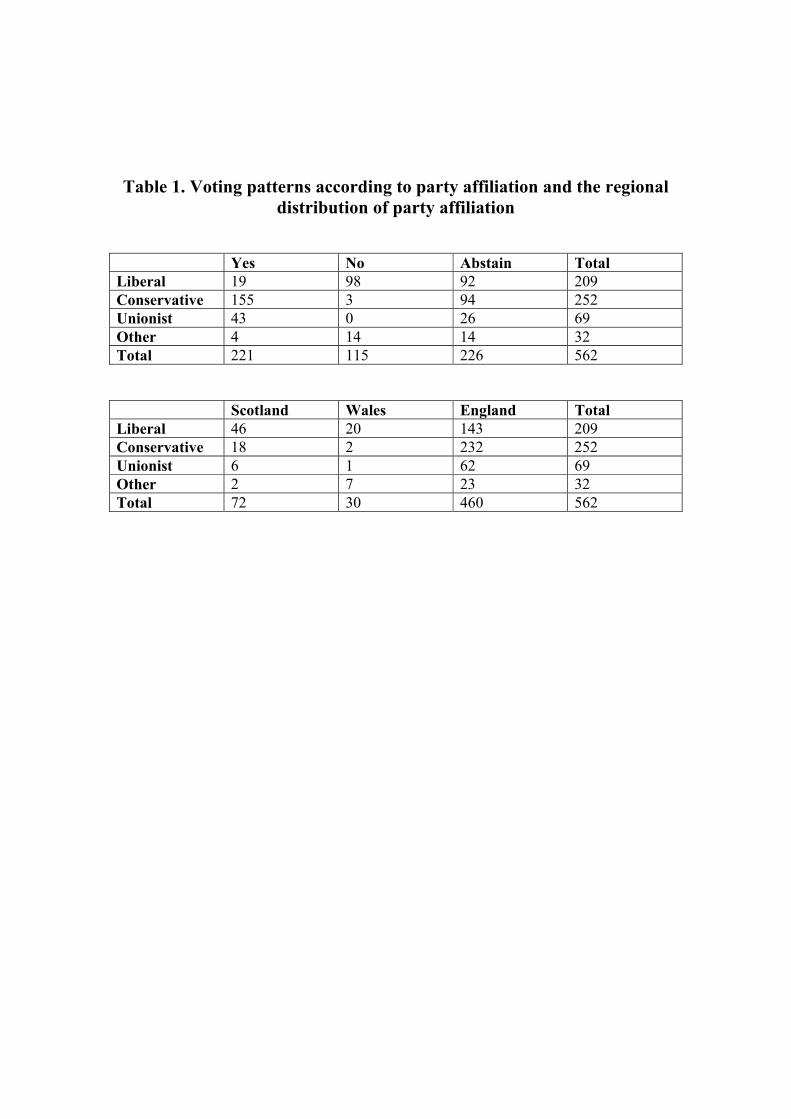
Table 1. Voting patterns according to party affiliation and the regional distribution of party affiliation
Yes No Abstain Total Liberal 19 98 92 209 Conservative 155 3 94 252 Unionist 43 0 26 69 Other 4 14 14 32 Total 221 115 226 562 Scotland Wales England Total Liberal 46 20 143 209 Conservative 18 2 232 252 Unionist 6 1 62 69 Other 2 7 23 32 Total 72 30 460 562
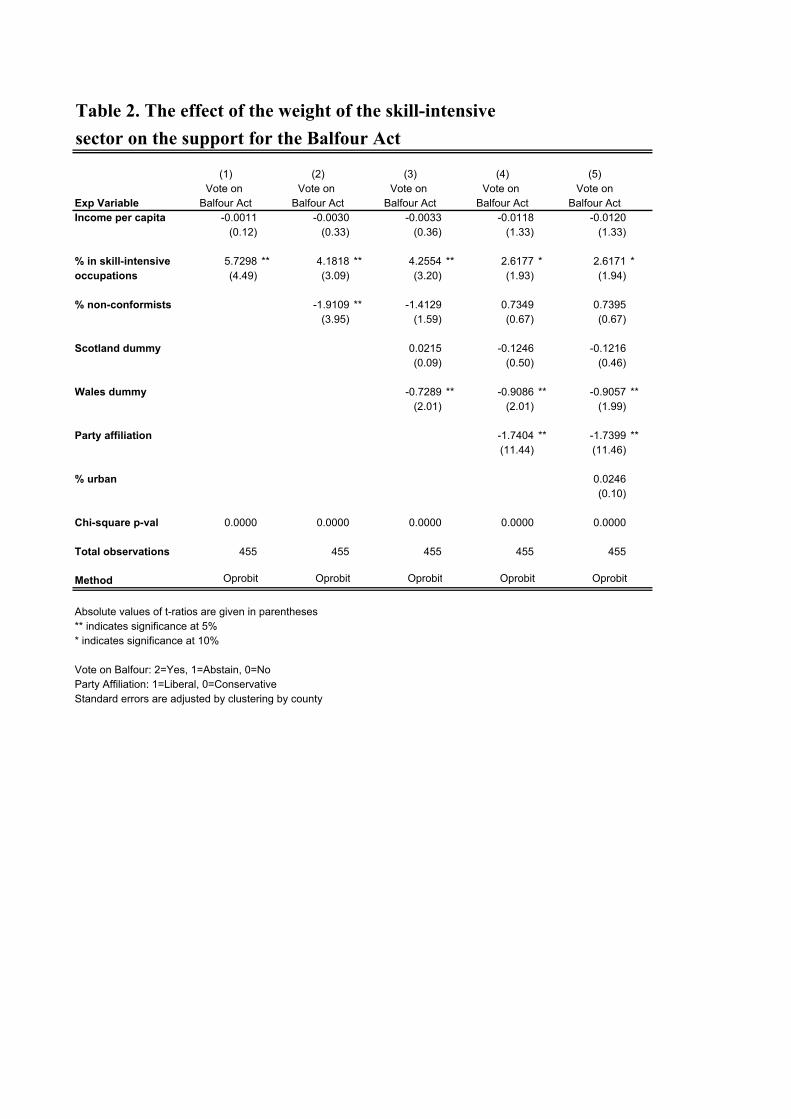
Table 2. The effect of the weight of the skill-intensivesector on the support for the Balfour Act
(1) (2) (3) (4) (5)Vote on Vote on Vote on Vote on Vote on
Exp Variable Balfour Act Balfour Act Balfour Act Balfour Act Balfour ActIncome per capita -0.0011 -0.0030 -0.0033 -0.0118 -0.0120
(0.12) (0.33) (0.36) (1.33) (1.33)
% in skill-intensive 5.7298 ** 4.1818 ** 4.2554 ** 2.6177 * 2.6171 *occupations (4.49) (3.09) (3.20) (1.93) (1.94)
% non-conformists -1.9109 ** -1.4129 0.7349 0.7395(3.95) (1.59) (0.67) (0.67)
Scotland dummy 0.0215 -0.1246 -0.1216(0.09) (0.50) (0.46)
Wales dummy -0.7289 ** -0.9086 ** -0.9057 **(2.01) (2.01) (1.99)
Party affiliation -1.7404 ** -1.7399 **(11.44) (11.46)
% urban 0.0246(0.10)
Chi-square p-val 0.0000 0.0000 0.0000 0.0000 0.0000
Total observations 455 455 455 455 455
Method Oprobit Oprobit Oprobit Oprobit Oprobit
Absolute values of t-ratios are given in parentheses** indicates significance at 5%* indicates significance at 10%
Vote on Balfour: 2=Yes, 1=Abstain, 0=NoParty Affiliation: 1=Liberal, 0=ConservativeStandard errors are adjusted by clustering by county

Table 3. The effect of the weight of the skill-intensivesector on MP's party affiliation
(1) (2) (3) (4)Party Party Party Party
Exp Variable Affiliation Affiliation Affiliation AffiliationIncome per capita -0.0139 -0.0119 -0.0112 -0.0009
[-0.00548] [-0.00469] [-0.0044] [-0.0035](1.03) (1.02) (0.97) (0.81)
% in skill-intensive -7.2551 ** -4.6358 ** -4.3282 ** -4.1988 **occupations [-2.8581] [-1.8287] [-1.7091] [-1.6587]
(3.69) (2.31) (2.23) (2.23)
% non-conformists 3.3908 ** 4.1208 ** 4.2180 **[1.3375] [1.6272] [1.6664]
(4.66) (2.78) (3.01)
Scotland dummy -0.3227 -0.3936[-0.1239] [-0.1499]
(0.72) (0.98)
Wales dummy 0.1406 0.0815[0.0559] [0.03234]
(0.28) (0.17)
% urban -0.2887[-0.11402]
(0.72)
Chi-square p-val 0.0003 0.0000 0.0000 0.0000
Total observations 455 455 455 455
Method Probit Probit Probit Probit
Absolute values of t-ratios are given in parentheses** indicates significance at 5%* indicates significance at 10%
Marginal effects are reported in square brackets
Vote on Balfour: 2=Yes, 1=Abstain, 0=NoParty affiliation: 1=Liberal, 0=ConservativeStandard errors are adjusted by clustering by county

Figure 1. Schooling, Factor Prices and Inequality England 1770-1920
Figure 1(c). The evolution of wages and rental rates: England, 1770-1920Source: real wage (Clark (2003)); rental rates (Clark (2002))
40.0
60.0
80.0
100.0
120.0
140.0
160.0
180.0
200.0
1770 1790 1810 1830 1850 1870 1890 1910
Inde
x of
wag
e an
d re
ntal
rate
s
(100
in 1
870)
Capital Rental Rate
Wage
Land Rental Rate
Figure 1(d). The evolution of the wage-rental ratio: England, 1770-1920Source: real wage (Clark (2003)); return to capital (Clark (2002))
60.0
80.0
100.0
120.0
140.0
160.0
180.0
1770 1790 1810 1830 1850 1870 1890 1910
Inde
x of
wag
e - re
ntal
ratio
(1
00 in
187
0)
Figure 1(a). The evolution of the fraction of children aged 5-14 in public primary schools: England 1855-1920
Source: Flora et al. (1983)
0%
20%
40%
60%
80%
100%
1770 1790 1810 1830 1850 1870 1890 1910
Scho
ol e
nrol
men
t rat
es
Figure 1(b). The evolution of earnings inequality: England, 1820-1913 Source: Williamson (1985)
30
40
50
60
70
1770 1790 1810 1830 1850 1870 1890 1910
Wea
lth sh
are
of to
p de
cile
0.3
0.4
0.5
0.6
0.7
0.8
Gin
i Ind
ex
Share of Top Decile
Gini Index

Figure 2. Schooling, Factor Prices and Inequality France 1770-1930
Figure 2(b). The evolution of wealth inequality: France, 1788-1929. Source: Morrisson and Snyder (2000)
30
35
40
45
50
55
60
1770 1790 1810 1830 1850 1870 1890 1910 1930
Wea
lth sh
are of
top
deci
le
Figure 2(d). The evolution of the wage-rental ratio:France 1820 -1913
Source: Levy-Leboyer and Bourguignon (1990)
0
5
10
15
20
25
30
35
1770 1790 1810 1830 1850 1870 1890 1910 1930
Inde
x of
wag
e - r
enta
l rat
io
Figure 2(c). The evolution of the real wage and rental rate:France 1820 -1913
Source: Levy-Leboyer and Bourguignon (1990)
40
50
60
70
80
90
100
110
1770 1790 1810 1830 1850 1870 1890 1910 1930
Inde
x of
real w
age
(100
in
190
2)
2
3
4
5
6
7
Ren
tal r
ate
Rental Rate
Wage
Figure 2(a). The evolution of the fraction of children aged 5 -14 in primary schools: France, 1830 -1910
Source: Flora et al. (1983)
0%
20%
40%
60%
80%
100%
1770 1790 1810 1830 1850 1870 1890 1910
Scho
ol e
nrol
men
t rat
es
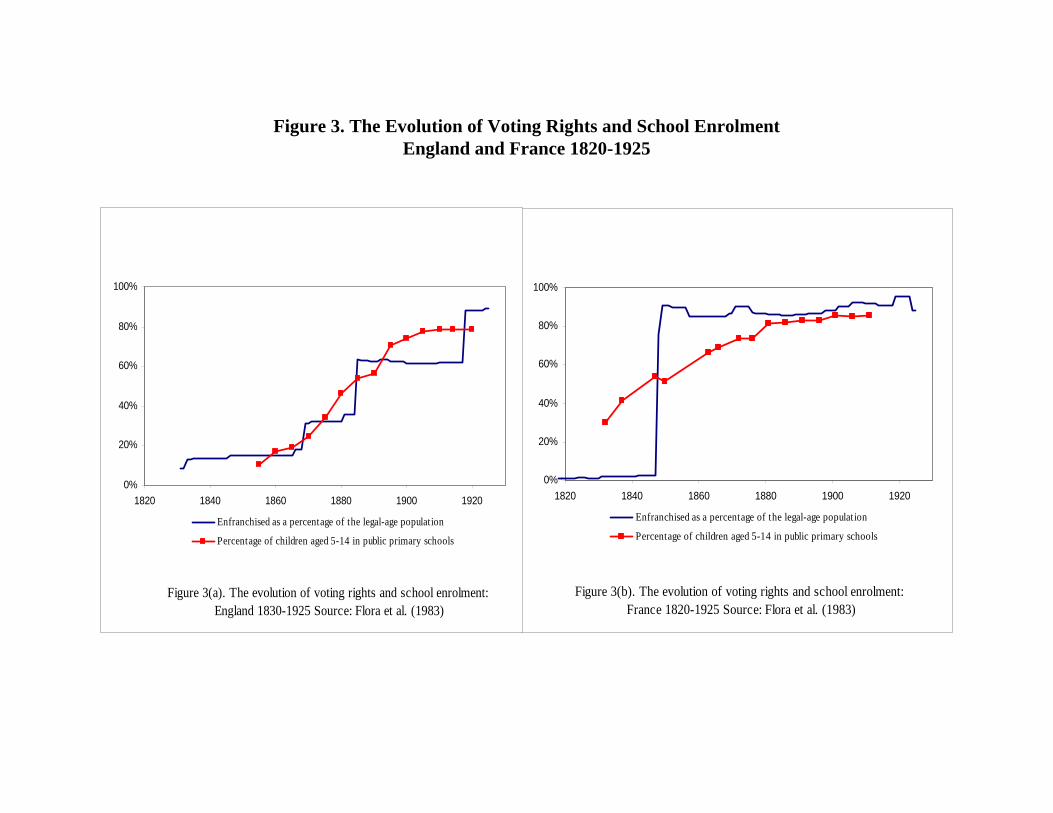
Figure 3. The Evolution of Voting Rights and School EnrolmentEngland and France 1820-1925
Figure 3(b). The evolution of voting rights and school enrolment: France 1820-1925 Source: Flora et al. (1983)
0%
20%
40%
60%
80%
100%
1820 1840 1860 1880 1900 1920
Enfranchised as a percentage of the legal-age population
Percentage of children aged 5-14 in public primary schools
Figure 3(a). The evolution of voting rights and school enrolment: England 1830-1925 Source: Flora et al. (1983)
0%
20%
40%
60%
80%
100%
1820 1840 1860 1880 1900 1920
Enfranchised as a percentage of the legal-age population
Percentage of children aged 5-14 in public primary schools
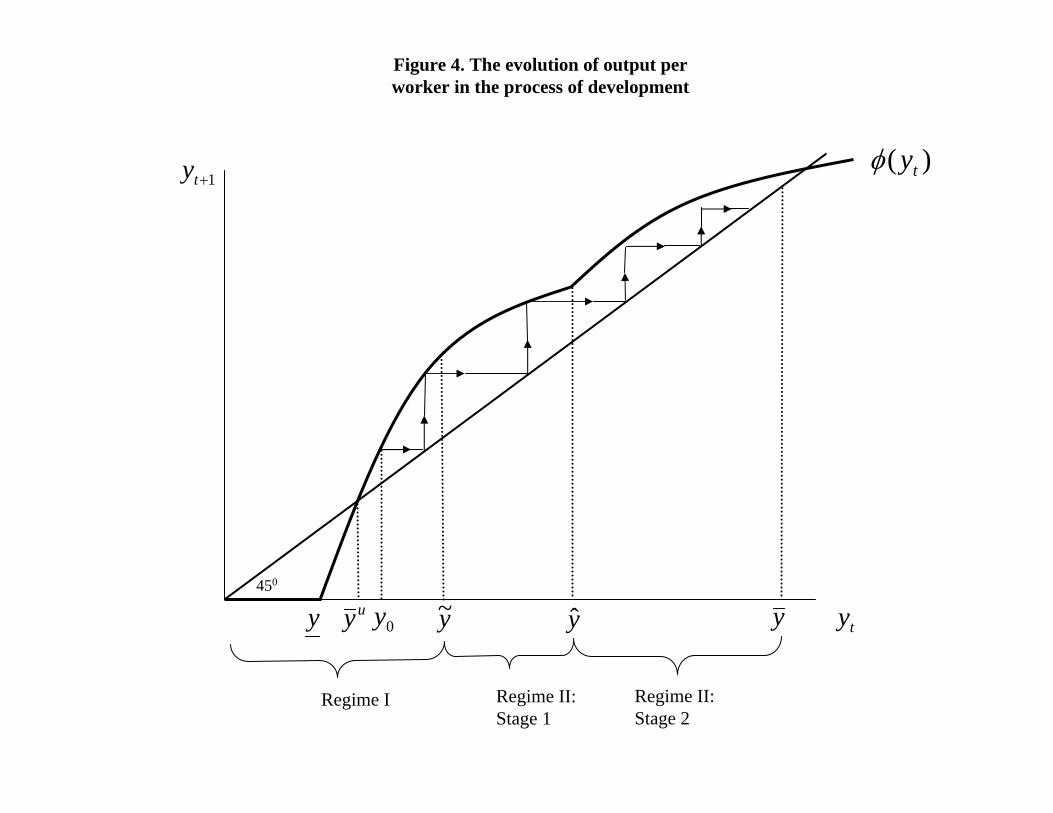
)( tyφ
450
y tyy~ yuy y0y
Figure 4. The evolution of output per worker in the process of development
Regime I Regime II: Stage 1
Regime II: Stage 2
1+ty