Embed Size (px)
Citation preview
Danish Rational Economic Agents Model, DREAM
Poul Schou
March 2, 2006
Outline of presentation
• Purpose & short history of CGE models
• How to build and use a large-scale CGE model: Danish Rational Economic Agents Model (DREAM)
Computable General Equilibrium models
• A child of economic theory
• Main purpose: Quantify magnitudes of theoretical results (important for policy)
Definition of a CGE model
• ”Equilibrium”: supply and demand behaviour determined by optimizing agents. Flexible prices of (at least) some goods and factors of production → market equilibria
• ”General”: several optimizing agents and markets
• ”Computable”: use data from real economies, solved on a computer
History of CGE models
• Leif Johansen (1960)
• 1960’es:structure of (theoretical) general equilibrium models developed and refined, cf. Arrow & Hahn, 1971
• Development of large-scale macro-econometric models
• Scarf (1967) designs algorithm for numerically specified G.E. models
History: 1970’es
• New economic regime: Rising energy prices, break-down of international monetary system, stagflation
• Better hardware, software and data bases→ increasing interest for CGE models, also among decision-makers
Advantages of CGE models
• Quantify magnitudes
• Identify net results of counter-acting effects
• Able to cope with complex problems
• Solid micro-economic foundation
• Able to analyze welfare effects
• Able to analyze policy fundamentally different from initial position
Drawbacks of CGE models
• Specification of functional forms
• Calibration
• Economic theory not sufficiently well-developed in all fields
• May become rather complex
Static CGE models
• ”Big and simple”
• Very disaggregated input-output system
• Perfect competition in all markets
• Only distortion: taxes/duties/subsidies
• Main uses: Trade agreements & trade policy, environmental policy
Dynamic CGE models
• Explicit periodization
• Rich theoretical structure
• Rational (forward-looking) expectations → simultaneous models → huge computational power requirements
• Aggregate production structure
Danish CGE models
• GESMEC (1993, Economic Council)
• Mobi-DK
• EPRU model
• Various ad hoc models
Motivation for DREAM
• Wish to create comprehensive model for long-term simulations of Danish economy
• Utilize state-of-the-art economic theory
• Analyze demographic changes• Evaluate structural reforms with respect to
welfare, intergenerational distribution, macroeconomic performance and fiscal sustainability
Institutional setting
• Research project initiated in January 1997
• Originally located in Statistics Denmark, from 2002 an independent research unit affiliated with the Danish Ministry of Finance
• Independent board
• 8 full-time economists and 3 students
Challenge of building DREAM
• Choose level of details, theoretical setting and data use
• Demographics important → focus on population projections and generations
• Independent population projections
Main principles
• Optimizing households and firms
• Other institutions: Pension funds, government, foreign sector
• Important markets: Labour market, goods markets, financial markets
• Base-line projection is a sequence of temporary equilibria leading to a steady state (Dynamic calibration)

Households I
• OLG model: 85 overlapping generations
• Representative household in each generation
• Consumption-saving choice (intertemporal optimization)
• Labour supply and consumption mix choice (intratemporal optimization)
Households II
• Specification of functional form important
• In principle: Should be based on empirical investigation of elasticities, etc.
• In practice: A few functional forms typically used (C-D, CES, nested CES)
• DREAM typically uses nested CES functions
Firms
• Two private production sectors:
• Construction
• Other private goods
• Representative firms maximize value of shares
Market structure
• Imperfect competition in goods market
• Union-like behaviour in labour market
• → positive profits and unemployment

Government sector
• Produces goods• Collects taxes• Supplies government services• Pays out transfers and subsidies
• Behaves rather mechanically• Very detailed modelling of taxes and
transfers
Calibration and data
• ”Calibration”: Process which determines parameters to make data fit the theoretical model
• Data come from national accounts, labour force statistics, Law Model and various other sources
• How are parameters in DREAM determined?
How do you execute DREAM?
• DREAM runs on a powerful PC
• System of premodels, main model and modules for reporting
• Execution takes about 1 hour
• Main programming language: GAMS
• Presentation is Excel-based
Results
• Projection 100 years ahead
• Calculates NA measures, utility levels of all generations, age-distributed income and wealth levels, etc.
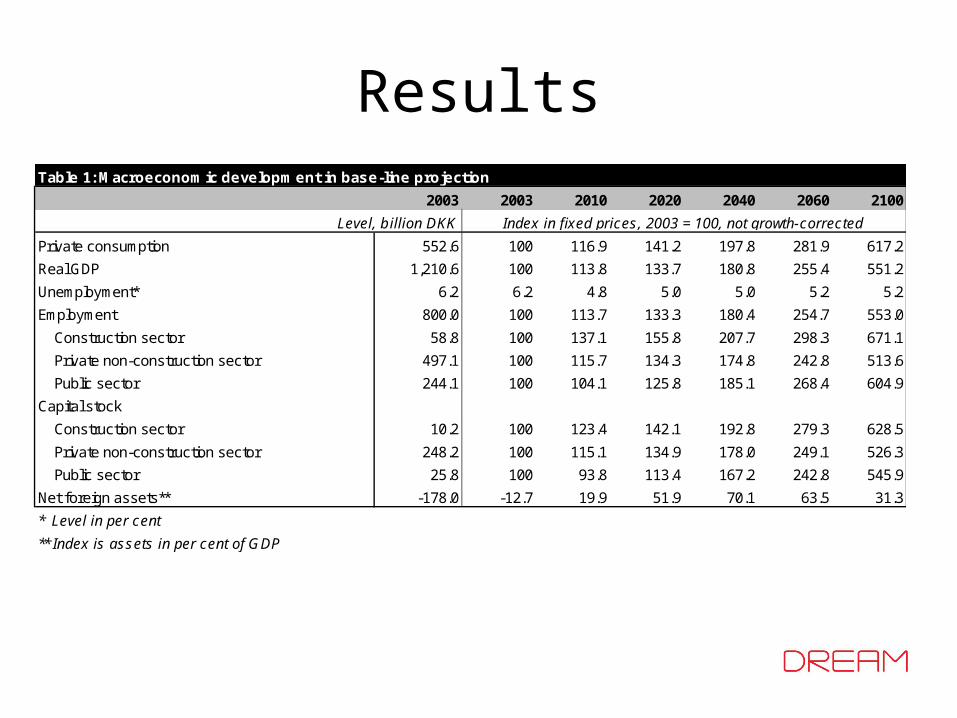
ResultsTable 1: Macroeconomic development in base-line projection
2003 2003 2010 2020 2040 2060 2100
Private consumption 552.6 100 116.9 141.2 197.8 281.9 617.2
Real GDP 1,210.6 100 113.8 133.7 180.8 255.4 551.2
Unemployment* 6.2 6.2 4.8 5.0 5.0 5.2 5.2
Employment 800.0 100 113.7 133.3 180.4 254.7 553.0
Construction sector 58.8 100 137.1 155.8 207.7 298.3 671.1
Private non-construction sector 497.1 100 115.7 134.3 174.8 242.8 513.6
Public sector 244.1 100 104.1 125.8 185.1 268.4 604.9
Capital stock
Construction sector 10.2 100 123.4 142.1 192.8 279.3 628.5
Private non-construction sector 248.2 100 115.1 134.9 178.0 249.1 526.3
Public sector 25.8 100 93.8 113.4 167.2 242.8 545.9
Net foreign assets** -178.0 -12.7 19.9 51.9 70.1 63.5 31.3
* Level in per cent
** Index is assets in per cent of GDP
Index in fixed prices, 2003 = 100, not growth-correctedLevel, billion DKK
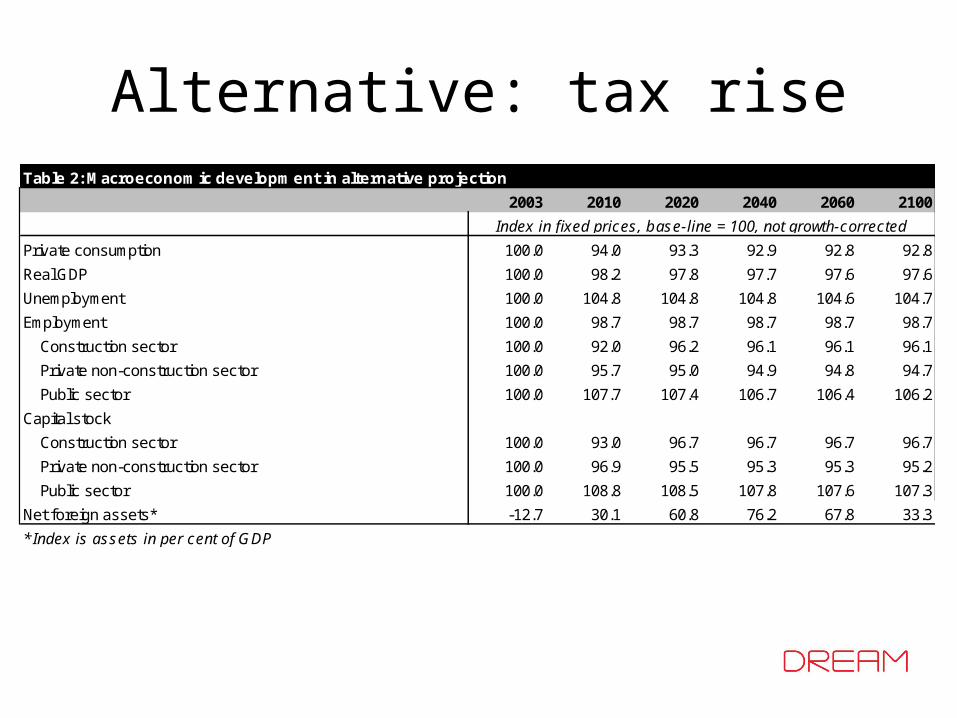
Alternative: tax riseTable 2: Macroeconomic development in alternative projection
2003 2010 2020 2040 2060 2100
Private consumption 100.0 94.0 93.3 92.9 92.8 92.8
Real GDP 100.0 98.2 97.8 97.7 97.6 97.6
Unemployment 100.0 104.8 104.8 104.8 104.6 104.7
Employment 100.0 98.7 98.7 98.7 98.7 98.7
Construction sector 100.0 92.0 96.2 96.1 96.1 96.1
Private non-construction sector 100.0 95.7 95.0 94.9 94.8 94.7
Public sector 100.0 107.7 107.4 106.7 106.4 106.2
Capital stock
Construction sector 100.0 93.0 96.7 96.7 96.7 96.7
Private non-construction sector 100.0 96.9 95.5 95.3 95.3 95.2
Public sector 100.0 108.8 108.5 107.8 107.6 107.3
Net foreign assets* -12.7 30.1 60.8 76.2 67.8 33.3
* Index is assets in per cent of GDP
Index in fixed prices, base-line = 100, not growth-corrected
Endogenous developments
• Terms-of-trade gain
• Unemployment changes
• Capital-labour ratio changes
• ”Free” savings of households disappear
• Endogenous policy adjustment
Main uses of DREAM
• Is fiscal policy sustainable?
• Macroeconomic and welfare consequences of tax, labour market and other reforms
• Consequences of changes in mean life-time, fertility, immigration and integration
• Used for some masters’ theses