Embed Size (px)
Citation preview
D6.7 – Demonstration of international BoD connectivity at 4 Gb/s
Deliverable Number 07
WP # 6
Date 29th March 2012
Authors Jimmy Cullen, The University of ManchesterRalph Spencer, The University of ManchesterPaul Boven, JIVEFedde Bloemhof, JIVERichard Hughes-Jones, DANTENeal Jackson, The University of ManchesterPaul Burgess, The University of Manchester
Document Log
Version Date Summary
8 2012-03-30 Fixed figure numbering, consistency of abbreviations, formatting
6 2012-03-29 Integrated NSI test results
5 2012-03-29 Final draft from Manchester
1 2012-02-22 Document created
1
Table of Contents D6.7 – Demonstration of international BoD connectivity at 4 Gb/s.................................................................11 Introduction...................................................................................................................................................32 Technologies..................................................................................................................................................43 AutoBAHN BoD Circuits..............................................................................................................................54 NSI BoD Circuit............................................................................................................................................75 Test Software.................................................................................................................................................86 Test Routes....................................................................................................................................................97 BoD Reservation Interface...........................................................................................................................108 Tests Performed...........................................................................................................................................129 Results.........................................................................................................................................................1310 Conclusion.................................................................................................................................................1911 Acknowledgements....................................................................................................................................2012 References.................................................................................................................................................21
2
1 Introduction
Very Long Baseline Interferometry (VLBI) is a technique in radio astronomy where radio telescopes at large geographical distances from one another carry out a coordinated observation, creating a virtual radio telescope of truly global scale and unsurpassed resolution. A typical observation lasts for 8 hours and nowadays generates about 4TB of data at each of the participating telescopes. The data from all these telescopes is then shipped to a central processing site where a special purpose supercomputer ('correlator') processes the data. Originally the data was recorded on magnetic tape and shipped, and more recently VLBI has started using standardized packs of hard-disks to ship this data between telescopes and correlator.
The EXPReS project pioneered the use of high performance networks to transmit the data in real time, from telescopes around the globe to the correlator at JIVE in the Netherlands. This method of real-time observing is called e-VLBI. Given the high data rates involved, this generally requires dedicated networking connections between telescopes and correlator center. This traffic is mostly carried by the National Research and Education Networks (NRENs), who have built very advanced high speed networks. Provisioning these international paths across administrative boundaries requires a lot of coordination, hence the network for e-VLBI currently consists of static paths called 'light-paths', even though telescopes are not performing VLBI observations all the time.
Bandwidth on Demand (BoD) is a service that makes it possible to reserve and provision dedicated paths between two points on a network, with a fixed bandwidth and duration. By dynamically creating and tearing down links for varying endpoints, many different users can share the networking resources, thus increasing the usage of the links. The complexity of the BoD system increases when endpoints lie within different NRENs, necessitating the interoperation of separate systems. BoD on international scale would be a very good match to the network usage patterns of e-VLBI, allowing for a more efficient and flexible use of scarce international networking resources.
BoD on an international scale is a novel field, and not available yet as a production service. The testbeds that are currently available only offer limited bandwidth and are meant as a proof-of-concept. But the value of BoD services for end-users is specifically the very high bandwidth paths they offer. For (e-)VLBI, the sensitivity increases with the available bandwidth, and the European VLBI Network is currently growing from 1Gb/s towards generating 4Gb/s per telescope. Upgrading these BoD-testbeds and the connectivity of the participating institutes into these testbeds to support these speeds was a major undertaking. We encountered several unforeseen delays, both in the development of the standards and software, and in building out the network, which unfortunately led to this workpackage being delayed from its planned completion.
This deliverable demonstrates that it is now possible to provision dedicated networking paths of 4Gb/s between several locations within Europe. Performing BoD tests at these speeds has helped push the state of the art forward and demonstrates that BoD may become a valuable tool in the e-sciences.
3
2 TechnologiesSeveral NRENs offer their end-users a BoD service. As different NRENs generally use equipment of different vendors and even have different underlying transport technologies for their network, these BoD services only span a single administrative domain. Examples of such BoD services would be OSCARs and OpenDRAC. When end-users, located in two separate NRENs, require connectivity, one of the major problems to address is the coordination of the allocation and reconfiguration of network resources across multiple administrative domains.
The GÉANT network is an international network connecting many European NRENs. The BoD system offered by GÉANT is the pilot system Automated Bandwidth Allocation across Heterogeneous Networks (AutoBAHN) [1], which provides inter NREN BoD connectivity using the Inter-Domain Controller (IDC) protocol. Reservations are made by users from the AutoBAHN Client Portal [2], a web service provided on the GÉANT website. AutoBAHN provides an integrated business layer for coordinated inter-domain provisioning rather than providing a replacement for existing services. Since the NREN networks are heterogeneous, AutoBAHN is designed to match the capabilities of the interfacing networks for the provisioning of Layer 1 and 2 services.
The Open Grid Forum, in collaboration with NRENs, end-users and industry, are currently working to create a standardised protocol for the delivery of BoD services called the Network Services Infrastructure (NSI) [3,4]. In the NEXPReS project it has been decided that this emerging BoD technology, which is envisaged to become the international standard, and therefore supported globally, will be the BoD technology used in transferring e-VLBI data. Many BoD services already offer an NSI interface (e.g the SURFnet/Netherlight OpenDRAC, the OpenNSA at NORDUnet/Northernlight) and others are implementing or planning to implement NSI as the standard matures (e.g. AutoBAHN and OSCARs).
We realized early on that the nascent state of international BoD presented a risk for the timely completion of this deliverable, and it was decided to use a two-pronged approach: to try and use both AutoBAHN and NSI to achieve BoD at 4Gb/s for this deliverable. As most NRENs offer only one of the two BoD interfaces at this time, this would not cause a competition for resources, and would increase our chances of completing the deliverable. It turned out that both systems became able to support 4Gb/s traffic at almost exactly the same point in time, and we are therefore presenting the results from both tracks side by side.
4
3 AutoBAHN BoD Circuits
In this demonstration, we used six end hosts located at four locations across three countries. The end hosts were located in three separate NRENs:
1. jbnexpres1 located in the Schuster Building, University of Manchester, UK (JANET)2. jbnexpres2 located at the Jodrell Bank Observatory, University of Manchester, UK (JANET)3. EXPReS1 located in the GÉANT Point of Presence (PoP), London, UK4. EXPReS2 located in the Stockholm PoP, Sweden (NORDUnet)5. ara located in Metsähovi Radio Observatory, Aalto University, Finland (Funet)6. watt located in Metsähovi Radio Observatory, Aalto University, Finland (Funet)
The PCs EXPReS1 and EPXReS2 were used in the EXPReS project for link testing, and were re-used in this project. Although the machine names refer to the previous project, all tests reported on in this document were done as part of NEXPReS.
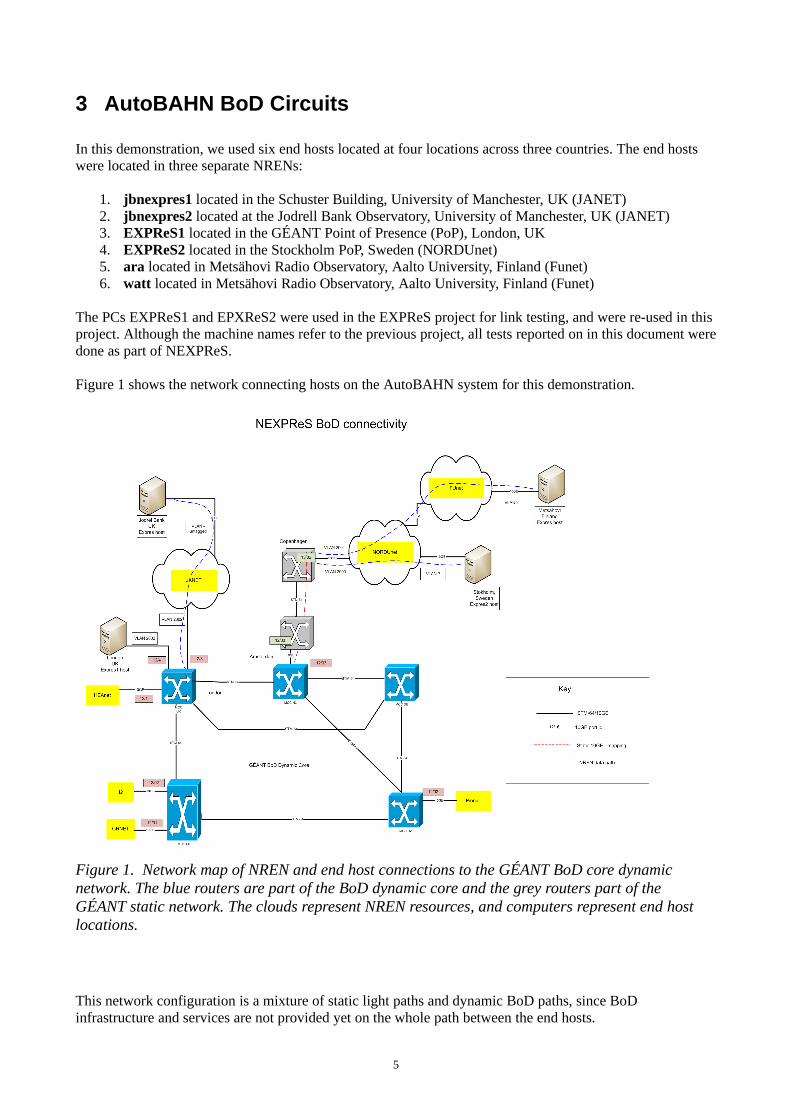
Figure 1 shows the network connecting hosts on the AutoBAHN system for this demonstration.
Figure 1. Network map of NREN and end host connections to the GÉANT BoD core dynamic network. The blue routers are part of the BoD dynamic core and the grey routers part of the GÉANT static network. The clouds represent NREN resources, and computers represent end host locations.
This network configuration is a mixture of static light paths and dynamic BoD paths, since BoD infrastructure and services are not provided yet on the whole path between the end hosts.
5
JANET, the UK's education and research network, provided a static light path from The University of Manchester to the GÉANT PoP in London at 4 Gb/s. In Manchester, the university has its own 10 Gb/s static network that allows end hosts to be located in the Schuster Building (School of Physics and Astronomy) at the main university campus and the Jodrell Bank Observatory, located 30 km south of the main campus.
In the GÉANT PoP in London, an end host was located which connected directly to the AutoBAHN network.
The GÉANT PoP in London connected to the PoP in Amsterdam over the dynamic core, then on to the Copenhagen PoP over a static path. In Copenhagen NORDUnet provided two 4 Gb/s static links, one to the Stockholm PoP and another to the administrative border with Funet. Funet then provided a static 4 Gb/s link through to the Metsähovi Radio Observatory.
3.1 Virtual Local Area Network (VLAN) Tagging
The AutoBAHN system works via creating virtual LANs (VLANs) for data-streams traversing the network. The data is tagged with a VLAN tag (formally described in IEEE 802.1Q [5]), an optional 32 bit field that is added to the Ethernet frame and used by VLAN aware equipment to identify which VLAN a packet belongs to. AutoBAHN was configured to use several VLAN tags to identify sections of the links between end hosts. For example the connection between EXPReS1 and the BoD network was assigned the VLAN tag 2001, and therefore only Ethernet frames containing this tag would be delivered to EXPReS1.
The AutoBAHN system dynamically alters VLAN tags based upon the BoD paths requested by the user. For example, if a path was requested from Metsähovi to Jodrell Bank, Ethernet frames sent over the Funet network are tagged with the ID 2004. When these arrive at the BoD network, via NORDUnet, AutoBAHN dynamically changes this tag value to 2002, which is the identifier for the VLAN across JANET to Jodrell Bank.
6
4 NSI BoD CircuitFor our tests with NSI, we provisioned a circuit from Onsala Space Observatory (OSO) in Sweden, to JIVE in the Netherlands. Real-time transfers of 4Gb/s from OSO to JIVE will closely resemble the real traffic that we intend to use BoD for. During the work for this workpackage, the path was built out and tested in stages. We made use of the following end-hosts:
1. JIVE (various hosts) located in Dwingeloo, the Netherlands2. iperf1.amsterdam1 located in Amsterdam, the Netherlands (SURFnet/Netherlight)3. EXPReS2 located in the Stockholm PoP, Sweden (NORDUnet)4. NEXPReS located in Onsala Space Observatory (OSO), Sweden (NORDUnet/SUNET)
We made use of two NSI instances to direct the traffic:
1. OpenDRAC running on the SURFnet/Netherlight equipment in Amsterdam2. OpenNSA running on the NORDUnet/Northernlight equipment in Stockholm
SUNET configured an extra VLAN from OSO into NORDUnet, and SURFnet provided an extra 10G link from Dwingeloo to Amsterdam, so that the end-point hosts could connect to the dynamic part of the network. The connection from OSO to NORDUnet re-used the 10G interface that was in use for EXPReS2, causing that machine to be disconnected. The contention for this interface caused some unexpected delay in completing the work, as the NSI tests couldn't be performed before the AutoBAHN tests were finished.
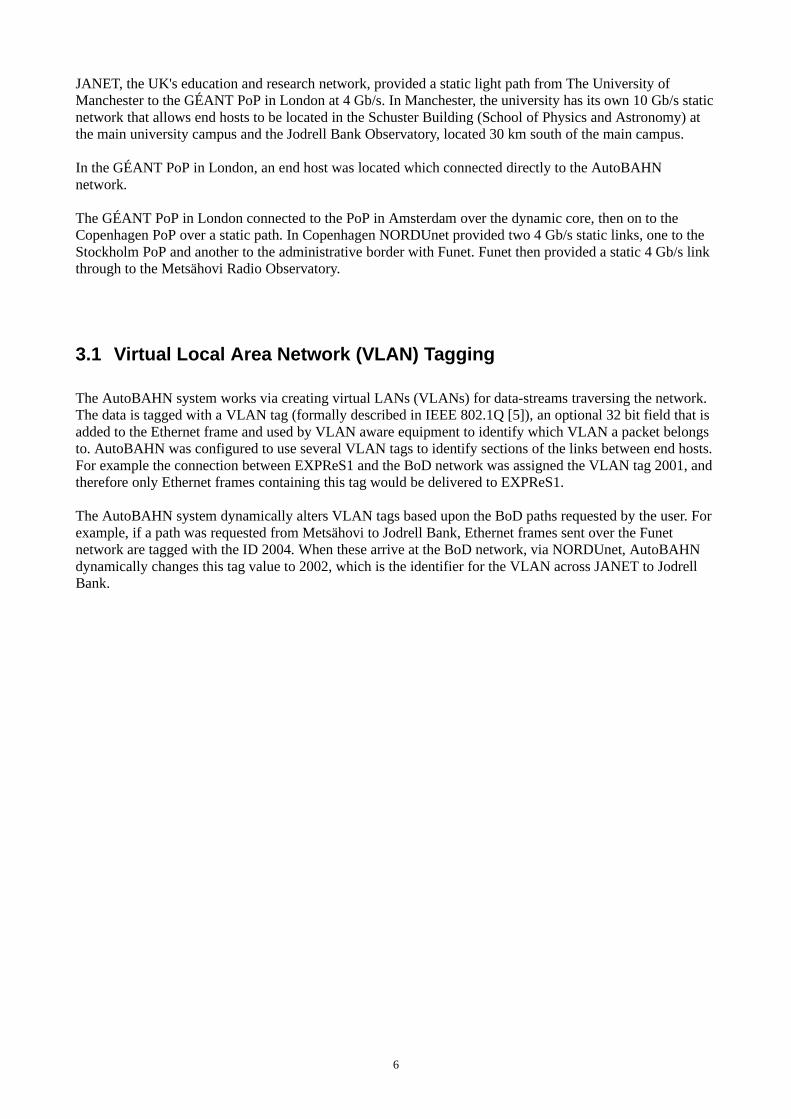
We used the NEXPReS NSI client prototype that was delivered in D6.01 of this workpackage to create the reservations for the paths. Our NSI client connected to both the SURFnet OpenDRAC, and the NORDUnet OpenNSA, to request each leg of the path from the NSA responsible for that administrative domain.
Figure 2: Networking equipment, links and hosts used for the NSI BoD tests.
7
5 Test Software
e-VLBI data is transferred using the User Datagram Protocol (UDP) since this is most appropriate for the high bandwidth constant bit rate data generated at radio telescopes [6,7,8,9]. UDPmon is software that was written specifically to test high speed data links with UDP data, and uses pseudo-random data to simulate real VLBI data.
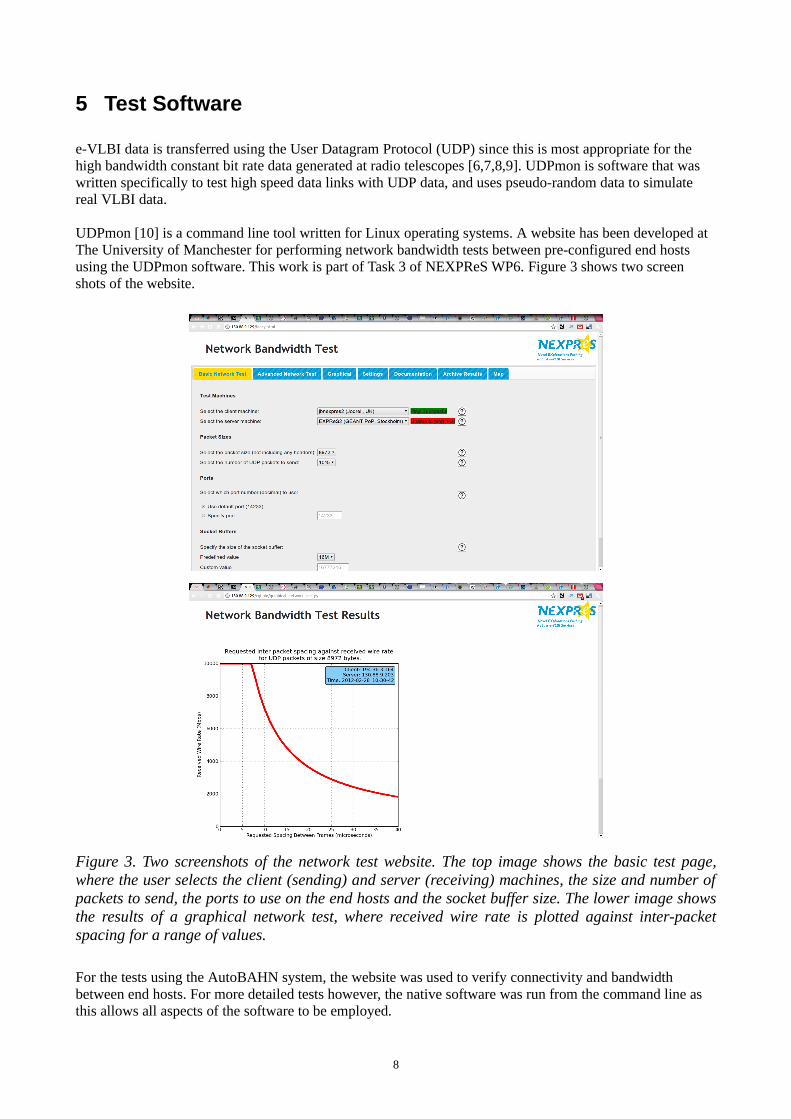
UDPmon [10] is a command line tool written for Linux operating systems. A website has been developed at The University of Manchester for performing network bandwidth tests between pre-configured end hosts using the UDPmon software. This work is part of Task 3 of NEXPReS WP6. Figure 3 shows two screen shots of the website.
Figure 3. Two screenshots of the network test website. The top image shows the basic test page, where the user selects the client (sending) and server (receiving) machines, the size and number of packets to send, the ports to use on the end hosts and the socket buffer size. The lower image shows the results of a graphical network test, where received wire rate is plotted against inter-packet spacing for a range of values.
For the tests using the AutoBAHN system, the website was used to verify connectivity and bandwidth between end hosts. For more detailed tests however, the native software was run from the command line as this allows all aspects of the software to be employed.
8
6 Test Routes
The tests performed over the GÉANT AutoBAHN network connected four destinations in three countries: 1. Jodrell Bank Observatory/University of Manchester, UK,2. GÉANT PoP, London, UK,3. Stockholm PoP, Sweden, and4. Metsähovi Radio Observatory, Aalto University, Finland
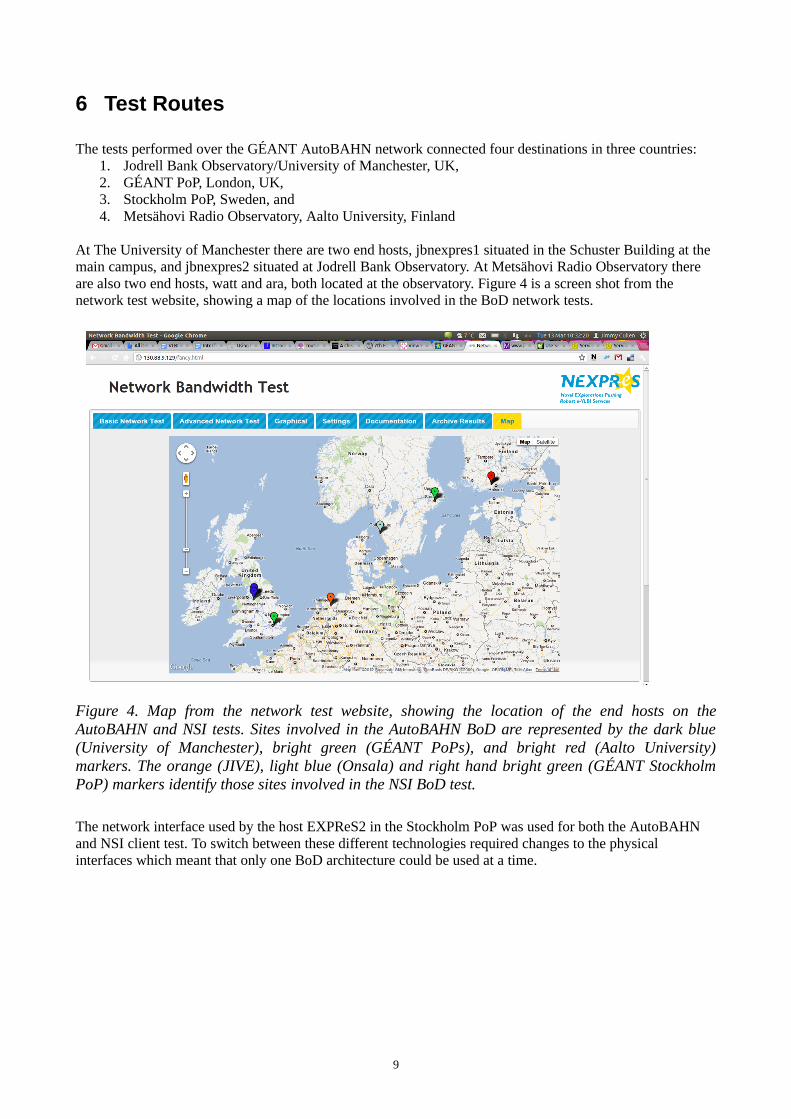
At The University of Manchester there are two end hosts, jbnexpres1 situated in the Schuster Building at the main campus, and jbnexpres2 situated at Jodrell Bank Observatory. At Metsähovi Radio Observatory there are also two end hosts, watt and ara, both located at the observatory. Figure 4 is a screen shot from the network test website, showing a map of the locations involved in the BoD network tests.
Figure 4. Map from the network test website, showing the location of the end hosts on the AutoBAHN and NSI tests. Sites involved in the AutoBAHN BoD are represented by the dark blue (University of Manchester), bright green (GÉANT PoPs), and bright red (Aalto University) markers. The orange (JIVE), light blue (Onsala) and right hand bright green (GÉANT Stockholm PoP) markers identify those sites involved in the NSI BoD test.
The network interface used by the host EXPReS2 in the Stockholm PoP was used for both the AutoBAHN and NSI client test. To switch between these different technologies required changes to the physical interfaces which meant that only one BoD architecture could be used at a time.
9
7 BoD Reservation Interface
Both AutoBAHN and NSI offer the end-user the ability to request a network path between two points on their network. For AutoBAHN, the user interface used in these tests was their client web-site. For NSI, the reservations were made by sending the reservations out using the NSI protocol, using the NEXPReS NSI implementation developed in this workpackage.
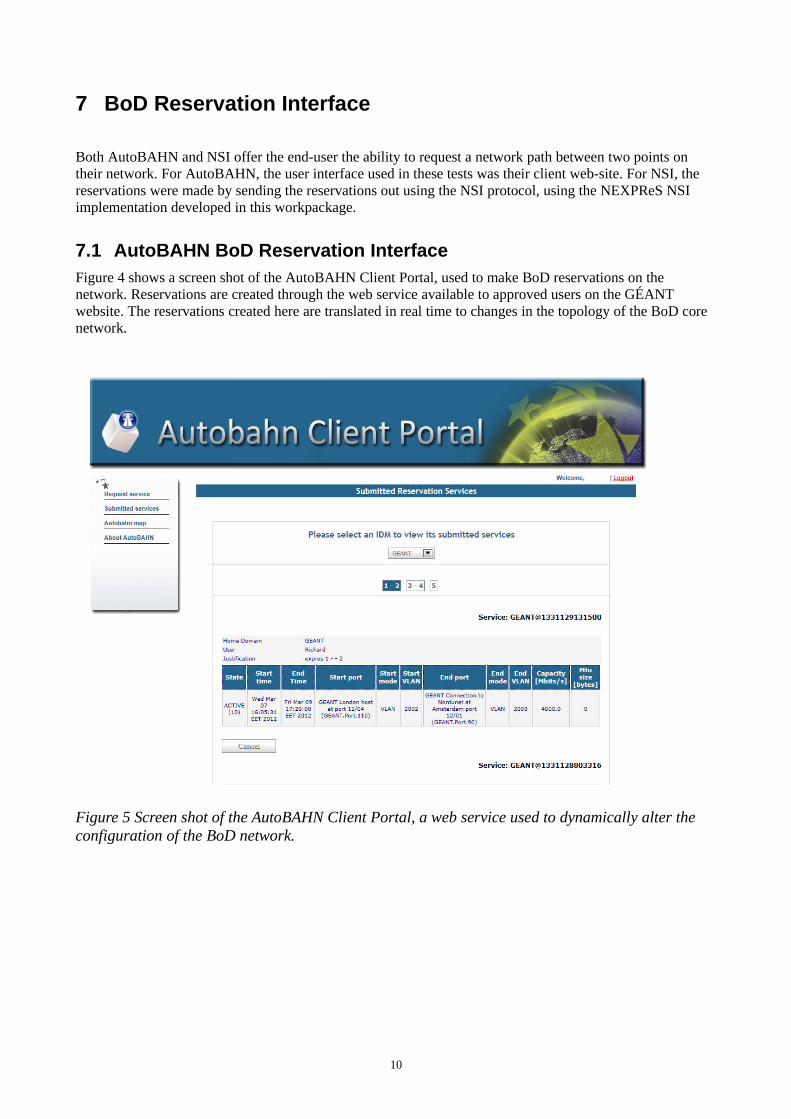
7.1 AutoBAHN BoD Reservation InterfaceFigure 4 shows a screen shot of the AutoBAHN Client Portal, used to make BoD reservations on the network. Reservations are created through the web service available to approved users on the GÉANT website. The reservations created here are translated in real time to changes in the topology of the BoD core network.
Figure 5 Screen shot of the AutoBAHN Client Portal, a web service used to dynamically alter the configuration of the BoD network.
10
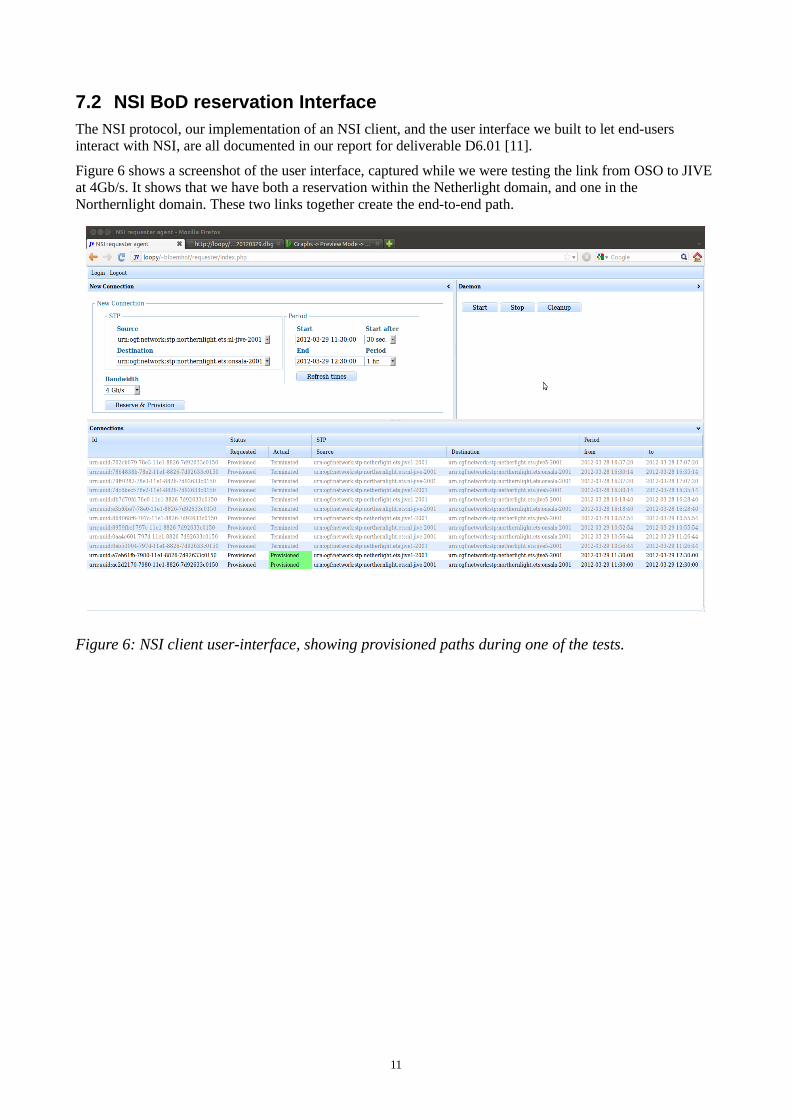
7.2 NSI BoD reservation InterfaceThe NSI protocol, our implementation of an NSI client, and the user interface we built to let end-users interact with NSI, are all documented in our report for deliverable D6.01 [11].
Figure 6 shows a screenshot of the user interface, captured while we were testing the link from OSO to JIVE at 4Gb/s. It shows that we have both a reservation within the Netherlight domain, and one in the Northernlight domain. These two links together create the end-to-end path.
Figure 6: NSI client user-interface, showing provisioned paths during one of the tests.
11
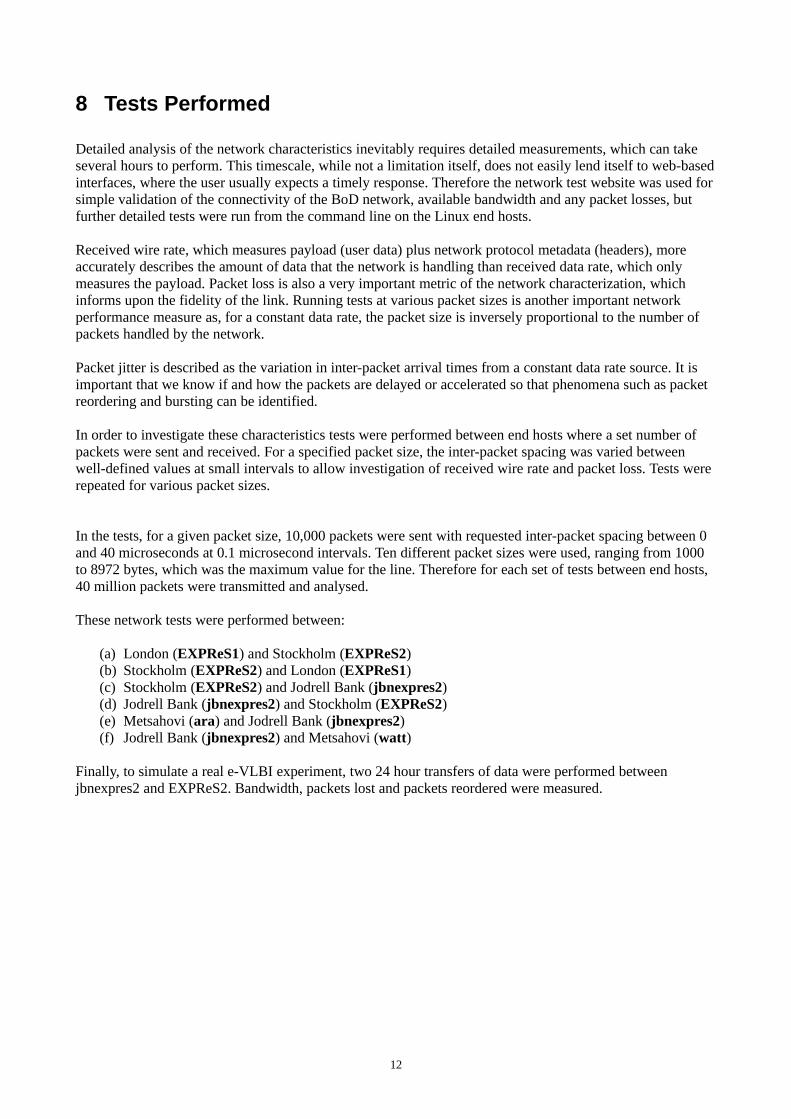
8 Tests Performed
Detailed analysis of the network characteristics inevitably requires detailed measurements, which can take several hours to perform. This timescale, while not a limitation itself, does not easily lend itself to web-based interfaces, where the user usually expects a timely response. Therefore the network test website was used for simple validation of the connectivity of the BoD network, available bandwidth and any packet losses, but further detailed tests were run from the command line on the Linux end hosts.
Received wire rate, which measures payload (user data) plus network protocol metadata (headers), more accurately describes the amount of data that the network is handling than received data rate, which only measures the payload. Packet loss is also a very important metric of the network characterization, which informs upon the fidelity of the link. Running tests at various packet sizes is another important network performance measure as, for a constant data rate, the packet size is inversely proportional to the number of packets handled by the network.
Packet jitter is described as the variation in inter-packet arrival times from a constant data rate source. It is important that we know if and how the packets are delayed or accelerated so that phenomena such as packet reordering and bursting can be identified.
In order to investigate these characteristics tests were performed between end hosts where a set number of packets were sent and received. For a specified packet size, the inter-packet spacing was varied between well-defined values at small intervals to allow investigation of received wire rate and packet loss. Tests were repeated for various packet sizes.
In the tests, for a given packet size, 10,000 packets were sent with requested inter-packet spacing between 0 and 40 microseconds at 0.1 microsecond intervals. Ten different packet sizes were used, ranging from 1000 to 8972 bytes, which was the maximum value for the line. Therefore for each set of tests between end hosts, 40 million packets were transmitted and analysed.
These network tests were performed between:
(a) London (EXPReS1) and Stockholm (EXPReS2)(b) Stockholm (EXPReS2) and London (EXPReS1)(c) Stockholm (EXPReS2) and Jodrell Bank (jbnexpres2)(d) Jodrell Bank (jbnexpres2) and Stockholm (EXPReS2)(e) Metsahovi (ara) and Jodrell Bank (jbnexpres2)(f) Jodrell Bank (jbnexpres2) and Metsahovi (watt)
Finally, to simulate a real e-VLBI experiment, two 24 hour transfers of data were performed between jbnexpres2 and EXPReS2. Bandwidth, packets lost and packets reordered were measured.
12
9 ResultsIn this section we present the results of the network tests for the both BoD architectures. Sections 9.1 – 9.5 give the AutoBAHN BoD circuit results and 9.6 gives the results of the NSI BoD tests.
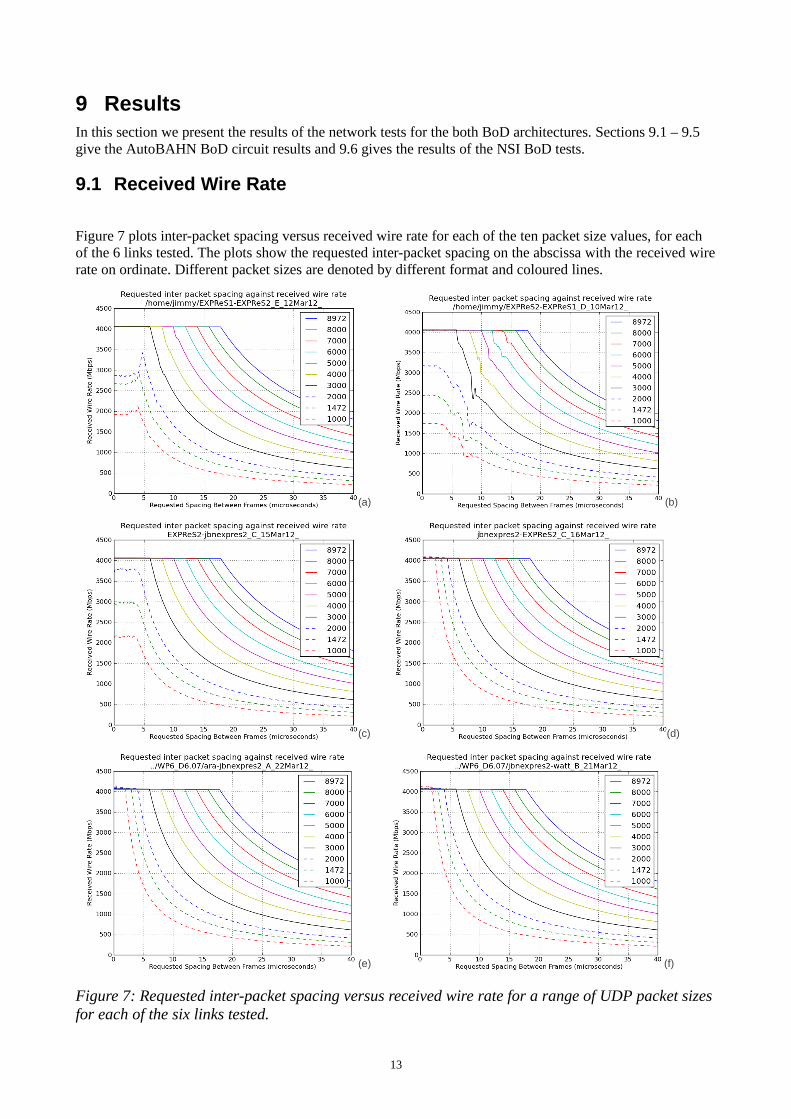
9.1 Received Wire Rate
Figure 7 plots inter-packet spacing versus received wire rate for each of the ten packet size values, for each of the 6 links tested. The plots show the requested inter-packet spacing on the abscissa with the received wire rate on ordinate. Different packet sizes are denoted by different format and coloured lines.
Figure 7: Requested inter-packet spacing versus received wire rate for a range of UDP packet sizes for each of the six links tested.
13
(b)
(d)
(f)
(a)
(c)
(e)
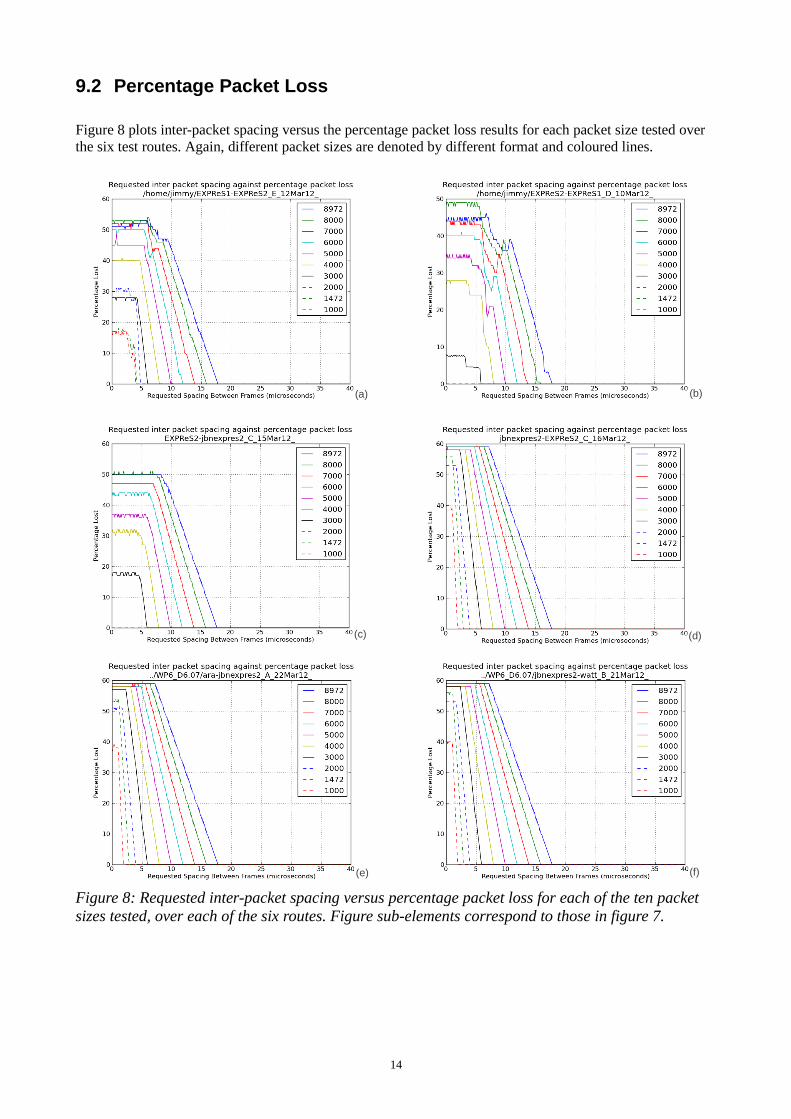
9.2 Percentage Packet Loss
Figure 8 plots inter-packet spacing versus the percentage packet loss results for each packet size tested over the six test routes. Again, different packet sizes are denoted by different format and coloured lines.
Figure 8: Requested inter-packet spacing versus percentage packet loss for each of the ten packet sizes tested, over each of the six routes. Figure sub-elements correspond to those in figure 7.
14
(b)
(d)
(f)
(a)
(c)
(e)
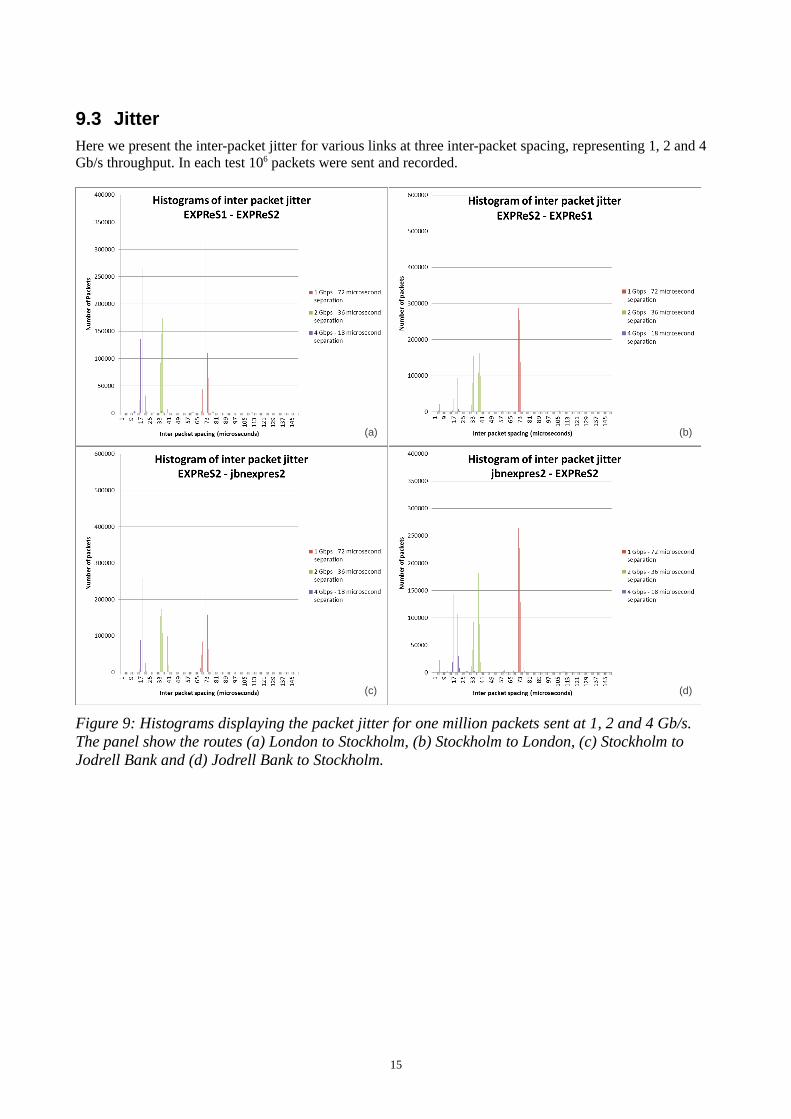
9.3 JitterHere we present the inter-packet jitter for various links at three inter-packet spacing, representing 1, 2 and 4 Gb/s throughput. In each test 106 packets were sent and recorded.
Figure 9: Histograms displaying the packet jitter for one million packets sent at 1, 2 and 4 Gb/s. The panel show the routes (a) London to Stockholm, (b) Stockholm to London, (c) Stockholm to Jodrell Bank and (d) Jodrell Bank to Stockholm.
15
(a) (b)
(c) (d)
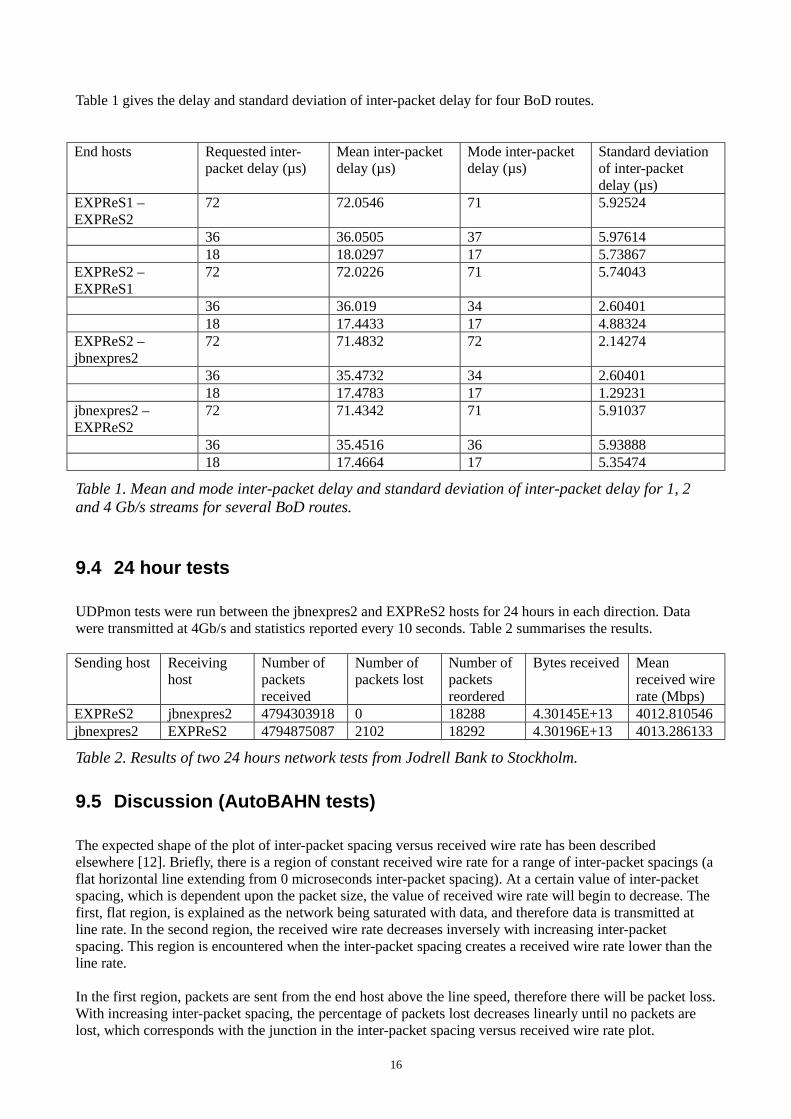
Table 1 gives the delay and standard deviation of inter-packet delay for four BoD routes.
End hosts Requested inter-packet delay (µs)
Mean inter-packet delay (µs)
Mode inter-packet delay (µs)
Standard deviation of inter-packet delay (µs)
EXPReS1 – EXPReS2
72 72.0546 71 5.92524
36 36.0505 37 5.9761418 18.0297 17 5.73867
EXPReS2 – EXPReS1
72 72.0226 71 5.74043
36 36.019 34 2.6040118 17.4433 17 4.88324
EXPReS2 – jbnexpres2
72 71.4832 72 2.14274
36 35.4732 34 2.6040118 17.4783 17 1.29231
jbnexpres2 – EXPReS2
72 71.4342 71 5.91037
36 35.4516 36 5.9388818 17.4664 17 5.35474
Table 1. Mean and mode inter-packet delay and standard deviation of inter-packet delay for 1, 2 and 4 Gb/s streams for several BoD routes.
9.4 24 hour tests
UDPmon tests were run between the jbnexpres2 and EXPReS2 hosts for 24 hours in each direction. Data were transmitted at 4Gb/s and statistics reported every 10 seconds. Table 2 summarises the results.
Sending host Receiving host
Number of packets received
Number of packets lost
Number of packets reordered
Bytes received Mean received wire rate (Mbps)
EXPReS2 jbnexpres2 4794303918 0 18288 4.30145E+13 4012.810546jbnexpres2 EXPReS2 4794875087 2102 18292 4.30196E+13 4013.286133
Table 2. Results of two 24 hours network tests from Jodrell Bank to Stockholm.
9.5 Discussion (AutoBAHN tests)
The expected shape of the plot of inter-packet spacing versus received wire rate has been described elsewhere [12]. Briefly, there is a region of constant received wire rate for a range of inter-packet spacings (a flat horizontal line extending from 0 microseconds inter-packet spacing). At a certain value of inter-packet spacing, which is dependent upon the packet size, the value of received wire rate will begin to decrease. The first, flat region, is explained as the network being saturated with data, and therefore data is transmitted at line rate. In the second region, the received wire rate decreases inversely with increasing inter-packet spacing. This region is encountered when the inter-packet spacing creates a received wire rate lower than the line rate.
In the first region, packets are sent from the end host above the line speed, therefore there will be packet loss. With increasing inter-packet spacing, the percentage of packets lost decreases linearly until no packets are lost, which corresponds with the junction in the inter-packet spacing versus received wire rate plot.
16
The results from sections 9.1 and 9.2 show that for each of the tested BoD links, multiple packet sizes and inter-packet spacings achieve the maximum bandwidth of 4Gb/s. Three of the tests, (a) London (EXPReS1) and Stockholm (EXPReS2), (b) Stockholm (EXPReS2) and London (EXPReS1), and (c) Stockholm (EXPReS2) and Jodrell Bank (jbnexpres2), show that for the smaller packet sizes, line rate was not achieved (Figure 7, panels (a), (b) and (c)). The corresponding packet loss plots shown in Figure 8 reveal no packet loss for the three smallest packet sizes on plots (b) and (c), and non-uniform losses on all other packet sizes on all three tests.
Possible explanations for these results are that the end hosts are not capable of processing packets quickly enough due to hardware or software limitations. In particular, the lack of packet losses in Figure 8, panels (b) and (c) would strongly suggest this. These tests were the first to be conducted, and following these results subsequent tests were all performed with the UDPmon process restricted to run on a single CPU core on both end hosts, which seemed to increase throughput at small packet sizes. Therefore we believe that some of the fluctuations in the plots are due to the UDPmon process switching between CPU cores. Another possibility for the observed fluctuations is that the hardware used in the GÉANT PoPs in London and Stockholm are older than the other hardware.
The final three tests all show ideal behaviour for both received wire rate and packet loss (panels (d), (e) and (f) from Figures 7 and 8). The machines involved in these tests are recent hardware and this may well be an important factor, as well as having the UDPmon process restricted to a single CPU core.
Section 9.3 reports the results of the jitter tests between end hosts over 4 of the routes tested in sections 9.1 and 9.2. The plots in Figure 9 graphically display the spread of delay between the packets, with tightly bunched, tall groupings representing small jitter values. Table 1 presents the mean, mode and standard deviation of packet jitter times. In all results the mean and mode values follow closely the requested inter-packet delay times, which shows that the networks and end hosts have little effect on packet timings. The standard deviation of packet jitter for all four routes are smaller than the requested inter-packet spacing.
Packet jitter for the routes between Jodrell Bank and Metsähovi are not presented as there was a network outage preventing those tests to be run.
The results of the two 24 hour tests given in section 9.4 shows that the results are remarkably similar to one another. In each test almost 4.8 billion packets were transmitted, resulting in 43 Terabytes of data transfer each way. The number of packets lost from Stockholm to Jodrell Bank was zero, giving an error rate of less than one bit in 3.44 x 10¹⁴. The reverse route showed a small packet loss of 4.38 x 10⁻⁷%. Both routes displayed very similar levels of packet reordering and mean received wire rate.
Both BoD services are in the pilot phase of their development, rather than production, and as such there are certain limitations. In Stockholm, a single hardware interface for connecting the EXPReS2 host to either BoD network had to be shared. Both groups would have liked to use the resources for a longer period to perform more detailed testing. Competing for this single, mutually exclusive resource resulted in less network test time available for each BoD network, however following the ethos of equitable sharing of common resources in BoD, this will inevitably be a situation faced in the future.
17
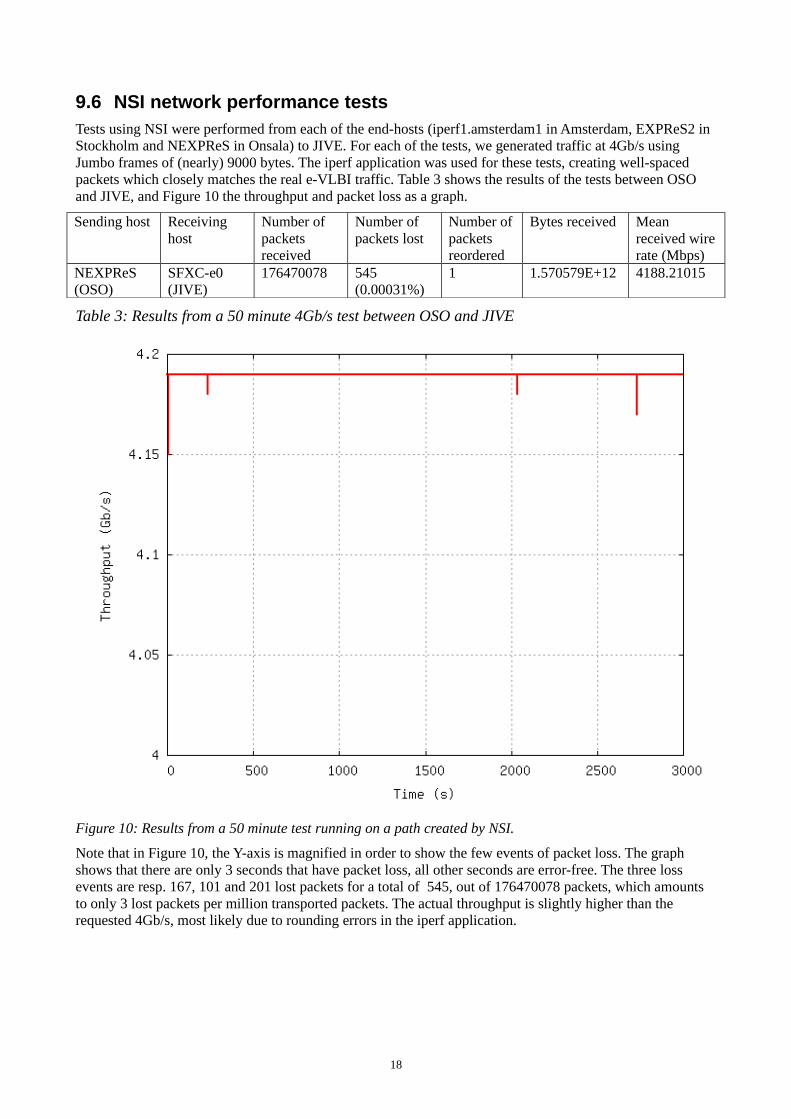
9.6 NSI network performance testsTests using NSI were performed from each of the end-hosts (iperf1.amsterdam1 in Amsterdam, EXPReS2 in Stockholm and NEXPReS in Onsala) to JIVE. For each of the tests, we generated traffic at 4Gb/s using Jumbo frames of (nearly) 9000 bytes. The iperf application was used for these tests, creating well-spaced packets which closely matches the real e-VLBI traffic. Table 3 shows the results of the tests between OSO and JIVE, and Figure 10 the throughput and packet loss as a graph.
Sending host Receiving host
Number of packets received
Number of packets lost
Number of packets reordered
Bytes received Mean received wire rate (Mbps)
NEXPReS (OSO)
SFXC-e0 (JIVE)
176470078 545 (0.00031%)
1 1.570579E+12 4188.21015
Table 3: Results from a 50 minute 4Gb/s test between OSO and JIVE
Figure 10: Results from a 50 minute test running on a path created by NSI.
Note that in Figure 10, the Y-axis is magnified in order to show the few events of packet loss. The graph shows that there are only 3 seconds that have packet loss, all other seconds are error-free. The three loss events are resp. 167, 101 and 201 lost packets for a total of 545, out of 176470078 packets, which amounts to only 3 lost packets per million transported packets. The actual throughput is slightly higher than the requested 4Gb/s, most likely due to rounding errors in the iperf application.
18
10 Conclusion
The tests we have performed show that it is indeed now possible to carry e-VLBI traffic at 4Gb/s over international, inter-domain BoD paths. Paths were configured using both NSI and AutoBAHN and both resulted in near-perfect network performance, certainly sufficient to carry out e-VLBI. Although these BoD systems are currently only testbeds, with limited coverage and limited available bandwidth, we hope that this work will encourage the wider adoption of BoD as an international networking service.
19

11 Acknowledgements
The authors would like to thank all people involved in the setup of the networks for their work, which has made these tests possible. We realize that setting up these networks involved many more people whose names never even came to our attention.
Anthony Ryan and colleagues from NetNorthWest, David Salmon, Dave Tinkler and colleagues from JANET, Babatunde Omogbai, Guy Robertst and colleagues from GÉANT, Fredrik Pettai, Henrik Thostrup Jensen, Frank Blankman and colleagues from NORDUnet, Wouter Huisman, Hans Trompert, John MacAuley and colleagues from SURFnet, Jani Myyry and colleagues from Funet, Börje Josefsson and colleagues from SUNET.
20
12 References
[1] The AutoBAHN website, http://www.geant.net/service/autobahn/pages/home.aspx[2] The AutoBAHN Client Portal, https://forge.geant.net/forge/display/autobahn/Home[3] NSI Working group website, http://forge.ogf.org/sf/projects/nsi-wg[4] NSI Protocol Documentation,
http://forge.ogf.org/sf/go/projects/nsi-wg/docman.root.draft_informational_docs[5] IEEE 802.1Q, http://standards.ieee.org/findstds/standard/802.1Q-2011.html[6] Kershaw, S., Spencer, R. Hughes-Jones, R., Burgess, P., Casey, S., Rushton, A. and Boven, P.
Protocols Performance Report - Final Report on Protocols and Network Infrastructure. EXPReS Project, 2009.http://www.jive.nl/wiki/lib/exe/fetch.php?media=expres:management:euproto-v1-0.pdf
[7] Dallison, S ; Hughes-Jones, R E ; Pezzi, N ; Li, Y. Bringing High-Performance Networking to HEP Users. Computing in High Energy Physics and Nuclear Physics 2004, Interlaken, Switzerland, 27 Sep - 1 Oct 2004, pp.1304
[8] Boven P. (for the EXPReS team); e-VLBI Networking Tricks, Science and Technology of Long Baseline Real-Time Interferometry (8th e-VLBI WS)http://pos.sissa.it/archive/conferences/082/036/EXPReS09_036.pdf
[9] Casey S., Hughes-Jones R., Spencer R., Strong M., Burgess P., Szomoru A., Greenwood C. VLBI_UDP: An application for transporting VLBI data using the UDP protocol (2010) Future Generation Computer Systems, 26 (1), pp. 120-127.
[10] The UDPmon website, http://www.hep.manchester.ac.uk/u/rich/net/index.htmlP[11] Boven, P., Bloemhof, F., A proof-of-concept system for reserving and provisioning on-demand
networking capacity (NEXPReS D6.01),http://www.jive.nl/nexpres/lib/exe/fetch.php?media=nexpres:nexpres_wp6:nexpres-d6.01.pdf
[12] Spencer R.E., Hughes-Jones R., Strong M., Casey S., Rushton A., Burgess P., Kershaw S., Greenwood C. The Role of ESLEA in the development of e-VLBI. (2010) Future Generation Computer Systems, 26 (1), pp. 111-119.
21