Embed Size (px)
Citation preview

www.heatroadmap.eu @HeatRoadmapEU
Maps Manual for Lead-Users
Deliverable 2.4: A report, based on the template from D7.4, describing how these maps can be used by lead-users
Project Number: 695989
Project acronym: HRE
Project title: Heat Roadmap Europe (HRE): Building the knowledge, skills, and capacity required to enable new policies and encourage new investments in the heating and cooling sector
Contract type: H2020-EE-2015-3-MarketUptake

H2020-EE-2015-3-MarketUptake / D2.4 PU
www.heatroadmap.eu @HeatRoadmapEU
This project has received funding from the European Union's Horizon 2020 research and innovation programme under grant agreement No. 695989.

H2020-EE-2015-3-MarketUptake / D2.4 PU
www.heatroadmap.eu @HeatRoadmapEU
Deliverable number: D2.4
Deliverable title: Maps Manual for Lead-Users
Work package: WP2
Due date of deliverable: 31 August 2017
Actual submission date: M19 - 18/09/2017
Start date of project: 01/03/2016
Duration: 36 months
Author/editor: Urban Persson (HU), Bernd Möller (EUF), Eva Wiechers (EUF), Carsten Rothballer (ICLEI Europe)
Reviewer(s): Brian Vad Mathiesen (AAU), Lars Grundahl (AAU), George Stiff (ICLEI Europe)
Project Coordinator Brian Vad Mathiesen, Aalborg University
Dissemination Level of this Deliverable: PU
Public PU
Confidential, only for members of the consortium (including the Commission Services)
C0
H2020-EE-2015-3-MarketUptake / D2.4 PU
www.heatroadmap.eu @HeatRoadmapEU
Contact: Urban Persson, Work Package 2 leader
Email: [email protected] School of Business, Engineering and Science
Halmstad University Box 823
SE-301 18 Halmstad Sweden
E-mail: [email protected] Heat Roadmap Europe website: www.heatroadmap.eu
Deliverable No. D2.4: Public Report © September, 2017
This project has received funding from the European Union's Horizon 2020 research and innovation programme under grant agreement No. 695989. The sole responsibility for the content of this document lies with the authors. It does not necessarily reflect the opinion of the funding authorities. The funding authorities are not responsible for any use that may be made of the information contained therein.

H2020-EE-2015-3-MarketUptake / D2.4 PU
www.heatroadmap.eu @HeatRoadmapEU
Figure 0.1: Impression of Peta 4 version 2 (Peta 4.2).
H2020-EE-2015-3-MarketUptake / D2.4 PU
1 www.heatroadmap.eu @HeatRoadmapEU
Table of Contents 1. Introduction .......................................................................................... 3
2. Key messages ....................................................................................... 4
3. Basic user information for Peta 4.2........................................................... 5
3.1 Key features ...................................................................................... 5
3.2 How does it work? .............................................................................. 6
3.3 Who should use it? .............................................................................. 7
4. Peta 4.2 and the Heat Roadmap Europe Project ......................................... 8
5. Technical implementation ....................................................................... 9
5.1 Maps and data formats ........................................................................ 9
5.2 ArcGIS online web map service ........................................................... 10
5.3 Operational layer inventory ................................................................ 11
6. Use cases ........................................................................................... 22
6.1 Use case 1: Explore the regional heat demand ...................................... 22
6.2 Use case 2: Identify existing district heating systems and available resources ...................................................................................................... 26
6.3 Use case 3: Develop a heat supply strategy considering the investment costs ...................................................................................................... 35
H2020-EE-2015-3-MarketUptake / D2.4 PU
3 www.heatroadmap.eu @HeatRoadmapEU
1. Introduction In Europe, there is a clear long-term objective to decarbonise the energy system, but it is currently unclear how this will be achieved in the heating and cooling sector. The Heat Roadmap Europe (HRE) project will enable new policies and prepare the ground for new investments by creating more certainty regarding the changes that are required. Heat Roadmap Europe is co-funded by the European Union, brings together 24 academic, industrial, governmental and civil society partners, and runs from 2016-2019.
The Pan-European Thermal Atlas (Peta) has been developed as part of the work in the second work package (WP2) of the fourth Heat Roadmap Europe project (HRE4). The model is a geographic representation of heating and cooling demands in the 14 EU Member States studied in the project1, and includes excess heat potentials, prospective district heating networks, availability of renewable energy resources such as geothermal, solar irradiation, biomass and more.
The main purpose of the present report is to provide a reference manual and a basic guide for lead-users to understand and navigate the spatial data and maps, which have been made publicly accessible within an online web map service hosting the Pan-European Thermal Atlas 4 in its second version (Peta 4.2). The present report includes condensed information about Peta 4.2 for a general orientation (key messages and properties) on the one hand and also detailed information by presenting a series of use cases reflecting the interests of typical lead-users and based on typical examples and cases on the other hand.
This manual first highlights several key messages and presents key features of the Peta 4.2 online mapping platform. The basic functions are described, and prospective users are made familiar with typical applications before explaining how users can benefit by providing inspiration drawn from the Heat Roadmap Europe project. The manual continues with a technical documentation on maps and data formats, the setup of the ArcGIS Online solution, and an inventory of available layers. Finally, three use cases illustrate a typical workflow. The cases show a progression from the first steps to a more proficient user case.
The intention of this report is to concentrate on the most important issues, believing that online mapping tools no longer need to be left only to expert users, but instead are becoming an everyday experience for many. For additional information to this report, please also refer to the technical report “Methodologies and assumptions used in the mapping” under Deliverable 2.3: A final report outlining the methodology and assumptions used in the mapping.
1 Though insights from HRE4 should be applicable to countries all across Europe, the HRE4 project itself especially concentrates on those fourteen countries with the highest building heat demands in the EU28: Austria, Belgium, Czech Republic, Finland, France, Germany, Hungary, Italy, the Netherlands, Poland, Romania, Spain, Sweden and the UK.

H2020-EE-2015-3-MarketUptake / D2.4 PU
4 www.heatroadmap.eu @HeatRoadmapEU
2. Key messages Peta pioneers information on the European thermal sector
The Peta 4.2 platform addresses the lack of information on the distribution of demands, the opportunities of using excess heat and renewable energy sources, and the opportunities for district heating and cooling systems versus individual solutions.
Peta is a web atlas for the entire thermal sector of HRE4 countries
The Peta 4.2 online platform embodies cutting-edge results from the mapping of not only heating and cooling demands, but also of an array of supply options. Spatial data are provided for the fourteen member states, which are the focus of HRE40F.
Peta increases the visibility of the thermal sector
Peta 4.2 enables a pan-European view of the thermal sector, not only from national and regional perspectives but also by city and village levels. The intended result is an increased visibility and a trigger to start further studies and on-the-ground initiatives leading to a decarbonised heating and cooling sector across Europe.
Peta builds on a strong mapping platform
Peta 4.2 is based on ArcGIS Online by ESRI, combining the online storage of layers and services with web map application for the publication of the Pan-European Thermal Atlas1F
2. Interactive layers can be selected, navigated and shared.
Peta delivers input to supply strategies
Peta is a high-resolution quantitative representation of the European heating and cooling sector. Input to local, regional and national heat and cooling supply strategies can be produced via the map interface.
Peta maps the uncharted
There are currently very few geographical representations of the heating and cooling sectors, which are suitable to establish a quantitative basis for the formulation of strategies for local heating and cooling. Peta is an attempt to push into unchartered waters in order to get an idea of the opportunities and challenges of heating and cooling strategies.
2 Peta: http://heatroadmap.eu/Peta4.php
H2020-EE-2015-3-MarketUptake / D2.4 PU
5 www.heatroadmap.eu @HeatRoadmapEU
3. Basic user information for Peta 4.2
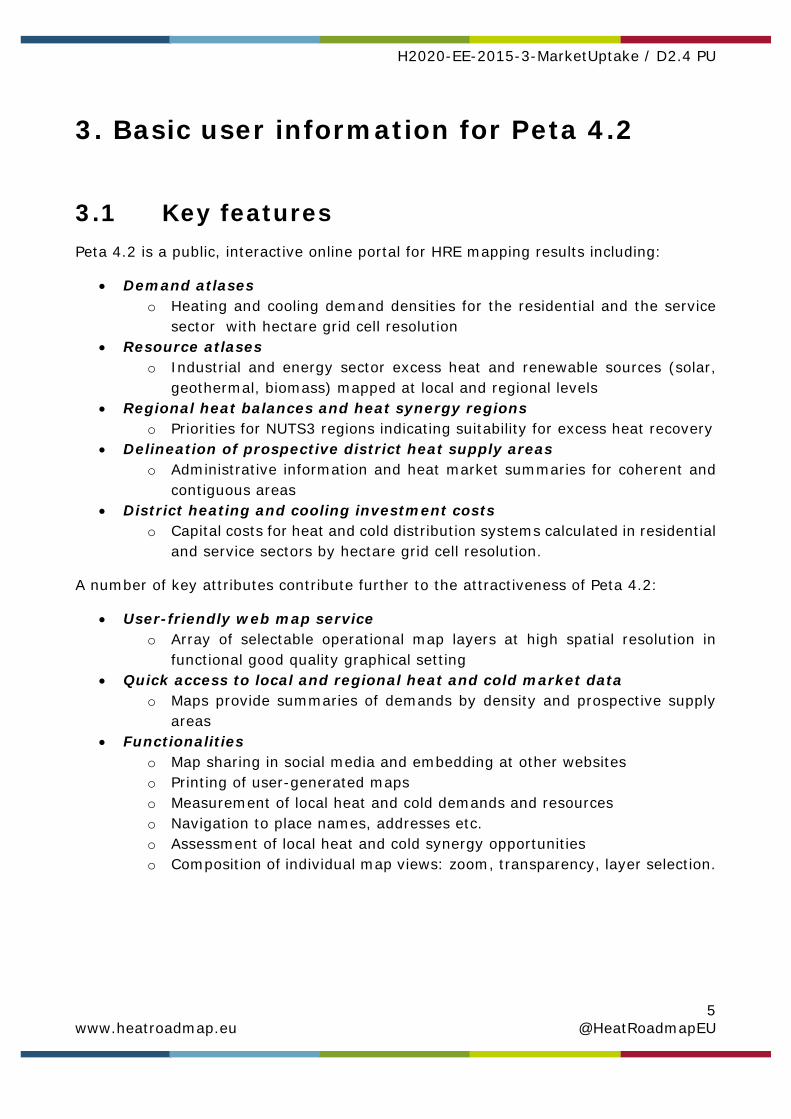
3.1 Key features Peta 4.2 is a public, interactive online portal for HRE mapping results including:
Demand atlases o Heating and cooling demand densities for the residential and the service
sector with hectare grid cell resolution Resource atlases
o Industrial and energy sector excess heat and renewable sources (solar, geothermal, biomass) mapped at local and regional levels
Regional heat balances and heat synergy regions o Priorities for NUTS3 regions indicating suitability for excess heat recovery
Delineation of prospective district heat supply areas o Administrative information and heat market summaries for coherent and
contiguous areas District heating and cooling investment costs
o Capital costs for heat and cold distribution systems calculated in residential and service sectors by hectare grid cell resolution.
A number of key attributes contribute further to the attractiveness of Peta 4.2:
User-friendly web map service o Array of selectable operational map layers at high spatial resolution in
functional good quality graphical setting Quick access to local and regional heat and cold market data
o Maps provide summaries of demands by density and prospective supply areas
Functionalities o Map sharing in social media and embedding at other websites o Printing of user-generated maps o Measurement of local heat and cold demands and resources o Navigation to place names, addresses etc. o Assessment of local heat and cold synergy opportunities o Composition of individual map views: zoom, transparency, layer selection.
H2020-EE-2015-3-MarketUptake / D2.4 PU
6 www.heatroadmap.eu @HeatRoadmapEU
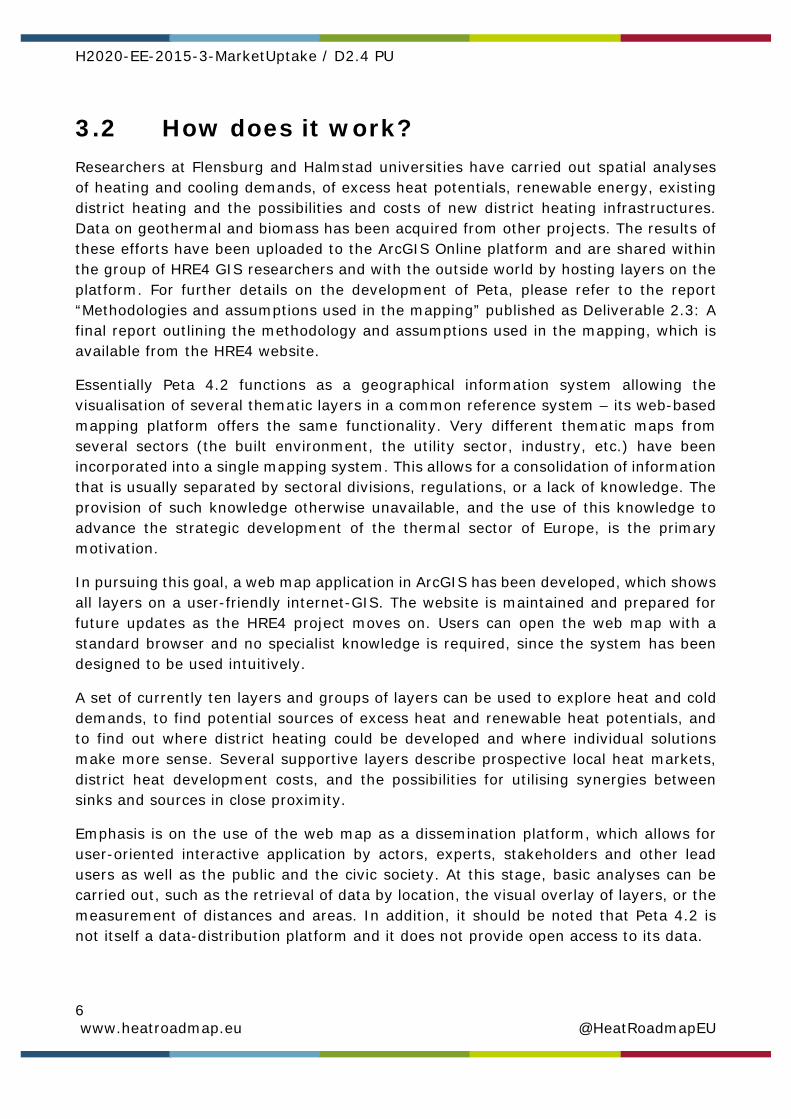
3.2 How does it work? Researchers at Flensburg and Halmstad universities have carried out spatial analyses of heating and cooling demands, of excess heat potentials, renewable energy, existing district heating and the possibilities and costs of new district heating infrastructures. Data on geothermal and biomass has been acquired from other projects. The results of these efforts have been uploaded to the ArcGIS Online platform and are shared within the group of HRE4 GIS researchers and with the outside world by hosting layers on the platform. For further details on the development of Peta, please refer to the report “Methodologies and assumptions used in the mapping” published as Deliverable 2.3: A final report outlining the methodology and assumptions used in the mapping, which is available from the HRE4 website.
Essentially Peta 4.2 functions as a geographical information system allowing the visualisation of several thematic layers in a common reference system – its web-based mapping platform offers the same functionality. Very different thematic maps from several sectors (the built environment, the utility sector, industry, etc.) have been incorporated into a single mapping system. This allows for a consolidation of information that is usually separated by sectoral divisions, regulations, or a lack of knowledge. The provision of such knowledge otherwise unavailable, and the use of this knowledge to advance the strategic development of the thermal sector of Europe, is the primary motivation.
In pursuing this goal, a web map application in ArcGIS has been developed, which shows all layers on a user-friendly internet-GIS. The website is maintained and prepared for future updates as the HRE4 project moves on. Users can open the web map with a standard browser and no specialist knowledge is required, since the system has been designed to be used intuitively.
A set of currently ten layers and groups of layers can be used to explore heat and cold demands, to find potential sources of excess heat and renewable heat potentials, and to find out where district heating could be developed and where individual solutions make more sense. Several supportive layers describe prospective local heat markets, district heat development costs, and the possibilities for utilising synergies between sinks and sources in close proximity.
Emphasis is on the use of the web map as a dissemination platform, which allows for user-oriented interactive application by actors, experts, stakeholders and other lead users as well as the public and the civic society. At this stage, basic analyses can be carried out, such as the retrieval of data by location, the visual overlay of layers, or the measurement of distances and areas. In addition, it should be noted that Peta 4.2 is not itself a data-distribution platform and it does not provide open access to its data.

H2020-EE-2015-3-MarketUptake / D2.4 PU
7 www.heatroadmap.eu @HeatRoadmapEU
3.3 Who should use it? The HRE4 mapping outputs allow users to explore a geographical model of those real world circumstances that constitute and condition the local and regional context of users. Considerable value is added for any actor interested in learning more about local possibilities for efficient resource utilisation, such as local municipalities, regional energy planners, and energy utility companies.
It is assumed that the maps are relevant and interesting for the HRE4 target audience, consisting of people with different professional backgrounds and interests. Peta 4.2 is not exclusively an expert tool, but may be used with little previous experience in mapping. Accordingly, the web interface aims at keeping its use as simple as possible. At the same time, it is intended to facilitate users with diverse backgrounds, experiences and agendas.
H2020-EE-2015-3-MarketUptake / D2.4 PU
8 www.heatroadmap.eu @HeatRoadmapEU
4. Peta 4.2 and the Heat Roadmap Europe Project
The web map service presents maps and data for the 14 EU member states that have been in focus of the HRE4 project. The primary objective therefore is to accompany the Heat Roadmap project.
On the scientific level, Peta 4.2 materializes the outcome of work package 2 (WP2), and indirectly it contains the outputs of WP3, where profiles of heat and cold demands have been prepared. Peta is also a major part of the HRE4 dissemination strategy (WP7), and it will be used to establish the data on district heating and rural heat supply for the energy systems analysis in WP6.
Within HRE4, Peta 4.2 aims at supporting the central objectives of the project: to enable policymaking; to prepare the ground for investments; and to build capacities and skills.
The significance and importance of the mapping results are hard to underestimate, since they represent a spatial and visual link between the national energy system futures apprehended by WP6 (decarbonizing heating and cooling sectors until 2050) and the real world activities, demand centers, and locally available renewable resources, whose synergetic arrangement and sustainable exploitation constitute the basis for these futures. In terms of spatial data, moreover, WP2 information on local asset and demand levels are also valuable for the modelling itself, where this information provides indices on e.g. feasible future expansion levels of current district heating and cooling systems.
H2020-EE-2015-3-MarketUptake / D2.4 PU
9 www.heatroadmap.eu @HeatRoadmapEU
5. Technical implementation
5.1 Maps and data formats Basis for the geospatial information are several ArcGIS File Geodatabases, which hold the extensive data of WP2 internally to WP2 partners. They are located on local file servers at Halmstad University (HU) and Europa-University Flensburg (EUF). For exchange with HU and AAU, some data are located on an FTP server at HU. At EUF several ArcGIS Model Builder Toolboxes have been developed, which contain the workflow and the programming of all spatial analyses carried out, so that results can be updated and reconstructed.
All offline data share the same geographical reference information, which is the European Terrestrial Reference System 1989 (ETRS89), also called EPSG:3035, and the map projection is Lamberts Azimuthal Equal Area (LAEA), which is recommended for statistical mapping at all scales and applications where true area representation is required. Offline maps however use the EPSG:3857, the WGS84 Web Mercator (Auxiliary Sphere), which is also used in e.g. Google Maps and Open Streetmaps.
The map extent is 63.0°N, 22.6°W, 42.3°E and 37.5°S, covering all of the primary territory of EU countries (e.g. it does not include Spain’s Canary Islands or Portugal’s Azores). Masks have been prepared to grey-out all other nations than the fourteen countries that are HRE4’s primary focus.
All geographical information is shared through spatial data in the ArcGIS Online formats of the Feature Layer for vector-data and the Raster Tile Layer for raster or grid data. One exemption is the set of layers from the GeoDH project, which have been uploaded directly as a zipped folder in order to achieve a folder structure for this thematic set of layers. Layers are uploaded and owned by users at EUF.
For the Online Atlas, Web Maps establish the structure of layers, the symbologies and settings such as background map, zoom levels etc. They form the basis for further online map programming.
Web Apps are HTML and JavaScript-based applications that translate the ArcGIS geospatial information to standard websites. In Peta 4.2, Web Apps have been developed using the ArcGIS Web App Builder for convenient programming. Web Apps create online maps based on Web Maps and allow for adding several tools, or widgets for navigation, reference, logos, sharing, printing etc. The intention was to keep the online map simple and functional while minimising development efforts.
The online maps are representations of the data available in the Mapping group. Raster data on the 100m resolution level need to be tiled for efficient visualisation on an online
H2020-EE-2015-3-MarketUptake / D2.4 PU
10 www.heatroadmap.eu @HeatRoadmapEU
map. The tiling is based on caches for zoom levels between approximately 1:72,000 and 1:37,000,000. Zoom levels below that would consume too many data. Tiling is done using the ArcGIS Online process and tile-based raster sets are subsequently hosted by ESRI. Feature Layers are hosted from within ArcGIS. Usually not all the attribute data is being hosted, e.g. in cases where data is confidential or irrelevant. For all hosted layers, service definitions have been prepared, which contain the necessary information for replication and documentation of the hosting process.
Versioning of Peta follows the numbering of HRE projects. On the fourth level, Peta 4.1 has been published in March 2017. It is still available and being kept online, but it is no longer being maintained. Peta 4.2 is to be published in September 2017 and may see minor updates without notification. The present manual is not going to be updated. Subsequent versions of Peta, i.e. 4.3 and so forth, will be released as the HRE4 project progresses.
5.2 ArcGIS online web map service Peta 4.2 uses the ESRI campus license for all universities in the German federal state of Schleswig-Holstein. The campus license offers free credits in the ESRI ArcGIS Online credit system, and ESRI Germany may supplement with credits as required due to the pilot character of Peta 4.2. This also includes the inclusion of AAU and HU staff, though without publishing rights.
Preconditions for the use of the public license are the scientific character of the use of the platform, and the absence of profit-oriented activities within the WP2 mapping consortium.
The layers, maps and apps are further developed and maintained as the project proceeds, subject to available funding. The website will expire two years after the HRE4 project has ended.
Suggestions for future improvements are welcome and should be sent to [email protected]

H2020-EE-2015-3-MarketUptake / D2.4 PU
11 www.heatroadmap.eu @HeatRoadmapEU
5.3 Operational layer inventory
5.3.1 Welcome Screen
Figure 2: Welcome screen of Peta 4.2
The welcome screen opens when Peta 4.2 is being launched. It contains information about the content, limitations of zoom levels, reference to technical reports, a disclaimer and some information on abbreviations as well as partner logos and an acknowledgement of received EU support.
H2020-EE-2015-3-MarketUptake / D2.4 PU
12 www.heatroadmap.eu @HeatRoadmapEU
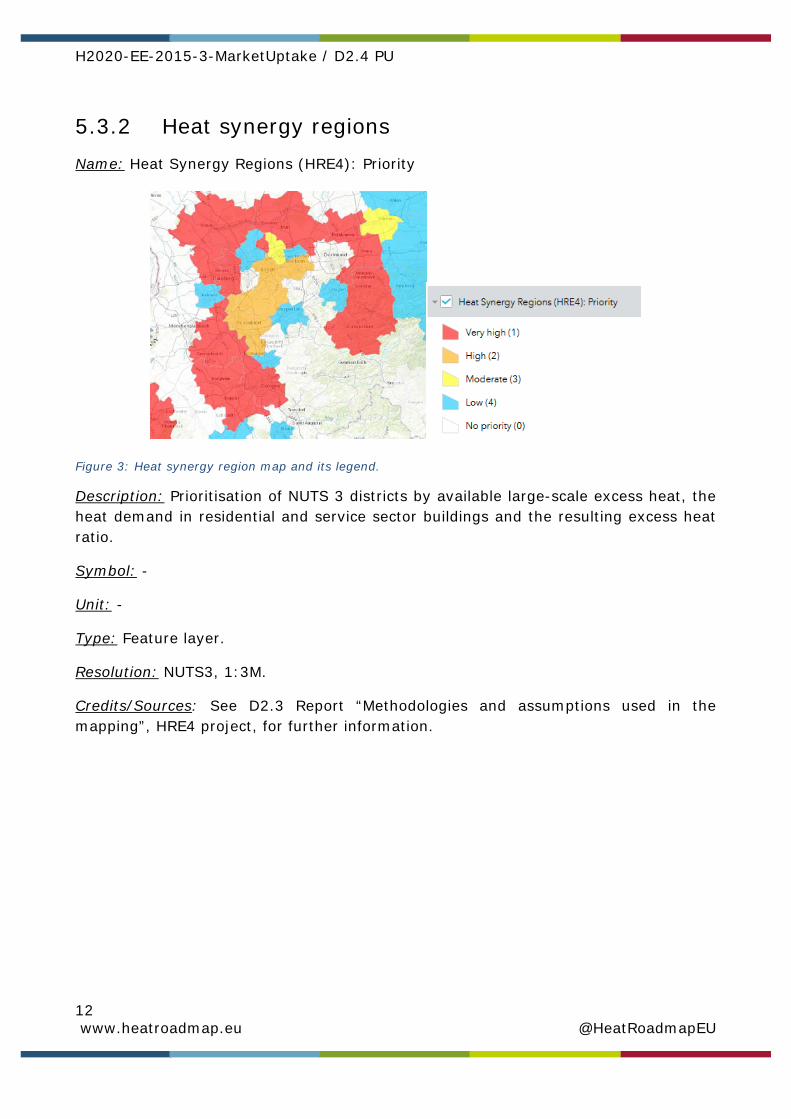
5.3.2 Heat synergy regions Name: Heat Synergy Regions (HRE4): Priority
Figure 3: Heat synergy region map and its legend.
Description: Prioritisation of NUTS 3 districts by available large-scale excess heat, the heat demand in residential and service sector buildings and the resulting excess heat ratio.
Symbol: -
Unit: -
Type: Feature layer.
Resolution: NUTS3, 1:3M.
Credits/Sources: See D2.3 Report “Methodologies and assumptions used in the mapping”, HRE4 project, for further information.

H2020-EE-2015-3-MarketUptake / D2.4 PU
13 www.heatroadmap.eu @HeatRoadmapEU
5.3.3 Excess heat activities Name: Excess heat activities (HRE4)
Figure 4: Excess heat activity point layer and its legend.
Description: Geographical locations and estimated maximal theoretical annual volumes of excess heat available from large-scale energy and industry sector facilities (including WTE facilities).
Symbol: Eheat,o
Unit: PJ/a, TWh/a.
Type: Feature point sources.
Resolution: -
Comment: Extract of large-scale facilities from the E-PRTR_v9 dataset with reports on carbon dioxide emissions to air. Mainly data for the years 2012, 2013, and 2014. A separate dataset (HRE WTE List) used for WTE facilities.
Credits/Sources: See D2.3 Report “Methodologies and assumptions used in the mapping”, HRE4 project.
H2020-EE-2015-3-MarketUptake / D2.4 PU
14 www.heatroadmap.eu @HeatRoadmapEU
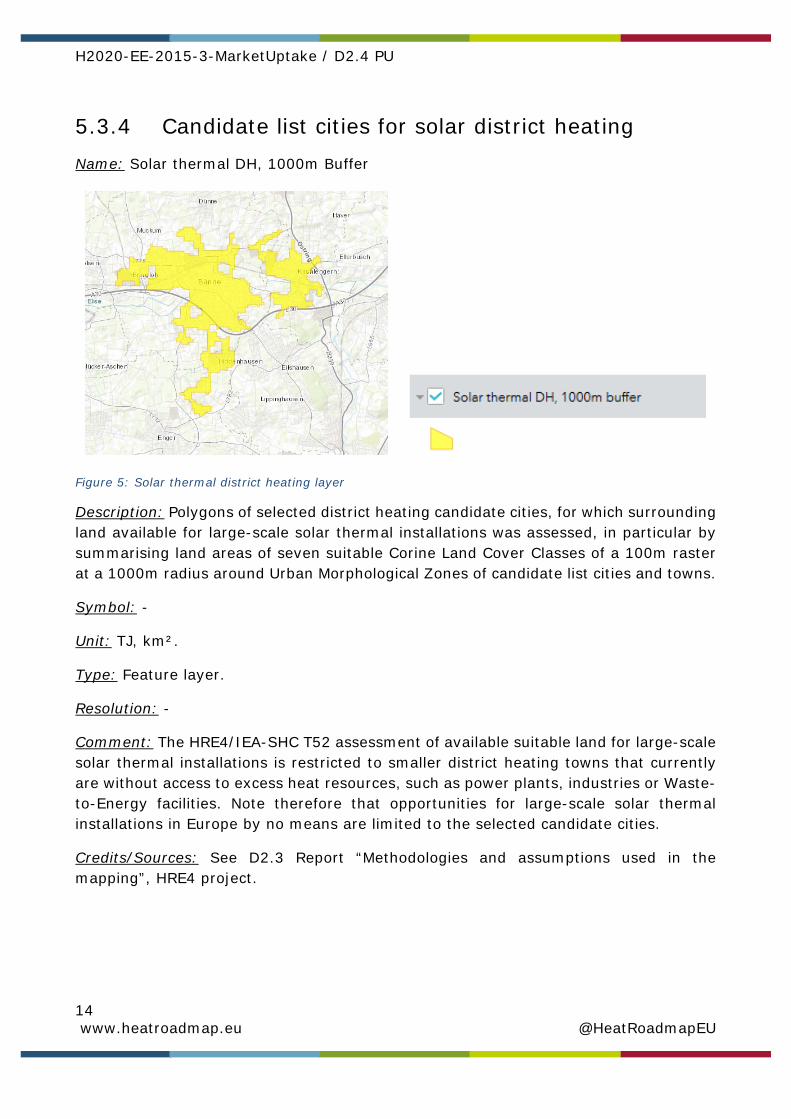
5.3.4 Candidate list cities for solar district heating Name: Solar thermal DH, 1000m Buffer
Figure 5: Solar thermal district heating layer
Description: Polygons of selected district heating candidate cities, for which surrounding land available for large-scale solar thermal installations was assessed, in particular by summarising land areas of seven suitable Corine Land Cover Classes of a 100m raster at a 1000m radius around Urban Morphological Zones of candidate list cities and towns.
Symbol: -
Unit: TJ, km².
Type: Feature layer.
Resolution: -
Comment: The HRE4/IEA-SHC T52 assessment of available suitable land for large-scale solar thermal installations is restricted to smaller district heating towns that currently are without access to excess heat resources, such as power plants, industries or Waste-to-Energy facilities. Note therefore that opportunities for large-scale solar thermal installations in Europe by no means are limited to the selected candidate cities.
Credits/Sources: See D2.3 Report “Methodologies and assumptions used in the mapping”, HRE4 project.

H2020-EE-2015-3-MarketUptake / D2.4 PU
15 www.heatroadmap.eu @HeatRoadmapEU
5.3.5 Regional biomass availabilities Name: Biomass Resources (BioBoost)
Figure 6: Biomass resource layer.
Description: The BioBoost dataset, which contains technically and economically available residual biomass potentials per NUTS 3 district in energy units.
Symbol: -
Unit: PJ
Type: Feature layer.
Resolution: NUTS3, 1:3M.
Comment: Based on the 2010 division of NUTS3 districts, for EU27 Member States.
Credits/Sources: Used by permission of IUNG. See www.bioboost.eu
H2020-EE-2015-3-MarketUptake / D2.4 PU
16 www.heatroadmap.eu @HeatRoadmapEU
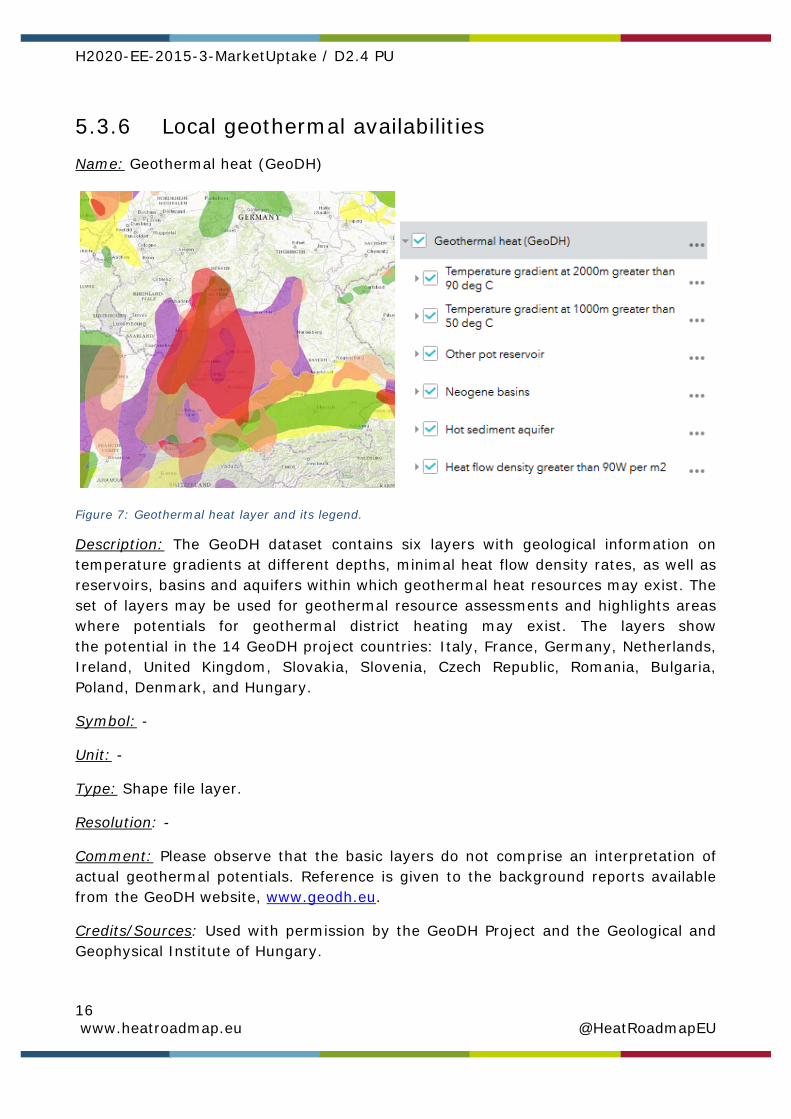
5.3.6 Local geothermal availabilities Name: Geothermal heat (GeoDH)
Figure 7: Geothermal heat layer and its legend.
Description: The GeoDH dataset contains six layers with geological information on temperature gradients at different depths, minimal heat flow density rates, as well as reservoirs, basins and aquifers within which geothermal heat resources may exist. The set of layers may be used for geothermal resource assessments and highlights areas where potentials for geothermal district heating may exist. The layers show the potential in the 14 GeoDH project countries: Italy, France, Germany, Netherlands, Ireland, United Kingdom, Slovakia, Slovenia, Czech Republic, Romania, Bulgaria, Poland, Denmark, and Hungary.
Symbol: -
Unit: -
Type: Shape file layer.
Resolution: -
Comment: Please observe that the basic layers do not comprise an interpretation of actual geothermal potentials. Reference is given to the background reports available from the GeoDH website, www.geodh.eu.
Credits/Sources: Used with permission by the GeoDH Project and the Geological and Geophysical Institute of Hungary.
H2020-EE-2015-3-MarketUptake / D2.4 PU
17 www.heatroadmap.eu @HeatRoadmapEU
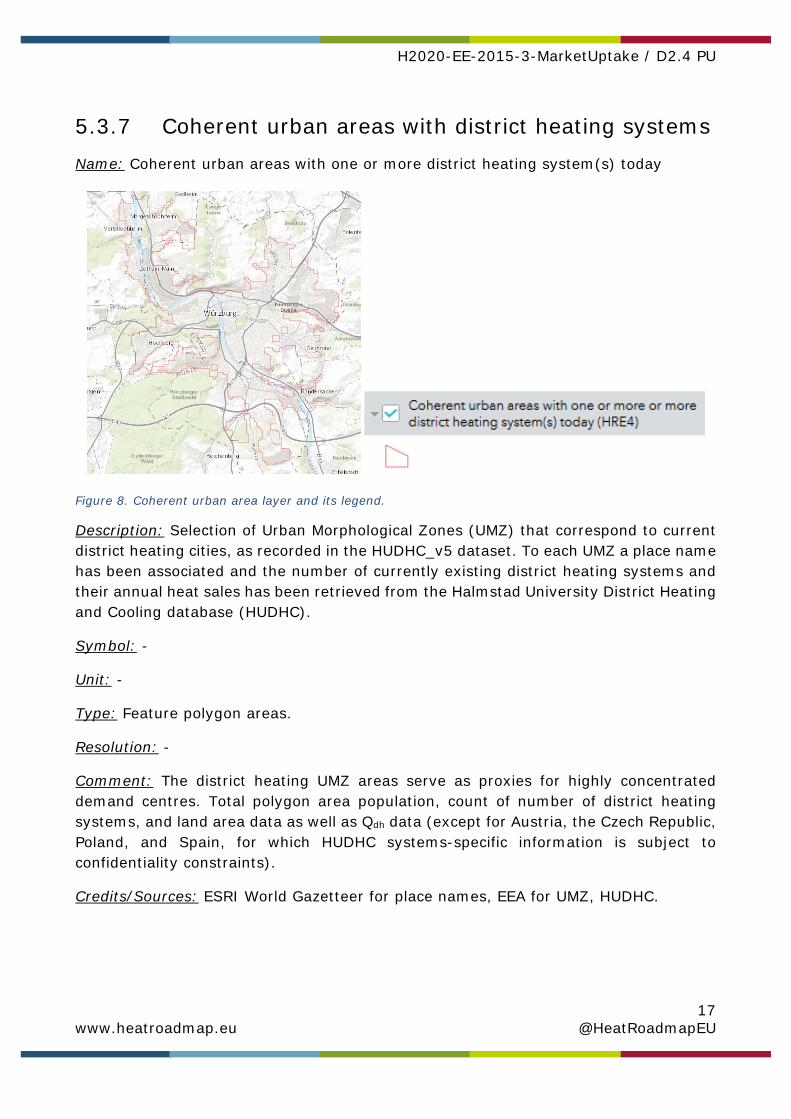
5.3.7 Coherent urban areas with district heating systems Name: Coherent urban areas with one or more district heating system(s) today
Figure 8. Coherent urban area layer and its legend.
Description: Selection of Urban Morphological Zones (UMZ) that correspond to current district heating cities, as recorded in the HUDHC_v5 dataset. To each UMZ a place name has been associated and the number of currently existing district heating systems and their annual heat sales has been retrieved from the Halmstad University District Heating and Cooling database (HUDHC).
Symbol: -
Unit: -
Type: Feature polygon areas.
Resolution: -
Comment: The district heating UMZ areas serve as proxies for highly concentrated demand centres. Total polygon area population, count of number of district heating systems, and land area data as well as Qdh data (except for Austria, the Czech Republic, Poland, and Spain, for which HUDHC systems-specific information is subject to confidentiality constraints).
Credits/Sources: ESRI World Gazetteer for place names, EEA for UMZ, HUDHC.
H2020-EE-2015-3-MarketUptake / D2.4 PU
18 www.heatroadmap.eu @HeatRoadmapEU
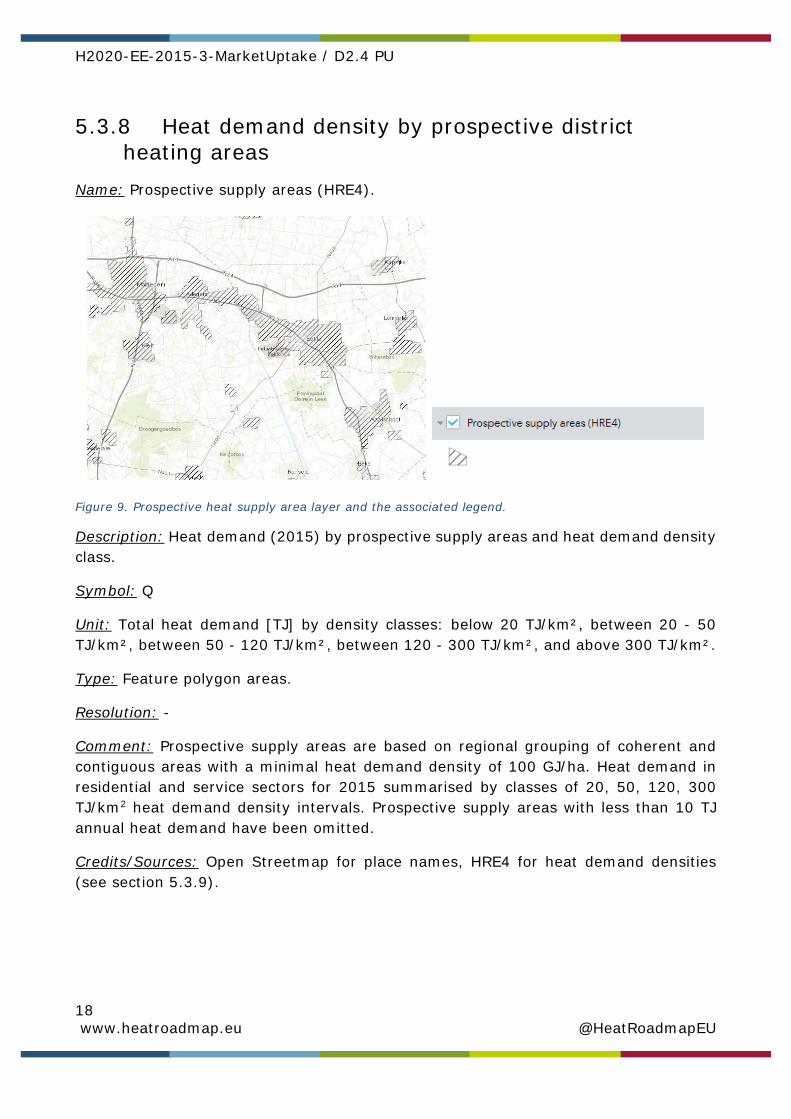
5.3.8 Heat demand density by prospective district heating areas
Name: Prospective supply areas (HRE4).
Figure 9. Prospective heat supply area layer and the associated legend.
Description: Heat demand (2015) by prospective supply areas and heat demand density class.
Symbol: Q
Unit: Total heat demand [TJ] by density classes: below 20 TJ/km², between 20 - 50 TJ/km², between 50 - 120 TJ/km², between 120 - 300 TJ/km², and above 300 TJ/km².
Type: Feature polygon areas.
Resolution: -
Comment: Prospective supply areas are based on regional grouping of coherent and contiguous areas with a minimal heat demand density of 100 GJ/ha. Heat demand in residential and service sectors for 2015 summarised by classes of 20, 50, 120, 300 TJ/km2 heat demand density intervals. Prospective supply areas with less than 10 TJ annual heat demand have been omitted.
Credits/Sources: Open Streetmap for place names, HRE4 for heat demand densities (see section 5.3.9).
H2020-EE-2015-3-MarketUptake / D2.4 PU
19 www.heatroadmap.eu @HeatRoadmapEU
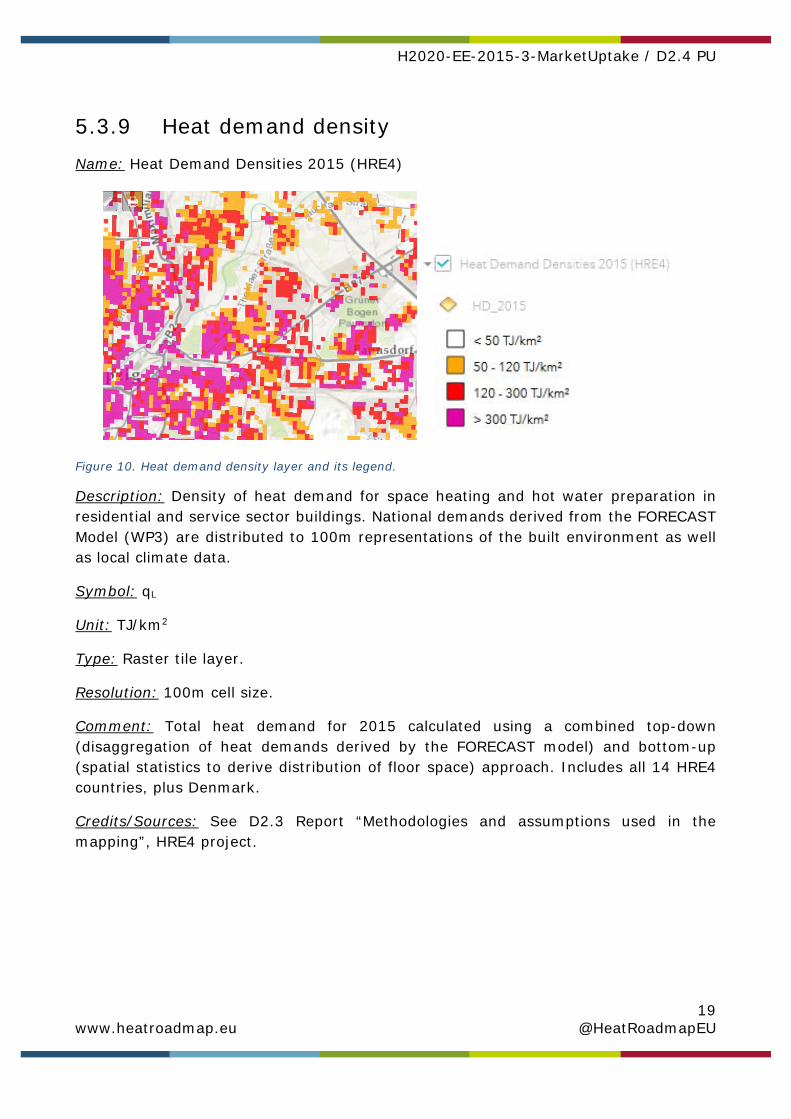
5.3.9 Heat demand density Name: Heat Demand Densities 2015 (HRE4)
Figure 10. Heat demand density layer and its legend.
Description: Density of heat demand for space heating and hot water preparation in residential and service sector buildings. National demands derived from the FORECAST Model (WP3) are distributed to 100m representations of the built environment as well as local climate data.
Symbol: qL
Unit: TJ/km2
Type: Raster tile layer.
Resolution: 100m cell size.
Comment: Total heat demand for 2015 calculated using a combined top-down (disaggregation of heat demands derived by the FORECAST model) and bottom-up (spatial statistics to derive distribution of floor space) approach. Includes all 14 HRE4 countries, plus Denmark.
Credits/Sources: See D2.3 Report “Methodologies and assumptions used in the mapping”, HRE4 project.
H2020-EE-2015-3-MarketUptake / D2.4 PU
20 www.heatroadmap.eu @HeatRoadmapEU
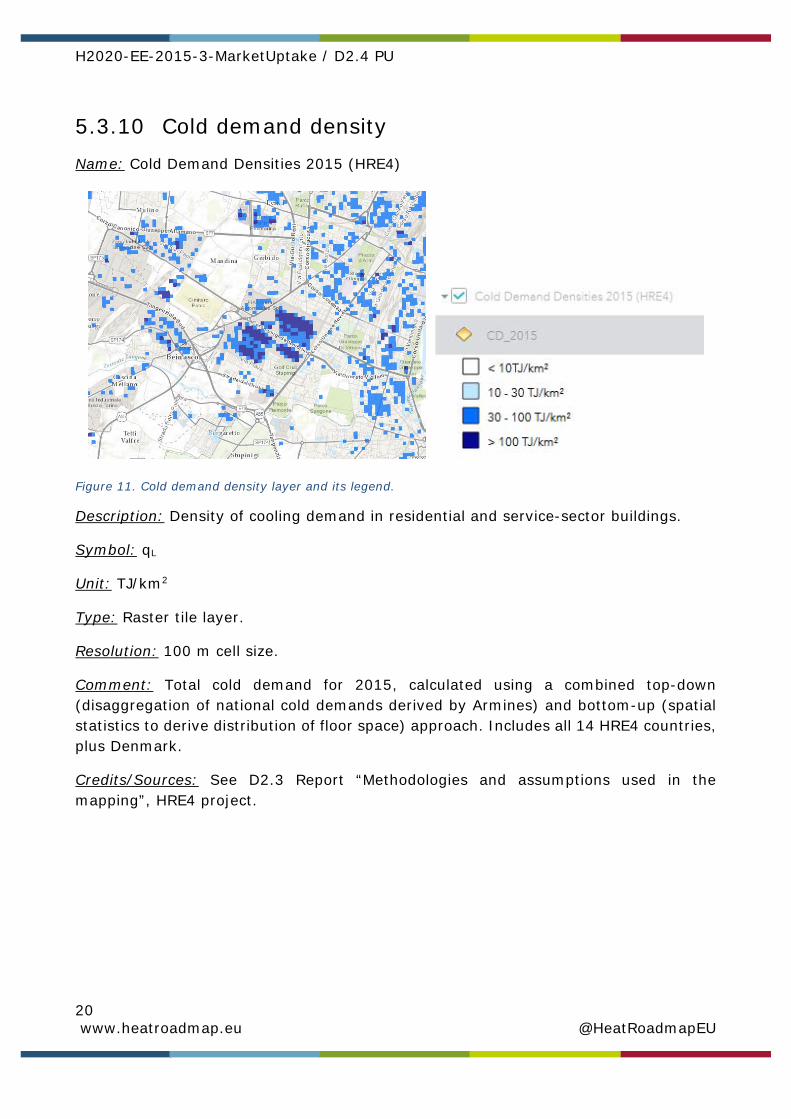
5.3.10 Cold demand density Name: Cold Demand Densities 2015 (HRE4)
Figure 11. Cold demand density layer and its legend.
Description: Density of cooling demand in residential and service-sector buildings.
Symbol: qL
Unit: TJ/km2
Type: Raster tile layer.
Resolution: 100 m cell size.
Comment: Total cold demand for 2015, calculated using a combined top-down (disaggregation of national cold demands derived by Armines) and bottom-up (spatial statistics to derive distribution of floor space) approach. Includes all 14 HRE4 countries, plus Denmark.
Credits/Sources: See D2.3 Report “Methodologies and assumptions used in the mapping”, HRE4 project.
H2020-EE-2015-3-MarketUptake / D2.4 PU
21 www.heatroadmap.eu @HeatRoadmapEU
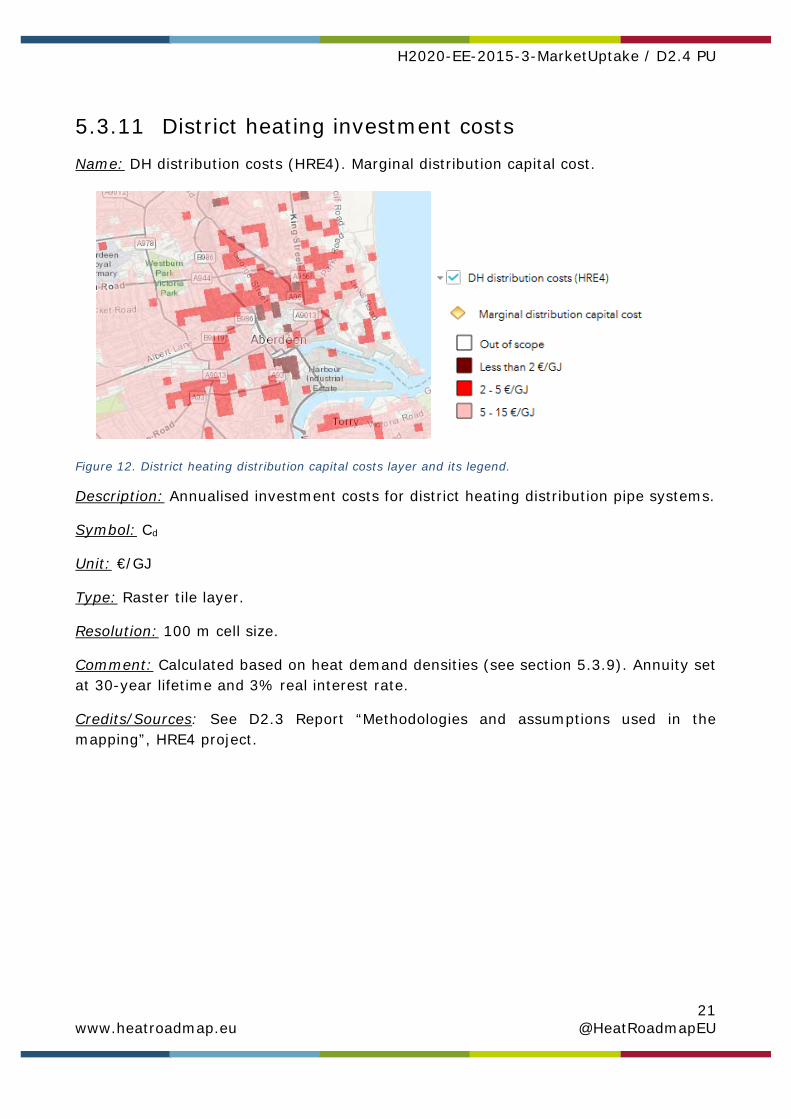
5.3.11 District heating investment costs Name: DH distribution costs (HRE4). Marginal distribution capital cost.
Figure 12. District heating distribution capital costs layer and its legend.
Description: Annualised investment costs for district heating distribution pipe systems.
Symbol: Cd
Unit: €/GJ
Type: Raster tile layer.
Resolution: 100 m cell size.
Comment: Calculated based on heat demand densities (see section 5.3.9). Annuity set at 30-year lifetime and 3% real interest rate.
Credits/Sources: See D2.3 Report “Methodologies and assumptions used in the mapping”, HRE4 project.
H2020-EE-2015-3-MarketUptake / D2.4 PU
22 www.heatroadmap.eu @HeatRoadmapEU
6. Use cases The provided use cases show how users can apply the developed maps. At the same time, they also give an idea of how the web map application functions.
6.1 Use case 1: Explore the regional heat demand
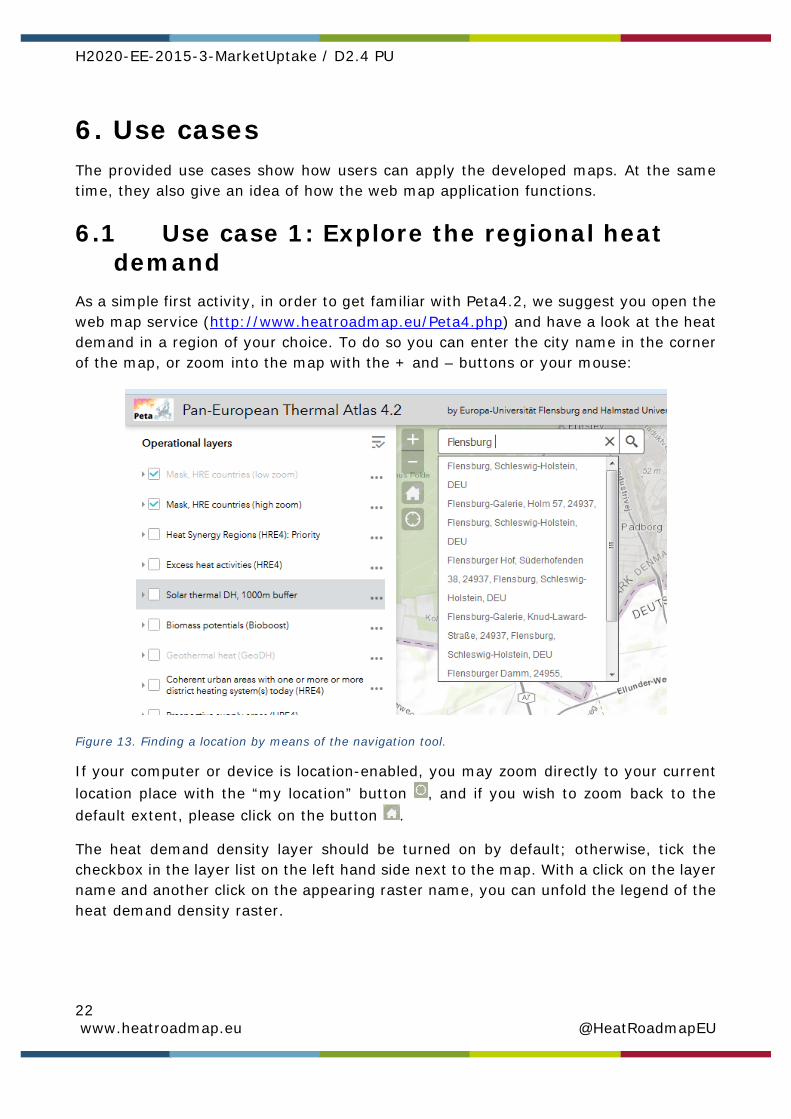
As a simple first activity, in order to get familiar with Peta4.2, we suggest you open the web map service (http://www.heatroadmap.eu/Peta4.php) and have a look at the heat demand in a region of your choice. To do so you can enter the city name in the corner of the map, or zoom into the map with the + and – buttons or your mouse:
Figure 13. Finding a location by means of the navigation tool.
If your computer or device is location-enabled, you may zoom directly to your current location place with the “my location” button , and if you wish to zoom back to the default extent, please click on the button .
The heat demand density layer should be turned on by default; otherwise, tick the checkbox in the layer list on the left hand side next to the map. With a click on the layer name and another click on the appearing raster name, you can unfold the legend of the heat demand density raster.
H2020-EE-2015-3-MarketUptake / D2.4 PU
23 www.heatroadmap.eu @HeatRoadmapEU
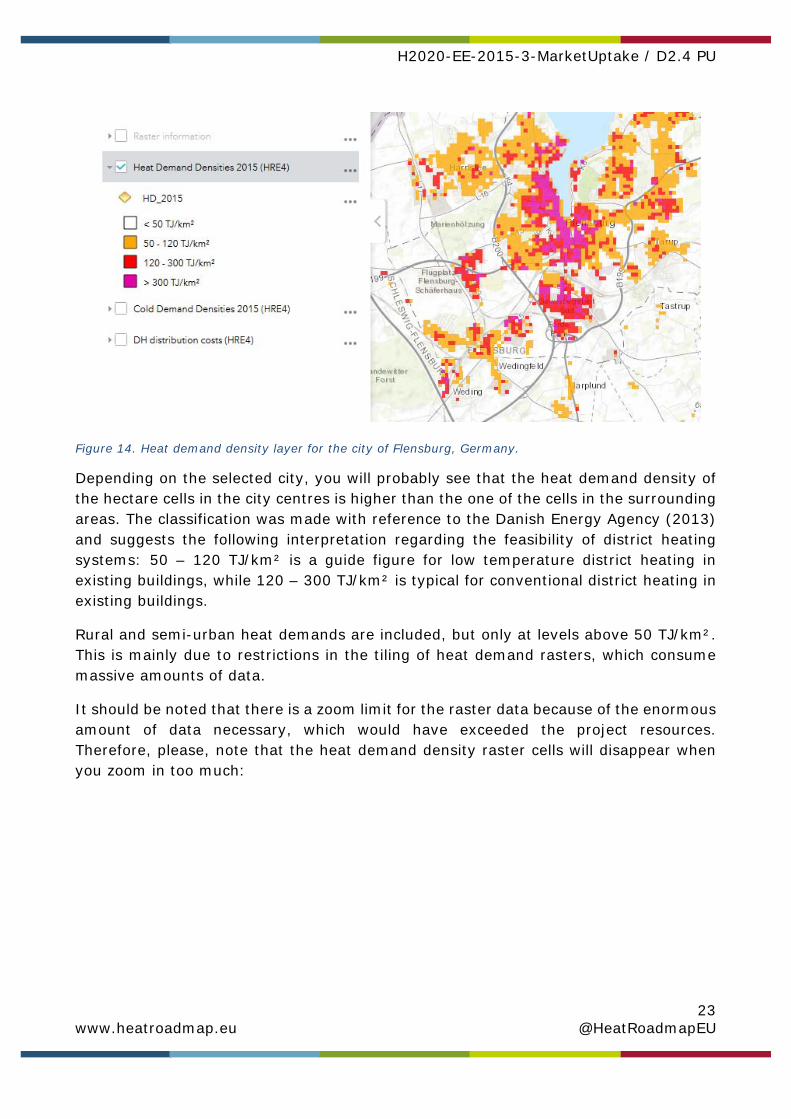
Figure 14. Heat demand density layer for the city of Flensburg, Germany.
Depending on the selected city, you will probably see that the heat demand density of the hectare cells in the city centres is higher than the one of the cells in the surrounding areas. The classification was made with reference to the Danish Energy Agency (2013) and suggests the following interpretation regarding the feasibility of district heating systems: 50 – 120 TJ/km² is a guide figure for low temperature district heating in existing buildings, while 120 – 300 TJ/km² is typical for conventional district heating in existing buildings.
Rural and semi-urban heat demands are included, but only at levels above 50 TJ/km². This is mainly due to restrictions in the tiling of heat demand rasters, which consume massive amounts of data.
It should be noted that there is a zoom limit for the raster data because of the enormous amount of data necessary, which would have exceeded the project resources. Therefore, please, note that the heat demand density raster cells will disappear when you zoom in too much:
H2020-EE-2015-3-MarketUptake / D2.4 PU
24 www.heatroadmap.eu @HeatRoadmapEU
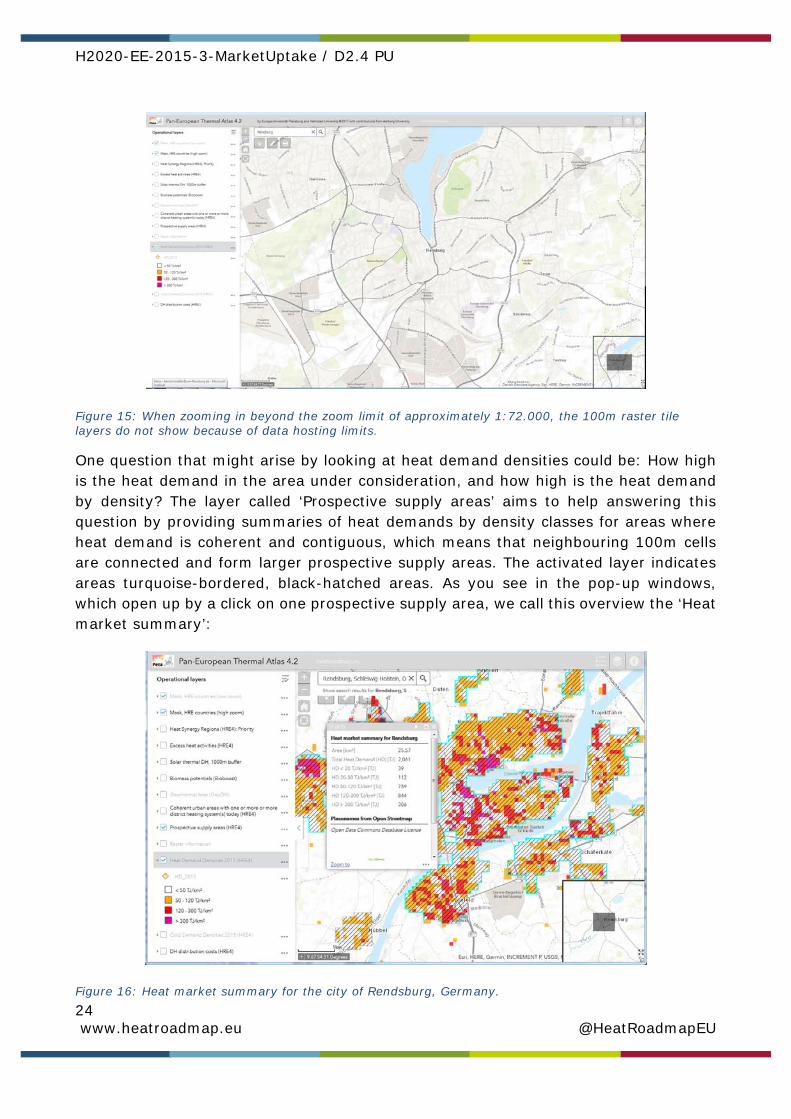
Figure 15: When zooming in beyond the zoom limit of approximately 1:72.000, the 100m raster tile layers do not show because of data hosting limits.
One question that might arise by looking at heat demand densities could be: How high is the heat demand in the area under consideration, and how high is the heat demand by density? The layer called ‘Prospective supply areas’ aims to help answering this question by providing summaries of heat demands by density classes for areas where heat demand is coherent and contiguous, which means that neighbouring 100m cells are connected and form larger prospective supply areas. The activated layer indicates areas turquoise-bordered, black-hatched areas. As you see in the pop-up windows, which open up by a click on one prospective supply area, we call this overview the ‘Heat market summary’:
Figure 16: Heat market summary for the city of Rendsburg, Germany.

H2020-EE-2015-3-MarketUptake / D2.4 PU
25 www.heatroadmap.eu @HeatRoadmapEU
In this case, the German town of Rendsburg has a district heating potential of at least 1,150 TJ, or 56% of the total heat demand, if using current district heating technology. This may increase to over 90% if heat demand densities down to 50 TJ/km² are accepted.
If you are done exploring and wish to send your map with your chosen area of interest to your social networks, by email or embed it into a website, you may do so with the
share button :
Figure 17: Map-sharing window with a hyperlink and buttons for common social networks, as well as an embedding code.
When you ask yourself, whether there is an existing district heating system and sustainable resources in the region studied, continue with the second use case.

H2020-EE-2015-3-MarketUptake / D2.4 PU
26 www.heatroadmap.eu @HeatRoadmapEU
6.2 Use case 2: Identify existing district heating systems and available resources
After exploring a certain region of your interest with the heat demand density layer and the ‘Prospective supply areas’ layer in use case 1, you might wish to learn about the existing district heating systems in the region, and see if there are any sustainable heat sources potentially available to supply it in the future.
The layer called ‘Coherent urban areas with one or more district heating system(s) today’ informs you about the number of existing district heating systems within so called ‘urban morphological zones’ (UMZ). These areas serve as proxies for highly concentrated demand centres. The pop-up windows provide also the population size, geographical area and the amount of district heating annually sold within theses UMZs.
The following example shows the town of Växjö, Sweden, where there are two existing district heating systems, which cover a little less than 1,900 TJ in annual demand:
Figure 18: Account of existing district heating systems in the Swedish town of Växjö.
From the first use case, we recall that the layer “Prospective supply areas (HRE)”, which gives us a summary of the modelled heat demand:
H2020-EE-2015-3-MarketUptake / D2.4 PU
27 www.heatroadmap.eu @HeatRoadmapEU
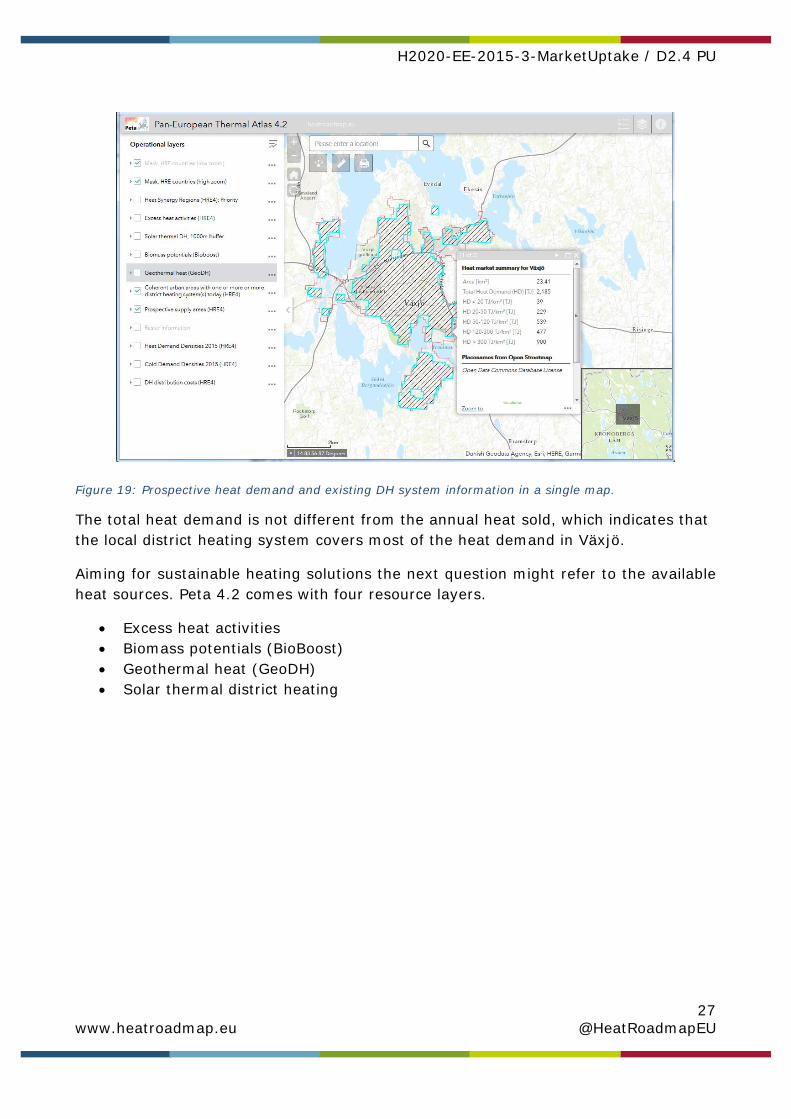
Figure 19: Prospective heat demand and existing DH system information in a single map.
The total heat demand is not different from the annual heat sold, which indicates that the local district heating system covers most of the heat demand in Växjö.
Aiming for sustainable heating solutions the next question might refer to the available heat sources. Peta 4.2 comes with four resource layers.
Excess heat activities Biomass potentials (BioBoost) Geothermal heat (GeoDH) Solar thermal district heating

H2020-EE-2015-3-MarketUptake / D2.4 PU
28 www.heatroadmap.eu @HeatRoadmapEU
Figure 20. Four layers with available heat sources from excess heat activities and renewable energy.
6.2.1 Excess heat Excess heat from industrial facilities and combustion-based electricity production can play a role in present and future energy systems. Peta 4.2 contains 2188 individual excess heat activities, for which the potential (maximum) theoretical excess heat volumes have been calculated. You can retrieve these data by activating the “Excess heat activities (HRE4)” layer:
H2020-EE-2015-3-MarketUptake / D2.4 PU
29 www.heatroadmap.eu @HeatRoadmapEU
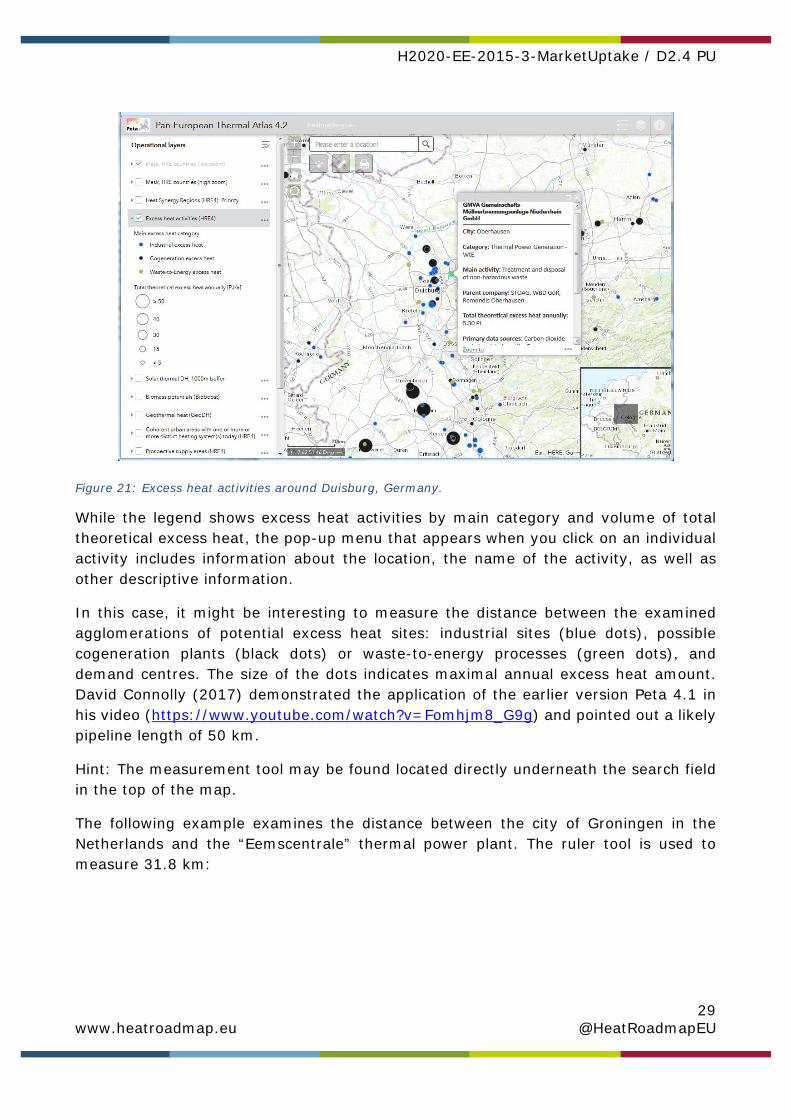
Figure 21: Excess heat activities around Duisburg, Germany.
While the legend shows excess heat activities by main category and volume of total theoretical excess heat, the pop-up menu that appears when you click on an individual activity includes information about the location, the name of the activity, as well as other descriptive information.
In this case, it might be interesting to measure the distance between the examined agglomerations of potential excess heat sites: industrial sites (blue dots), possible cogeneration plants (black dots) or waste-to-energy processes (green dots), and demand centres. The size of the dots indicates maximal annual excess heat amount. David Connolly (2017) demonstrated the application of the earlier version Peta 4.1 in his video (https://www.youtube.com/watch?v=Fomhjm8_G9g) and pointed out a likely pipeline length of 50 km.
Hint: The measurement tool may be found located directly underneath the search field in the top of the map.
The following example examines the distance between the city of Groningen in the Netherlands and the “Eemscentrale” thermal power plant. The ruler tool is used to measure 31.8 km:
H2020-EE-2015-3-MarketUptake / D2.4 PU
30 www.heatroadmap.eu @HeatRoadmapEU
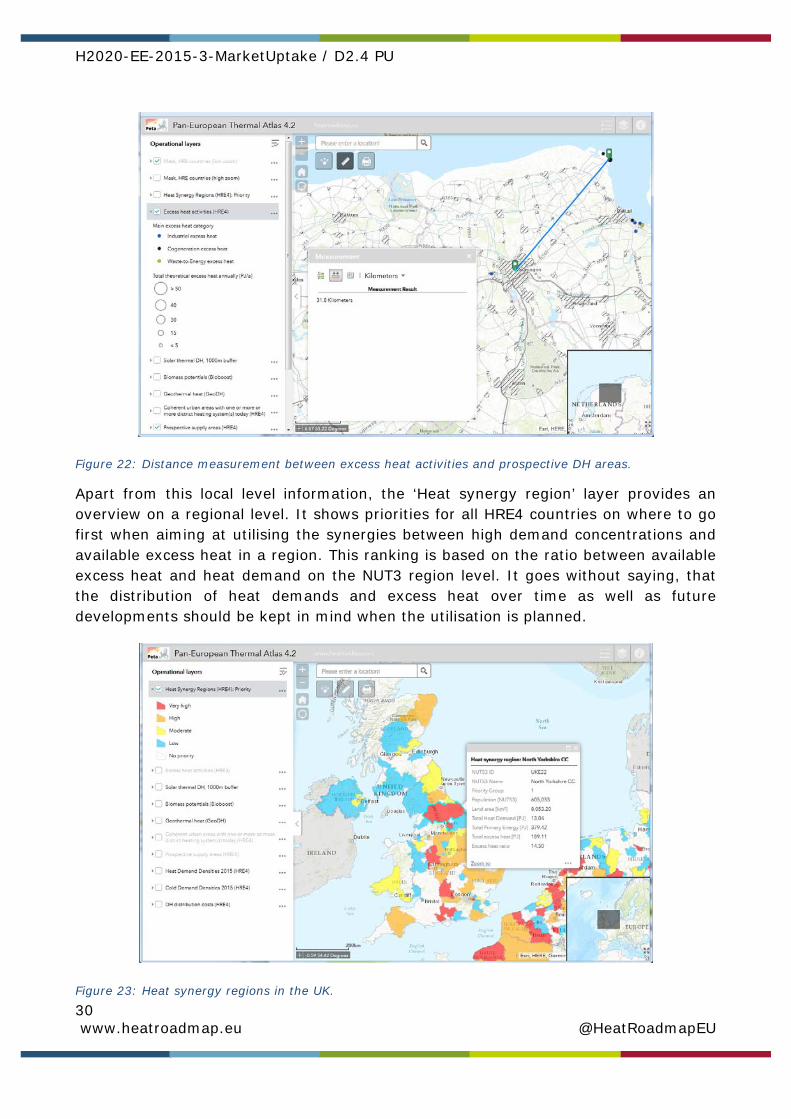
Figure 22: Distance measurement between excess heat activities and prospective DH areas.
Apart from this local level information, the ‘Heat synergy region’ layer provides an overview on a regional level. It shows priorities for all HRE4 countries on where to go first when aiming at utilising the synergies between high demand concentrations and available excess heat in a region. This ranking is based on the ratio between available excess heat and heat demand on the NUT3 region level. It goes without saying, that the distribution of heat demands and excess heat over time as well as future developments should be kept in mind when the utilisation is planned.
Figure 23: Heat synergy regions in the UK.
H2020-EE-2015-3-MarketUptake / D2.4 PU
31 www.heatroadmap.eu @HeatRoadmapEU
The example here shows data about the heat synergy region of North Yorkshire County Council as one of the NUTS3 districts in the UK that has a first priority as a heat synergy region. There is 14.5 times the annual heat demand available as total theoretical excess heat annually emitted from industry and power plants.
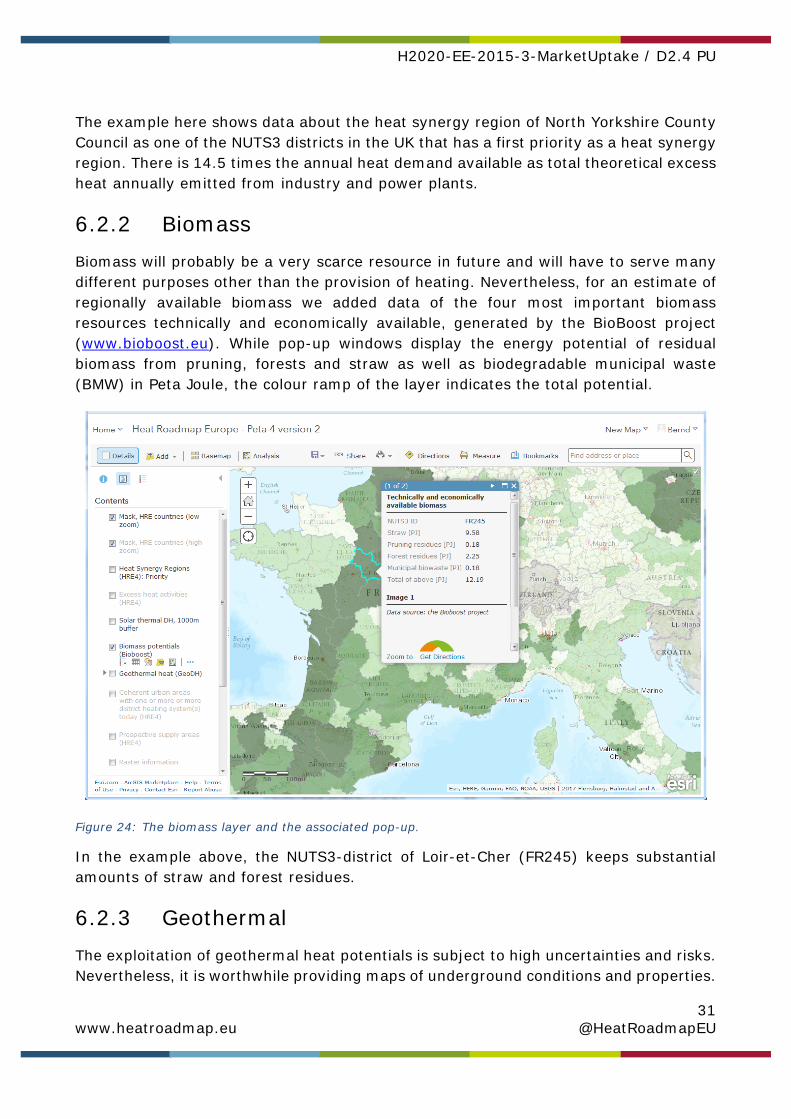
6.2.2 Biomass Biomass will probably be a very scarce resource in future and will have to serve many different purposes other than the provision of heating. Nevertheless, for an estimate of regionally available biomass we added data of the four most important biomass resources technically and economically available, generated by the BioBoost project (www.bioboost.eu). While pop-up windows display the energy potential of residual biomass from pruning, forests and straw as well as biodegradable municipal waste (BMW) in Peta Joule, the colour ramp of the layer indicates the total potential.
Figure 24: The biomass layer and the associated pop-up.
In the example above, the NUTS3-district of Loir-et-Cher (FR245) keeps substantial amounts of straw and forest residues.
6.2.3 Geothermal The exploitation of geothermal heat potentials is subject to high uncertainties and risks. Nevertheless, it is worthwhile providing maps of underground conditions and properties.
H2020-EE-2015-3-MarketUptake / D2.4 PU
32 www.heatroadmap.eu @HeatRoadmapEU
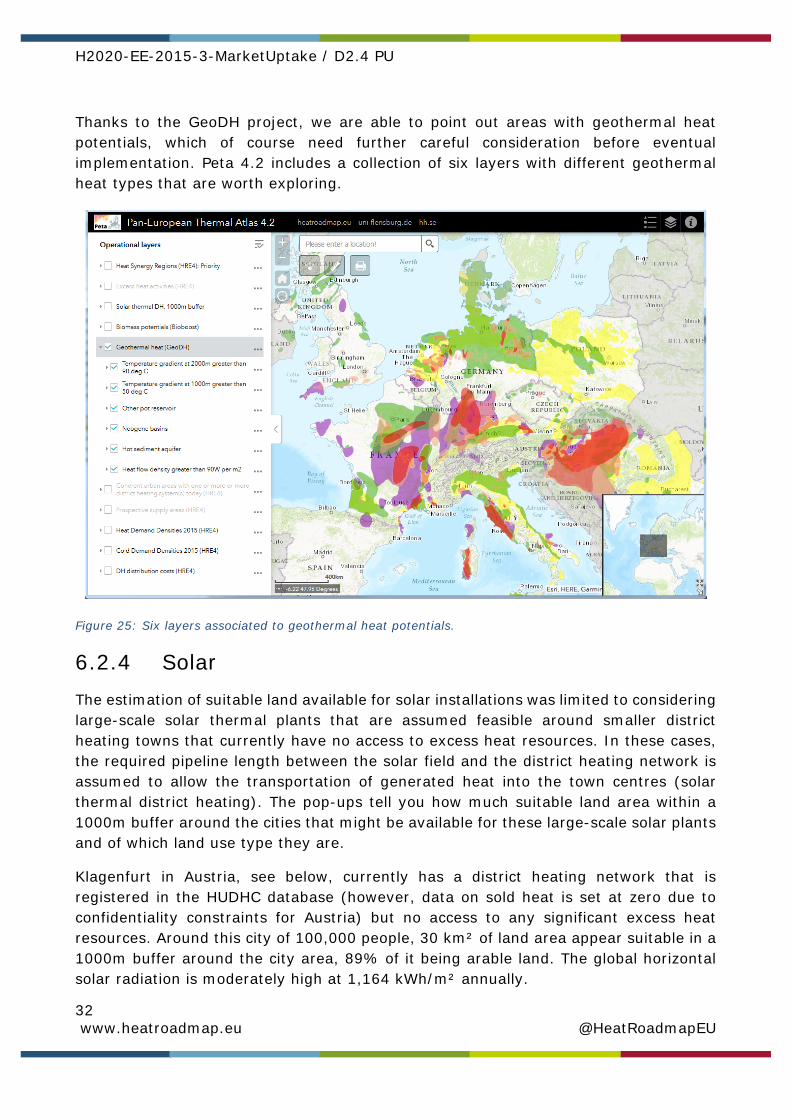
Thanks to the GeoDH project, we are able to point out areas with geothermal heat potentials, which of course need further careful consideration before eventual implementation. Peta 4.2 includes a collection of six layers with different geothermal heat types that are worth exploring.
Figure 25: Six layers associated to geothermal heat potentials.
6.2.4 Solar The estimation of suitable land available for solar installations was limited to considering large-scale solar thermal plants that are assumed feasible around smaller district heating towns that currently have no access to excess heat resources. In these cases, the required pipeline length between the solar field and the district heating network is assumed to allow the transportation of generated heat into the town centres (solar thermal district heating). The pop-ups tell you how much suitable land area within a 1000m buffer around the cities that might be available for these large-scale solar plants and of which land use type they are.
Klagenfurt in Austria, see below, currently has a district heating network that is registered in the HUDHC database (however, data on sold heat is set at zero due to confidentiality constraints for Austria) but no access to any significant excess heat resources. Around this city of 100,000 people, 30 km² of land area appear suitable in a 1000m buffer around the city area, 89% of it being arable land. The global horizontal solar radiation is moderately high at 1,164 kWh/m² annually.

H2020-EE-2015-3-MarketUptake / D2.4 PU
33 www.heatroadmap.eu @HeatRoadmapEU
Figure 26: Solar thermal heat opportunities in Klagenfurt, Austria.
6.2.5 Comments This list of resources is by far neither comprehensive nor complete. In the future, we aim at proposing local energy mixes for district heat generation, in combination with energy systems analyses carried out at national scales. Nonetheless, Peta 4.2 already provides a great start by allowing for a rough screening of local opportunities.
Please, note that the presented information are generated by top-down modelling or have been taken from existing projects. Therefore, they might be imprecise or outdated. In other words, they are only indicative. Further (bottom-up) research on local or regional levels is required for a more detailed study.
Finally, we want to mention that you are able to change the transparency and the order of the layers (by clicking on the three dots next to the layer name in the layer list). In addition, you can disable the pop-up function if you prefer to do so.
H2020-EE-2015-3-MarketUptake / D2.4 PU
34 www.heatroadmap.eu @HeatRoadmapEU
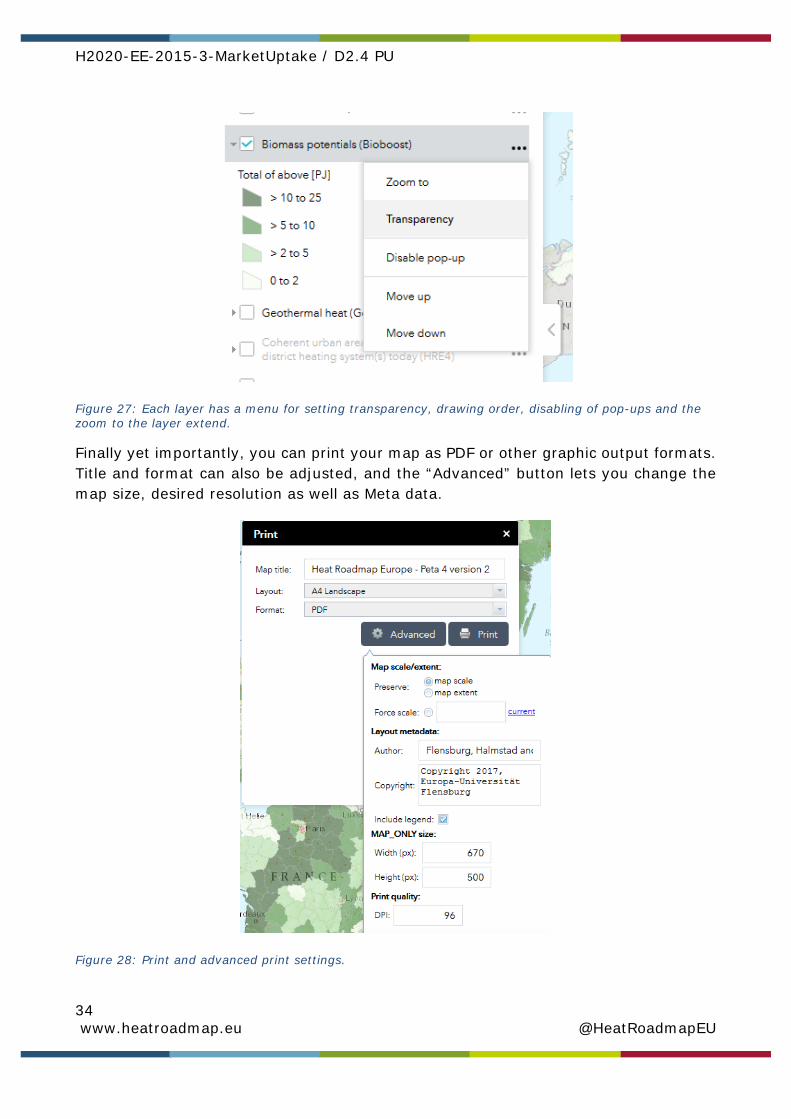
Figure 27: Each layer has a menu for setting transparency, drawing order, disabling of pop-ups and the zoom to the layer extend.
Finally yet importantly, you can print your map as PDF or other graphic output formats. Title and format can also be adjusted, and the “Advanced” button lets you change the map size, desired resolution as well as Meta data.
Figure 28: Print and advanced print settings.
H2020-EE-2015-3-MarketUptake / D2.4 PU
35 www.heatroadmap.eu @HeatRoadmapEU
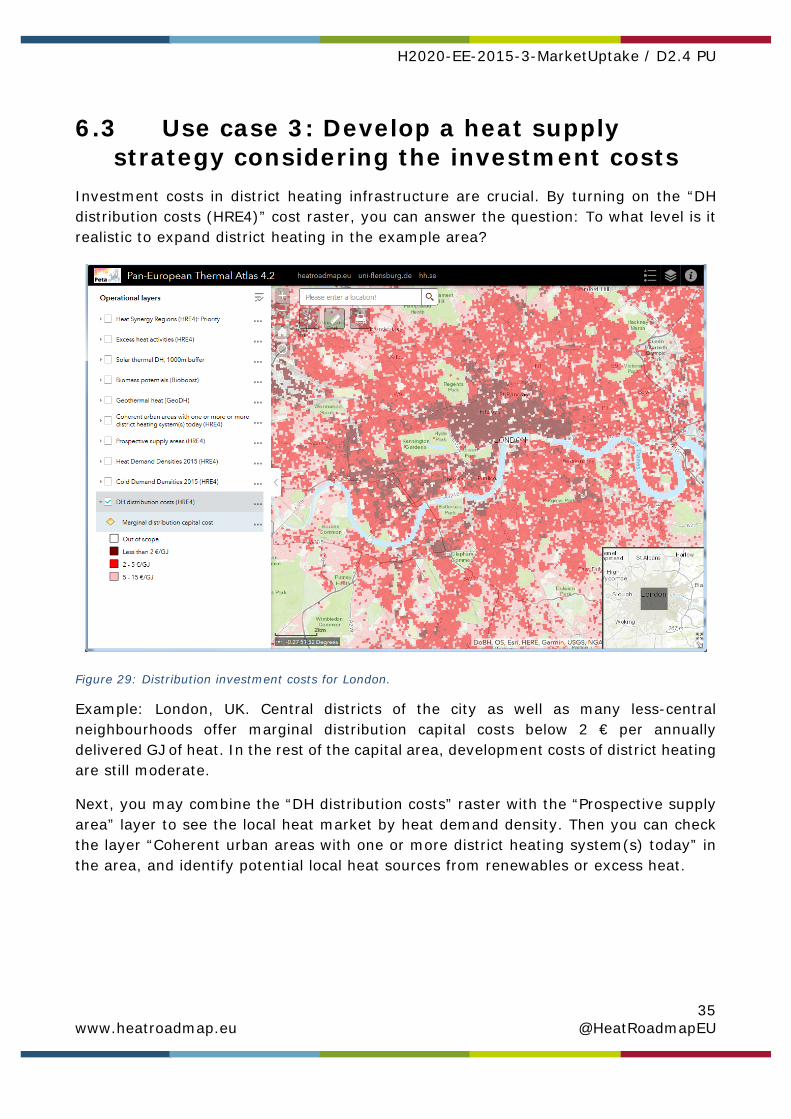
6.3 Use case 3: Develop a heat supply strategy considering the investment costs
Investment costs in district heating infrastructure are crucial. By turning on the “DH distribution costs (HRE4)” cost raster, you can answer the question: To what level is it realistic to expand district heating in the example area?
Figure 29: Distribution investment costs for London.
Example: London, UK. Central districts of the city as well as many less-central neighbourhoods offer marginal distribution capital costs below 2 € per annually delivered GJ of heat. In the rest of the capital area, development costs of district heating are still moderate.
Next, you may combine the “DH distribution costs” raster with the “Prospective supply area” layer to see the local heat market by heat demand density. Then you can check the layer “Coherent urban areas with one or more district heating system(s) today” in the area, and identify potential local heat sources from renewables or excess heat.