Embed Size (px)
Citation preview
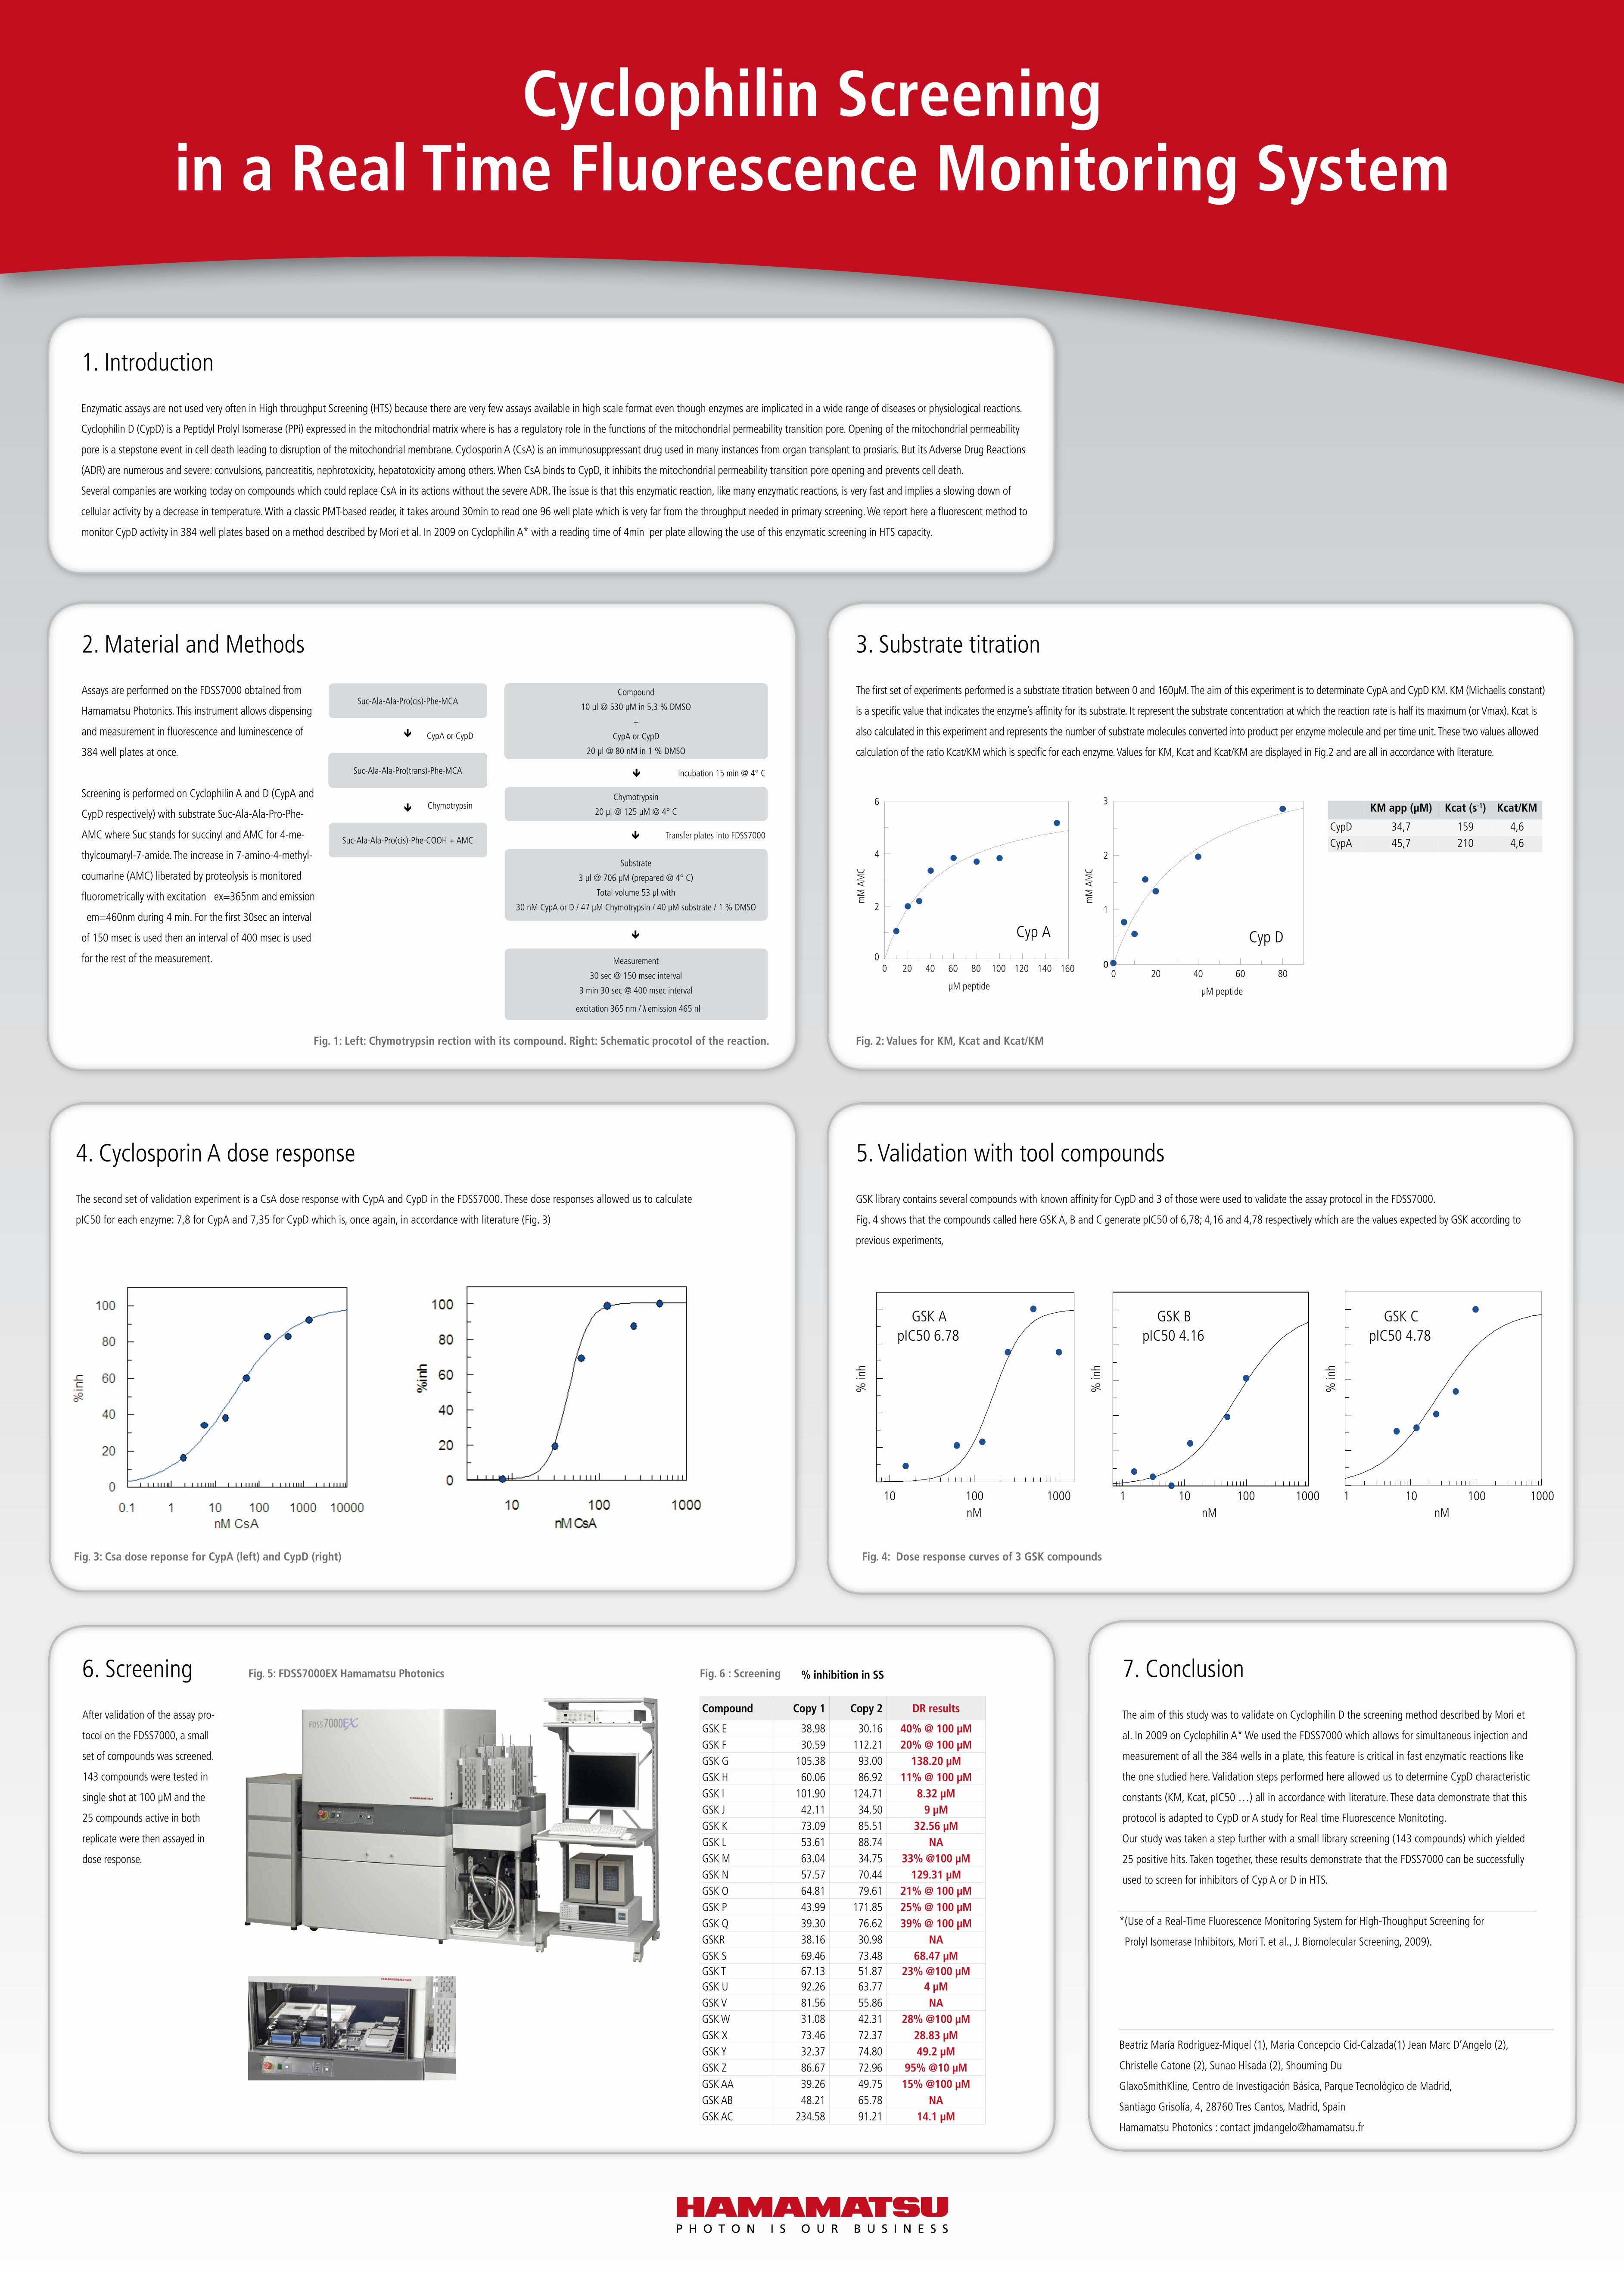
1. Introduction
Enzymatic assays are not used very often in High throughput Screening (HTS) because there are very few assays available in high scale format even though enzymes are implicated in a wide range of diseases or physiological reactions.
Cyclophilin D (CypD) is a Peptidyl Prolyl Isomerase (PPi) expressed in the mitochondrial matrix where is has a regulatory role in the functions of the mitochondrial permeability transition pore. Opening of the mitochondrial permeability
pore is a stepstone event in cell death leading to disruption of the mitochondrial membrane. Cyclosporin A (CsA) is an immunosuppressant drug used in many instances from organ transplant to prosiaris. But its Adverse Drug Reactions
(ADR) are numerous and severe: convulsions, pancreatitis, nephrotoxicity, hepatotoxicity among others. When CsA binds to CypD, it inhibits the mitochondrial permeability transition pore opening and prevents cell death.
Several companies are working today on compounds which could replace CsA in its actions without the severe ADR. The issue is that this enzymatic reaction, like many enzymatic reactions, is very fast and implies a slowing down of
cellular activity by a decrease in temperature. With a classic PMT-based reader, it takes around 30min to read one 96 well plate which is very far from the throughput needed in primary screening. We report here a fluorescent method to
monitor CypD activity in 384 well plates based on a method described by Mori et al. In 2009 on Cyclophilin A* with a reading time of 4min per plate allowing the use of this enzymatic screening in HTS capacity.
4. Cyclosporin A dose response
The second set of validation experiment is a CsA dose response with CypA and CypD in the FDSS7000. These dose responses allowed us to calculate
pIC50 for each enzyme: 7,8 for CypA and 7,35 for CypD which is, once again, in accordance with literature (Fig. 3)
7. Conclusion
The aim of this study was to validate on Cyclophilin D the screening method described by Mori et
al. In 2009 on Cyclophilin A* We used the FDSS7000 which allows for simultaneous injection and
measurement of all the 384 wells in a plate, this feature is critical in fast enzymatic reactions like
the one studied here. Validation steps performed here allowed us to determine CypD characteristic
constants (KM, Kcat, pIC50 …) all in accordance with literature. These data demonstrate that this
protocol is adapted to CypD or A study for Real time Fluorescence Monitoting.
Our study was taken a step further with a small library screening (143 compounds) which yielded
25 positive hits. Taken together, these results demonstrate that the FDSS7000 can be successfully
used to screen for inhibitors of Cyp A or D in HTS.
2. Material and Methods
Assays are performed on the FDSS7000 obtained from
Hamamatsu Photonics. This instrument allows dispensing
and measurement in fluorescence and luminescence of
384 well plates at once.
Screening is performed on Cyclophilin A and D (CypA and
CypD respectively) with substrate Suc-Ala-Ala-Pro-Phe-
AMC where Suc stands for succinyl and AMC for 4-me-
thylcoumaryl-7-amide. The increase in 7-amino-4-methyl-
coumarine (AMC) liberated by proteolysis is monitored
fluorometrically with excitation λ ex=365nm and emission
λ em=460nm during 4 min. For the first 30sec an interval
of 150 msec is used then an interval of 400 msec is used
for the rest of the measurement.
5. Validation with tool compounds
GSK library contains several compounds with known affinity for CypD and 3 of those were used to validate the assay protocol in the FDSS7000.
Fig. 4 shows that the compounds called here GSK A, B and C generate pIC50 of 6,78; 4,16 and 4,78 respectively which are the values expected by GSK according to
previous experiments,
3. Substrate titration
The first set of experiments performed is a substrate titration between 0 and 160µM. The aim of this experiment is to determinate CypA and CypD KM. KM (Michaelis constant)
is a specific value that indicates the enzyme’s affinity for its substrate. It represent the substrate concentration at which the reaction rate is half its maximum (or Vmax). Kcat is
also calculated in this experiment and represents the number of substrate molecules converted into product per enzyme molecule and per time unit. These two values allowed
calculation of the ratio Kcat/KM which is specific for each enzyme. Values for KM, Kcat and Kcat/KM are displayed in Fig.2 and are all in accordance with literature.
6. Screening
After validation of the assay pro-
tocol on the FDSS7000, a small
set of compounds was screened.
143 compounds were tested in
single shot at 100 µM and the
25 compounds active in both
replicate were then assayed in
dose response.
Cyclophilin Screening in a Real Time Fluorescence Monitoring System
Beatriz María Rodríguez-Miquel (1), Maria Concepcio Cid-Calzada(1) Jean Marc D’Angelo (2),
Christelle Catone (2), Sunao Hisada (2), Shouming Du
GlaxoSmithKline, Centro de Investigación Básica, Parque Tecnológico de Madrid,
Santiago Grisolía, 4, 28760 Tres Cantos, Madrid, Spain
Hamamatsu Photonics : contact [email protected]
* (Use of a Real-Time Fluorescence Monitoring System for High-Thoughput Screening for
Prolyl Isomerase Inhibitors, Mori T. et al., J. Biomolecular Screening, 2009).
% inhibition in SS
Compound Copy 1 Copy 2 DR results
GSK E 38.98 30.16 40% @ 100 µMGSK F 30.59 112.21 20% @ 100 µMGSK G 105.38 93.00 138.20 µMGSK H 60.06 86.92 11% @ 100 µMGSK I 101.90 124.71 8.32 µMGSK J 42.11 34.50 9 µMGSK K 73.09 85.51 32.56 µMGSK L 53.61 88.74 NAGSK M 63.04 34.75 33% @100 µMGSK N 57.57 70.44 129.31 µMGSK O 64.81 79.61 21% @ 100 µMGSK P 43.99 171.85 25% @ 100 µMGSK Q 39.30 76.62 39% @ 100 µMGSKR 38.16 30.98 NAGSK S 69.46 73.48 68.47 µMGSK T 67.13 51.87 23% @100 µMGSK U 92.26 63.77 4 µMGSK V 81.56 55.86 NAGSK W 31.08 42.31 28% @100 µMGSK X 73.46 72.37 28.83 µMGSK Y 32.37 74.80 49.2 µMGSK Z 86.67 72.96 95% @10 µMGSK AA 39.26 49.75 15% @100 µMGSK AB 48.21 65.78 NAGSK AC 234.58 91.21 14.1 µM
KM app (µM) Kcat (s-1) Kcat/KM
CypD 34,7 159 4,6CypA 45,7 210 4,6
Fig. 2: Values for KM, Kcat and Kcat/KM Fig. 1: Left: Chymotrypsin rection with its compound. Right: Schematic procotol of the reaction.
Fig. 3: Csa dose reponse for CypA (left) and CypD (right) Fig. 4: Dose response curves of 3 GSK compounds
Fig. 6 : ScreeningFig. 5: FDSS7000EX Hamamatsu Photonics
Suc-Ala-Ala-Pro(cis)-Phe-MCA
CypA or CypD
Chymotrypsin
Suc-Ala-Ala-Pro(trans)-Phe-MCA
Suc-Ala-Ala-Pro(cis)-Phe-COOH + AMC
Compound
10 µl @ 530 µM in 5,3 % DMSO
+
CypA or CypD
20 µl @ 80 nM in 1 % DMSO
Transfer plates into FDSS7000
Chymotrypsin
20 µl @ 125 µM @ 4° C
Substrate
3 µl @ 706 µM (prepared @ 4° C)
Total volume 53 µl with
30 nM CypA or D / 47 µM Chymotrypsin / 40 µM substrate / 1 % DMSO
Measurement
30 sec @ 150 msec interval
3 min 30 sec @ 400 msec interval
λ excitation 365 nm / λ emission 465 nl
Incubation 15 min @ 4° C
nM10 100 1000
pIC50 6.78GSK A
pIC50 4.16GSK B
nM10 100 1000
% in
h
% in
h
% in
h
1
pIC50 4.78GSK C
nM10 100 10001
µM peptide
mM
AM
C
mM
AM
C
0 20 40 60 80 100 120 140 1600
2
4
6
Cyp A
µM peptide
0 20 40 60 800
1
2
3
Cyp D
µM peptide
mM
AM
C
mM
AM
C
0 20 40 60 80 100 120 140 1600
2
4
6
Cyp A
µM peptide
0 20 40 60 800
1
2
3
Cyp D