Embed Size (px)
Citation preview
CUSTOMER SERVICES 2019/2020
BUDGET PRESENTATION August 22, 2018
Steve Hatcher Customer Services Manager
AGENDA • Mission/Vision • Customer Service Strategic Goals • Services Provided • Budget Overview • Budget Drivers • Expenses and Staffing • Next Steps
2
MISSION/VISION MISSION:
We engage customers through exceptional service and customer-focused solutions.
VISION:
To be known for Excellence in our Service to Customers. 3
CUSTOMER SERVICES STRATEGIC GOALS
• Empowering customers with easy to use self service tools that fit their individual needs
• Routing customers to the most knowledgeable employees to answer customer inquiries quickly, efficiently, and completely
• Maintain and enhance customer service by empowering staff with the required authority to accomplish 1st call resolution with robust and modern utility tools
• Developing strategies that meet the needs and requirements of each of our customer segments – Residential, Small and Mid-size business, Key accounts and Low-Income
• Position ourselves to support/participate in Tacoma Power, Water and Environmental Services strategic initiatives
4
SERVICES PROVIDED • Administration – Division oversight and management,
strategic planning. • Customer Solutions – Utility and resource assistance for
seniors/disabled and low income. • Business Office – Call center/lobby services, billing,
payments and commercial services. • Performance Solutions – Benchmarking/analytics, staff
training/development and project management.
5
SERVICES PROVIDED (continued)
• Support Services –TPU switchboard services,
administrative support and contract management.
• Field Operations – Meter reading, field investigative services and mail services operations.
6
BUDGET OVERVIEW
• Enhance low-income assistance effectiveness Expanded staffing – elevates program emphasis and customer support
Higher participation from improved marketing, outreach, and overall program resources
• AMI preparations prior to deployment Begin training of Contact Center staff
Continue transition of Field Operations staff
Work with Click! to train and transition some personnel into Call Center
7
BUDGET DRIVERS • Staffing cost increases due to general wage and benefit assumptions.
• Increase the number of personnel assigned to support the expansion of the Low-
Income Assistance Programs.
• Increase in licensing/maintenance costs associated with software and customer-facing self-service systems.
• Implement a Request for Proposal (RFP) in preparation of the Customer Interaction Center (CIC) replacement project, scheduled for the 2021/2022 biennium.
• Execute a contract with an external call center to add complementary staffing to
support the operation of the CS Contact Center.
8
EXPENSES AND STAFFING
9
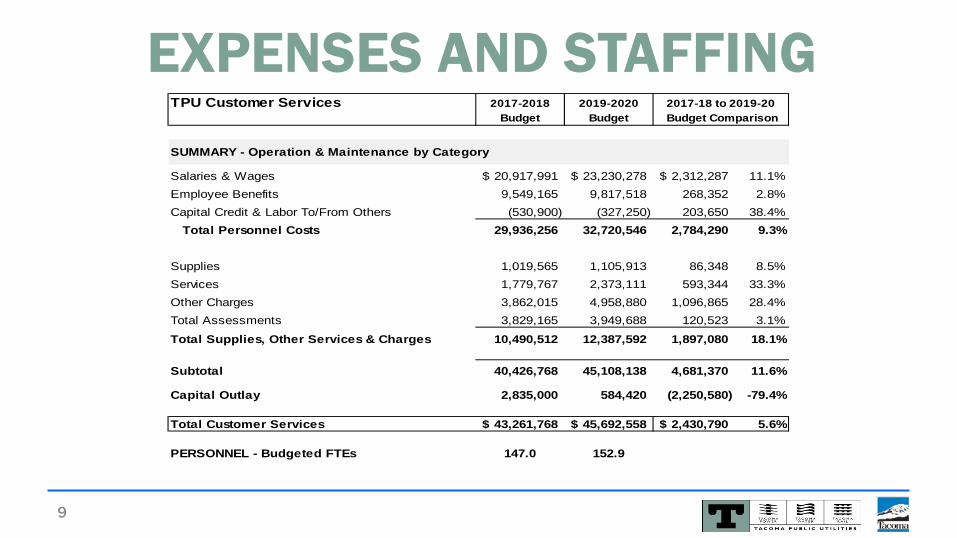
TPU Customer Services 2017-2018 2019-2020Budget Budget
SUMMARY - Operation & Maintenance by Category
Salaries & Wages 20,917,991$ 23,230,278$ 2,312,287$ 11.1%Employee Benefits 9,549,165 9,817,518 268,352 2.8%Capital Credit & Labor To/From Others (530,900) (327,250) 203,650 38.4% Total Personnel Costs 29,936,256 32,720,546 2,784,290 9.3%
Supplies 1,019,565 1,105,913 86,348 8.5%Services 1,779,767 2,373,111 593,344 33.3%Other Charges 3,862,015 4,958,880 1,096,865 28.4%Total Assessments 3,829,165 3,949,688 120,523 3.1%
Total Supplies, Other Services & Charges 10,490,512 12,387,592 1,897,080 18.1%
Subtotal 40,426,768 45,108,138 4,681,370 11.6%
Capital Outlay 2,835,000 584,420 (2,250,580) -79.4%
Total Customer Services 43,261,768$ 45,692,558$ 2,430,790$ 5.6%
PERSONNEL - Budgeted FTEs 147.0 152.9
2017-18 to 2019-20 Budget Comparison
MEETING SUMMARY We welcome your thoughts and ideas about how we can best serve Tacoma Public Utilities and its customers.
Additional Questions? Next Steps and Follow-up items…
10
1 1
Workforce Connect Project
City of Tacoma | Tacoma Public Utilities Enterprise Technology Project
Public Utility Board Study Session
August 22, 2018
2 2
• To provide a background on the Workforce Connect
enterprise project • Review of the vendor selection process • Describe project implementation approach • Background of contract to be approved at Public
Utility Board meeting
Objectives
3 3
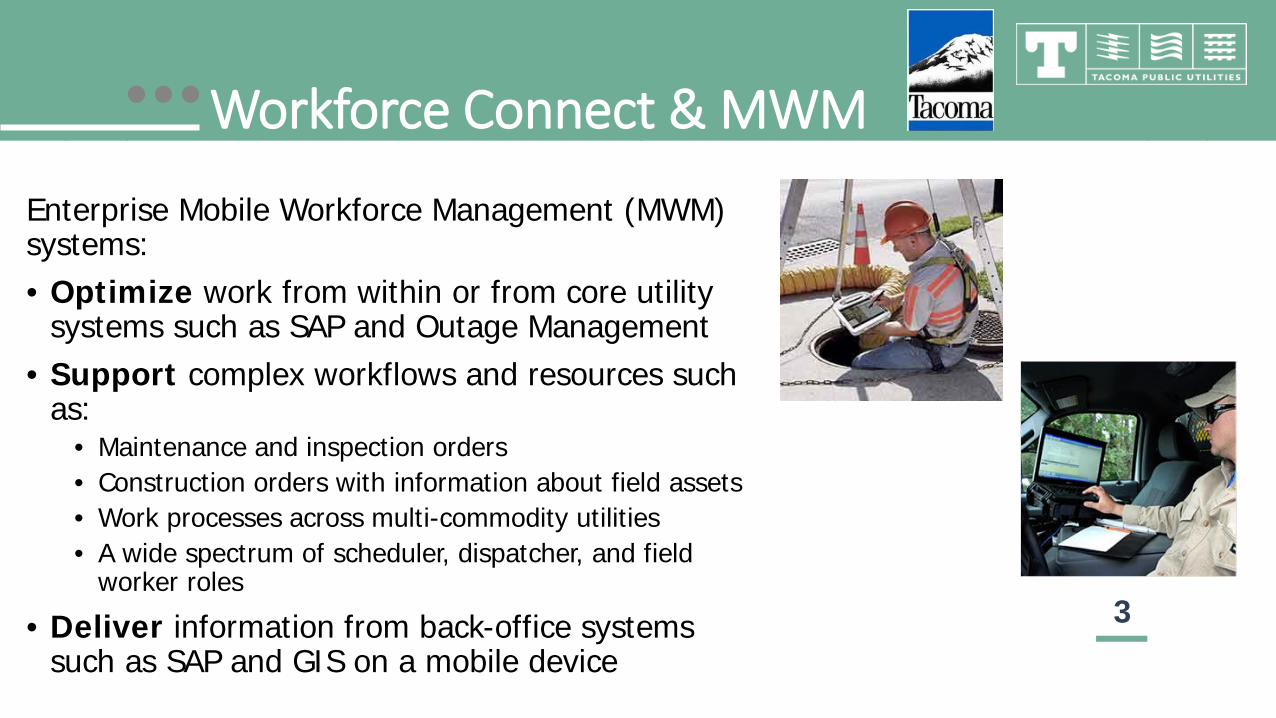
Enterprise Mobile Workforce Management (MWM) systems: • Optimize work from within or from core utility
systems such as SAP and Outage Management • Support complex workflows and resources such
as: • Maintenance and inspection orders • Construction orders with information about field assets • Work processes across multi-commodity utilities • A wide spectrum of scheduler, dispatcher, and field
worker roles
• Deliver information from back-office systems such as SAP and GIS on a mobile device
Workforce Connect & MWM
4 4
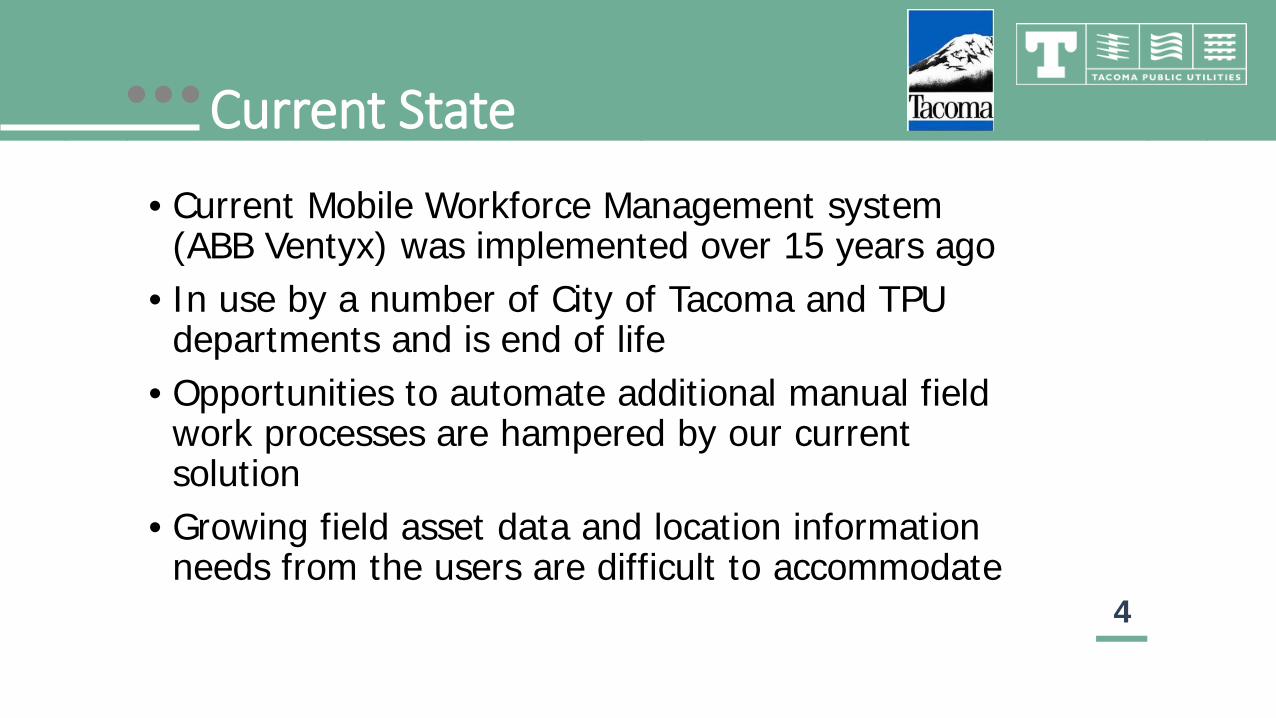
• Current Mobile Workforce Management system (ABB Ventyx) was implemented over 15 years ago
• In use by a number of City of Tacoma and TPU departments and is end of life
• Opportunities to automate additional manual field work processes are hampered by our current solution
• Growing field asset data and location information needs from the users are difficult to accommodate
Current State
5 5
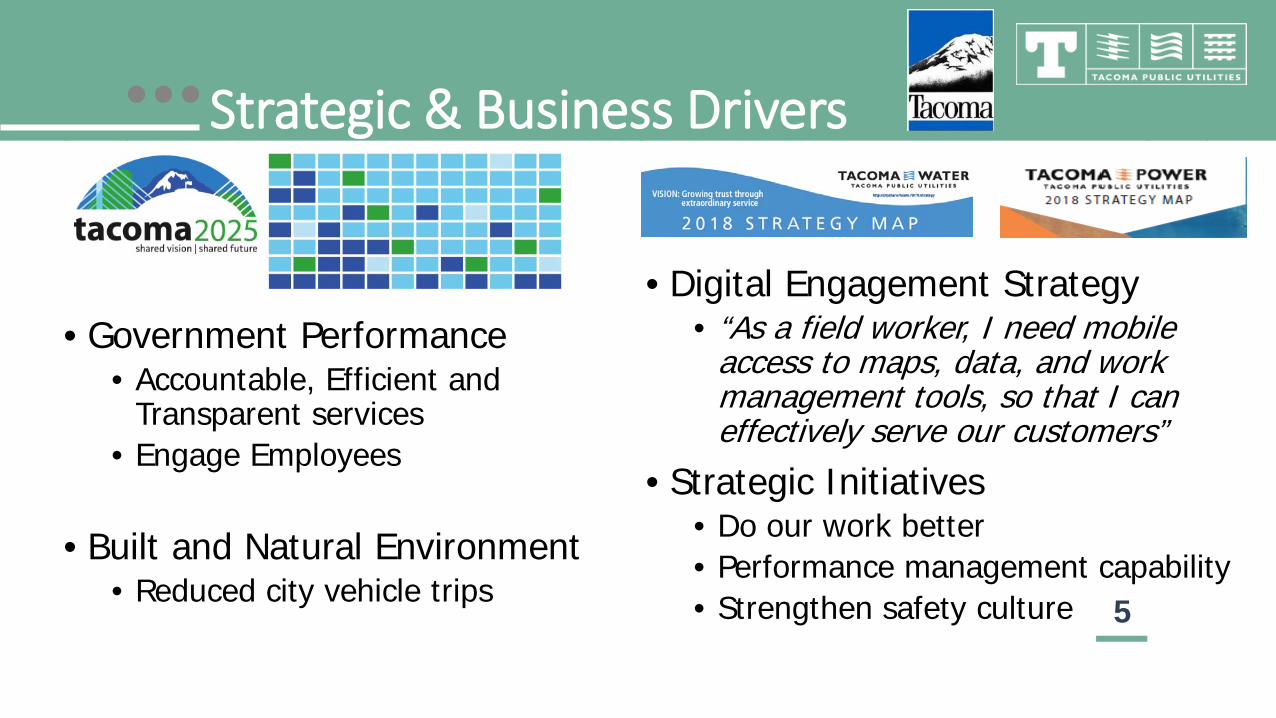
• Digital Engagement Strategy • “As a field worker, I need mobile
access to maps, data, and work management tools, so that I can effectively serve our customers”
• Strategic Initiatives • Do our work better • Performance management capability • Strengthen safety culture
• Government Performance • Accountable, Efficient and
Transparent services • Engage Employees
• Built and Natural Environment • Reduced city vehicle trips
Strategic & Business Drivers
6 6
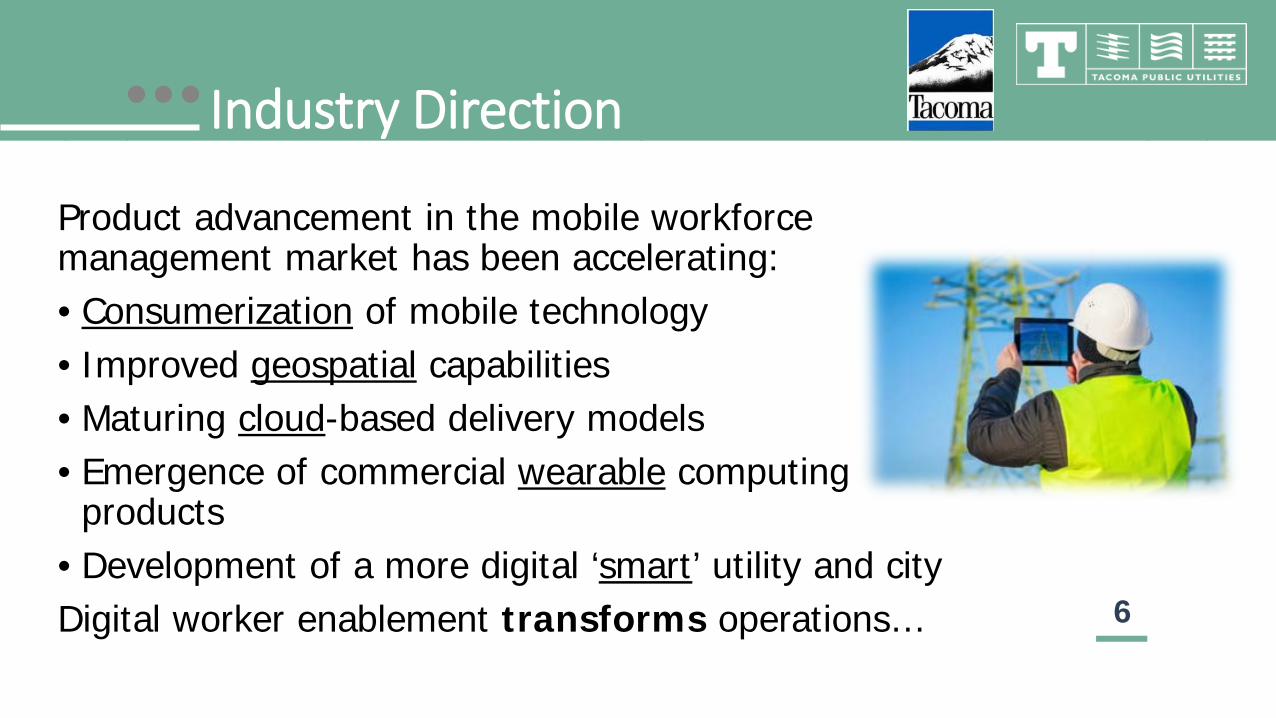
Product advancement in the mobile workforce management market has been accelerating: • Consumerization of mobile technology • Improved geospatial capabilities • Maturing cloud-based delivery models • Emergence of commercial wearable computing
products • Development of a more digital ‘smart’ utility and city Digital worker enablement transforms operations…
Industry Direction
7 7
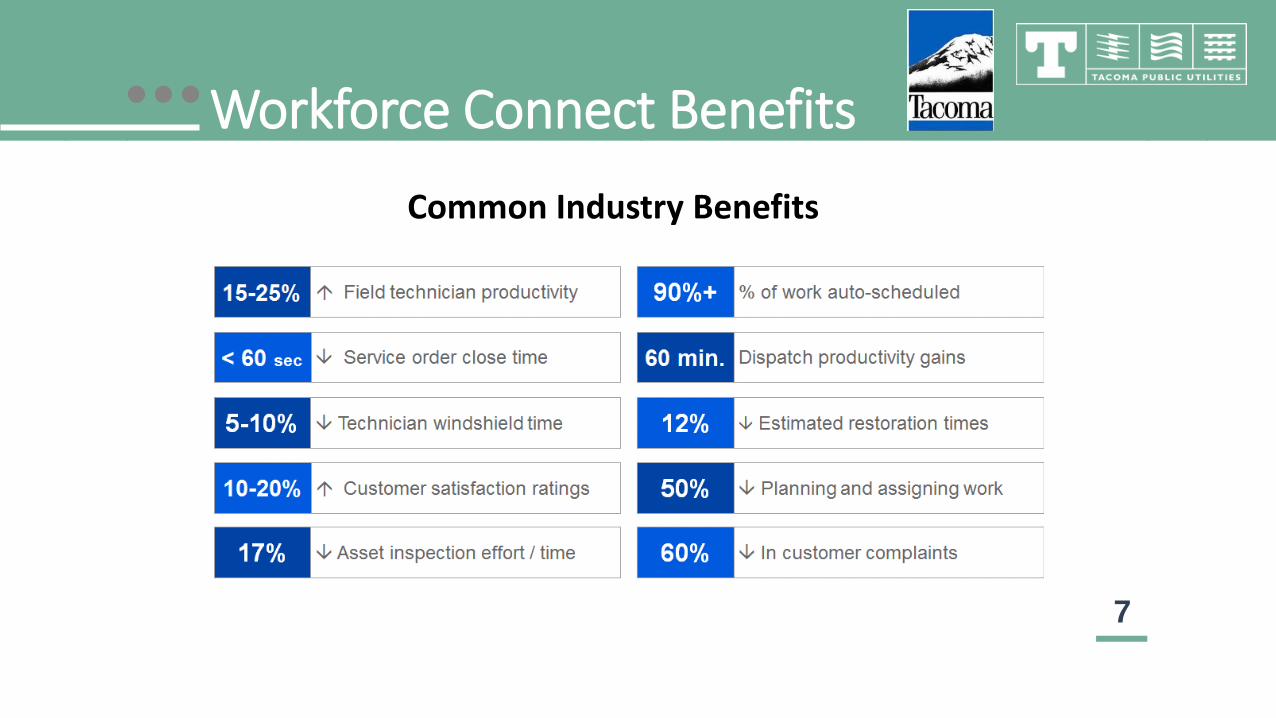
Workforce Connect Benefits
Common Industry Benefits
8 8
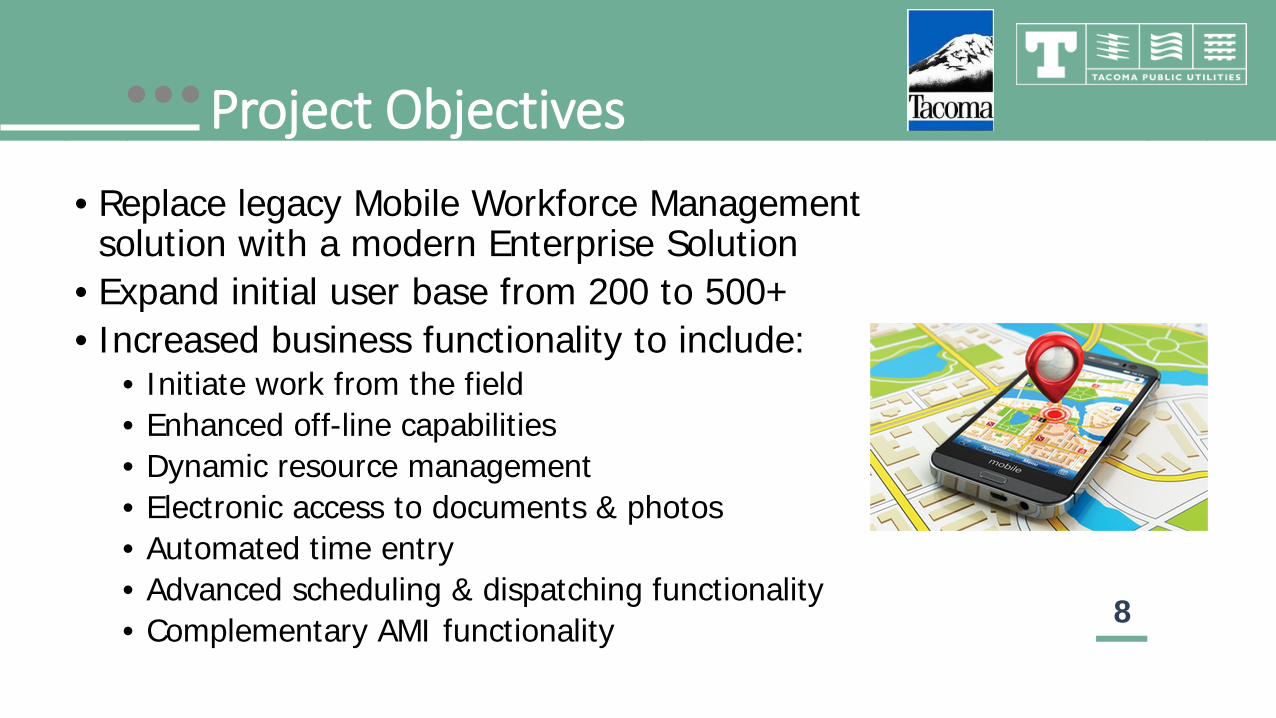
• Replace legacy Mobile Workforce Management solution with a modern Enterprise Solution
• Expand initial user base from 200 to 500+ • Increased business functionality to include:
• Initiate work from the field • Enhanced off-line capabilities • Dynamic resource management • Electronic access to documents & photos • Automated time entry • Advanced scheduling & dispatching functionality • Complementary AMI functionality
Project Objectives
9 9
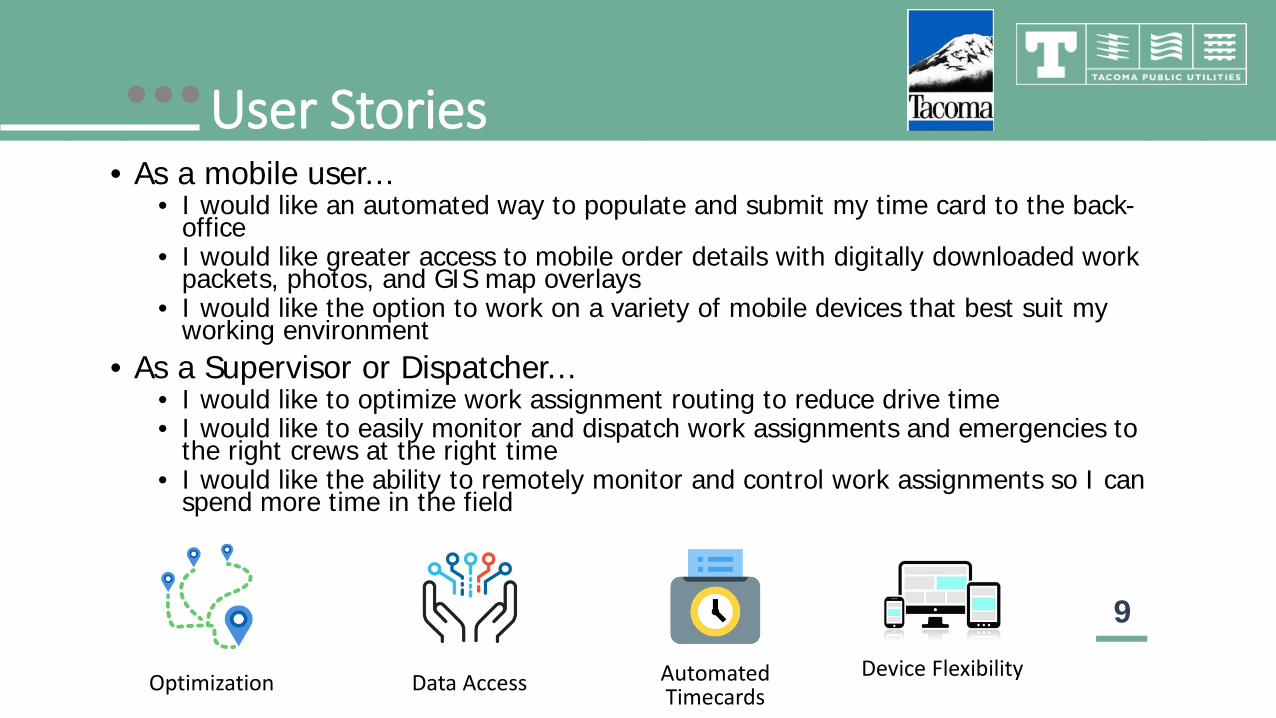
• As a mobile user…
• I would like an automated way to populate and submit my time card to the back-office
• I would like greater access to mobile order details with digitally downloaded work packets, photos, and GIS map overlays
• I would like the option to work on a variety of mobile devices that best suit my working environment
• As a Supervisor or Dispatcher… • I would like to optimize work assignment routing to reduce drive time • I would like to easily monitor and dispatch work assignments and emergencies to
the right crews at the right time • I would like the ability to remotely monitor and control work assignments so I can
spend more time in the field
User Stories
Optimization Data Access Automated Timecards
Device Flexibility
10 10
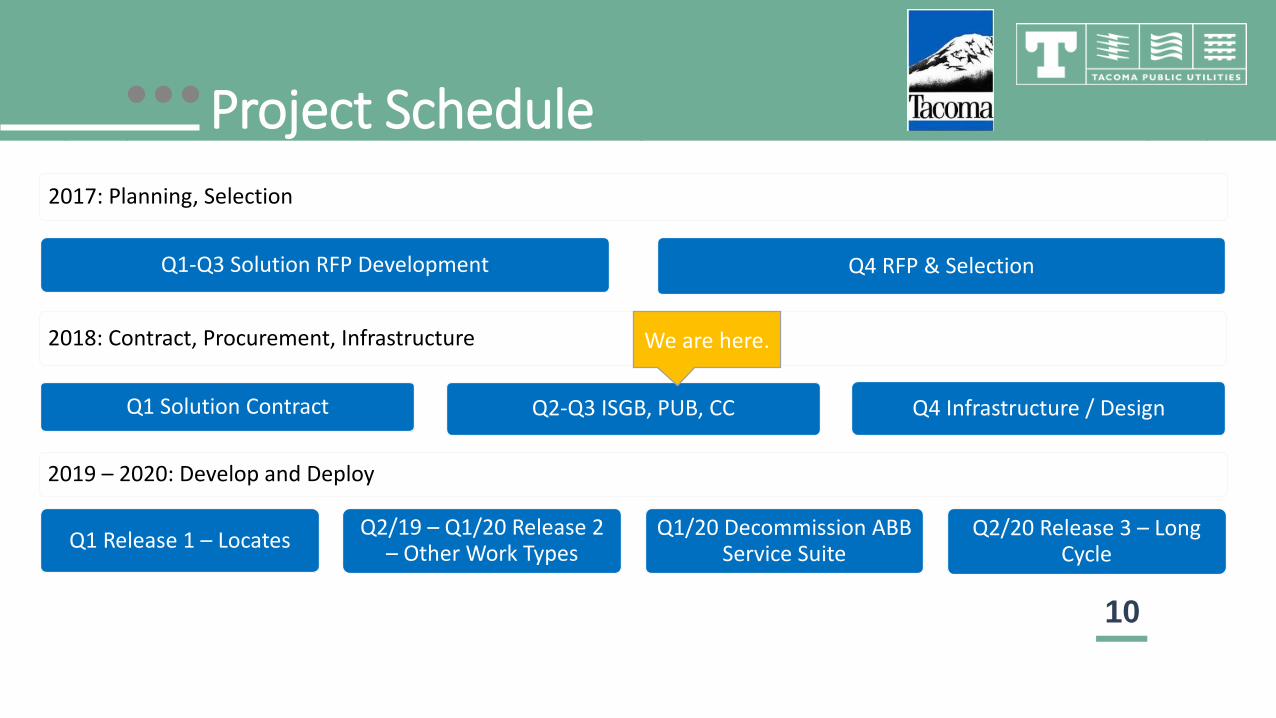
Project Schedule 2017: Planning, Selection
Q1-Q3 Solution RFP Development Q4 RFP & Selection
2018: Contract, Procurement, Infrastructure
Q1 Solution Contract Q2-Q3 ISGB, PUB, CC Q4 Infrastructure / Design
2019 – 2020: Develop and Deploy
Q1 Release 1 – Locates Q2/19 – Q1/20 Release 2 – Other Work Types
Q1/20 Decommission ABB Service Suite
Q2/20 Release 3 – Long Cycle
We are here.
11 11
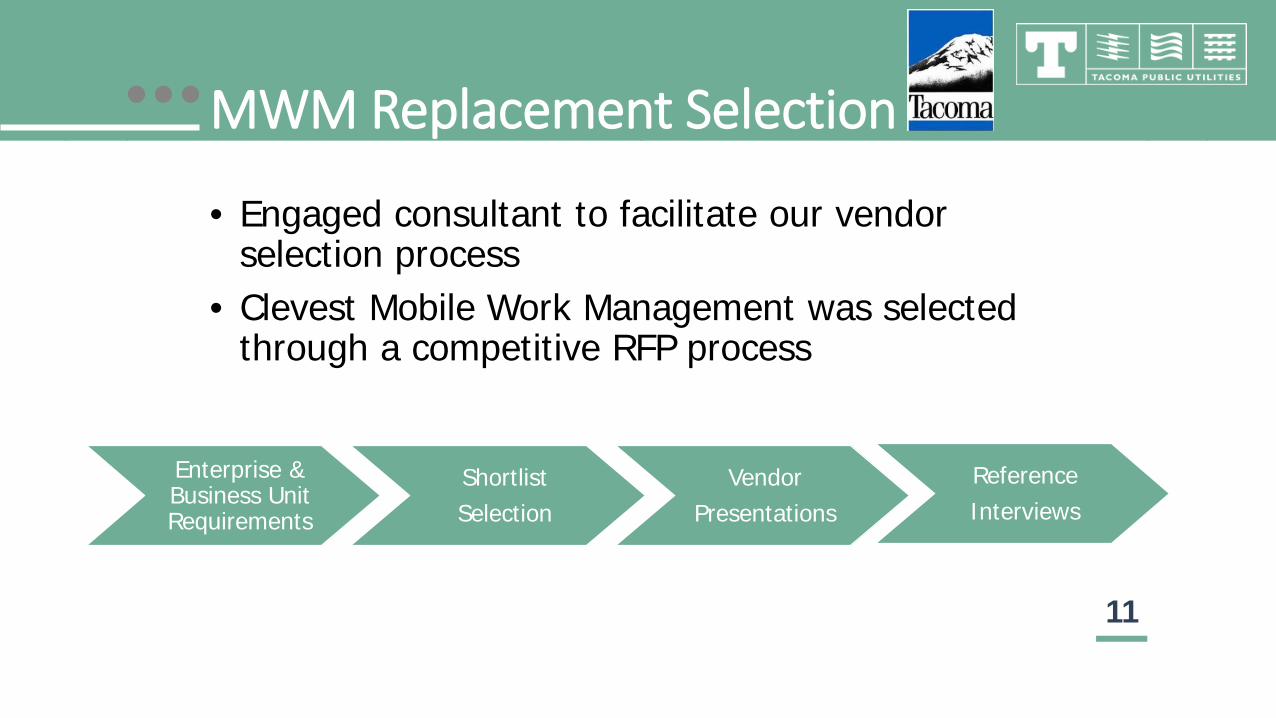
• Engaged consultant to facilitate our vendor selection process
• Clevest Mobile Work Management was selected through a competitive RFP process
MWM Replacement Selection
Enterprise & Business Unit Requirements
Shortlist Selection
Vendor Presentations
Reference Interviews
12 12
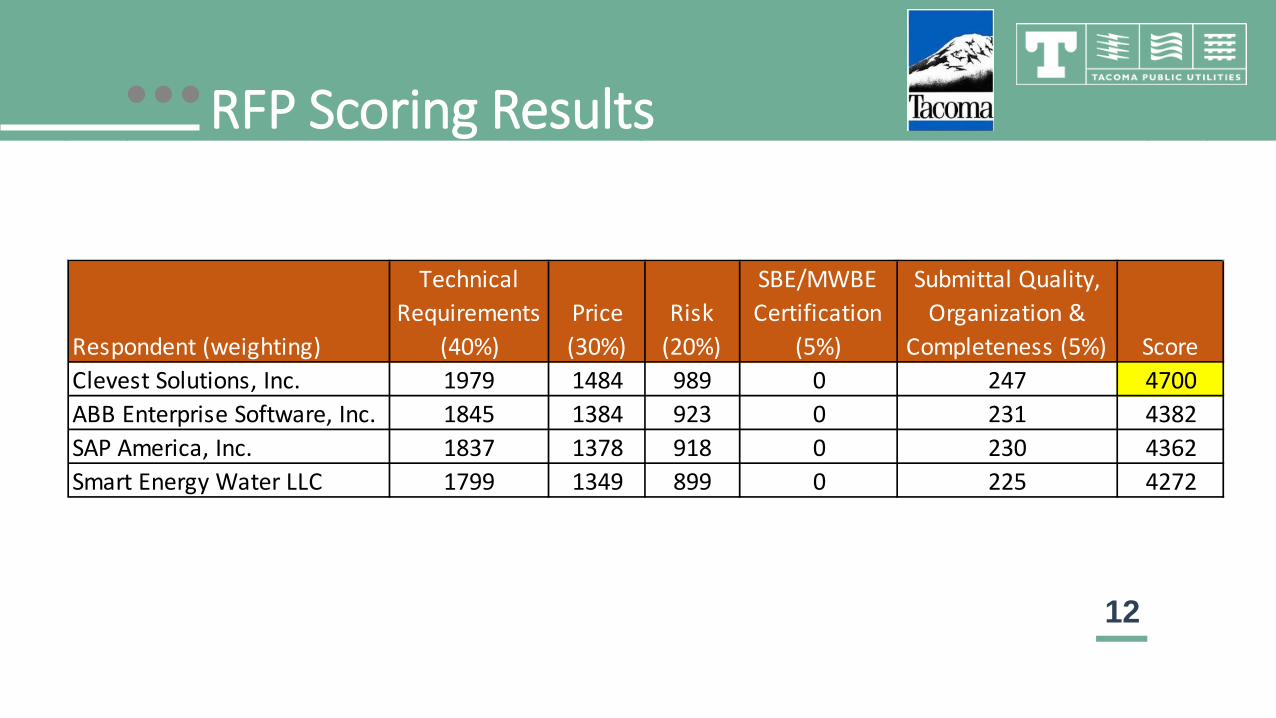
RFP Scoring Results
Respondent (weighting)
Technical Requirements
(40%)Price (30%)
Risk (20%)
SBE/MWBE Certification
(5%)
Submittal Quality, Organization &
Completeness (5%) Score Clevest Solutions, Inc. 1979 1484 989 0 247 4700ABB Enterprise Software, Inc. 1845 1384 923 0 231 4382SAP America, Inc. 1837 1378 918 0 230 4362Smart Energy Water LLC 1799 1349 899 0 225 4272
13 13
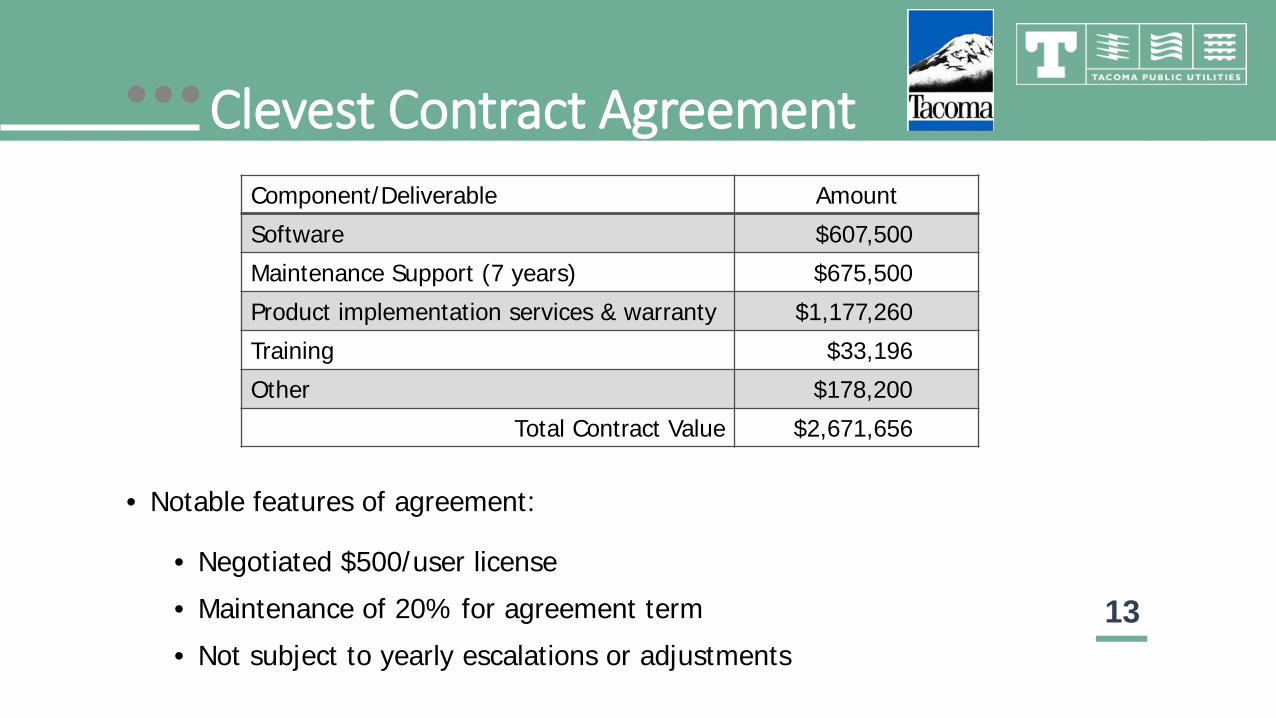
Clevest Contract Agreement
• Notable features of agreement:
• Negotiated $500/user license
• Maintenance of 20% for agreement term
• Not subject to yearly escalations or adjustments
Component/Deliverable Amount
Software $607,500
Maintenance Support (7 years) $675,500
Product implementation services & warranty $1,177,260
Training $33,196
Other $178,200
Total Contract Value $2,671,656
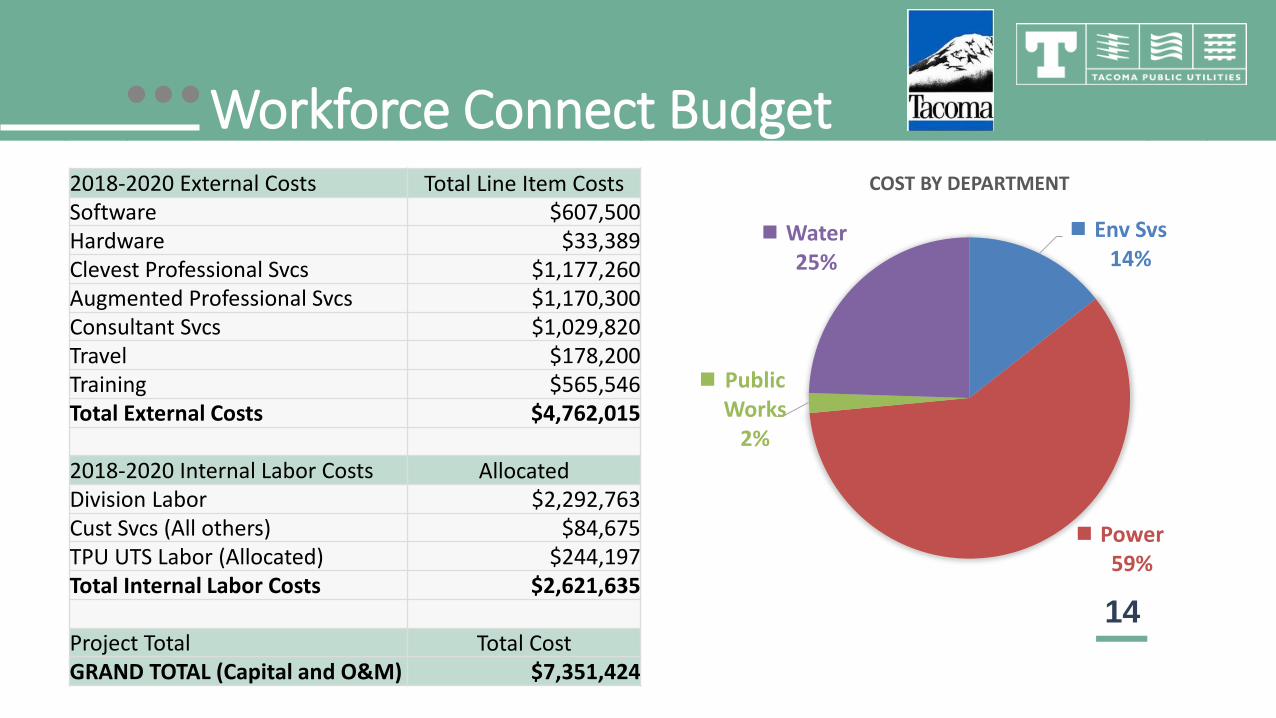
14 14
Workforce Connect Budget 2018-2020 External Costs Total Line Item Costs Software $607,500 Hardware $33,389 Clevest Professional Svcs $1,177,260 Augmented Professional Svcs $1,170,300 Consultant Svcs $1,029,820 Travel $178,200 Training $565,546 Total External Costs $4,762,015 2018-2020 Internal Labor Costs Allocated Division Labor $2,292,763 Cust Svcs (All others) $84,675 TPU UTS Labor (Allocated) $244,197 Total Internal Labor Costs $2,621,635 Project Total Total Cost GRAND TOTAL (Capital and O&M) $7,351,424
Env Svs 14%
Power 59%
Public Works
2%
Water 25%
COST BY DEPARTMENT
15 15
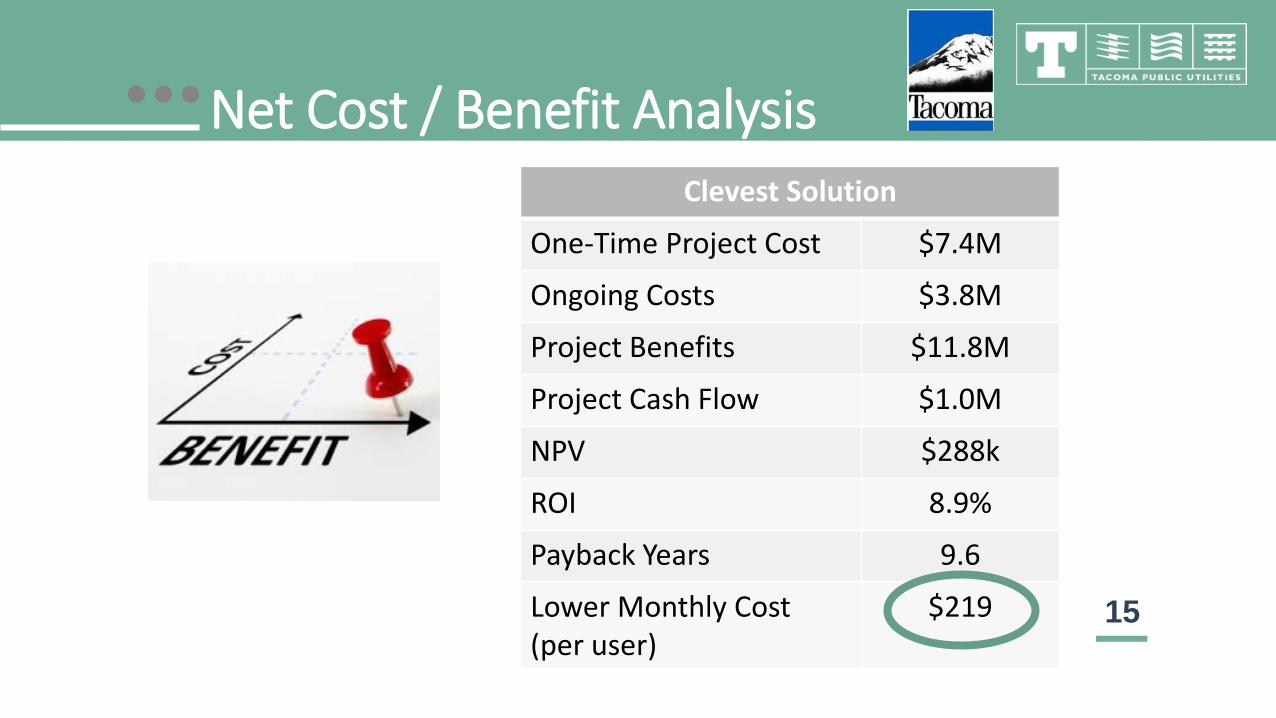
Net Cost / Benefit Analysis Clevest Solution
One-Time Project Cost $7.4M
Ongoing Costs $3.8M
Project Benefits $11.8M
Project Cash Flow $1.0M
NPV $288k
ROI 8.9%
Payback Years 9.6
Lower Monthly Cost (per user)
$219
16 16
Key Takeaways
• Business driven • Better served customers/citizens • Multiple business units participating in project & governance
• Transformational opportunity
17 17
• Contract approval at Public Utility Board • Info session with City Council • Continue project preparation activities • Project initiation planned for Q4 2018
Recommendations/Next Steps
Water Resource Planning
August 22, 2018
• Water System Plan • Integrated Resource Plan
2
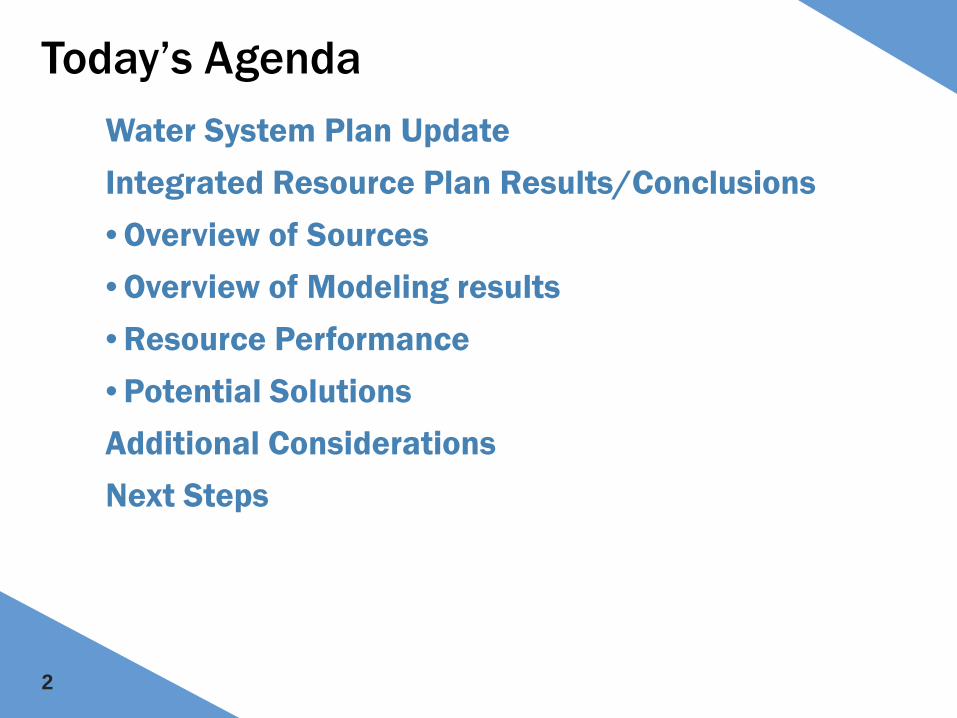
Today’s Agenda Water System Plan Update Integrated Resource Plan Results/Conclusions • Overview of Sources • Overview of Modeling results • Resource Performance • Potential Solutions Additional Considerations Next Steps
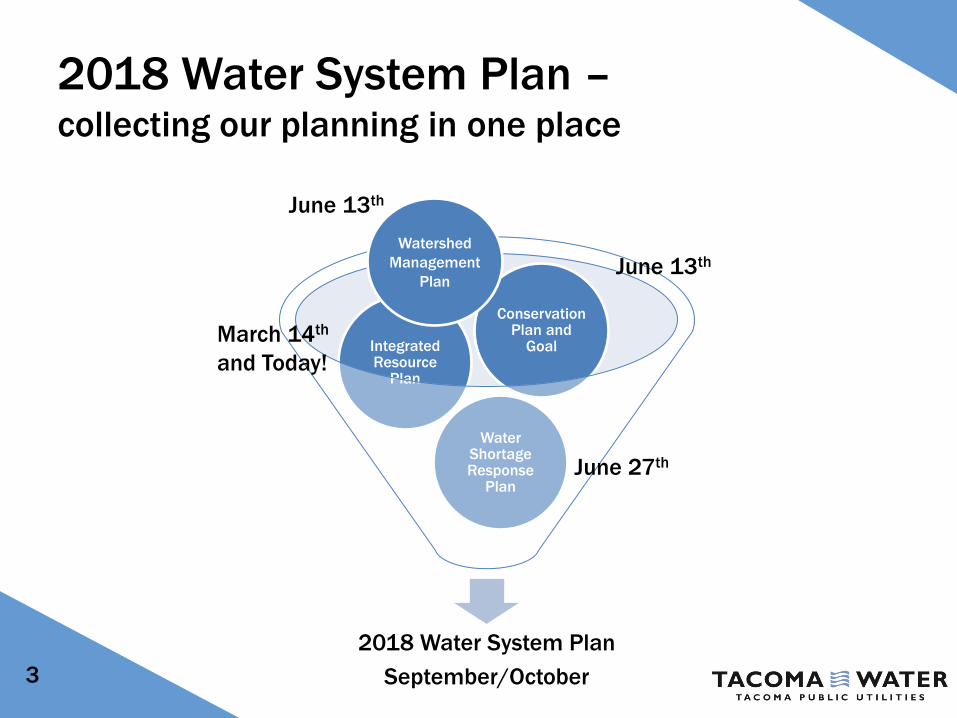
2018 Water System Plan September/October
Water Shortage Response
Plan
Integrated Resource
Plan
Conservation Plan and
Goal
2018 Water System Plan – collecting our planning in one place
3
June 13th
June 27th
March 14th and Today!
June 13th Watershed
Management Plan
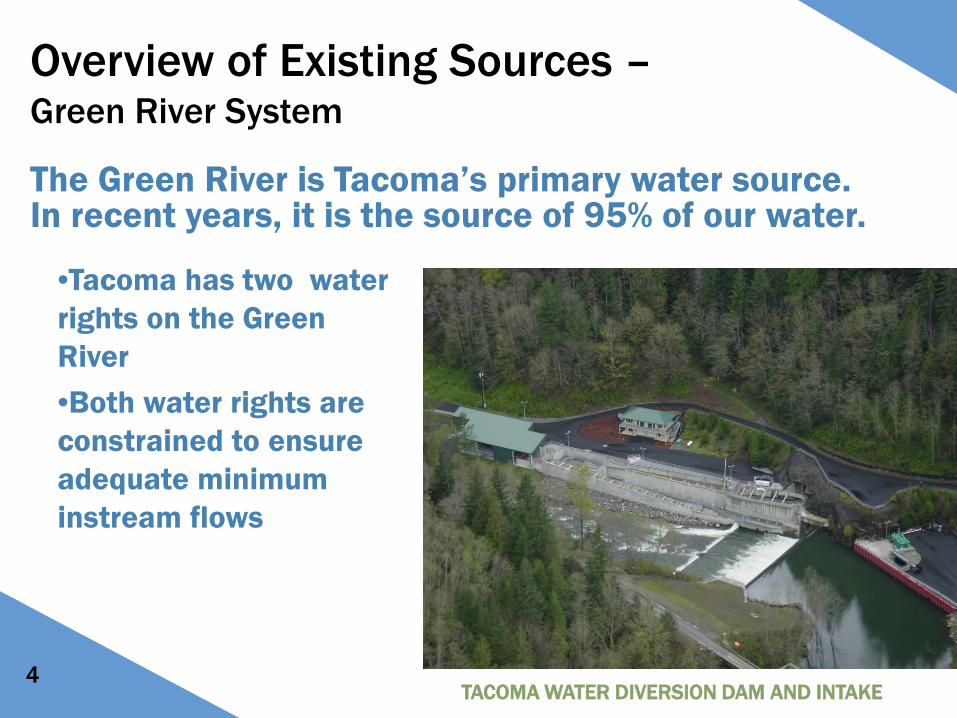
Overview of Existing Sources – Green River System
•Tacoma has two water rights on the Green River •Both water rights are constrained to ensure adequate minimum instream flows
TACOMA WATER DIVERSION DAM AND INTAKE 4
The Green River is Tacoma’s primary water source. In recent years, it is the source of 95% of our water.
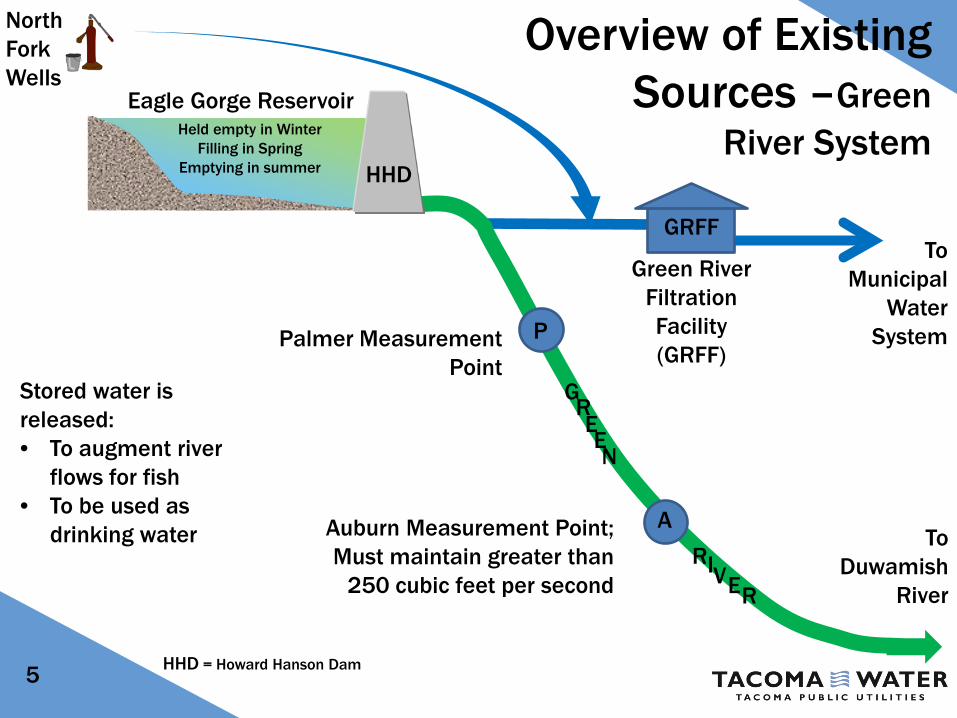
Palmer Measurement Point
Auburn Measurement Point; Must maintain greater than
250 cubic feet per second
Overview of Existing Sources –Green
River System
GRFF
Green River Filtration Facility (GRFF)
Held empty in Winter Filling in Spring
Emptying in summer
P
A
G R E E N
R I V E R
To Duwamish
River
To Municipal
Water System
HHD
North Fork Wells
Stored water is released: • To augment river
flows for fish • To be used as
drinking water
5
Eagle Gorge Reservoir
HHD = Howard Hanson Dam
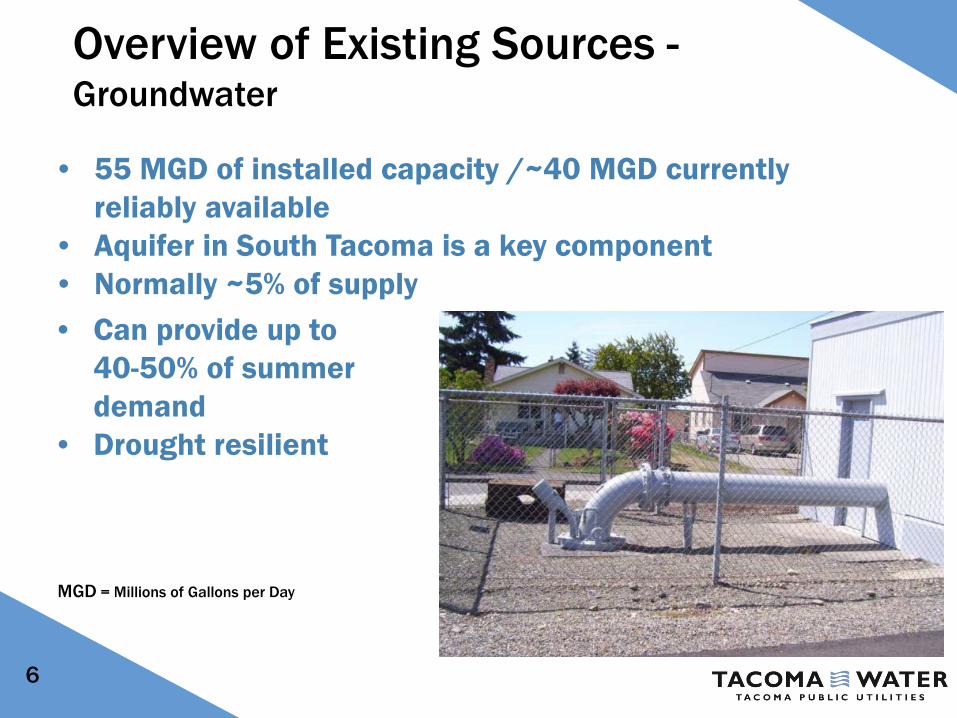
Overview of Existing Sources -Groundwater
MGD = Millions of Gallons per Day
6
• 55 MGD of installed capacity /~40 MGD currently reliably available
• Aquifer in South Tacoma is a key component • Normally ~5% of supply • Can provide up to
40-50% of summer demand
• Drought resilient
7
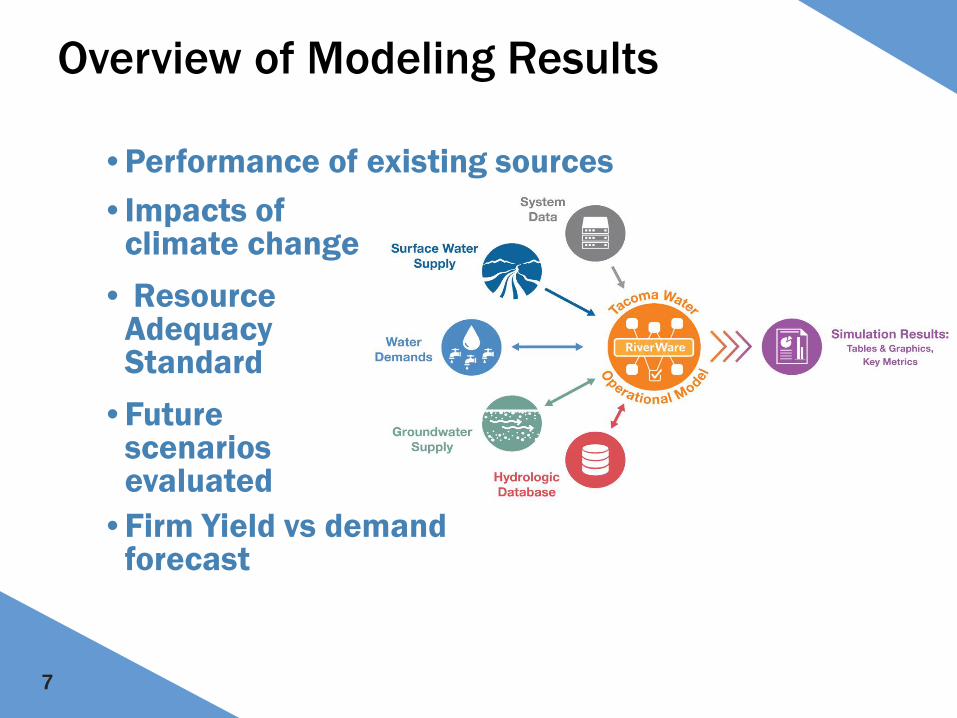
Overview of Modeling Results
• Performance of existing sources
• Impacts of climate change
• Resource Adequacy Standard
• Future scenarios evaluated
• Firm Yield vs demand forecast
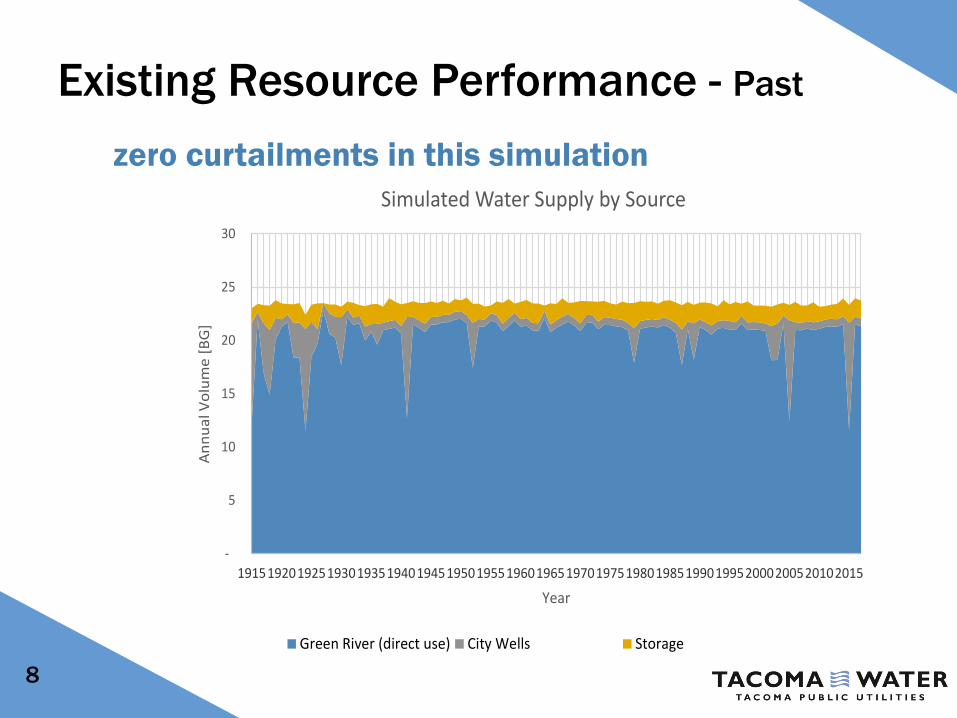
Existing Resource Performance - Past
8
-
5
10
15
20
25
30
191519201925193019351940194519501955196019651970197519801985199019952000200520102015
Annu
al V
olum
e [B
G]
Year
Simulated Water Supply by Source
Green River (direct use) City Wells Storage
zero curtailments in this simulation
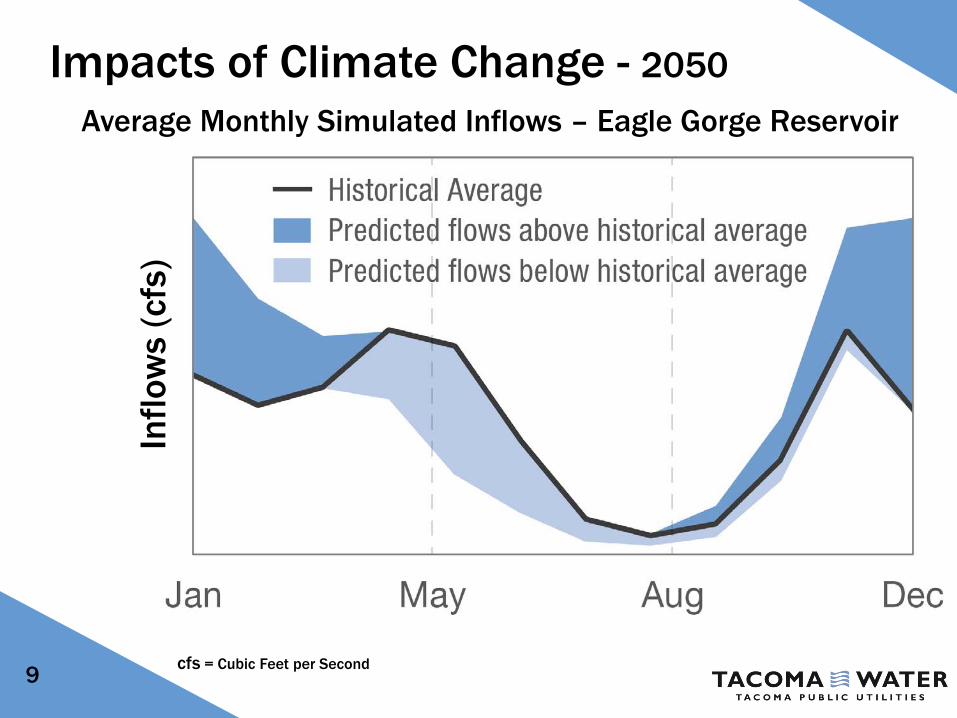
Impacts of Climate Change - 2050
9 cfs = Cubic Feet per Second
Average Monthly Simulated Inflows – Eagle Gorge Reservoir In
flow
s (c
fs)
Presented at March 11, 2018 Public Utility Board Study Session: Water sources and systems will be sufficient to meet demands such that mandatory curtailments will occur not more than once in 25 years, as a long term average.
Resource Adequacy Standard (RAS)
10
Policy Decision
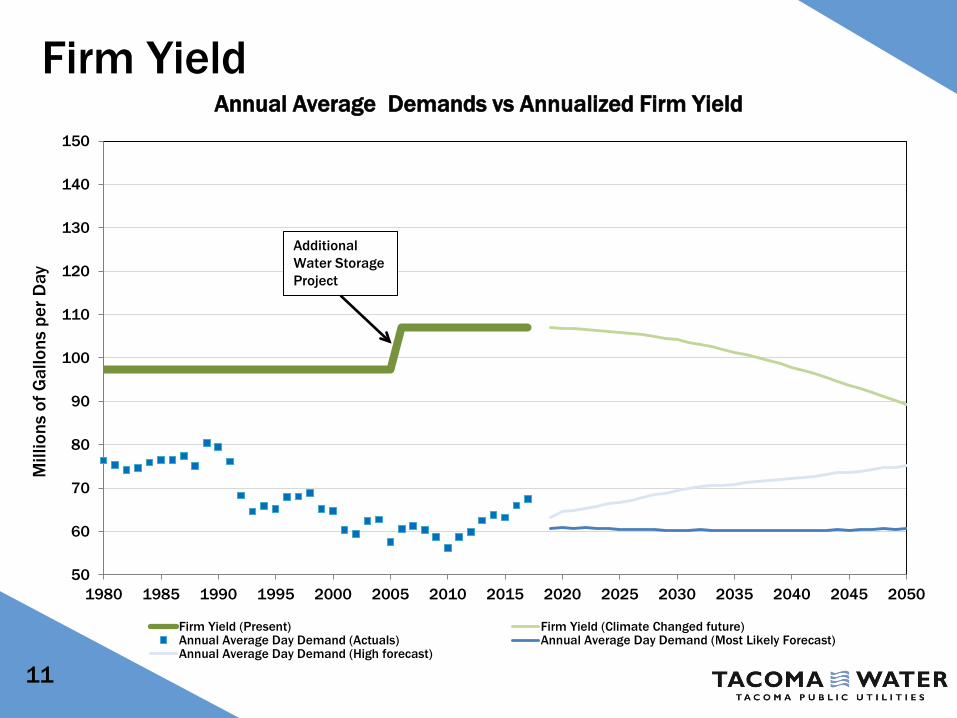
Firm Yield
11
50
60
70
80
90
100
110
120
130
140
150
1980 1985 1990 1995 2000 2005 2010 2015 2020 2025 2030 2035 2040 2045 2050
Mill
ions
of G
allo
ns p
er D
ay
Annual Average Demands vs Annualized Firm Yield
Firm Yield (Present) Firm Yield (Climate Changed future)Annual Average Day Demand (Actuals) Annual Average Day Demand (Most Likely Forecast)Annual Average Day Demand (High forecast)
Additional Water Storage Project
12
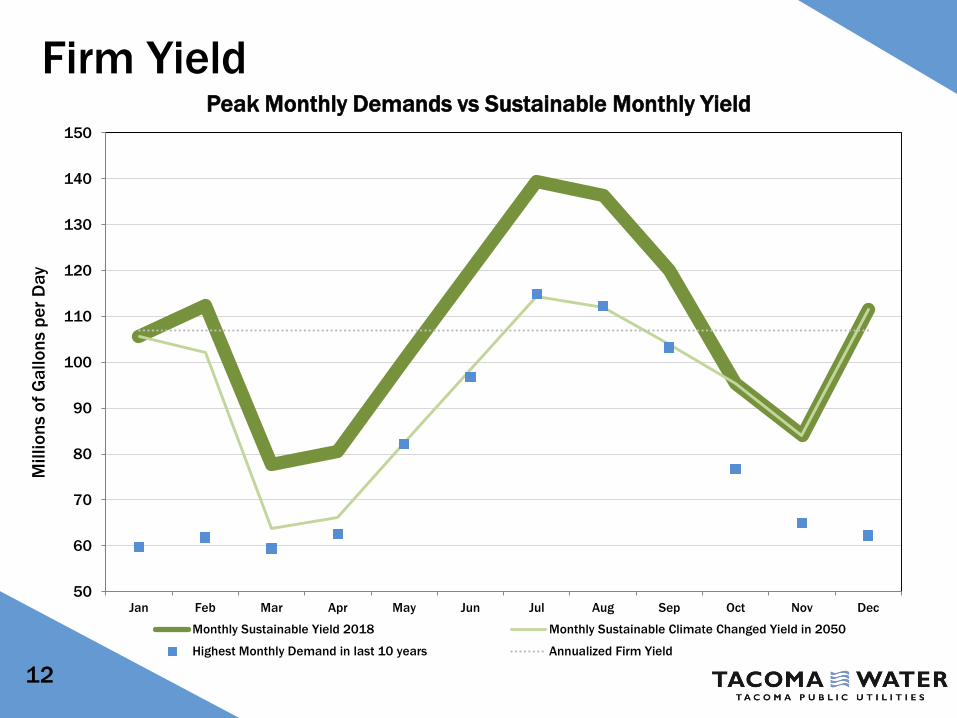
Firm Yield
50
60
70
80
90
100
110
120
130
140
150
Jan Feb Mar Apr May Jun Jul Aug Sep Oct Nov Dec
Mill
ions
of G
allo
ns p
er D
ay
Peak Monthly Demands vs Sustainable Monthly Yield
Monthly Sustainable Yield 2018 Monthly Sustainable Climate Changed Yield in 2050
Highest Monthly Demand in last 10 years Annualized Firm Yield
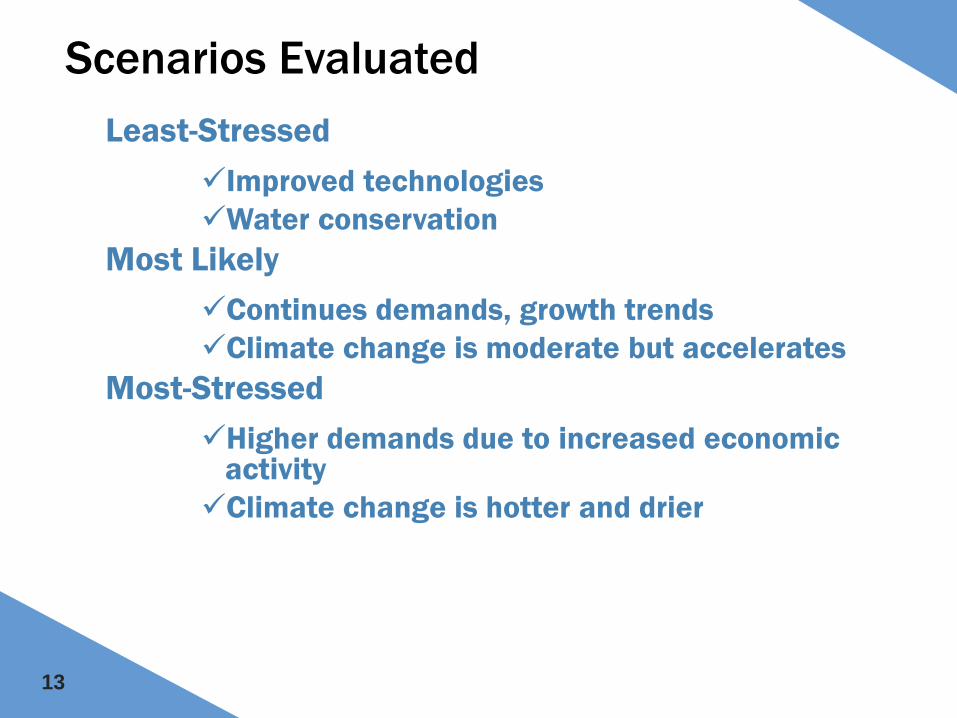
13
Scenarios Evaluated Least-Stressed
Improved technologies Water conservation
Most Likely Continues demands, growth trends Climate change is moderate but accelerates
Most-Stressed Higher demands due to increased economic
activity Climate change is hotter and drier
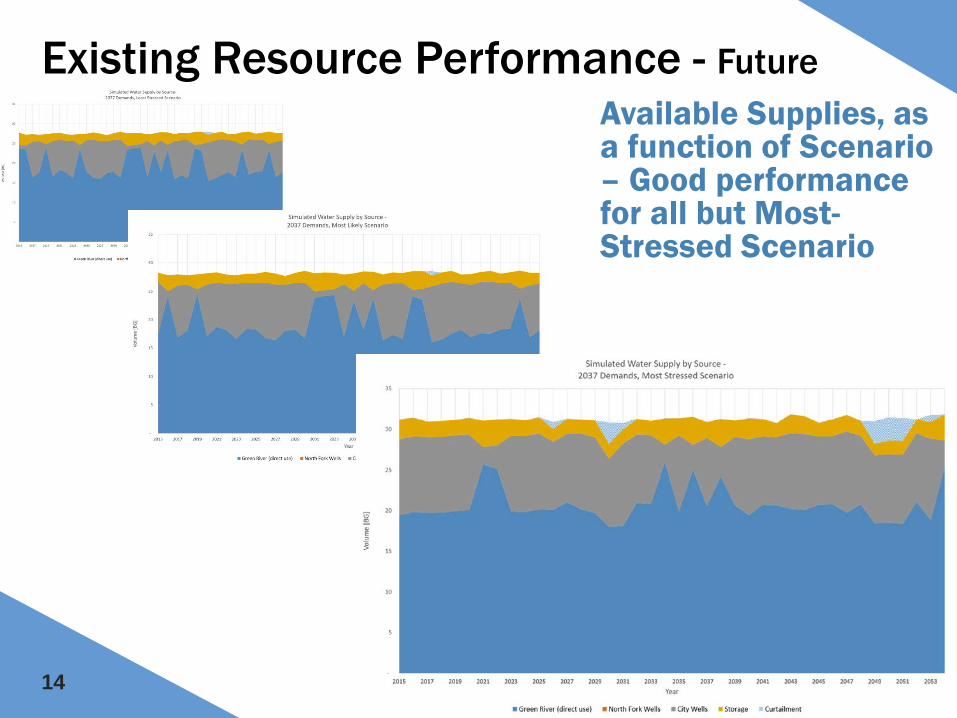
14
Existing Resource Performance - Future Available Supplies, as a function of Scenario – Good performance for all but Most-Stressed Scenario
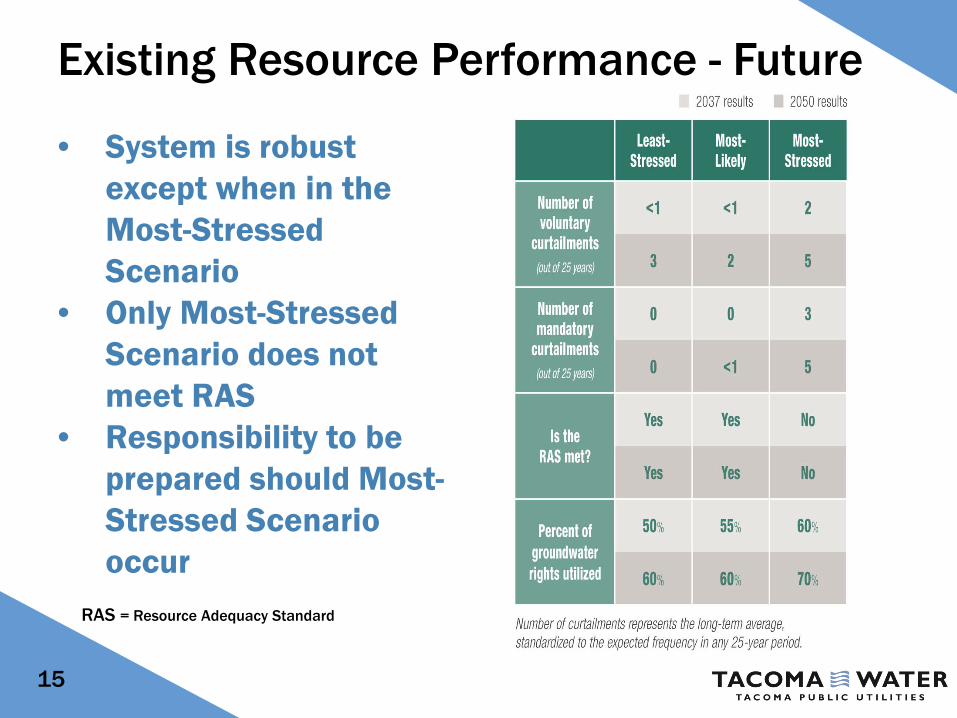
Existing Resource Performance - Future
• System is robust except when in the Most-Stressed Scenario
• Only Most-Stressed Scenario does not meet RAS
• Responsibility to be prepared should Most-Stressed Scenario occur
15
RAS = Resource Adequacy Standard
16
Potential Solutions – Most-Stressed Scenario
• Additional Water Storage Project Phase 1 (AWSP1) – Complete phase 1 to receive up to 10,000 Acre-feet
• Aggressive Peak Shaving – Reduce summer peak demand in hot and dry years
• Develop Groundwater – Enhance pumping capacity of well fields
• Additional Water Storage Project Phase 2 (AWSP2)– Raise Eagle Gorge Reservoir an additional 10 feet
• Oasis – Aquifer Storage and Recovery (ASR)
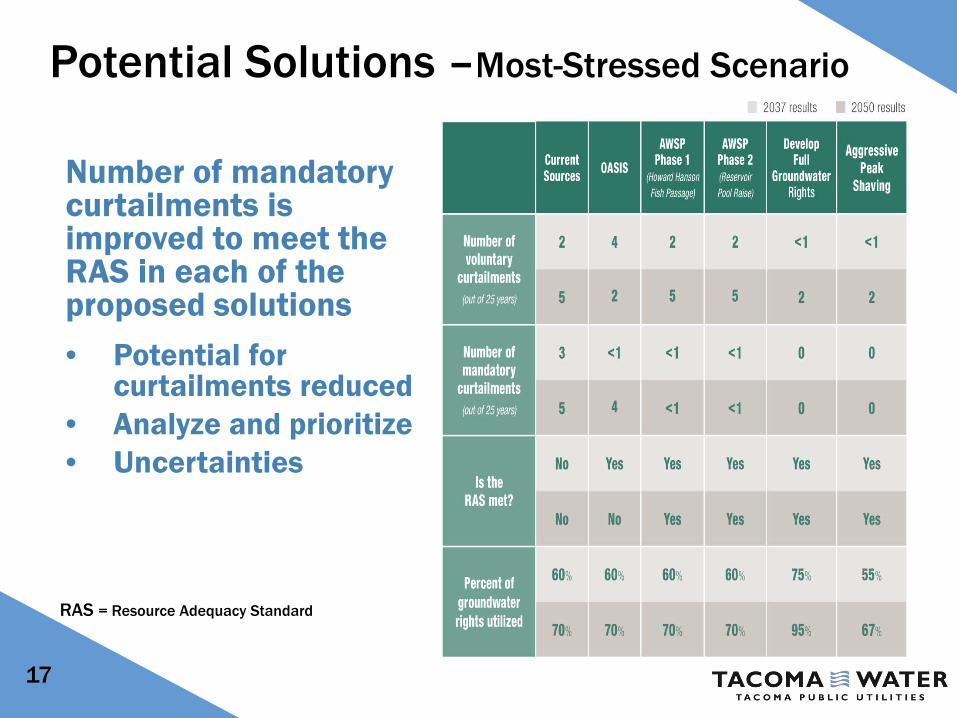
Potential Solutions –Most-Stressed Scenario
Number of mandatory curtailments is improved to meet the RAS in each of the proposed solutions • Potential for
curtailments reduced • Analyze and prioritize • Uncertainties
RAS = Resource Adequacy Standard
17
18
Additional Considerations
• Fish Passage Facility completion and funding (Additional Water Storage Projects Phase 1 and Phase 2)
• Groundwater resources in an urban environment
• Water rights – complex and changing
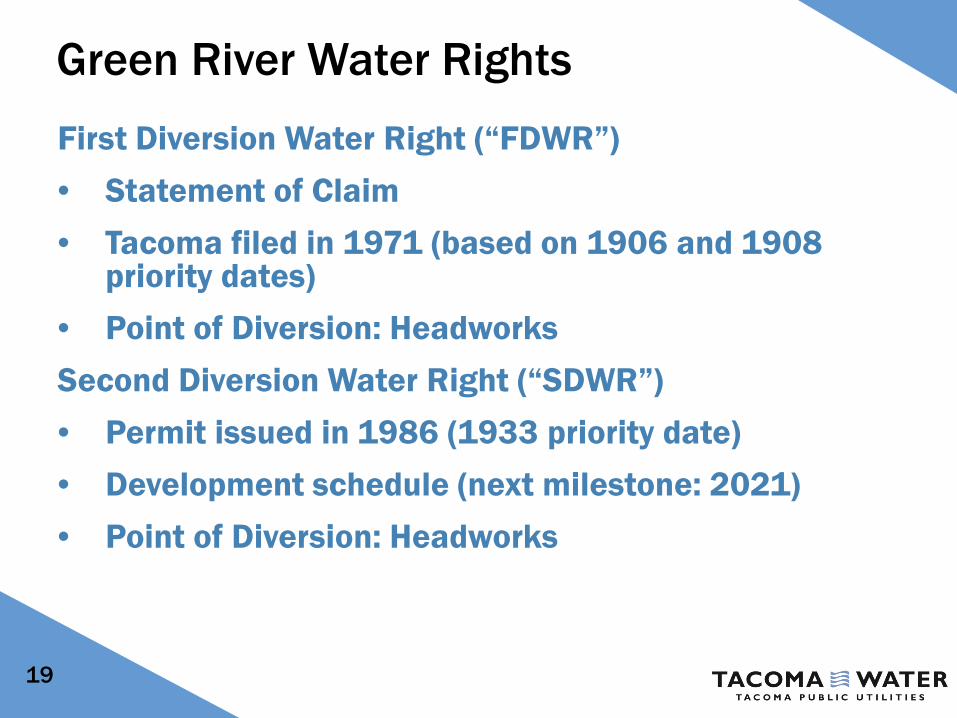
Green River Water Rights First Diversion Water Right (“FDWR”) • Statement of Claim • Tacoma filed in 1971 (based on 1906 and 1908
priority dates) • Point of Diversion: Headworks Second Diversion Water Right (“SDWR”) • Permit issued in 1986 (1933 priority date) • Development schedule (next milestone: 2021) • Point of Diversion: Headworks
19
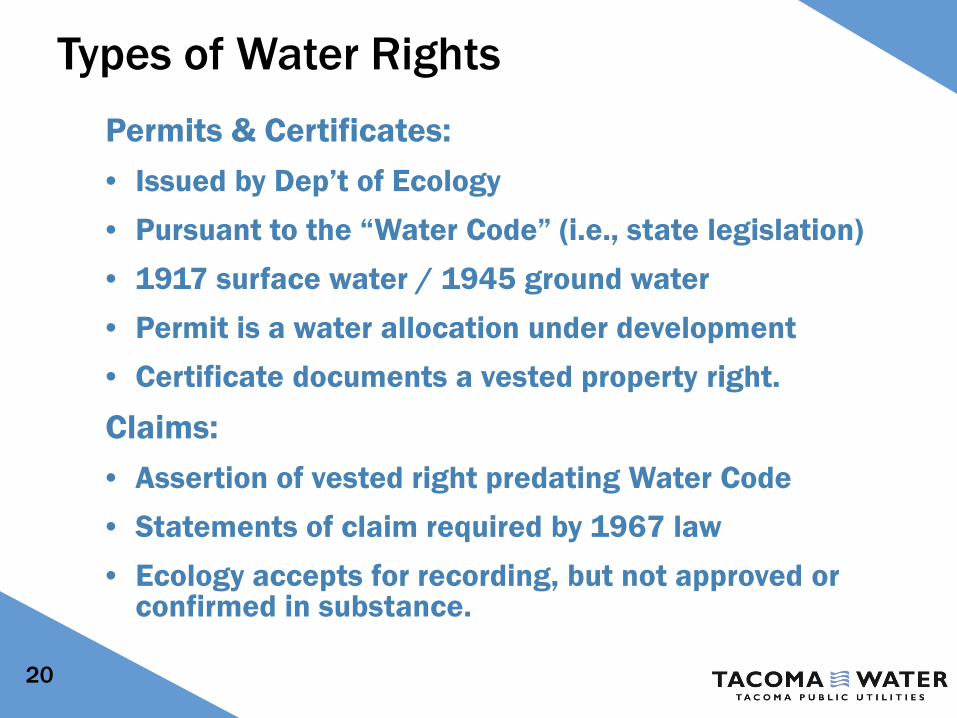
Types of Water Rights Permits & Certificates: • Issued by Dep’t of Ecology • Pursuant to the “Water Code” (i.e., state legislation) • 1917 surface water / 1945 ground water • Permit is a water allocation under development • Certificate documents a vested property right.
Claims: • Assertion of vested right predating Water Code • Statements of claim required by 1967 law • Ecology accepts for recording, but not approved or
confirmed in substance.
20
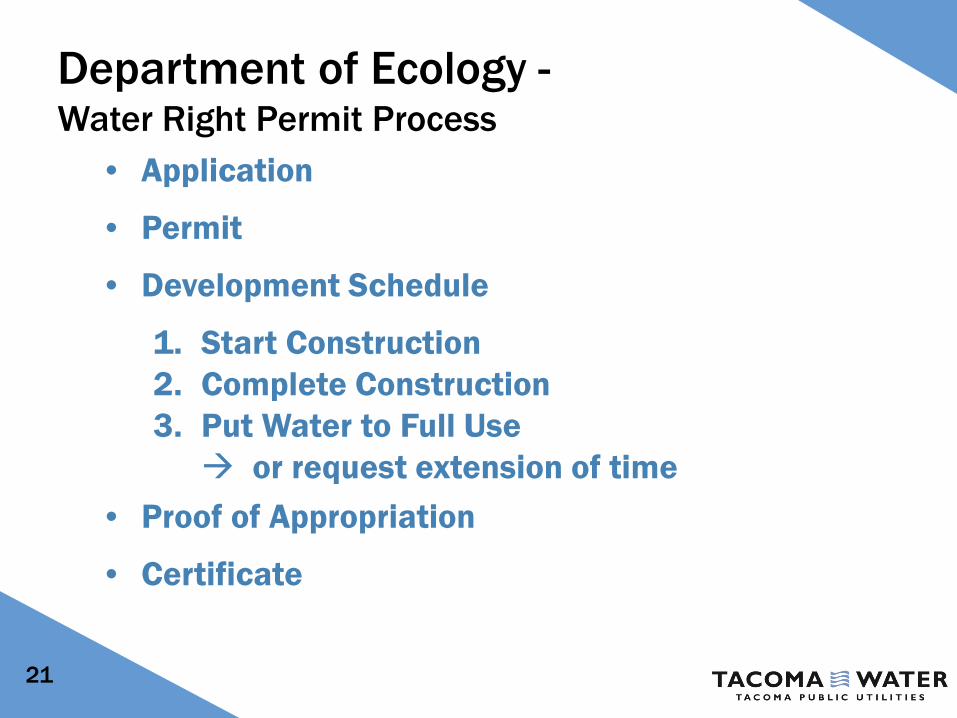
Department of Ecology - Water Right Permit Process
• Application
• Permit
• Development Schedule
1. Start Construction 2. Complete Construction 3. Put Water to Full Use or request extension of time
• Proof of Appropriation
• Certificate
21
2003 Municipal Water Law (“MWL”)
22
• Before 2003, law was not clear about how to vest (or “perfect”) a municipal purpose water right
• 2003 MWL clarified that actual “beneficial use” of water required
• Certificates now issue with quantities put to actual use
Restrictions and Factors as to “Beneficial Use” of Green River Water
• Water rights terms and conditions imposed by Dep’t of Ecology
• Agreement with Muckleshoot Indian Tribe (1995)
• Project Cooperation Agreement with US Army Corps of Engineers (2000)
• Habitat Conservation Plan (2001)
• Regional Water Supply System (2002) – RWSS Partnership
23
24
Overview of Partnership Agreement • Tacoma is the owner and operator of the Second
Supply Project (SSP)
• Tacoma has a 15/36 share; Kent, Covington and Lakehaven each have 7/36 Shares in the Second Supply Project
• Decisions are made by vote of the Project Committee
• Each Partner has paid for rights to use its share of the available Second Diversion Water Right, including water stored in the Eagle Gorge Reservoir
• Investment from the three Partners since 2005 has been $196 for capital facilities, and $20 for O&M
25
Next Steps
• Finalize Planning Documents
• Ongoing Public Education
• Develop strategies and outreach communication plan for Aggressive Peak Shaving
• Continued engagement with Federal Agencies & the congressional delegation to complete Additional Water Supply Project Phase I
• Further Evaluation of Supply solutions, including prioritizing groundwater improvements


![Ma^ ;hhd h Ahnkl Zg]](https://img.pdfslide.us/doc/110x75/5e56ea6f1603a837c811a40e/ma-hhd-h-ahnkl-zg-.jpg)