Embed Size (px)
Citation preview

7/29/2019 Customer Perception Hundai
http://slidepdf.com/reader/full/customer-perception-hundai 1/82
CHAPTER-I
INTRODUCTION
1

7/29/2019 Customer Perception Hundai
http://slidepdf.com/reader/full/customer-perception-hundai 2/82
Customer Perception
Consumers can evaluate a product along several levels. Its basic characteristics
are inherent to the generic version of the product and are defined as the fundamental
advantages it can offer to a customer. Generic products can be made distinct by adding
value through extra features, such as quality or performance enhancements. The final
level of consumer perception involves augmented properties, which offer less tangible
benefits, such as customer assistance, maintenance services, training, or appealing
payment options. In terms of competition with other products and companies, consumers
greatly value these added benefits when making a purchasing decision, making it
important for manufacturers to understand the notion of a “total package” when
marketing to their customers. For example, when manufacturing automotive parts, a high-
performing product will provide the customer base with basic benefits, while adding
spare parts, technical assistance, and skill training will offer enhanced properties to create
a total package with increased appeal to consumers.
Changing Product Strategies
In industrial product development, a marketing strategy that is flexible and
adaptive to changing market circumstances stands a greater chance of being effective in
the long-term. Products and consumer perceptions are variable, so changes in strategy
may be required to better address customer needs, technological developments, new laws
and regulations, and the overall product life-cycle. By monitoring external conditions and
shifting product development accordingly, a company can better target its consumers and
learn to react to their needs. The major factors that can necessitate a change in product
strategy include:
2

7/29/2019 Customer Perception Hundai
http://slidepdf.com/reader/full/customer-perception-hundai 3/82
• Customer Preferences: Fluctuations in the cost of materials, new application
requirements, and changing brand awareness are just a few of things that can cause
consumer needs to change. Keeping close track of customer response to a product and
taking their demands into consideration are important for maintaining market share.
• Technological Advances: A new technological development can engender a
change in a product line, causing products to need modification in order to remain
competitive or rendering some products obsolete. For example, fiber optic cables have
replaced older cables in certain applications and many businesses have switched from
main frame computers to personal computers. Being aware of these advances can help a
business stay ahead of the curve.
• Laws and Regulations: The implementation of new governmental regulations can
cause certain products or manufacturing methods to be restricted, limiting their consumer
appeal. Conversely, new laws can also lend an advantage to certain business and
deregulation can sometimes benefit production standards. Product development strategies
must shift according to the legal landscape.
• Product Life-Cycles: To preserve the rate of growth in profit and sales, many
industrial companies decide to alter, discontinue, or replace older products with newer
models or more recent upgrades. These changes are usually made periodically, allowing
existing products that reach maturity or decline to be phased out or modified, thus
retaining their appeal.
3

7/29/2019 Customer Perception Hundai
http://slidepdf.com/reader/full/customer-perception-hundai 4/82
NEED FOR THE STUDY
From the days of industrial revolution when goods & services were produced to
the present day, the emphasis has shifted from the producers to the consumer and his
needs, and with the consumer becoming more involved, in the marketing process there is
greater need for information regarding the consumer needs. Preferences and making them
satisfied of the products & services, has led to a constant but increasing need to conduct
marketing research.
This research is an insight into the mind of the consumer, with the help of which
the organizations will become aware of their pitfalls and in turn can also make
improvements in the product regarding the perception of the retailer’s towards their
offerings in the market place.
The basic need of this project is to know the ”PERCEPTION OF THE
RETAILER ” amongst the respondents, with regard to JERSEY ICECREAMS AT
CREAMLINE PRODUCTS LTD services and its products.
4

7/29/2019 Customer Perception Hundai
http://slidepdf.com/reader/full/customer-perception-hundai 5/82
OBJECTIVES OF THE STUDY
The purpose of this research is to study the behaviour of consumers, their importance
in the aspects of life style, perception of product attributes and level of satisfaction.
Hence, the study is aimed at the following objectives.
1. To know the customer perception on Hyundai.
2. To know the customer satisfaction on Hyundai.
3. To estimate the factors influencing the buying behaviour of the customer.
4. To know the brand awareness among the customers.
5

7/29/2019 Customer Perception Hundai
http://slidepdf.com/reader/full/customer-perception-hundai 6/82
SCOPE OF THE STUDY
Nowadays, car has become a necessity and forms a part of life. Therefore, there is a
significant scope to examine the perception and purchase behaviour of the consumers of
cars. Knowledge of the buying behaviour of the different market segments helps a seller
to select their target segment and evolve marketing strategies to increase the sales.
Advertisers and marketers have been trying to discover why consumers buy and what
they buy. This study tries to analyze the influence of perception in the consumers mind‟
and how this information can be used successfully by marketers to gain entry into the
minds of the consumers. The scope of this research has a very good future.
• The scope is very limited because attitude of the people change according to the
time.
• The study is restricted to both Hyderabad and Ranga Reddy Dist and that to
among 100 respondents.
• The study is conducted for 45 days.
• The study is restricted to certain area. So it could not give an accurate picture
about Andhra Pradesh of India.
6

7/29/2019 Customer Perception Hundai
http://slidepdf.com/reader/full/customer-perception-hundai 7/82
RESEARCH METHODOLOGY
One of the important tools for conducting marketing researching is the
availability of necessary and useful data. Data collection is more of an than science the
methods of marketing research are in a way the methods of data collection. The
sources of information fall under two categories.
Internal sources:
Every company has to keep certain records such as accounts, records, reports,
etc., these records provide sample information which can organizations usually keeps
collecting in its working.
External sources:
When internal records are insufficient and required information is not available,
the organizations will have to depend on external sources. The external sources of data
are:
Primary data:
Primary data are data gathered for a specific purpose or for a specific research
report.
For systematically collecting the data the closed end questionnaire is used. The
questionnaire consists of questions relating to various aspects of the study for proper
data collection the questionnaire is divided into 2 sections. Both the sections are meant
for the respondent only.
7
7/29/2019 Customer Perception Hundai
http://slidepdf.com/reader/full/customer-perception-hundai 8/82
Secondary data:
Secondary data are data that are collected for another purpose and already exist
somewhere. Data pertaining to company is collected from company web site company
catalogues and magazines. The company profile gives a detailed report of history
various products manufacture by its etc.
METHOD OF RESEARCH
SURVEY METHOD:
A survey is a complete operation, which requires some technical knowledge
survey methods are mostly personal in character. Surveys are best suited forgetting
primary data. The researcher obtains information from the respondents by
interviewing them.
SAMPLING:It is not always necessary to collect data from whole universe. A small
representative sample may serve the purpose. A sample means a small group should be
emanative cross section and really “representative” in character. This selection process
is called sampling.
SAMPLE SIZE:
Samples are devices for learning about large masses by observing a few
individuals. The selected sample is 100.Iin that sample 58 is males and 42 are females.
8

7/29/2019 Customer Perception Hundai
http://slidepdf.com/reader/full/customer-perception-hundai 9/82
METHOD OF SAMPLING
RANDOM SAMPLING METHOD
The method adopted here is random sampling method. A random sample is one
where each item in the universe has as equal chance of known opportunity of being
selected.
RESEARCH INSTRUMENT
QUESTIONNAIRE:
A Questionnaire is carefully completed logical sequence of question directed to
a define objective. It is the outline of what information is required and the framework
on which the data is built upon. Questionnaire is son commonly used in securing
market information that its preparation deserves utmost skill and care.
FORMS OF QUESTIONS
OPEN ENDED QUESTIONS:
They are descriptive in nature. Respondents are allowed to answer in their own
words. Such questions buying the actual opinion of the respondent s regarding
services.
9

7/29/2019 Customer Perception Hundai
http://slidepdf.com/reader/full/customer-perception-hundai 10/82
CLOSED ENDED QUESTIONS:
They are not descriptive in nature. They will be given certain choices and the
respondents have to choose choice among them. They make analysis easy but
sometimes they restrict the respondents’ choices.
TYPES OF CLOSED ENDED QUESTIONS:
• DICHOTAMS: a question offering two answers choice.
• MULTIPLE CHOICE: a question offering three choices.
• RATING SCALE: a scale that rates some attributes from “poor” to
“excellent”.
10

7/29/2019 Customer Perception Hundai
http://slidepdf.com/reader/full/customer-perception-hundai 11/82
CHAPTER-II
REVIEW OF LITERATURE
11

7/29/2019 Customer Perception Hundai
http://slidepdf.com/reader/full/customer-perception-hundai 12/82
Review 1
Title : Hyundai quality improvement recognized by ALG study
Source : Management Research Review
Author : Robin Wulffson
Published on: 2011
Abstract : A decade ago, Hyundai was regarded as a manufacturer of
inexpensive vehicles, which lacked quality. Currently, Hyundai’s are still a good value;
however, they have made great strides in the quality arena. On November 10, Hyundai
Motor America announced that its upward momentum in quality was continuing with the
industry’s biggest long-term gain in ALG’s Fall 2011 Perceived Quality Study (PQS).
Hyundai earned the No. 9 spot moving up nine spots from 18th place over the past three
years. Twice a year, ALG surveys approximately 3,000-4,000 U.S. consumers to gauge
perceptions of a number of mainstream and luxury automotive brands for its PQS.
“Hyundai has made impressive efforts to improve brand perception and we can see that it
has truly paid off in the mainstream rankings,” said Eric Lyman, Vice President, Residual
Value Solutions, ALG.
Hyundai’s ongoing success is largely attributed to the positive reception of the
newly redesigned Elantra and Accent models, as well as the all-new Veloster, all three of
which have received significant consumer interest and positive reception since their
respective launches. These vehicles in addition to the rest of the Hyundai lineup
contributed to Hyundai’s success last month in shattering 2010’s full year sales record
with 545,316 vehicles sold to date.
12

7/29/2019 Customer Perception Hundai
http://slidepdf.com/reader/full/customer-perception-hundai 13/82
“Hyundai continues to impress car shoppers with the level of quality throughout
the lineup from the entry level Accent all the way to our flagship Equus sedan,” said
Frank Ferrara, executive vice president, Customer Satisfaction, Hyundai Motor America.
“And, with a slew of recently launched and redesigned models, Hyundai quality and
brand perception will continue to grow.”
13
7/29/2019 Customer Perception Hundai
http://slidepdf.com/reader/full/customer-perception-hundai 14/82
Review 2
Title :Consumer perceptions and behaviour: a study with special reference to car
owners
Source :The journal of APJRBM
Author :Mandeep Kaur and Sandhu
Published on :2006
Abstract :Attempted to find out the important features which a customer considers
while going for the purchase of a new car. The study covers the owners of passenger cars
living in the major cities of the State of Punjab and the Union Territory of Chandigarh.
The respondents perceive that safety and comfort are the most important features of the
passenger car followed by luxuriousness. So the manufacturers must design the product
giving maximum weightage to these factors.
Postulates that there are certain factors which influence the brand preferences of
the customers. Within this framework, the study reveals that customers give more
importance to fuel efficiency than other factors. They believe that the brand name tells
them something about product quality, utility, technology and they prefer to purchase the
passenger cars which offer high fuel efficiency, good quality, technology, durability and
reasonable price.
14

7/29/2019 Customer Perception Hundai
http://slidepdf.com/reader/full/customer-perception-hundai 15/82
Satya Sundaram (2008) analyzed how the competition makes the automobile
manufacturer to launch at least one new model or a variant of the model every year. This
survey also pointed out that diesel cars are becoming popular in India and the
announcement of reductions in excise duties by the government has helped to some
extent to boost the demand. Clement Sudhakar and Venkatapathy (2009) studied the
influence of peer group in the purchase of car with reference to Coimbatore District. It
was also found that the influence of friends is higher for the purchase of small sized and
mid sized cars.
15

7/29/2019 Customer Perception Hundai
http://slidepdf.com/reader/full/customer-perception-hundai 16/82
Review 3
Title : Hyundai Sets 50-MPG Goal; Hunting for More Sonata
Capacity
Source : WardsAuto
Author : James M. Amend
Published on : 2010
Abstract : Hyundai Motor America President and CEO John Krafcik says the auto
maker’s U.S. fleet will achieve 50 mpg (4.7 L/100 km) by 2025.
Krafcik admits the pledge ranks as yet another lofty goal from Hyundai, even though the
auto maker’s fleet is heavy with passenger cars.
“Is that a stretch target? Yeah,” he tells the annual Management Briefing
Seminars here. “Is it a classic Hyundai stretch target where we don’t know precisely how
to get there right now? Yeah, but we do have a road map.”
Hyundai is working toward the goal at research centers in its home country of
South Korea, as well as in the U.S., India and Germany. Technologies will run the gamut
– from downsized turbocharged gasoline direct-injection engines to electrification and
lightweight materials and design.
16

7/29/2019 Customer Perception Hundai
http://slidepdf.com/reader/full/customer-perception-hundai 17/82
But the old-fashioned internal-combustion engine will play the predominant role,
comprising 75% to 80% of Hyundai’s propulsion systems in 2025. About 15% would be
electrified hybrids and the remaining 5% fuel-cell vehicles.
“We want to lead the industry in fuel economy,” Krafcik says. “We do it now. We
want to set the trajectory, not just for Hyundai but the entire industry.”
Hyundai took over the lead in U.S. industry fleet fuel economy in 2008. It is
projected to lead again in 2009 at roughly 31.9 mpg (7.4 L/100 km) after the government
finalizes industry totals.
The current corporate average fuel economy standard calls for auto maker fleets
to achieve 35.5 mpg (6.6 L/100 km) by 2016. Rule-making for 2020 will get under way
soon.
Krafcik says “an important piece” of Hyundai’s fuel-economy pledge will be
unveiled later this year at the Los Angeles auto show.
“When you see this car,” he says, “and the fuel economy results we’ll announce
with it, you’ll get a sense” for how 50 mpg could be attained.
17

7/29/2019 Customer Perception Hundai
http://slidepdf.com/reader/full/customer-perception-hundai 18/82
Review 4
Title : How Hyundai sells more when everyone else is selling less
Source : Knowledge@Wharton
Author : John Paul MacDuffie
Published on : 2009
Abstract : As American automakers struggle for survival, South Korea's Hyundai
Motor appears to be gaining on the pack with bold marketing and broad-based initiatives
to improve quality. The company made a splash earlier this year when it unveiled its
Hyundai Assurance program allowing customers to return a car if they lost a job.
Competing automakers and other types of businesses soon followed with similar
promises.
Years earlier, however, Hyundai had already begun to invest in new models and
quality programs that have put the company on solid footing to profit from the current
chaos in the global auto industry, according to Wharton faculty.
"There's a sense that what Hyundai is doing on many fronts is working in terms of
actually gaining some advantage during the crisis," says Wharton management professor
John Paul MacDuffie, who specializes in the automotive industry and is co-director of the
International Motor Vehicle Program.
18
7/29/2019 Customer Perception Hundai
http://slidepdf.com/reader/full/customer-perception-hundai 19/82
In 2008 -- a brutal year for the auto business -- Hyundai's global unit sales rose
2%, lifting revenues by 5%. In the first three months of this year, the company's global
market share rose to 4.7%, compared to 4% a year earlier.
MacDuffie says Hyundai first made a name for itself in the United States in the
late 1980s when it exported the low-cost Excel to the American market. The car was
popular at first, but soon earned a reputation for developing rust and other quality
problems. "Sales dropped and it left reputational damage in consumers' minds," according
to MacDuffie. In the 1990s, Hyundai attempted to introduce a range of high-priced
vehicles into the U.S. market, but MacDuffie says the company was "haunted" by its
reputation: "Quality has always been Hyundai's Achilles heel in ... the U.S."
It was another economic crisis -- the 1997 Asian financial collapse -- that sowed
the seeds for Hyundai's recent success, according to MacDuffie. He notes that during that
global economic slump, the South Korean currency fell sharply. As a result, Hyundai's
competitor Daewoo went into bankruptcy and Hyundai was able to acquire another
Korean automaker, Kia Motors. Surviving consolidation in its home market, Hyundai
emerged from the crisis with new strength to address its problems.
19

7/29/2019 Customer Perception Hundai
http://slidepdf.com/reader/full/customer-perception-hundai 20/82
Perception
In philosophy, psychology, and cognitive science, perception is the process of attaining
awareness or understanding of sensory information. The word "perception" comes from
the Latin words perceptio, percipio, and means "receiving, collecting, action of taking
possession, apprehension with the mind or senses."
Perception is one of the oldest fields in psychology. The oldest quantitative law in
psychology is the Weber-Fechner law, which quantifies the relationship between the
intensity of physical stimuli and their perceptual effects. The study of perception gave
rise to the Gestalt school of psychology, with its emphasis on holistic approach.
What one perceives is a result of interplays between past experiences, including
one’s culture, and the interpretation of the perceived.
Types
Two types of consciousness are considerable regarding perception: phenomenal
(any occurrence that is observable and physical) and psychological. The difference every
sighted person can demonstrate to him- or herself is by the simple opening and closing of
his or her eyes: phenomenal consciousness is thought, on average, to be predominately
absent without senses such as sight. Through the full or rich sensations present in senses
such as sight, nothing by comparison is present while the senses are not engaged, such as
when the eyes are closed. Using this precept, it is understood that, in the vast majority of
20
7/29/2019 Customer Perception Hundai
http://slidepdf.com/reader/full/customer-perception-hundai 21/82
cases, logical solutions are reached through simple human sensation. The analogy of
Plato's Cave was coined to express these ideas.
Passive perception (conceived by René Descartes) can be surmised as the
following sequence of events: surrounding → input (senses) → processing (brain) →
output (re-action). Although still supported by mainstream philosophers, psychologists
and neurologists, this theory is nowadays losing momentum. The theory of active
perception has emerged from extensive research of sensory illusions, most notably the
works of Richard L. Gregory. This theory, which is increasingly gaining experimental
support, can be surmised as dynamic relationship between "description" (in the brain) ↔
senses ↔ surrounding, all of which holds true to the linear concept of experience.
Perception and reality
In the case of visual perception, some people can actually see the percept shift in
their mind's eye. Others, who are not picture thinkers, may not necessarily perceive the
'shape-shifting' as their world changes. The 'esemplastic' nature has been shown by
experiment: an ambiguous image has multiple interpretations on the perceptual level. The
question, "Is the glass half empty or half full?" serves to demonstrate the way an object
can be perceived in different ways.
Just as one object can give rise to multiple percepts, so an object may fail to give
rise to any percept at all: if the percept has no grounding in a person's experience, the
person may literally not perceive it.
21

7/29/2019 Customer Perception Hundai
http://slidepdf.com/reader/full/customer-perception-hundai 22/82
The processes of perception routinely alter what humans see. When people view
something with a preconceived concept about it, they tend to take those concepts and see
them whether or not they are there. This problem stems from the fact that humans are
unable to understand new information, without the inherent bias of their previous
knowledge. A person’s knowledge creates his or her reality as much as the truth, because
the human mind can only contemplate that to which it has been exposed. When objects
are viewed without understanding, the mind will try to reach for something that it already
recognizes, in order to process what it is viewing. That which most closely relates to the
unfamiliar from our past experiences, makes up what we see when we look at things that
we don’t comprehend.
This confusing ambiguity of perception is exploited in human technologies such
as camouflage, and also in biological mimicry, for example by European Peacock
butterflies, whose wings bear eye markings that birds respond to as though they were the
eyes of a dangerous predator. Perceptual ambiguity is not restricted to vision. For
example, recent touch perception research Robles-De-La-Torre & Hayward 2001 found
that kinesthesia based haptic perception strongly relies on the forces experienced during
touch.
Cognitive theories of perception assume there is a poverty of stimulus. This (with
reference to perception) is the claim that sensations are, by themselves, unable to provide
a unique description of the world. Sensations require 'enriching', which is the role of the
mental model. A different type of theory is the perceptual ecology approach of James J.
Gibson. Gibson rejected the assumption of a poverty of stimulus by rejecting the notion
that perception is based in sensations. Instead, he investigated what information is
22

7/29/2019 Customer Perception Hundai
http://slidepdf.com/reader/full/customer-perception-hundai 23/82
actually presented to the perceptual systems. He and the psychologists who work within
this paradigm detailed how the world could be specified to a mobile, exploring organism
via the lawful projection of information about the world into energy arrays. Specification
is a 1:1 mapping of some aspect of the world into a perceptual array; given such a
mapping, no enrichment is required and perception is direct perception.
Preconceptions can influence how the world is perceived. For example, one
classic psychological experiment showed slower reaction times and less accurate answers
when a deck of playing cards reversed the color of the suit symbol for some cards (e.g.
red spades and black hearts).
There is also evidence that the brain in some ways operates on a slight "delay", to
allow nerve impulses from distant parts of the body to be integrated into simultaneous
signals.
23
7/29/2019 Customer Perception Hundai
http://slidepdf.com/reader/full/customer-perception-hundai 24/82
Perception-in-action
An ecological understanding of perception derived from Gibson's early work is
that of "perception-in-action", the notion that perception is a requisite property of animate
action; that without perception action would be unguided, and without action perception
would serve no purpose. Animate actions require both perception and motion, and
perception and movement can be described as "two sides of the same coin, the coin is
action". Gibson works from the assumption that singular entities, which he calls
"invariants", already exist in the real world and that all that the perception process does is
to home in upon them. A view known as constructivism (held by such philosophers as
Ernst von Glasersfeld) regards the continual adjustment of perception and action to the
external input as precisely what constitutes the "entity", which is therefore far from being
invariant.
Glasersfeld considers an "invariant" as a target to be homed in upon, and a
pragmatic necessity to allow an initial measure of understanding to be established prior to
the updating that a statement aims to achieve. The invariant does not and need not
represent an actuality, and Glasersfeld describes it as extremely unlikely that what is
desired or feared by an organism will never suffer change as time goes on. This social
constructionist theory thus allows for a needful evolutionary adjustment.
24
7/29/2019 Customer Perception Hundai
http://slidepdf.com/reader/full/customer-perception-hundai 25/82
A mathematical theory of perception-in-action has been devised and investigated
in many forms of controlled movement, and has been described in many different species
of organism using the General Tau Theory. According to this theory, tau information, or
time-to-goal information is the fundamental 'percept' in perception.
In today’s globalising economy competition is getting more and more fierce. That
means it becomes more difficult for products and services to differentiate themselves
from other offerings than ever before. Not only is the number of competitive offerings
rising due to globalisation of production, sourcing, logistics and access to information.
Many products and services face new competition from substitutes and from completely
new offerings or bundles from industry outsiders. Since product differences are closed at
an increasing speed and many companies try to win the battle for customers by price
reductions, products and services tend to become commodities.
On the other hand, customer behaviour becomes more hybrid. On one hand,
customers are increasingly price sensitive – searching for bargains at marketplaces like
ebay or buying their groceries at discount markets. On the other hand they enjoy branded
and luxury goods. One and the same person may plan a weekend trip with a no-frills
airline and a stay at a five-star-hotel.
In the result, customers have a wider choice of often less distinguishable products
and they are much better informed. For many offerings the balance of power shifts
towards the customer. Customers are widely aware of their greater power, which raises
their expectations on how companies should care for them.
25

7/29/2019 Customer Perception Hundai
http://slidepdf.com/reader/full/customer-perception-hundai 26/82
Bringing it all together, it becomes ever more difficult to differentiate a product or
service by traditional categories like price, quality, functionality etc.
In this situation the development of a strong relationship between customers and a
company could likely prove to be a significant opportunity for competitive advantage.
This relationship is not longer based on features like price and quality alone. Today it is
more the perceived experience a customer makes in his various interactions with a
company (e.g. how fast, easy, efficient and reliable the process is) that can make or break
the relationship. Problems during a single transaction can damage a so far favourable
customer attitude.
The consequence for companies is that they have to adapt their ways of competing
for customers. Traditionally, companies have focused their efforts of customer
relationship management on issues like customer satisfaction and targeted marketing
activities like event marketing, direct marketing or advertising. Although doubtless
necessary and beneficial, these activities are not longer enough. They narrow the
relationship between company and customer down to a particular set of contacts in which
the company invests its efforts. Most likely this will produce not more than a satisfied
customer who is well aware of the companies offerings and has a positive attitude
towards them. However, a satisfied customer is not necessarily a loyal one.
If a customer is satisfied that means that a product of service has met his
expectations and that he was not dissatisfied by it. Customer satisfaction is doubtlessly
very important. It is the precondition for repeat purchases and it prevents the customer
26

7/29/2019 Customer Perception Hundai
http://slidepdf.com/reader/full/customer-perception-hundai 27/82
from telling others about his disappointing experiences. A loyal customer, however, is
more than a customer who frequently purchases from a company.
The difference is the emotional bond which links the customer so closely to the
company that he develops a clear preference for these products or brands and is even
willing to recommend them to others. Loyal customers truly prefer a product, brand or
company over competitive offerings. Thus loyalty goes beyond a rational decision for
known quality or superior price-performance-ratio. It is about the customers’ feelings and
perceptions about the brand or product.
When the customer makes his buying decision, he evaluates the benefits he
perceives from a particular product and compares them with the costs. The value a
customer perceives when buying and using a product or service go beyond usability.
There is a set of emotional values as well, such as social status, exclusivity, friendliness
and responsiveness or the degree to which personal expectations and preferences are met.
Similarly, the costs perceived by the customer, normally comprise more than the actual
price. They also include costs of usage, the lost opportunity to use an other offering,
potential switching costs etc. Hence, the customer establishes an equation between
perceived benefits and perceived costs of one product and compares this to similar
equations of other products.
Based on this, customer loyalty can be understood as to how customers feel about
a product, service or brand and whether their perceived total investments with a it live up
to their expectations.
27

7/29/2019 Customer Perception Hundai
http://slidepdf.com/reader/full/customer-perception-hundai 28/82
The important point here is the involvement of feelings, emotions and
perceptions. In today’s competitive marketplace, these perceptions are becoming much
more important for gaining sustainable competitive advantage.
Customer perceptions are influenced by a variety of factors. Besides the actual
outcome – i.e. did the product or service deliver the expected function and did it fulfil the
customers need – the whole process of consumption and all interactions involved are of
crucial importance. In today’s globalised information driven economy this can also
comprise issues like
· How other customers or influencing groups perceive the product or brand
· The degree to which the customer feels the actual marketing campaign addresses
the most important issues
· Responsiveness and service quality of any affiliates, e.g. distribution partners
Customer perceptions are dynamic. First of all, with the developing relationship between
customer and company, his perceptions of the company and its products or services will
change.
Moreover, if the customers’ circumstances change, their needs and preferences
often change too. In the external environment, the offerings of competitors, with which a
customer compares a product or service will change, thus altering his perception of the
best offer around. Another point is that the public opinion towards certain issues can
change. This effect can reach from fashion trends to the public expectation of good
corporate citizenship. Shells intention to dump its Brent Spar platform into the ocean
28
7/29/2019 Customer Perception Hundai
http://slidepdf.com/reader/full/customer-perception-hundai 29/82
significantly altered many customers perception of which company was worth buying
fuel from.
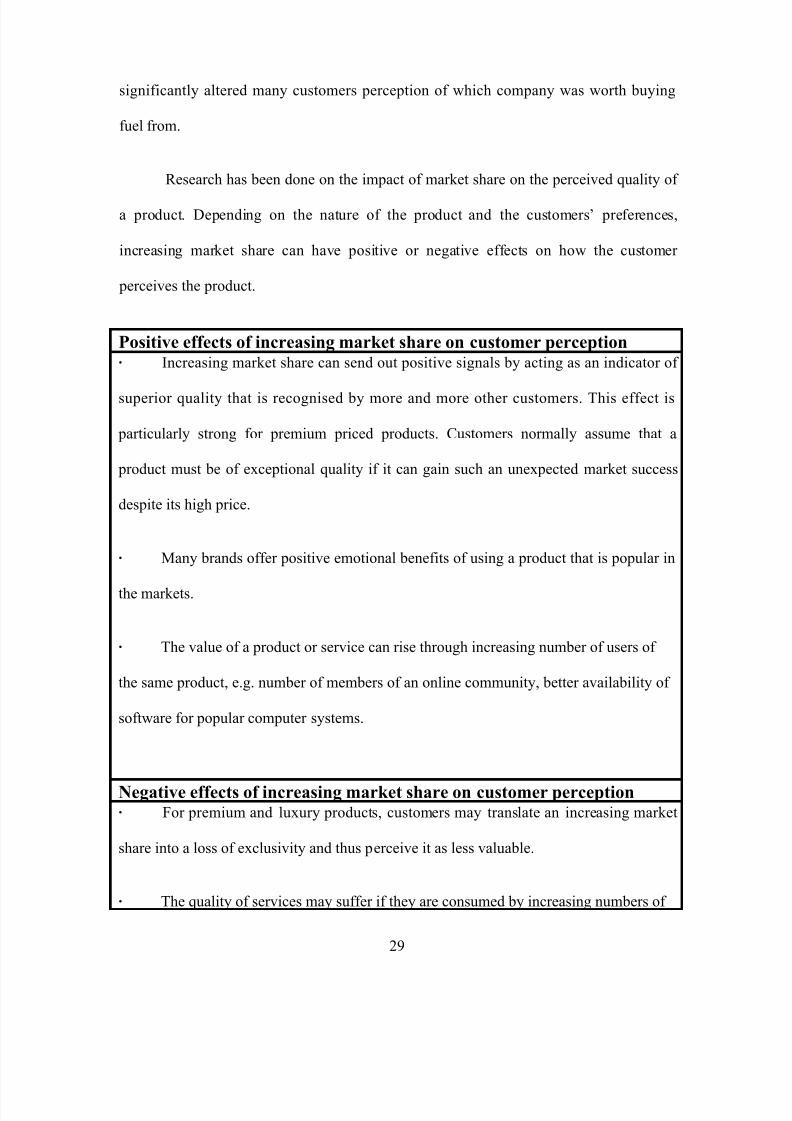
Research has been done on the impact of market share on the perceived quality of
a product. Depending on the nature of the product and the customers’ preferences,
increasing market share can have positive or negative effects on how the customer
perceives the product.
Positive effects of increasing market share on customer perception· Increasing market share can send out positive signals by acting as an indicator of
superior quality that is recognised by more and more other customers. This effect is
particularly strong for premium priced products. Customers normally assume that a
product must be of exceptional quality if it can gain such an unexpected market success
despite its high price.
· Many brands offer positive emotional benefits of using a product that is popular in
the markets.
· The value of a product or service can rise through increasing number of users of
the same product, e.g. number of members of an online community, better availability of
software for popular computer systems.
Negative effects of increasing market share on customer perception· For premium and luxury products, customers may translate an increasing market
share into a loss of exclusivity and thus perceive it as less valuable.
· The quality of services may suffer if they are consumed by increasing numbers of
29

7/29/2019 Customer Perception Hundai
http://slidepdf.com/reader/full/customer-perception-hundai 30/82
users. Diseconomies of scales and congestions can be observed with busy airports and
many other services so that customers may look out for other providers that promise more
timely service and convenience.
Consumer behavior : It is the study of when, why, how, and where people do or do
not buy a product. It blends elements from psychology, sociology, social anthropology
and economics. It attempts to understand the buyer decision making process, both
individually and in groups. It studies characteristics of individual consumers such as
demographics and behavioural variables in an attempt to understand people's wants. It
also tries to assess influences on the consumer from groups such as family, friends,
reference groups, and society in general.
Customer behaviour study is based on consumer buying behaviour, with the
customer playing the three distinct roles of user, payer and buyer. Relationship marketing
is an influential asset for customer behaviour analysis as it has a keen interest in the re-
discovery of the true meaning of marketing through the re-affirmation of the importance
of the customer or buyer. A greater importance is also placed on consumer retention,
customer relationship management, personalisation, customisation and one-to-one
marketing. Social functions can be categorized into social choice and welfare functions.
Each method for vote counting is assumed as social function but if Arrow’s
possibility theorem is used for a social function, social welfare function is achieved.
Some specifications of the social functions are decisiveness, neutrality, anonymity,
30

7/29/2019 Customer Perception Hundai
http://slidepdf.com/reader/full/customer-perception-hundai 31/82
monotonicity, unanimity, homogeneity and weak and strong Pareto optimality. No social
choice function meets these requirements in an ordinal scale simultaneously. The most
important characteristic of a social function is identification of the interactive effect of
alternatives and creating a logical relation with the ranks. Marketing provides services in
order to satisfy customers. With that in mind, the productive system is considered from
its beginning at the production level, to the end of the cycle, the consumer
The black box model shows the interaction of stimuli, consumer characteristics, decision
process and consumer responses. It can be distinguished between interpersonal stimuli
(between people) or intrapersonal stimuli (within people). The black box model is related
to the black box theory of behaviourism, where the focus is not set on the processes
inside a consumer, but the relation between the stimuli and the response of the consumer.
The marketing stimuli are planned and processed by the companies, whereas the
environmental stimulus are given by social factors, based on the economical, political and
cultural circumstances of a society. The buyers black box contains the buyer
characteristics and the decision process, which determines the buyers response.
The black box model considers the buyers response as a result of a conscious,
rational decision process, in which it is assumed that the buyer has recognized the
problem. However, in reality many decisions are not made in awareness of a determined
problem by the consumer.
Information search
31

7/29/2019 Customer Perception Hundai
http://slidepdf.com/reader/full/customer-perception-hundai 32/82
Once the consumer has recognised a problem, they search for information on
products and services that can solve that problem. Belch and Belch (2007) explain that
consumers undertake both an internal (memory) and an external search.
Sources of information include:
• Personal sources .
• Commercial sources
• Public sources
• Personal experience
The relevant internal psychological process that is associated with information search
is perception. Perception is defined as "the process by which an individual receives,
selects, organises, and interprets information to create a meaningful picture of the world".
The selective perception process
Stage Description :
•
Selective exposure consumers select which promotional messages they will
expose themselves to.
• Selective attention consumers select which promotional messages they will pay
attention to.
32

7/29/2019 Customer Perception Hundai
http://slidepdf.com/reader/full/customer-perception-hundai 33/82
• Selective comprehension consumer interpret messages in line with their beliefs,
attitudes, motives and experiences.
• Selective retention consumers remember messages that are more meaningful or
important to them.
The implications of this process help develop an effective promotional strategy, and
select which sources of information are more effective for the brand.
Information evaluation
At this time the consumer compares the brands and products that are in their
evoked set. How can the marketing organization increase the likelihood that their brand is
part of the consumer's evoked (consideration) set? Consumers evaluate alternatives in
terms of the functional and psychological benefits that they offer. The marketing
organization needs to understand what benefits consumers are seeking and therefore
which attributes are most important in terms of making a decision.
Purchase decision
Once the alternatives have been evaluated, the consumer is ready to make a
purchase decision. Sometimes purchase intention does not result in an actual purchase.
The marketing organization must facilitate the consumer to act on their purchase
intention. The organisation can use variety of techniques to achieve this. The provision of
credit or payment terms may encourage purchase, or a sales promotion such as the
33

7/29/2019 Customer Perception Hundai
http://slidepdf.com/reader/full/customer-perception-hundai 34/82
opportunity to receive a premium or enter a competition may provide an incentive to buy
now. The relevant internal psychological process that is associated with purchase
decision is integration.Once the integration is achieved, the organisation can influence the
purchase decisions much more easily.
Post purchase evaluation
The EKB model was further developed by Rice (1993) which suggested there
should be a feedback loop, Foxall (2005) further suggests the importance of the post
purchase evaluation and that the post purchase evaluation is key due to its influences on
future purchase patterns.
Internal influences
Consumer behaviour is influenced by: demographics, psychographics (lifestyle),
personality, motivation, knowledge, attitudes, beliefs, and feelings. Consumer behaviour
concern with consumer need consumer actions in the direction of satisfying needs leads
to his behaviour of every individuals depend on thinking
External influences
34

7/29/2019 Customer Perception Hundai
http://slidepdf.com/reader/full/customer-perception-hundai 35/82
Consumer behaviour is influenced by: culture, sub-culture, locality, royalty,
ethnicity, family, social class, past experience reference groups, lifestyle, market mix
factors.
CHAPTER-III
INDUSTRY PROFILE
&
COMPANY PROFILE
35
7/29/2019 Customer Perception Hundai
http://slidepdf.com/reader/full/customer-perception-hundai 36/82
INDUSTRY PROFILE
AUTOMOBILE INDUSTRY IN INDIA
The automobile industry in India is the ninth largest in the world with an annual
production of over 2.3 million units in 2008 In 2009, India emerged as Asia's fourth
largest exporter of automobiles, behind Japan, South Korea and Thailand.
Following economic liberalization in India in 1991, the Indian automotive
industry has demonstrated sustained growth as a result of increased competitiveness and
relaxed restrictions. Several Indian automobile manufacturers such as TOYOTA Motors,
Maruti Suzuki and Mahindra and Mahindra, expanded their domestic and international
operations. India's robust economic growth led to the further expansion of its domestic
automobile market which attracted significant India-specific investment by multinational
automobile manufacturers. In February 2009, monthly sales of passenger cars in India
exceeded 100,000 units.
36

7/29/2019 Customer Perception Hundai
http://slidepdf.com/reader/full/customer-perception-hundai 37/82
Bryonic automotive industry emerged in India in the 1940s. Following the
independence, in 1947, the Government of India and the private sector launched efforts to
create an automotive component manufacturing industry to supply to the automobile
industry. However, the growth was relatively slow in the 1950s and 1960s due to
nationalization and the license raj which hampered the Indian private sector. After 1970,
the automotive industry started to grow, but the growth was mainly driven by tractors,
commercial vehicles and scooters. Cars were still a major luxury. Japanese manufacturers
entered the Indian market ultimately leading to the establishment of Maruti Udyog. A
number of foreign firms initiated joint ventures with Indian companies.
In the 1980s, a number of Japanese manufacturers launched joint-ventures for
building motorcycles and light commercial-vehicles. It was at this time that the Indian
government chose Suzuki for its joint-venture to manufacture small cars. Following the
economic liberalization in 1991 and the gradual weakening of the license raj, a number of
Indian and multi-national car companies launched operations. Since then, automotive
component and automobile manufacturing growth has accelerated to meet domestic and
export demands.
The Britannica Encyclopedia a motorcycle as a bike or tricycle propelled by an
internal –combustion engine (or, less often by an electric engine). The automobile was
the reply to the 19th –century reams of self-propelling the horse-drawn bikeriage.
Similarly, the invention of the motorcycle created the self –propelling bicycle. The first
commercial design was three-wheeler built by Edward Butler in Great Britain in 1884.
This employed a horizontal single-cylinder gasoline engine mounted between two steer
able front wheels and connected by a drive chain to the rear wheel. The 1900s saw the
37
7/29/2019 Customer Perception Hundai
http://slidepdf.com/reader/full/customer-perception-hundai 38/82
conversion of many bicycles or pedal cycles by adding small, centrally mounted spark
ignition engine engines. There was then felt the need for reliable constructions. This led
to road trial tests and competition between manufacturers. Tourist Trophy (TT) races
were held on the Isle of main in 1907 as reliability or endurance races. Such were the
proving ground for many new ideas from early two-stroke-cycle designs to supercharged
multivalent engines mounted on aerodynamic, bikebon fiber reinforced bodywork.
The invention of two wheelers is a much-debated issue. “Who invented the first
motorcycle?” May seem like a simple question, “safety”, bicycle, i.e., bicycle with front
and rear wheels of the same size, with a pedal crank mechanism to drive the rear wheel.
Those bicycles in turn described from high-wheel bicycles. The high –wheelers
descended from an early type of pushbike, without pedals, propelled by the rider’s feet
pushing against the ground. These appeared around 1800, used iron banded wagon
wheels, and were called “bone-crushers”, both for their jarring ride, and their tendency to
toss their riders. Gottiieb Daimler (who credited with the building the first motorcycle in
1885, one wheel in the front and one in the back, although it had a smaller spring-loaded
outrigger wheel on each side. It was constructed mostly of wood, the wheels were of the
iron-banded wooden-spooked wagon-type and it definitely had a “bone-crusher” chassis!
FURTHER DEVELOPMENTS:
Most of the developments during the early phase concentrated on three and four-
wheeled design since it was complex enough to get the machines running with out having
to worry about them falling over. The next notable two-wheeler though was the
Hildebrand & Wolf Mueller, patented in Munich in 1894. In 1895, the French firm of
DeDion-button built and engine that was to make the mass production and common use
38

7/29/2019 Customer Perception Hundai
http://slidepdf.com/reader/full/customer-perception-hundai 39/82
of motorcycle possible. The first motorcycle with electric start and a fully modem
electrical system; the Hence special from the Indian Motorcycle Company astounded the
industry in 1931. Before World War 1, IMC was the largest motorcycle manufacturer in
the world producing over 20000 bikes per year.
INCREASING POPULARITY:
The popularity of the vehicle grew especially after 1910, in 1916; the Indian
motorcycle company introduced the model H racer, and placed it on sale. During World
War 1, all branches of the armed forces in Europe used motorcycles principally for
dispatching. After the war, it enjoyed a sport vogue until the Great Depression began in
motorcycles lasted into the late 20th century; weight the vehicle being used for high-speed
touring and sport competitions. The more sophisticated of a 125cc model. Since then, an
increasing number of powerful bikes have blazed the roads.
HISTORICAL INDUSTRY DEVELOPMENTS:
India is the second largest manufacturer and producer to two wheelers in the
World. It stands next only to Japan and China in terms of the number of V produced and
domestic sales respectively. This destination was achieved due to variety of reason like
restrictive policy followed by the government of India towards the passenger bike
industry, rising demand for personal transport, inefficiency in the public transportation
system etc. The Indian two-wheelers industry made a small beginning in the early 50s
when Automobile products of India (API) started manufacturing scooters in the country.
Until 1958, API and Enfield were the sole producers.
39

7/29/2019 Customer Perception Hundai
http://slidepdf.com/reader/full/customer-perception-hundai 40/82
The two –wheelers market was opened were opened to foreign competition in the
mid-80s. And the then market leaders-Escorts and Enfield – were caught unaware by the
onslaught of the 100cc bikes of the four Indo- Japanese joint ventures. With the
availability of fuel-efficiency low power bikes, demand swelled, resulting in Hero Honda
–then the only producer of four stroke bikes (100cc category), gaining a top slot.
The first Japanese motorcycles were introduced in the early eighties. TVS Suzuki
and Hero Honda brought in the first two-stroke and four-stroke engine motorcycles
respectively. These two players initially started with assembly of CKD Kits, and later on
progressed to indigenous manufacturing.
The industry had a smooth ride in the 50s, 60s and 70s when government
prohibited new entries and strictly controlled capacity expansion. The industry saw a
sudden growth in the 80s. The industry witnessed a steady of 14% leading to a peak
volume of 1.9 mn vehicles in 1990.
In 1990 the entire automobile industry saw a drastic fall in demand. This resulted
in a decline of 15% in 1991 and 8% in 1992, resulting in a production loss of 0.4mn
vehicles. Barring Hero Honda, all the major producers suffered from recession in FY93
and FY94. Hero Honda showed a marginal decline in 1992.
The reason for recession in the sector were the incessant rise in fuel prices, high
input costs and reduced purchasing power due to significant like increased production in
1992, due to new entrants coupled with recession in the industry resulted in companies
either reporting losses or a fall in profits.
40

7/29/2019 Customer Perception Hundai
http://slidepdf.com/reader/full/customer-perception-hundai 41/82
The two-wheelers market has had a perceptible shift from a buyers market to a
sellers market with a variety of choice, players will have compete on various fronts viz.
pricing, technology product design, productivity after sale service, marketing and
distribution. In the short term, market shares of individual manufacturers are going to be
sensitive to capacity, product acceptance, pricing and competitive pressures from other
manufacturers.
As incomes grow and people grow and people feel the need to own a private means
of transport, sales of two-wheelers will rise. Penetration is expected to increase to
approximately to more than 25% by 2005.
The motorcycle segment will continue to lead the demand for two-wheelers in the
coming years. Motorcycle sale is expected to increase by 20% yoy as compared to 1%
growth in the scooter market and 3% by moped sales respectively for the next two years.
The four-stroke scooters will add new dimension to the two-wheeler segment in the
coming future.
The Asian continent is that largest user of the two-wheelers in the world. This is
due to poor road infrastructure and low per capita income, restrictive policy on bike
industry. This is due to oligopoly between top five players in the segment, compared to
thirsty manufacturers in the bike industry.
Exports
India has emerged as one of the world's largest manufacturers of small cars.
According to New York Times, India's strong engineering base and expertise in the
manufacturing of low-cost, fuel-efficient cars has resulted in the expansion of
41

7/29/2019 Customer Perception Hundai
http://slidepdf.com/reader/full/customer-perception-hundai 42/82
manufacturing facilities of several automobile companies like Hyundai Motors, Nissan,
Toyota, Volkswagen and Suzuki.
In 2008, Hyundai Motors alone exported 240,000 cars made in India. Nissan
Motors plans to export 250,000 vehicles manufactured in its India plant by 2011.
Similarly, General Motors announced its plans to export about 50,000 cars manufactured
in India by 2011.
In September 2009, Ford Motors announced its plans to setup a plant in India with
an annual capacity of 250,000 cars for US$500 million. The cars will be manufactured
both for the Indian market and for export. The company said that the plant was a part of
its plan to make India the hub for its global production business. Fiat Motors also
announced that it would source more than US$1 billion worth auto components from
India.
According to Bloomberg L.P., in 2009 India surpassed China as Asia's fourth
largest exporter of cars.
42

7/29/2019 Customer Perception Hundai
http://slidepdf.com/reader/full/customer-perception-hundai 43/82
Indian automobile companies
Notable Indian automobile manufacturers
• Ashok Leyland
• Chinkara Motors: Beachster, Hammer, Roadster 1.8S, Rockster, Jeepster ,
Sailster.
• Force Motors
• Hindustan Motors: Ambassador .
• Mahindra: Major , Xylo, Scorpio.
• Maruti Suzuki: 800, Alto, WagonR , Estilo, AStar , Ritz, Swift, Swift DZire, SX4,
Omni, Versa, Gypsy
• Premier: Sigma, Roadster , RiO.
• San Motors: Storm
• TA TA Motors: Nano, Indica, Indigo, Sumo, Safari, TL.Aria
• Electric car companies in India
• Ajanta Group
• Mahindra
• Hero Electric REVA
• Tara International
• TOYOTA Motors
43
7/29/2019 Customer Perception Hundai
http://slidepdf.com/reader/full/customer-perception-hundai 44/82
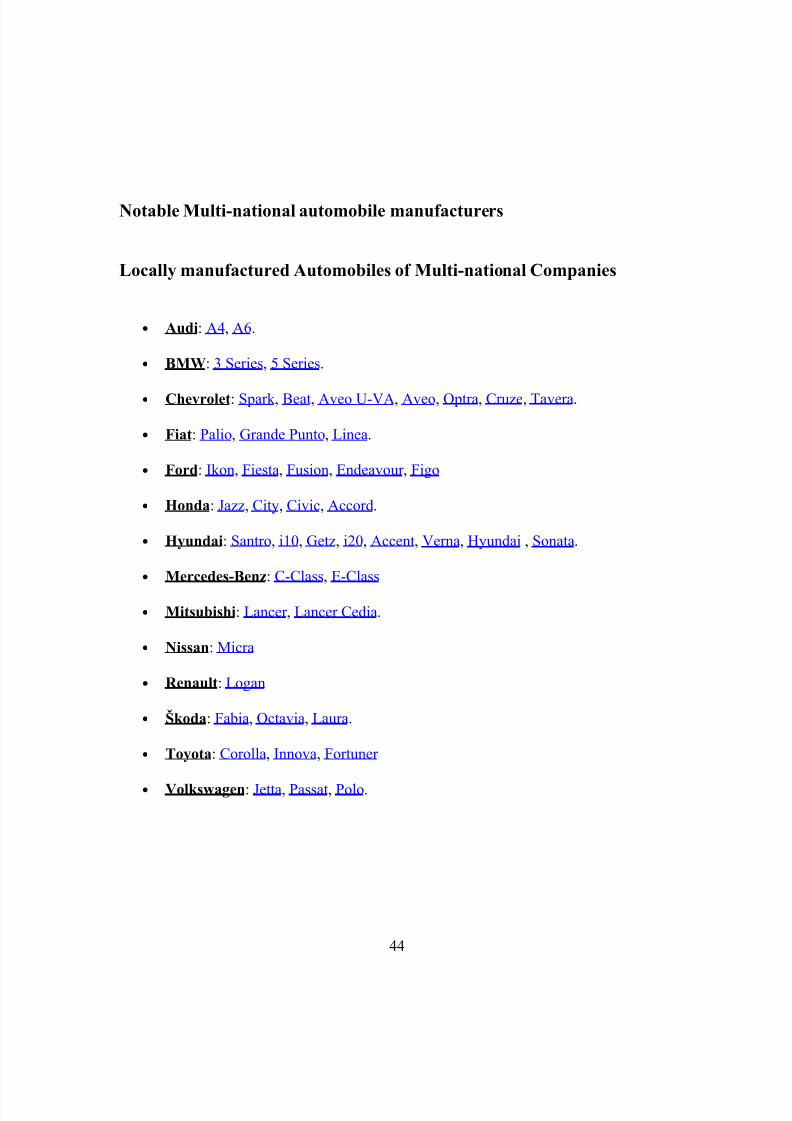
Notable Multi-national automobile manufacturers
Locally manufactured Automobiles of Multi-national Companies
• Audi: A4, A6.
• BMW: 3 Series, 5 Series.
• Chevrolet: Spark , Beat, Aveo U-VA, Aveo, Optra, Cruze, Tavera.
• Fiat: Palio, Grande Punto, Linea.
• Ford: Ikon, Fiesta, Fusion, Endeavour , Figo
• Honda: Jazz, City, Civic, Accord.
• Hyundai: Santro, i10, Getz, i20, Accent, Verna, Hyundai , Sonata.
• Mercedes-Benz: C-Class, E-Class
• Mitsubishi: Lancer , Lancer Cedia.
• Nissan: Micra
• Renault: Logan
• Škoda: Fabia, Octavia, Laura.
• Toyota: Corolla, Innova, Fortuner
• Volkswagen: Jetta, Passat, Polo.
44

7/29/2019 Customer Perception Hundai
http://slidepdf.com/reader/full/customer-perception-hundai 45/82
Cars sold in India as CBU (Completely Built Units)
• Audi: A8, TT, R8, Q5, Q7.
• Bentley: Arnage, Azure, Brooklands, Continental GT, Continental Flying Spur ,
Mulsanne.
• BMW: 6 Series, 7 Series, X3, X5, X6, M3, M5, M6 and Z4.
• Chevrolet: Captiva
• Fiat: Nuova 500.
• Honda: Civic Hybrid, CR-V.
• Hyundai: Santa Fe.
• Jaguar: XF, XJ, XK .
• Lamborghini: Gallardo, Murciélago.
• Land Rover: Range Rover , Range Rover Sport, Discovery 4, Freelander 2.
• Maybach: 57 and 62.
• Mercedes-Benz: CL-Class, CLS-Class, S-Class, SL-Class, SLK-Class, M-Class.
• Mitsubishi: Pajero, Montero, Outlander .
• Nissan: Teana, X-Trail, 307Z.
• Porsche: 911, Boxter , Panamera, Cayman, Cayenne.
• Rolls Royce: Ghost, Phantom, Phantom Coupé, Phantom Drophead Coupé.
• Škoda: Superb.
• Suzuki: Grand Vitara.
45

7/29/2019 Customer Perception Hundai
http://slidepdf.com/reader/full/customer-perception-hundai 46/82
• Toyota: Camry, Land Cruiser , Land Cruiser Prado, Prius.
• Volkswagen: Beetle, Touareg.
• Volvo: S80, XC90.
COMPANY PROFILE
HISTORY:
The Company is an authorized Dealer of Hyundai Motors India Limited (HMIL)
for sale of its entire range of motor vehicles. It is also authorized to service & repair of all
Hyundai cars and also deals in spare parts of Hyundai cars.
Lakshmi Hyundai was established in the year 1998 in Himayathnagar with the
launch of Hyundai’s first car in India- the evergreen SANTRO. The entire business is
managed under the able leadership and guidance of the managing Director Shri K.Rama
Mohana Rao.
Soon after the Himayathnagar showroom, came up the ‘state-of-art service
facilities at Kukatpally, Banjarahills and L.B.Nagar. These service centers are well
equipped to cater to the needs of valued customers. The management left no stone
unturned to review, research and implement the latest of technologies and methodologies
to improve on the sales, service on the customer satisfaction. Continuous up gradation of
the facilities at the sales and service outlets and adding to the service agenda each time,
add been sales graph go high by the year.
AWARDS:
The awards received for “ Best in sales ” in south region, “Best in finance ”, “Top
performer ” in 2005 and their technicians being awarded with a Gold Medal for standing
46

7/29/2019 Customer Perception Hundai
http://slidepdf.com/reader/full/customer-perception-hundai 47/82
No.1 in the world at World skill Olympics held at Korea-stand testimony to the
recognition that received at the global level.
According to the popular belief, a customer walking into LAKSHMI HYUNDAI is
treated like an asset. His/her needs are assessed in the first stage and the customer is
educated subsequently about the product line, service range, allied services, etc., ample
information and time is given to the prospective buyer to make up his/her mind on which
car to buy.
Totally focused customer centric approach, unparalleled service motto, top-end
facilities, bouquet of allied services, solid after sales backup, quality assurance,
unconditional warranty promise and desire to excel through service are some of the
threads which blend in effectively to give birth to the fabric called LAKSHMI
HYUNDAI LAKSHMI HYUNDAI’s success is just beginning and more to expect
spectacular chapters in the preamble “Winning Edges”.
LAKSHMI HYUNDAI MAN POWER:
Department Own Contract Total
Sales 57 0 57
Service 126 49 175
Spaces 15 0 15
Finance &
HR/Administration
98 0 98
Total 296 49 345
47
7/29/2019 Customer Perception Hundai
http://slidepdf.com/reader/full/customer-perception-hundai 48/82
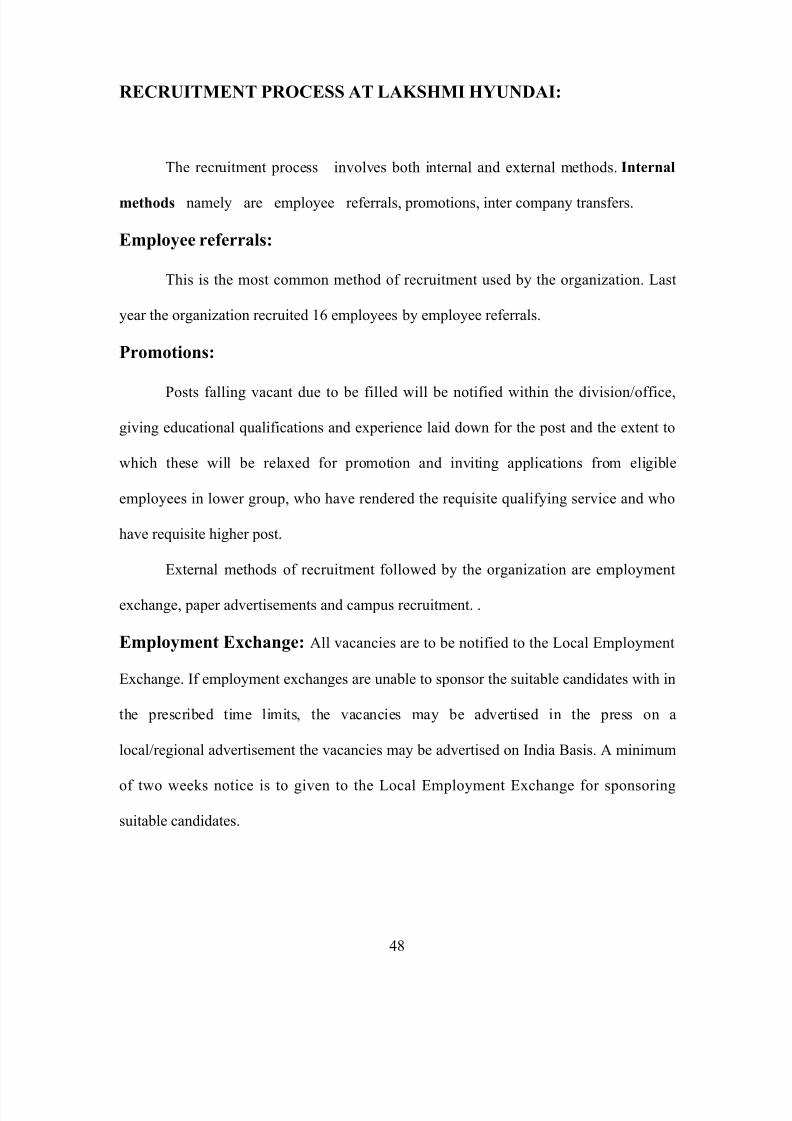
RECRUITMENT PROCESS AT LAKSHMI HYUNDAI:
The recruitment process involves both internal and external methods. Internal
methods namely are employee referrals, promotions, inter company transfers.
Employee referrals:
This is the most common method of recruitment used by the organization. Last
year the organization recruited 16 employees by employee referrals.
Promotions:
Posts falling vacant due to be filled will be notified within the division/office,
giving educational qualifications and experience laid down for the post and the extent to
which these will be relaxed for promotion and inviting applications from eligible
employees in lower group, who have rendered the requisite qualifying service and who
have requisite higher post.
External methods of recruitment followed by the organization are employment
exchange, paper advertisements and campus recruitment. .
Employment Exchange: All vacancies are to be notified to the Local Employment
Exchange. If employment exchanges are unable to sponsor the suitable candidates with in
the prescribed time limits, the vacancies may be advertised in the press on a
local/regional advertisement the vacancies may be advertised on India Basis. A minimum
of two weeks notice is to given to the Local Employment Exchange for sponsoring
suitable candidates.
48

7/29/2019 Customer Perception Hundai
http://slidepdf.com/reader/full/customer-perception-hundai 49/82
Paper advertisements:
This method of recruitment involves advertising the requirements of personnel in
two of the leading newspapers one being in English language and other being in regional
language. For recruitments in Hyderabad, Eenadu and Deccan Chronicle are the two
leading newspapers that the requirement of personnel is advertised.
SELECTION PROCESS AT LAKSHMI HYUNDAI:
After the recruitment process next step is the selection process in employing a
suitable candidate into the organization. At Hindustan Aeronautics Limited the selection
process mainly includes test/interviews. If a candidate passes through the different rounds
of interviews/test then he is employed into the organization. The Personnel Department of
each division or the corporate office will screen the applications received and categorize
them to those that satisfy prescribed minimum educational qualification and experience
and those do not .
Personal Manager Interview:
This is the first round of interview for the candidate. The Personal manager
checks the knowledge of the candidate in the applied field along with his positive
attitude, communication skills and so on. On personal dissatisfaction the manager can call
the candidate for another round of interview. He prepares an evaluation report on the
candidates' performance in the interview.
49
7/29/2019 Customer Perception Hundai
http://slidepdf.com/reader/full/customer-perception-hundai 50/82
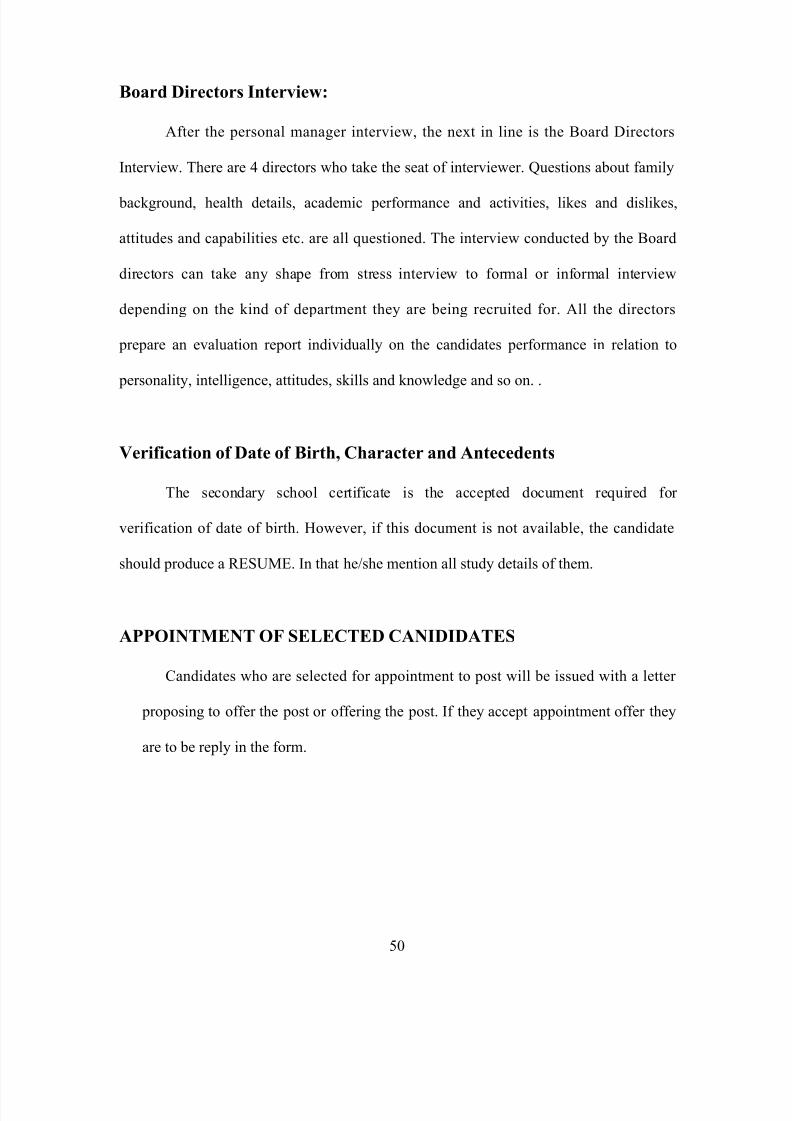
Board Directors Interview:
After the personal manager interview, the next in line is the Board Directors
Interview. There are 4 directors who take the seat of interviewer. Questions about family
background, health details, academic performance and activities, likes and dislikes,
attitudes and capabilities etc. are all questioned. The interview conducted by the Board
directors can take any shape from stress interview to formal or informal interview
depending on the kind of department they are being recruited for. All the directors
prepare an evaluation report individually on the candidates performance in relation to
personality, intelligence, attitudes, skills and knowledge and so on. .
Verification of Date of Birth, Character and Antecedents
The secondary school certificate is the accepted document required for
verification of date of birth. However, if this document is not available, the candidate
should produce a RESUME. In that he/she mention all study details of them.
APPOINTMENT OF SELECTED CANIDIDATES
Candidates who are selected for appointment to post will be issued with a letter
proposing to offer the post or offering the post. If they accept appointment offer they
are to be reply in the form.
50
7/29/2019 Customer Perception Hundai
http://slidepdf.com/reader/full/customer-perception-hundai 51/82
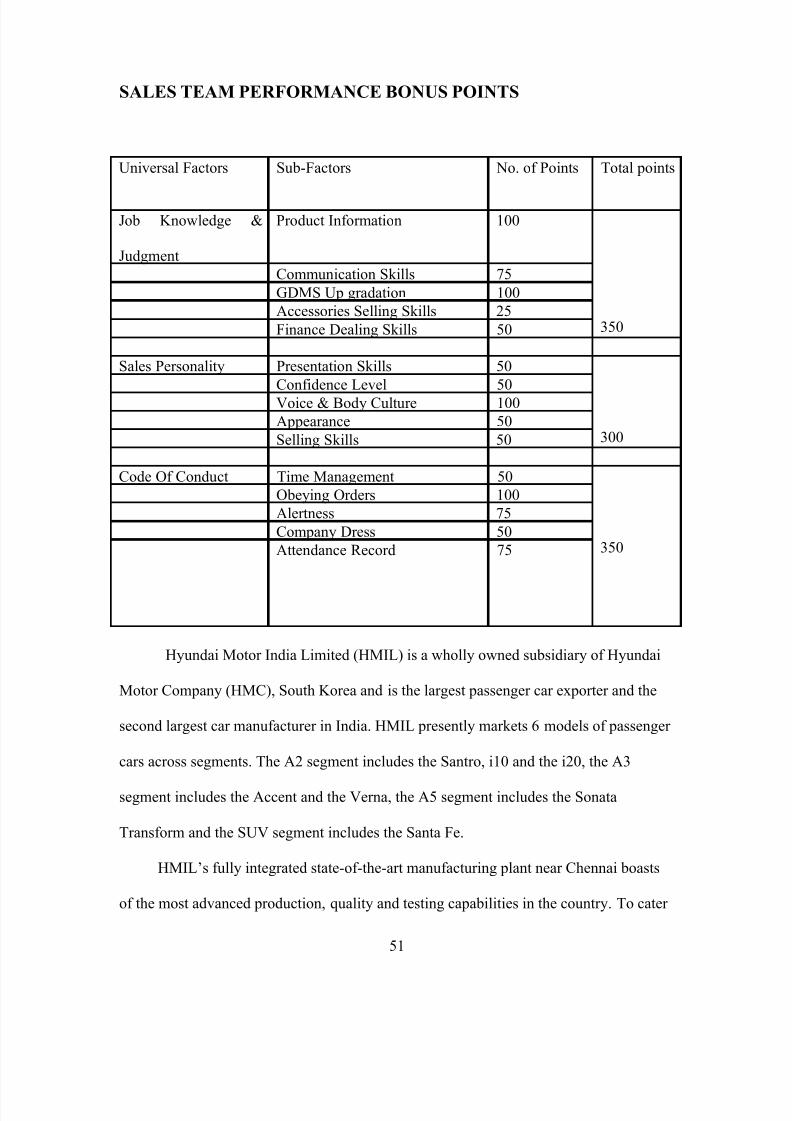
SALES TEAM PERFORMANCE BONUS POINTS
Universal Factors Sub-Factors No. of Points Total points
Job Knowledge &
Judgment
Product Information 100
350
Communication Skills 75
GDMS Up gradation 100
Accessories Selling Skills 25
Finance Dealing Skills 50
Sales Personality Presentation Skills 50
300
Confidence Level 50Voice & Body Culture 100
Appearance 50
Selling Skills 50
Code Of Conduct Time Management 50
350
Obeying Orders 100
Alertness 75
Company Dress 50
Attendance Record 75
Hyundai Motor India Limited (HMIL) is a wholly owned subsidiary of Hyundai
Motor Company (HMC), South Korea and is the largest passenger car exporter and the
second largest car manufacturer in India. HMIL presently markets 6 models of passenger
cars across segments. The A2 segment includes the Santro, i10 and the i20, the A3
segment includes the Accent and the Verna, the A5 segment includes the Sonata
Transform and the SUV segment includes the Santa Fe.
HMIL’s fully integrated state-of-the-art manufacturing plant near Chennai boasts
of the most advanced production, quality and testing capabilities in the country. To cater
51

7/29/2019 Customer Perception Hundai
http://slidepdf.com/reader/full/customer-perception-hundai 52/82
to rising demand, HMIL commissioned its second plant in February 2008, which
produces an additional 300,000 units per annum, raising HMIL’s total production
capacity to 600,000 units per annum.
In continuation with its commitment to providing Indian customers with cutting-
edge global technology, HMIL has set up a modern multi-million dollar research and
development facility in the cyber city of Hyderabad. It aims to become a centre of
excellence for automobile engineering and ensure quick turnaround time to changing
consumer needs.
As HMC’s global export hub for compact cars, HMIL is the first automotive
company in India to achieve the export of 10 lakh cars in just over a decade. HMIL
currently exports cars to more than 110 countries across EU, Africa, Middle East, Latin
America, Asia and Australia. It has been the number one exporter of passenger car of the
country for the sixth year in a row.
To support its growth and expansion plans, HMIL currently has a 315 strong dealer
network and 640 strong service points across India, which will see further expansion in
2010.
Mr. Han Woo Park joined Hyundai Motor Company in Seoul, South Korea, in
1982 in the finance department and ever since he has been involved with costing, auditing
and the financial operations of the company.
He joined Hyundai Motor India Limited in 2003 as the Chief Financial Officer
and since then he has played a pivotal role in HMIL as he was involved in all aspects of
the company in his capacity as a CFO.
Mr. Park has a vast experience and understanding of Hyundai Motor India Ltd and
52
7/29/2019 Customer Perception Hundai
http://slidepdf.com/reader/full/customer-perception-hundai 53/82
the Indian culture and has successfully led his team for the last seven years. Mr. Park
holds a degree in Business Administration from the University of Dankook in Seoul,
South Korea.
Prior to his becoming the Managing Director of HMIL he held the position of
CFO and Senior Executive Director. Mr Park lives in Chennai with his wife. He has two
children, a son and a daughter. The son is studying at University of Texas, Austin and the
daughter is studying at SUNY Buffalo. Mr Park was born in South Korea on January 29,
1958.
Hyundai Motor India Engineering (HMIE) is a fully owned subsidiary of Hyundai
Motor Company, South Korea, which has set up the R&D Centre in Hyderabad. HMIE is
a centre with one of the most advanced research and development facilities which focuses
on state of the art product and design engineering and rigorous quality enhancement. The
new R&D Centre at Hyderabad in India is Hyundai Motor Company’s fourth overseas
R&D centre.
Set up with an investment of Rs. 184 crores, the new 200,000 square-foot facility
R&D Centre, is aimed at further accelerating local content development and enable
Hyundai to respond even more quickly to changing customer needs across the world. The
R&D Centre will further facilitate the development of India as Hyundai’s global hub for
manufacturing and engineering of small cars. The new R&D Centre in Hyderabad will
support all back-end operations like computer aided engineering (CAE), computer aided
design (CAD) and help the R & D work taking place across Hyundai’s car line-up. The
R&D Centre will help in developing vehicles which includes their styling, design
engineering and vehicle test & evaluation. The R&D Centre will play a pivotal role for
cars manufactured in India inorder to satisfy the specific needs of the Indian customers.
53

7/29/2019 Customer Perception Hundai
http://slidepdf.com/reader/full/customer-perception-hundai 54/82
Hyundai Motor Company’s other overseas R&D centres are located in the United
States, Germany, Japan & Korea.
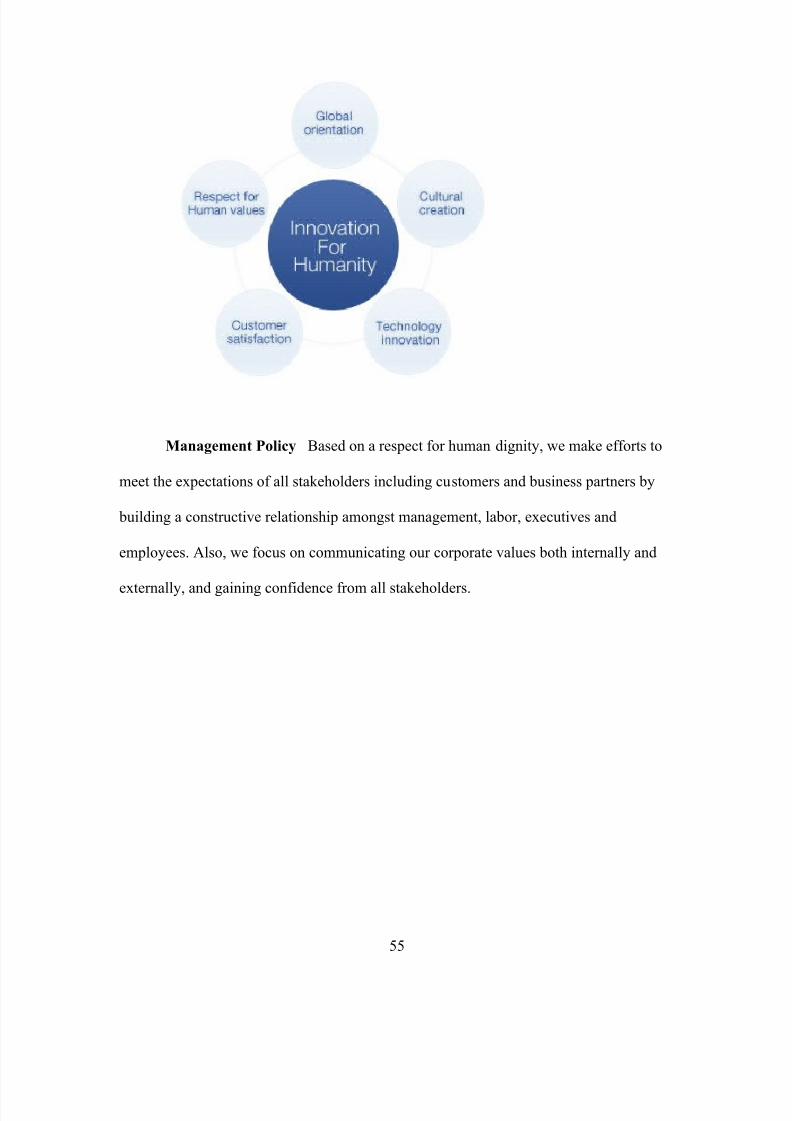
Management Philosophy : With the spirit of creative challenge, we will strive to
create a more affluent lifestyle for humanity, and contribute to the harmony and co-
prosperity with shareholders, customers, employees and other stakeholders in the
automobile industry.
The spirit of creative challenge has been a driving force in leading HMC to where
it is today.
It is the permanent key factor for HMC to actively respond to change in the
management system and seek creative and self–innovative system. With the spirit of
creative challenge, we create profits, the primary objective of a private enterprise.
Furthermore, we take responsibility for the environment and society we belong to, and
offer sustainable mobility in order to implement our corporate philosophy and provide
benefits to all stakeholders including shareholders, customers, executives, employees,
suppliers, and communities. Vision We announced "Innovation for Customers" as our
mid–to long–term vision with five core strategies: global orientation, respect for human
values, customer satisfaction, technology innovation, and cultural creation. We desire to
create an automobile culture of putting customer first via developing human–centered and
environment–friendly technological innovation.
54
7/29/2019 Customer Perception Hundai
http://slidepdf.com/reader/full/customer-perception-hundai 55/82
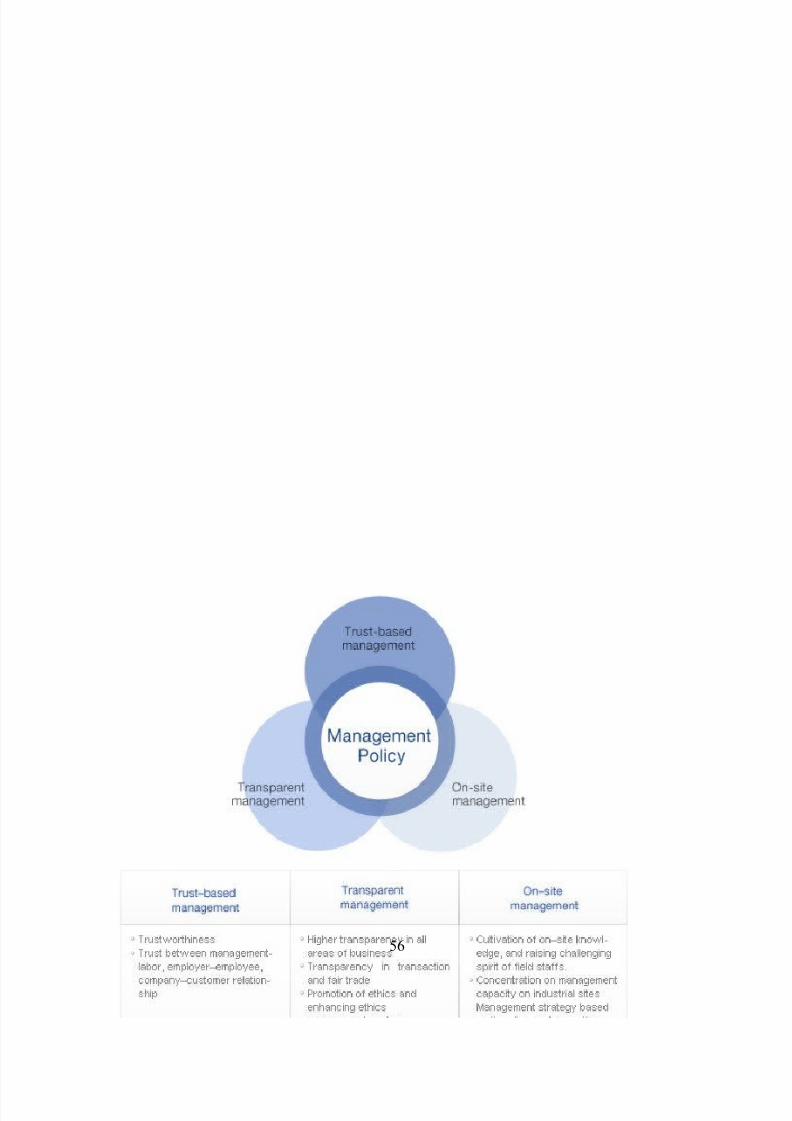
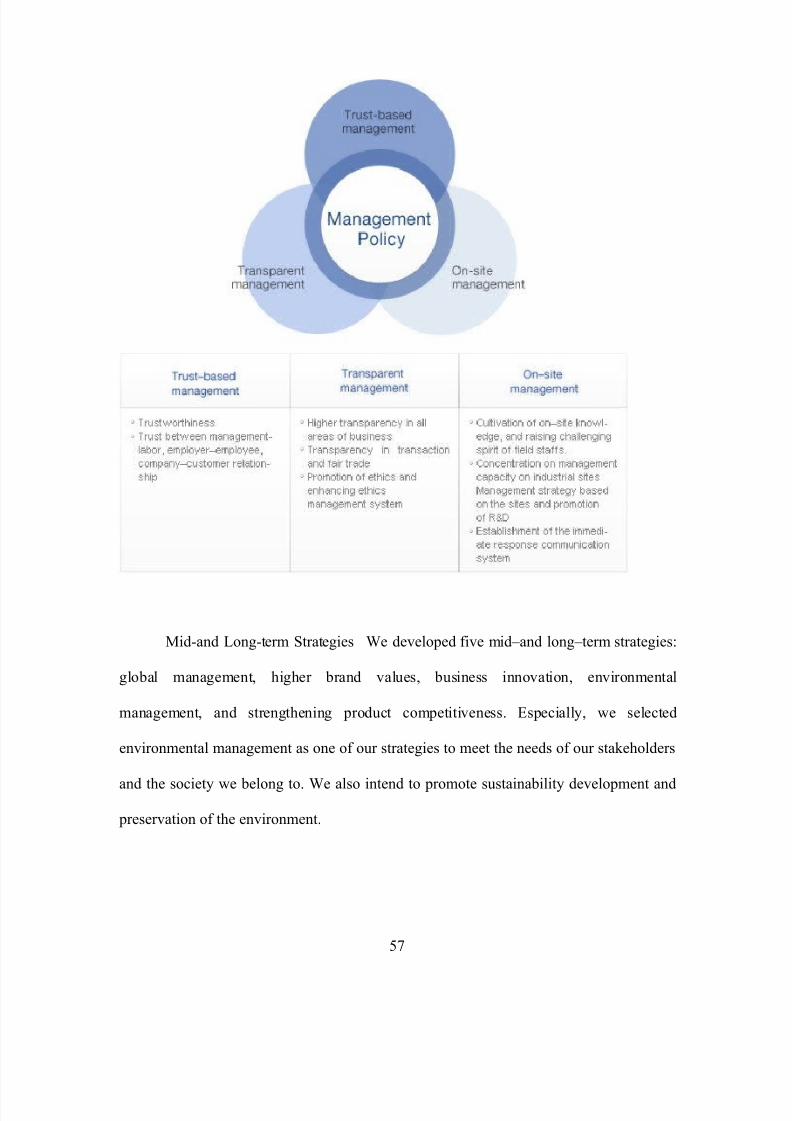
Management Policy Based on a respect for human dignity, we make efforts to
meet the expectations of all stakeholders including customers and business partners by
building a constructive relationship amongst management, labor, executives and
employees. Also, we focus on communicating our corporate values both internally and
externally, and gaining confidence from all stakeholders.
55
7/29/2019 Customer Perception Hundai
http://slidepdf.com/reader/full/customer-perception-hundai 56/82
56
7/29/2019 Customer Perception Hundai
http://slidepdf.com/reader/full/customer-perception-hundai 57/82
Mid-and Long-term Strategies We developed five mid–and long–term strategies:
global management, higher brand values, business innovation, environmental
management, and strengthening product competitiveness. Especially, we selected
environmental management as one of our strategies to meet the needs of our stakeholders
and the society we belong to. We also intend to promote sustainability development and
preservation of the environment.
57

7/29/2019 Customer Perception Hundai
http://slidepdf.com/reader/full/customer-perception-hundai 58/82
MOST LIKED SMALL CAR IS SANTROXING
58

7/29/2019 Customer Perception Hundai
http://slidepdf.com/reader/full/customer-perception-hundai 59/82
59

7/29/2019 Customer Perception Hundai
http://slidepdf.com/reader/full/customer-perception-hundai 60/82
60

7/29/2019 Customer Perception Hundai
http://slidepdf.com/reader/full/customer-perception-hundai 61/82
New Arrivals
•
EON
•
Santro Xing
61

7/29/2019 Customer Perception Hundai
http://slidepdf.com/reader/full/customer-perception-hundai 62/82
7/29/2019 Customer Perception Hundai
http://slidepdf.com/reader/full/customer-perception-hundai 63/82
CHAPTER-IV
DATA ANALYSIS
&
INTERPRETATION
63

7/29/2019 Customer Perception Hundai
http://slidepdf.com/reader/full/customer-perception-hundai 64/82
DATA ANALYSIS
1. Is this Show room has modern looking equipment and fixtures?
TABLE 1
Gender Strongly
disagree%
Somewhat
disagree% Neutral %
Some what
agree%
Strongly
agree
MALE 4 0.04 8 0.08 12 0.12 22 0.22 12
FEMALE 4 0.04 2 0.02 14 0.14 18 0.18 4
TOTAL 8 10 26 40 16
Table 1: reveals customer’s opinion on modern looking equipment and fixtures.
0
5
10
15
20
25
30
35
40
45
S T D I S A G %
S W D I S A G %
N
E U T R %
S W
A G %
S T A G R %
MALE
FEMAL
TOTAL
Interpretation
From the above data it was found that, 4 male and 4 female are strongly disagreed
with modern looking neutral in their opinion respondents are some what agree.12 male
and 4 female are strongly agree with the modern furniture and equipment., 22male and 18
female equipment and fixtures,8 male and 2 female are some what disagree, 12 male and
14 female respondents .
2. Is the Physical facilities at this Show room are visually appealing?
TABLE 2.
64

7/29/2019 Customer Perception Hundai
http://slidepdf.com/reader/full/customer-perception-hundai 65/82
Gender
Strongly
disagree %
Somewhat
disagree % Neutral %
somewha
t agree %
Strongly
agree %
MALE 4
0.0
4 10
0.1
0 10
0.1
0 17 0.17 8 0.08
FEMALE 0 0 2 0.02 14 0.14 23 0.23 12 0.12
TOTAL
4 12 24 40 20
Table 2: reveals customers opinion on visibility of physical facilities.
0
5
10
15
20
2530
35
40
45
S T D I S A G %
S W D I S A G %
N E U T R %
S W
A G %
S T A G R %
MALE
FEMAL
TOTAL
Interpretation
From the table it is evident that 40of the respondents are of the opinion that they
are some what satisfied with visibility, and 20 of the sample respondents said they
strongly agree. However, 24 of the sample collected are neutral with the appealing of
physical facilities. 12 of the sample respondents said they some what disagree and only 4
of the sample respondents said they strongly disagree with visibility. From the above
analysis we can say that majority of the sample respondents are agreed with the visual
appeal of physical facilities
1. Is the Show room layout at this Show room makes it easy for customers to
move around Show room?
65

7/29/2019 Customer Perception Hundai
http://slidepdf.com/reader/full/customer-perception-hundai 66/82
TABLE 3
Gender
Strongly
disagree %
Somewhat
disagree % Neutral %
somewha
t agree %
Strongly
agree %
MALE 4
0.0
4 2
0.0
2 16
0.1
6 19 0.19 12 0.12FEMAL
E 0 0 10
0.1
0 16
0.1
6 11 0.11 10 0.10
TOTAL 4 12 32 30 22
Table 3: reveals customer’s opinion on visibility of layout of this Show room easy to the
customers to move around the Show room.
0
5
10
15
20
25
30
35
S T D I S A G %
S W
D I S A G %
N E U
T R %
S W
A G %
S T A G R %
MALE
FEMAL
TOTAL
Interpretation
From the table it is evident that 32 of the respondents are of the opinion that
they are neutral to move around the Show room, and 22 of the sample respondents said
they strongly agree. However, 30 of the sample collected are some what agreed. However
only 12 of the people some what disagree and 4 of the respondents strongly disagree.
From the above analysis we can say that majority of the people feels that this Show room
makes easy for customers to move around the Show room.
4. Do employees in this Show room have knowledge to answer customer question?
TABLE 4
66

7/29/2019 Customer Perception Hundai
http://slidepdf.com/reader/full/customer-perception-hundai 67/82
Table 4: reveals customers opinion on Employees have knowledge to answer customer’s
question.
InterpretationFrom the table it is evident that 38 of the respondent’s opinion that they are some
what satisfied with knowledge of employees, and 30 of the sample respondents said they
strongly agree. However, only 18 of the sample respondents are Neutral with the
knowledge of employees. However12 of the sample respondents said they somewhat
disagree and 2 of the respondents strongly disagree. From the above analysis we can say
that majority of the sample respondents are in agreed with the Employees have
knowledge to answer customers question.
5. Does the behavior of employees in this Show room instills confidence in customers?
TABLE 5
67
Gender
Strongly
disagree %
Somewhat
disagree % Neutral %
somewha
t agree %
Strongly
agree %
MALE 0 0 8 0.08 9
0.0
9 22 0.22 16 0.16
FEMALE 2
0.0
2 4 0.04 9
0.0
9 16 0.16 14 0.14TOTAL 2 12 18 38 30
0
5
10
15
20
25
30
35
40
1 2 3 4 5 6 7 8 9 10
Gender
MALE
FEMALE
TOTAL

7/29/2019 Customer Perception Hundai
http://slidepdf.com/reader/full/customer-perception-hundai 68/82
Gender
Strongly
disagree %
Somewhat
disagree % Neutral %
Somewha
t agree %
Strongly
agree %
MALE 0 0 4
0.0
4 18
0.1
8 30 0.30 6 0.06
FEMAL
E 2
0.0
2 6
0.0
6 14
0.1
4 10 0.10 10 0.10TOTAL 2 10 32 40 16
Table5: reveals customer’s opinions on the behavior of employees instill confidence in
customers.
0
5
10
15
20
25
30
35
40
45
S T D I S A %
S W
D I S A %
N E U T %
S W
A G %
S T A G %
MALE
FEMALE
TOTAL
Interpretation
From the table it is evident that 40 of the respondents are of the opinion that they
are some what satisfied with employee’s behavior, and 32 of the sample respondents said
they strongly agree. However, only 16of the sample collected is strongly agreeing with
the behavior of employees, and 10 of the people are some what agree and 2 of the people
are strongly disagreeing. From the above analysis we can say that majority of the sample
respondents are in agreed with the behavior of the employees in this Show room instill
confidence in customers.
6. Does employees in this Show room give prompt service to customers?
TABLE 6
68

7/29/2019 Customer Perception Hundai
http://slidepdf.com/reader/full/customer-perception-hundai 69/82
Gender
Strongly
disagree %
Some
what
disagree % Neutral %
Somewhat
agree %
Strogly
agree %
Male 0 0 12 12 12 12 20 0.20 10 0.10
Female 2 0.02 4 0.04 12 0.12 16 0.16 12 0.12
TOTAL 2 16 24 36 22
Table6: reveals customer’s opinions on the behavior of employees give prompt service to
customers.
0
5
10
15
20
25
30
35
40
S T D I S A G %
S W
D I S A %
N E U T %
S W
A G %
S T A G %
MALE
FEMALE
TOTAL
Interpretation
From the table it is evident that 36 of the respondents are of the opinion that they
are some what satisfied with employees give prompt service, and 22 of the sample
respondents said they strongly agree. However, only 24 of the sample collected are
Neutral with the behavior of employees. And 16 of the people are some what agree and 2
of the people are strongly disagreed. From the above analysis we can say that majority of
the sample respondents are in agreement with the employees in the Show room give
prompt service to customers.
7. Is this Show room gives customers individual attention?
TABLE 7
69

7/29/2019 Customer Perception Hundai
http://slidepdf.com/reader/full/customer-perception-hundai 70/82
Gender
Strongly
disagree %
Somewhat
disagree % Neutral %
somewha
t agree %
Strongly
agree %
MALE 4
0.0
4 8 0.08 20
0.2
0 10
0.1
0 12 0.12
FEMALE 2
0.0
2 16 0.16 12
0.1
2 12
0.1
2 4 0.04
TOTAL 6 24 32 22 16
Table7: reveals customer’s opinions on the Show room give customers individual
attention.
0
5
10
15
20
25
30
35
S T D I S A G %
S W D I S A G %
N E U T R %
S W
A G R %
S T A G R %
MALE
FEMALE
TOTAL
Interpretation
From the table it is evident that 32 of the respondents are of the opinion that they
are neutral with Show room gives customers individual attention, and 22 of the sample
respondents said they somewhat agreed. However, only 16of the sample collected is
strongly agreed and 24 of the people are some what disagree and 2 of the people are
strongly disagreed. From the above analysis we can say that majority of the sample
respondents are said this Show room gives customer’s individual attention.
8. When a customer has a problem, is this Show room shows a sincere interest in solving
it ?
70

7/29/2019 Customer Perception Hundai
http://slidepdf.com/reader/full/customer-perception-hundai 71/82
TABLE 8
Gender
Strongly
disagree %
Somewhat
disagree % Neutral %
somewha
t agree %
Strongly
agree %
MALE 8
0.0
8 0 0 11
0.1
1 22
0.2
2 12 0.12FEMAL
E 4
0.0
4 6 0.06 15
0.1
5 20
0.2
0 2 0.02
TOTAL 12 6 26 42 14
Table8: reveals customer’s opinions on the customer’s problem.
0
5
10
15
20
2530
35
40
45
S T D I S A G
%
S W D I S A G
%
N E U T R %
S W
A G R %
S T A G R %
MALE
FEMALE
TOTAL
Interpretation
From the table it is evident that 42 of the respondents are of the opinion that
they are some what agree with Show room gives sincere interest in customers problem,
and 26 of the sample respondents said they neutral. However, only 14of the sample
collected is strongly agreed and 6 of the people are some what disagree and 12 of the
people are strongly disagreed. From the above analysis we can say that majority of the
sample respondents are agree with this Show room shows a sincere interest in solving
customers problem.
9. Is this Show room provides plenty of convenient parking to all their customers?
71

7/29/2019 Customer Perception Hundai
http://slidepdf.com/reader/full/customer-perception-hundai 72/82
TABLE 9
Gender
Strongly
disagree %
Somewhat
disagree % Neutral %
somewha
t agree %
Strongly
agree %
MALE 6
0.0
6 8
0.0
8 12
0.1
2 14
0.1
4 14 0.14
FEMAL
E 10
0.1
0 12
0.1
2 8
0.0
8 10
0.1
0 6 0.06
TOTAL 16 20 20 24 20
Table9: reveals customer’s opinions on the parking convenience of customer’s.
0
5
10
15
20
25
30
S T D I S A G
R E %
S W
D I S A G
R E %
N E U T R A L %
S W
A G R E %
S T A G R
E %
MALE
FEMALE
TOTAL
Interpretation
From the table it is evident that 24 of the respondents are of the opinion that they
are some what agree with Show room gives customers parking problem, and 20 of the
sample respondents said they neutral. However, only 20 of the sample collected are
strongly agreed and 20 of the people are some what disagree and 16of the people are
strongly disagree. From the above analysis we can say that majority of the sample
respondents are agree that this Show room has a plenty of space for parking.
10. Does this Show room has operating hours convenient to all their customers?.
72

7/29/2019 Customer Perception Hundai
http://slidepdf.com/reader/full/customer-perception-hundai 73/82
TABLE 10
Gender
Strongly
disagree %
Somewhat
disagree % Neutral %
somewha
t agree %
Strongly
agree %
Male 2
0.0
2 6
0.0
6 12
0.1
2 12 0.12 30 0.30
Female 2
0.0
2 6
0.0
6 10
0.1
0 10 0.10 20 0.20
4 12 22 22 50
Table9 reveals customer’s opinions on the operating hours of this Show room convenient
to all their customers.
0
10
20
30
40
50
60
S T D
I S A G R %
S W D
I S A G R %
N
E U T R
A %
S W
A G R E %
S T A G R E %
MALE
FEMALE
TOTAL
Interpretation
From the table it is evident that 50 of the respondents are of the opinion that they
are strongly agree with Show room operating hours, and 22of the sample respondents
said they some what agree. However, only 22of the sample collected is neutral and 12 of
the people are some what disagree and 4 of the people are strongly disagreed. From the
above analysis we can say that majority of the people said that they are strongly agree
with the operating hours of this Show room convenient to all their customers.
73

7/29/2019 Customer Perception Hundai
http://slidepdf.com/reader/full/customer-perception-hundai 74/82
CHAPTER-V
FINDINGS
SUGGESTIONS
LIMITATIONS
CONCLUSION
74

7/29/2019 Customer Perception Hundai
http://slidepdf.com/reader/full/customer-perception-hundai 75/82
FINDINGS
1. From data analysis, I conclude that 40% of the respondent’s satisfaction level
about Show room’s modern looking equipment and fixtures is some what agree.
Then, only few respondents are strongly disagree.
2. Majority of the people (40%) said the Show room physical facilities are visually
appealing.
3. When asking about Show room convenience to move around the Show room
maximum number of respondents said that it is some what ease to move around
the Show room.
4. 38% respondents said that the Show room people are somewhat knowledgeable to
answer their questions.
5. According to data analysis, employees in the Show room are providing without
delay services to the customers.
6. 24% of the respondents said that the Show rooms cannot give personal attention
to the customers.
7. 42% respondents have said that, the Show room management is immediately
responding to customer’s problem.
8. After the data analysis I found that majority of the people are not pleased with the
parking facilities
75
7/29/2019 Customer Perception Hundai
http://slidepdf.com/reader/full/customer-perception-hundai 76/82
SUGGESTIONS
Parking facilities should be enhanced in order to satisfy customers.
Management personnel should maintain gracious relation with the customers.
Knowledge of the employees should be improved in order to answer the
customer’s troubles.
The layout of the Show room should be enhanced in order to move customers
around the Show room.
76

7/29/2019 Customer Perception Hundai
http://slidepdf.com/reader/full/customer-perception-hundai 77/82
LIMITATIONS OF THE STUDY
1. Time is the main limitation for the study, as project was restricted only for 45
days.
2. The methods used in this project are random sampling methods and results
obtained may not be accurately fully accurate and believable.
3. The research has been centered to only One hundred Customers of HYUNDAI
fresh
4. The analysis is purely based on closed ended questions and due their deliberate
manipulation, important information may be lost and even barriers of
communication would cause a limitation.
The whole project research was confined to only customers of HYUNDAI Fresh@.
77
7/29/2019 Customer Perception Hundai
http://slidepdf.com/reader/full/customer-perception-hundai 78/82
CONCLUSION
The respondents are of HYUNDAI and they came know about the service from
hoardings, print media, primarily and through electronic media and road shows
secondarily. The respondents are using HYUNDAI since 1 year and below 1 year in most
of the cases. The service provided by HYUNDAI is used by majority of the respondents
and the reason for choosing it is the quality of the service, followed by brand image.
CONSUMER PERCEPTION of the respondents towards HYUNDAI is high;
however a significant number of the respondents are dissatisfied with its services.
In purchasing HYUNDAI products family appear to be the prime motivators of
the respondents in making their purchase decisions, due to the special offers being
targeted by the company at this segment.
The respondents are paying their bills at the company show rooms, and these are also on
delivery time.
The respondents are desirous of having online bill payment service for
convenience as its saves their time, money and effort. The instruments being providing
with billing service are being well received by the respondents.
78

7/29/2019 Customer Perception Hundai
http://slidepdf.com/reader/full/customer-perception-hundai 79/82
BIBLIOGRAPHY
Referred books :
1. “Principles of Marketing 11th edition”, Philip Kotler, published by Prentice Hall
India.
2. “Marketing Management 7th edition” , V.S.Ramaswami and Namakumari,
Published by Millennium India Ltd.
3. “Sales Management 5th edition”, Richard R Still, Published by Prentice Hall India.
4. “Marketing Research 6th edition”, G.C.Beri, Published by Tata Mc Graw Hill
Co.Ltd .
5. “Marketing Research 7th edition”, Luck David and Robin Ronald, Published by
Prentice Hall India.
6. “Research for Marketing Decisions”, Green, Paul E, and Doranld S. Tull, Prentice
Hall of India Pvt Ltd.
JOURNALS:
1. Gilles, Jean-Noel Kapferer, and Francoise Roussel (1995), “The Underlying
Structure of Consumer Perception” Journal of Marketing Science, 14 (No.3, part
2), G170-G79.
2. George S and Robert W, Pratt (1971), “Fundamentals of Marketing”. Journal of
Marketing Research, 8 (February), 85-9.
3. F.Kent Mitchel, “Marketing Communications” Journal of Consumer Marketing
(1985): 405-447.
4. Debra Grace, Scott Weaven, Mitchell Ross (2010), “Consumer perception”
International Journal of Market research (1993): 32.
79

7/29/2019 Customer Perception Hundai
http://slidepdf.com/reader/full/customer-perception-hundai 80/82
WEB SITES
1. www.google.com
2. www.hyundai.com
3. www.autoindia.com
4. www.customersopt.org
80

7/29/2019 Customer Perception Hundai
http://slidepdf.com/reader/full/customer-perception-hundai 81/82
QUESTIONNAIRE
ANNEXTUREANNEXTURE
Name of Respondent: ___________________________________________________
Designation: ________________________ Income: ___________________________
Address: ______________________________________________________________
Phone No._________________ Email id: ___________________________________
1. This Show room has modern looking equipment and fixtures:
Strongly Disagree Somewhat Disagree Neutral Somewhat Agree
Strongly Agree
2. The physical facilities at this Show room are visually appealing:
Strongly Disagree Somewhat Disagree Neutral Somewhat Agree
Strongly Agree
3. The Show room layout at this Show room makes it easy for customers to move
around Show room:
Strongly Disagree Somewhat Disagree Neutral Somewhat Agree
Strongly Agree
4. Employees in this Show room have the knowledge to answer customer
questions:
Strongly Disagree Somewhat Disagree Neutral Somewhat Agree
Strongly Agree
81

7/29/2019 Customer Perception Hundai
http://slidepdf.com/reader/full/customer-perception-hundai 82/82
5. The behavior of employees in this Show room instill confidence in customers
Strongly Disagree Somewhat Disagree Neutral Somewhat Agree
Strongly Agree
6. Employees in this Show room give prompt service to customers:
Strongly Disagree Somewhat Disagree Neutral Somewhat Agree
Strongly Agree
7. This Show room gives customers individual attention:
Strongly Disagree Somewhat Disagree Neutral Somewhat Agree
Strongly Agree
8. When a customer has a problem, this Show room shows a sincere interest in
solving it:
Strongly Disagree Somewhat Disagree Neutral Somewhat Agree
Strongly Agree
9. This Show room provides plenty of convenient parking for customers:
Strongly Disagree Somewhat Disagree Neutral Somewhat Agree
Strongly Agree


![customer perception prjct[1]](https://img.pdfslide.us/doc/110x75/5a657ccc7f8b9a987f8b4c21/customer-perception-prjct1.jpg)