Embed Size (px)
Citation preview


Customer Advisory
Committee Meeting 2
AUGUST 28, 2018

PLEDGE OF ALLEGIANCE

MEETING AGENDA
Meeting Take Away’s
Preview of CAC Meeting 3 on December 11, 2018
Public Comment
Main Replacement Basics and Benchmarking
District Pipeline Asset Inventory Results
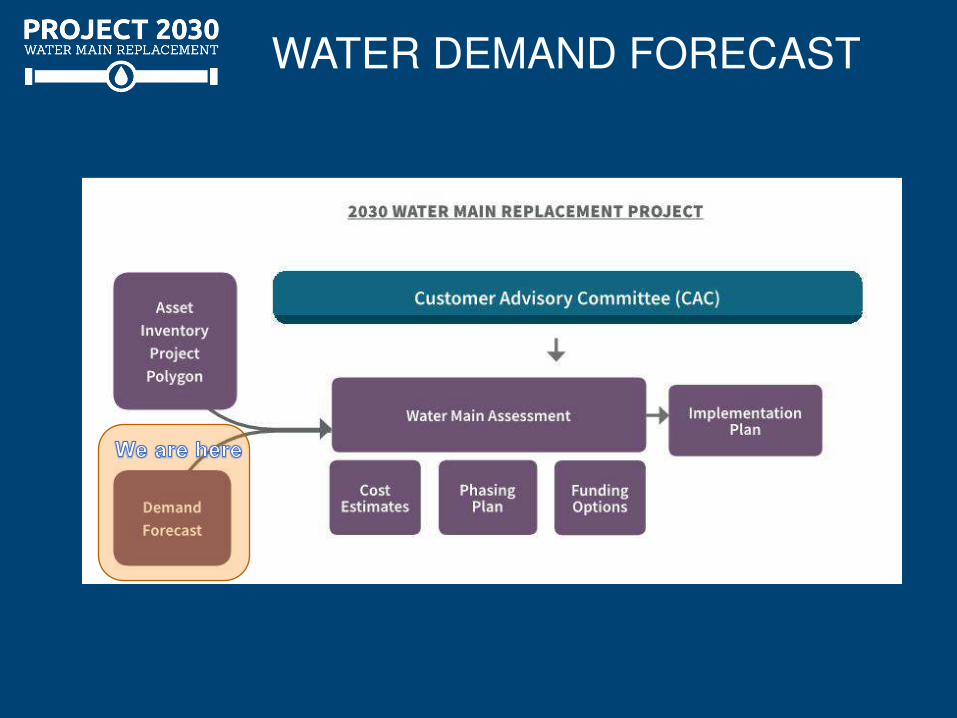
Water Demand Forecast
Approve Meeting #1 Summary
Public Comment
4

PUBLIC COMMENT
5

PUBLIC COMMENT
6

APPROVE MEETING #1 SUMMARY – MAY 29, 2018

WHERE WE ARE & WHERE WE ARE GOING
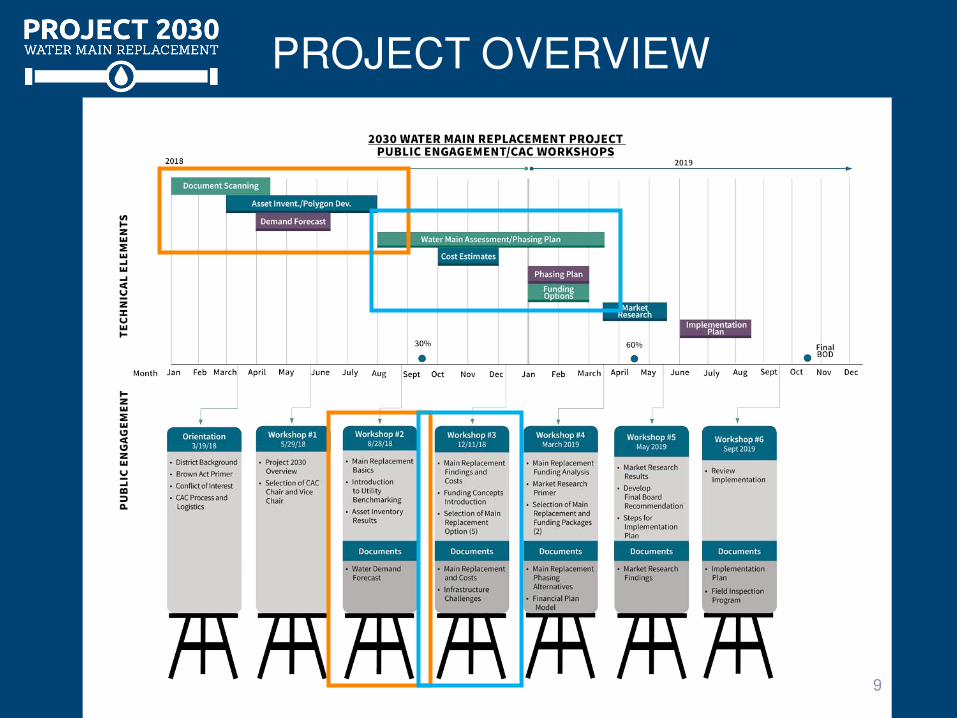
PROJECT OVERVIEW
9
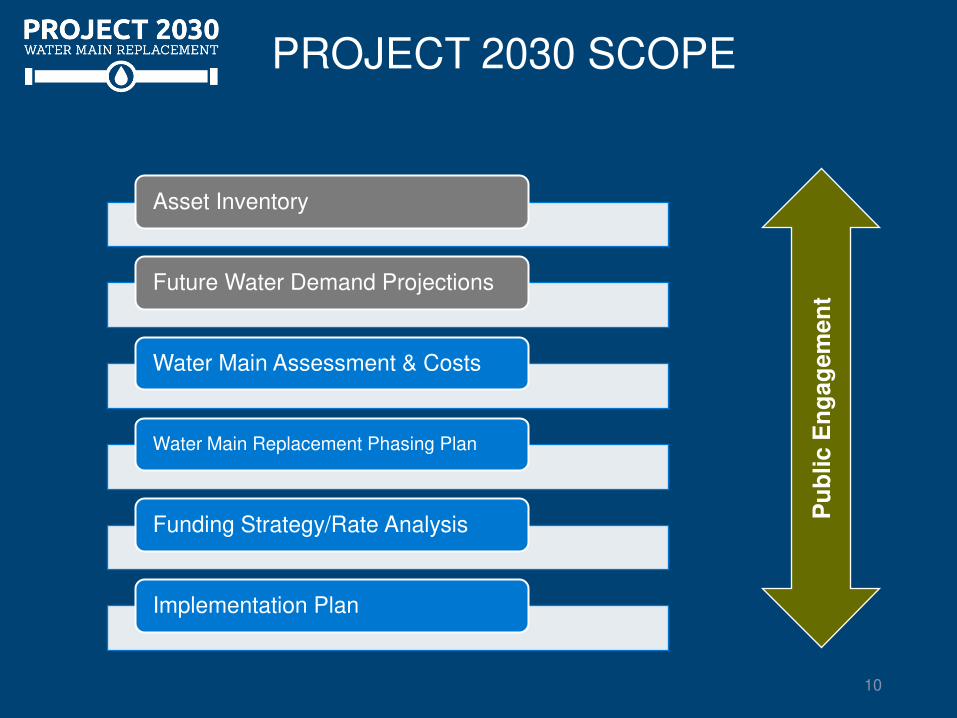
PROJECT 2030 SCOPE
Asset Inventory
Future Water Demand Projections
Water Main Assessment & Costs
Water Main Replacement Phasing Plan
Funding Strategy/Rate Analysis
Implementation Plan
Pu
bli
c E
ng
ag
em
en
t
10
WATER DEMAND
FORECAST
How projected changes in water usage will affect the way the District replaces
and sizes water main
WATER DEMAND FORECAST
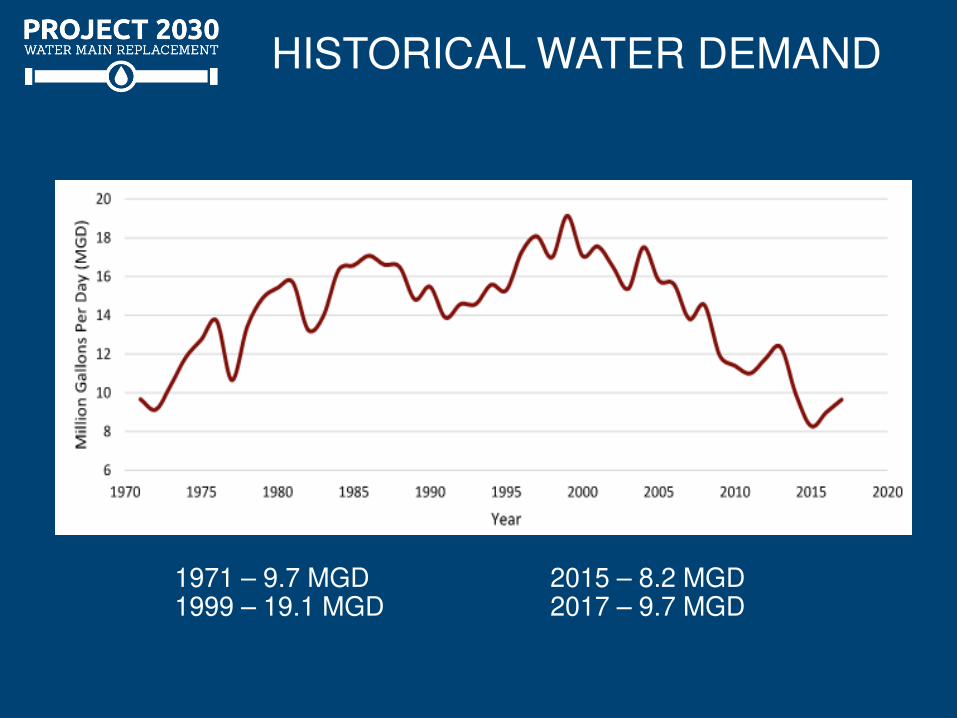
HISTORICAL WATER DEMAND
1971 – 9.7 MGD 1999 – 19.1 MGD
2015 – 8.2 MGD 2017 – 9.7 MGD
WATER DEMAND FORECAST
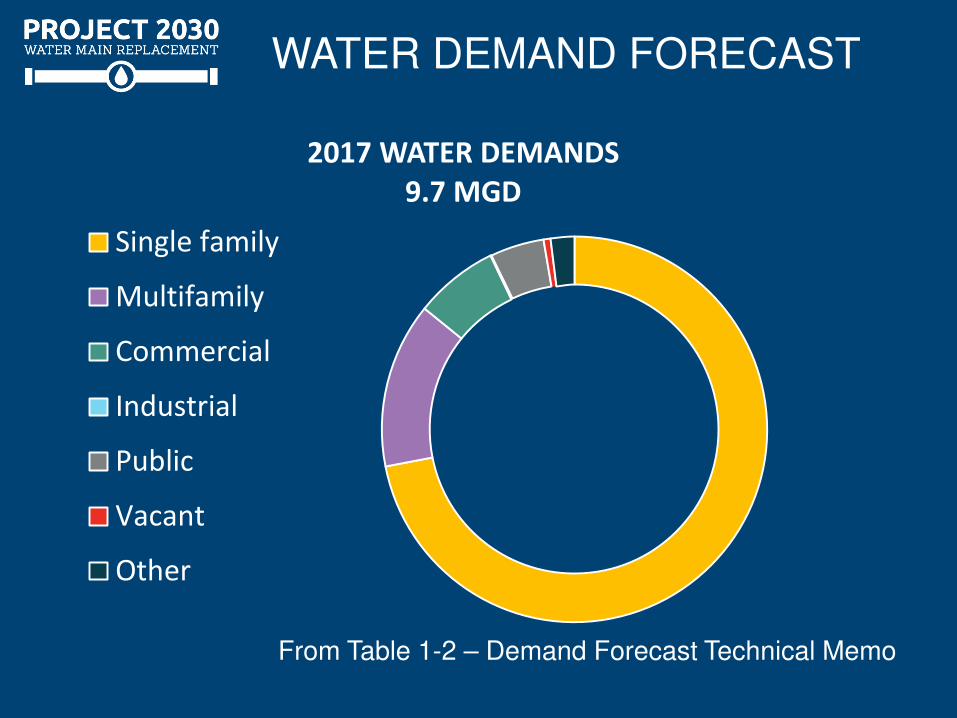
2017 WATER DEMANDS
9.7 MGD
Single family
Multifamily
Commercial
Industrial
Public
Vacant
Other
From Table 1-2 – Demand Forecast Technical Memo

WATER DEMAND FORECAST
FACTORS AFFECTING DEMAND: • POPULATION GROWTH

WATER DEMAND FORECAST
FACTORS AFFECTING DEMAND: • Water Conservation Driven by State Legislation
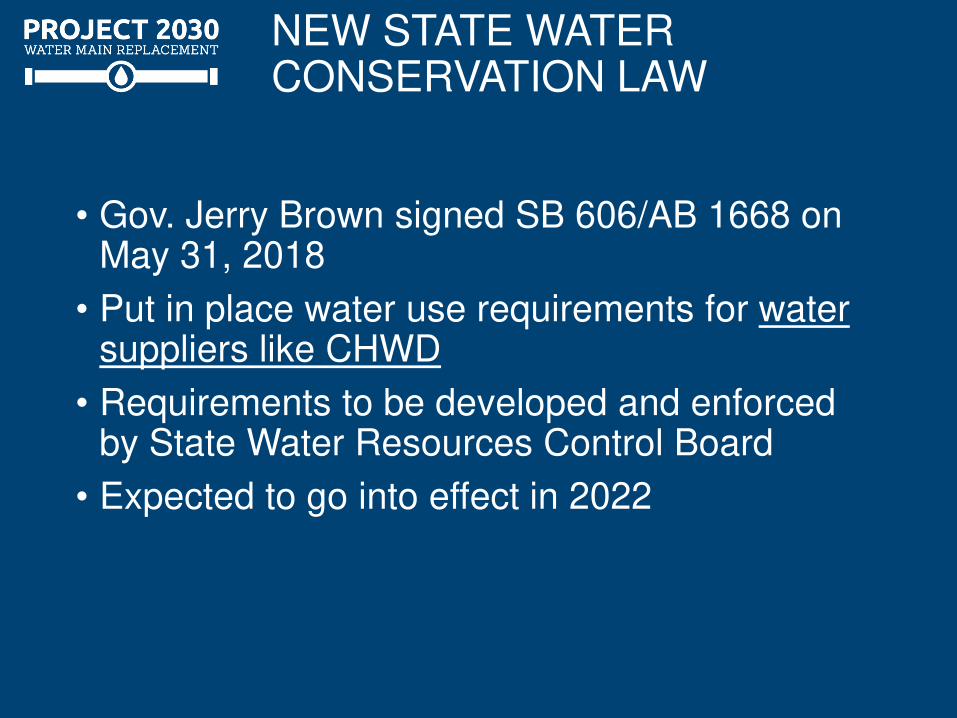
NEW STATE WATER CONSERVATION LAW
• Gov. Jerry Brown signed SB 606/AB 1668 on May 31, 2018
• Put in place water use requirements for water suppliers like CHWD
• Requirements to be developed and enforced by State Water Resources Control Board
• Expected to go into effect in 2022
LAW’S EFFECTS ON CHWD
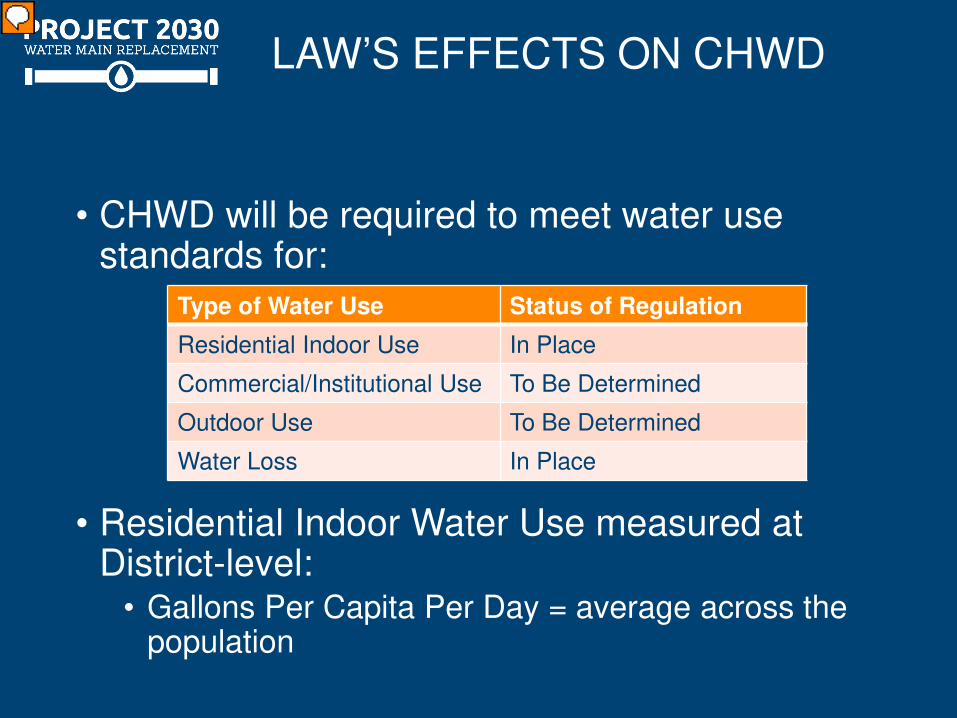
• CHWD will be required to meet water use standards for:
• Residential Indoor Water Use measured at District-level:
• Gallons Per Capita Per Day = average across the population
Type of Water Use Status of Regulation
Residential Indoor Use In Place
Commercial/Institutional Use To Be Determined
Outdoor Use To Be Determined
Water Loss In Place

IMPACTS TO CUSTOMERS
• Standard for Indoor Water Use across District • 55 Residential Gallons per capita per day by 2022
• 50 Residential Gallons per capita per day by 2030
• District is exploring available options to meet targets
• Working with Customers
• Combating unfair regulations
WHAT DOES THIS MEAN FOR PROJECT 2030?
• Legislation is the major factor in determining water demand

WATER DEMAND FORECAST
0
20
40
60
80
100
120
140
160
Single family Multifamily
WATER DEMANDS (GPCD)
2017 2050
From Table 1-4 – Demand Forecast Technical Memo
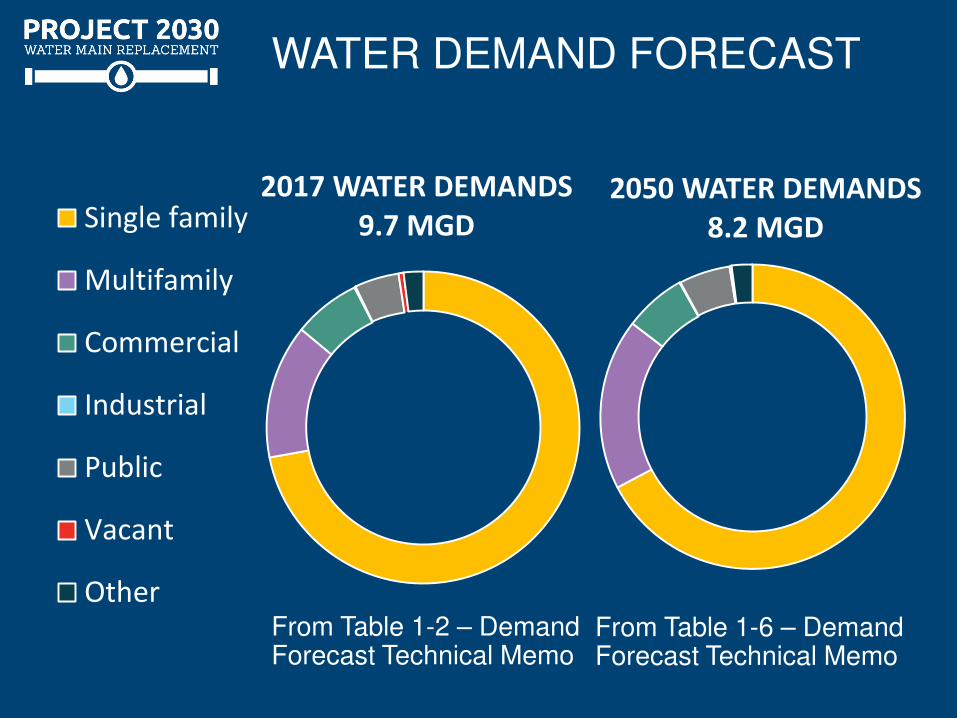
WATER DEMAND FORECAST
2050 WATER DEMANDS
8.2 MGD
2017 WATER DEMANDS
9.7 MGD Single family
Multifamily
Commercial
Industrial
Public
Vacant
OtherFrom Table 1-6 – Demand Forecast Technical Memo
From Table 1-2 – Demand Forecast Technical Memo

WATER EFFICIENCY MAY OUTWEIGH POPULATION GROWTH
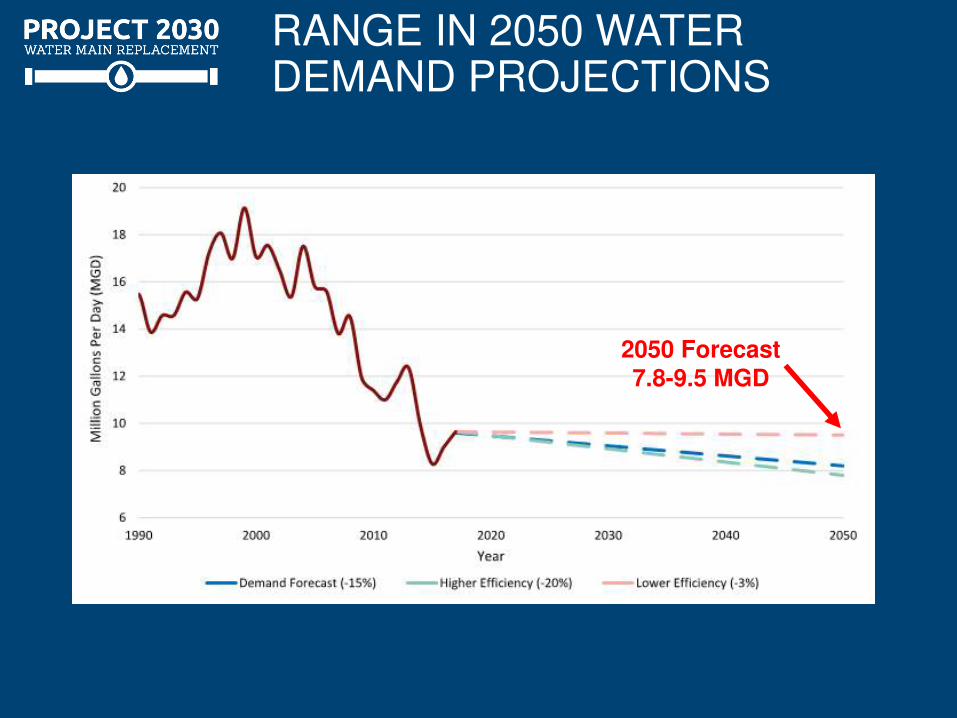
RANGE IN 2050 WATER DEMAND PROJECTIONS
2050 Forecast 7.8-9.5 MGD
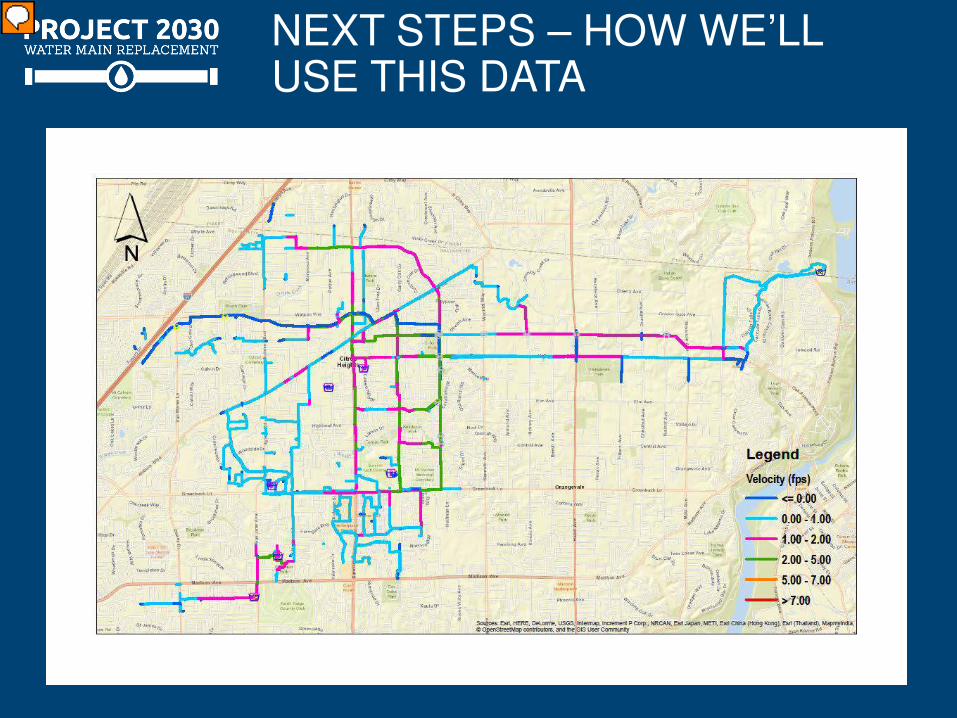
NEXT STEPS – HOW WE’LL USE THIS DATA
CAC ACTIVITY
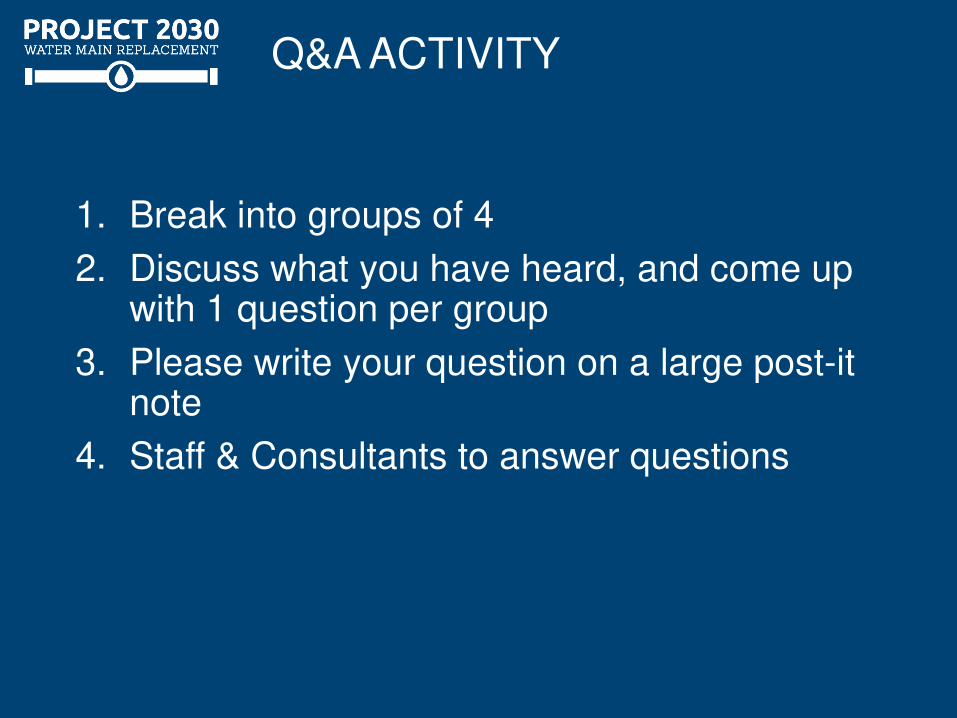
Q&A ACTIVITY
1. Break into groups of 4
2. Discuss what you have heard, and come up with 1 question per group
3. Please write your question on a large post-it note
4. Staff & Consultants to answer questions

BREAK
DISTRICT PIPELINE ASSET INVENTORY RESULTS
Age of the water system, various pipe
types, and where they’re located throughout the system
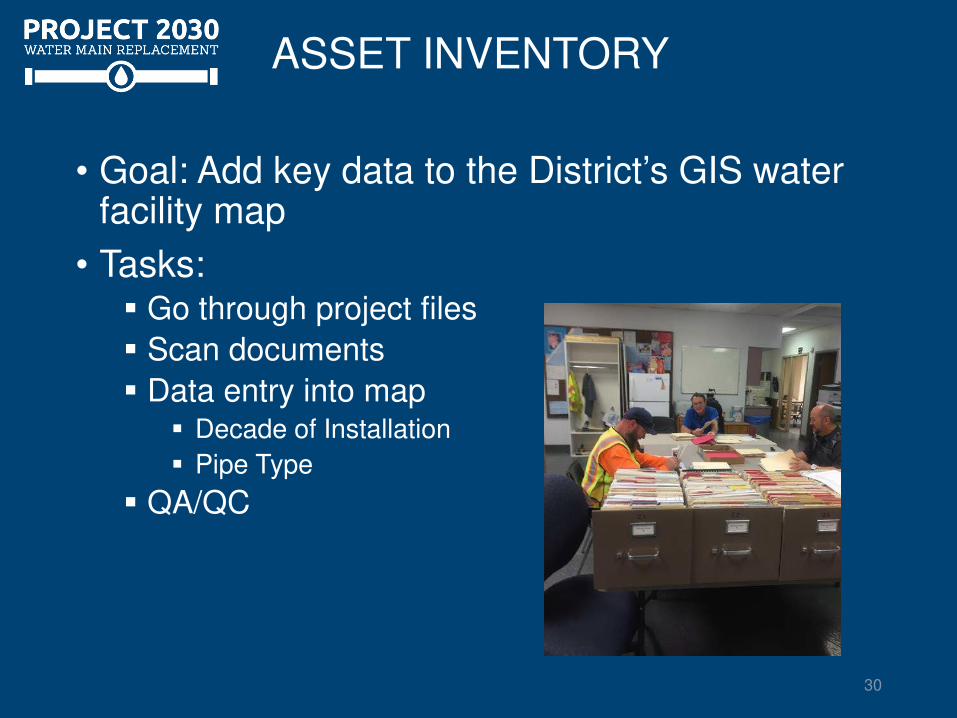
• Goal: Add key data to the District’s GIS water facility map
• Tasks: Go through project files
Scan documents
Data entry into map Decade of Installation
Pipe Type
QA/QC
ASSET INVENTORY
30
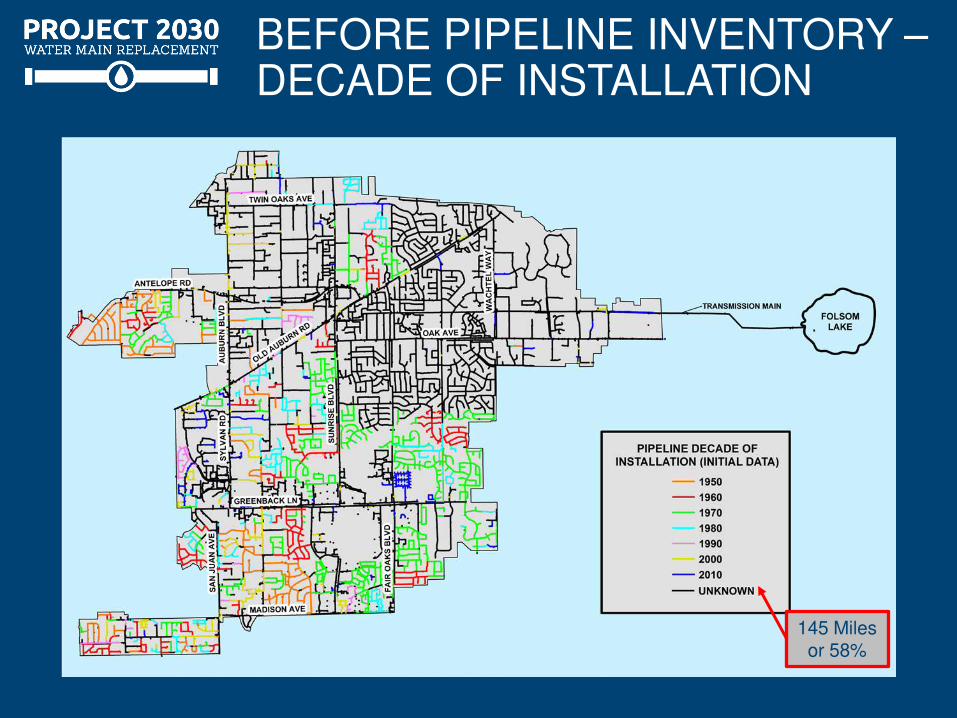
BEFORE PIPELINE INVENTORY – DECADE OF INSTALLATION
• Add Map and Table showing a before snapshot of our GIS Map
145 Miles or 58%

AFTER PIPELINE INVENTORY – DECADE OF INSTALLATION
14 Miles or 5%

AFTER PIPELINE INVENTORY – DECADE OF INSTALLATION
-
10
20
30
40
50
60
70
80
90
100
1950 1960 1970 1980 1990 2000 2010 UNKNOWN
Pipeline Inventory Decade of Installation
Miles of Pipeline
Percent of Pipeline
Legend
Year
Mile
s o
r P
erc
ent
Year
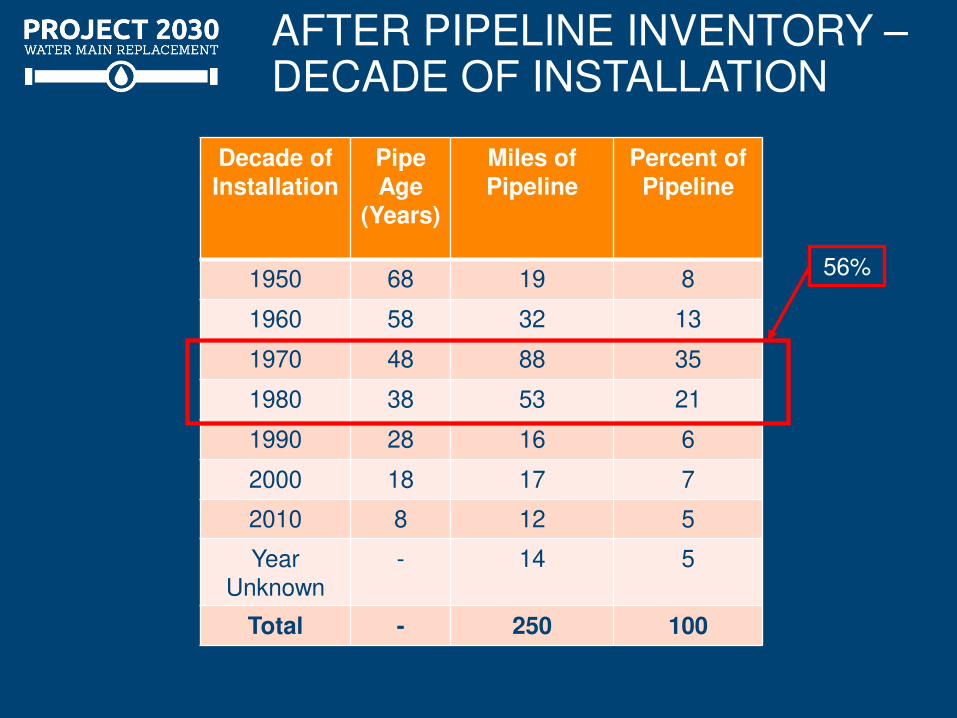
AFTER PIPELINE INVENTORY – DECADE OF INSTALLATION
Decade of Installation
Pipe Age
(Years)
Miles of Pipeline
Percent of Pipeline
1950 68 19 8
1960 58 32 13
1970 48 88 35
1980 38 53 21
1990 28 16 6
2000 18 17 7
2010 8 12 5
Year
Unknown
-
14 5
Total - 250 100
56%

BEFORE PIPELINE INVENTORY – PIPE TYPE
• Add Map and Table showing a before snapshot of our GIS Map
57 Miles or 23%
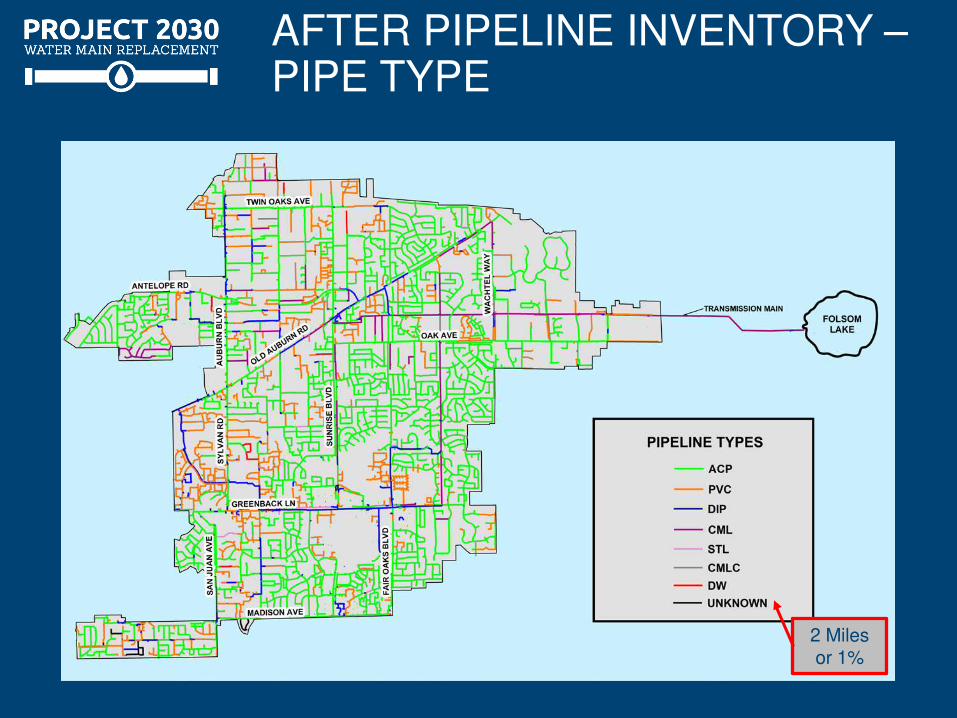
AFTER PIPELINE INVENTORY – PIPE TYPE
2 Miles or 1%
AFTER PIPELINE INVENTORY – PIPE TYPE
-
20
40
60
80
100
120
140
160
180
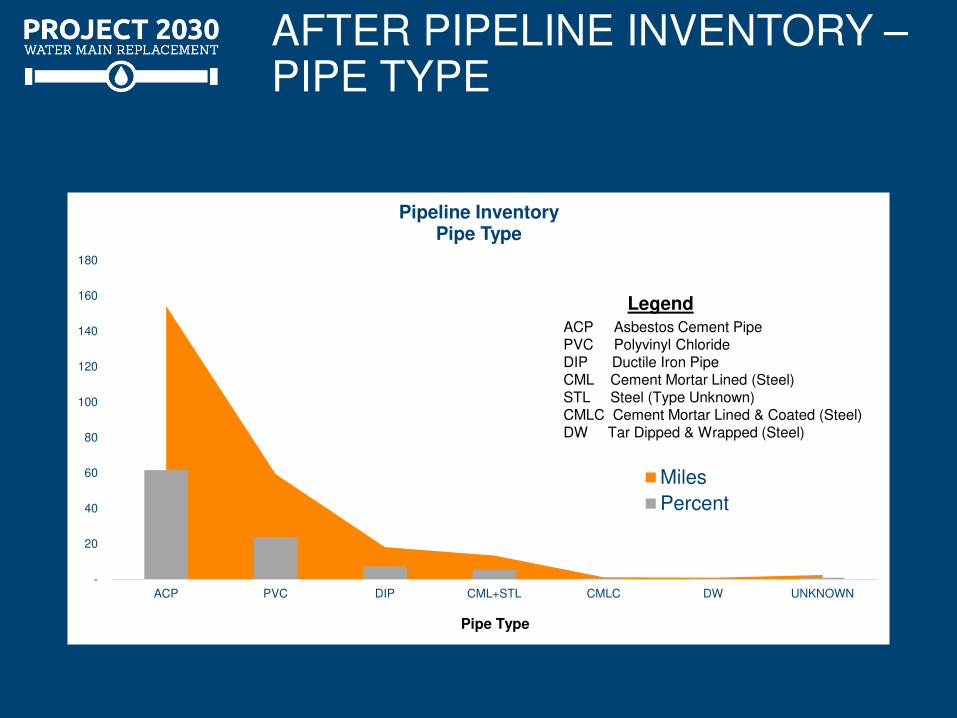
ACP PVC DIP CML+STL CMLC DW UNKNOWN
Pipeline Inventory Pipe Type
Miles
Percent
Legend ACP Asbestos Cement Pipe PVC Polyvinyl Chloride DIP Ductile Iron Pipe CML Cement Mortar Lined (Steel) STL Steel (Type Unknown) CMLC Cement Mortar Lined & Coated (Steel) DW Tar Dipped & Wrapped (Steel)
Pipe Type
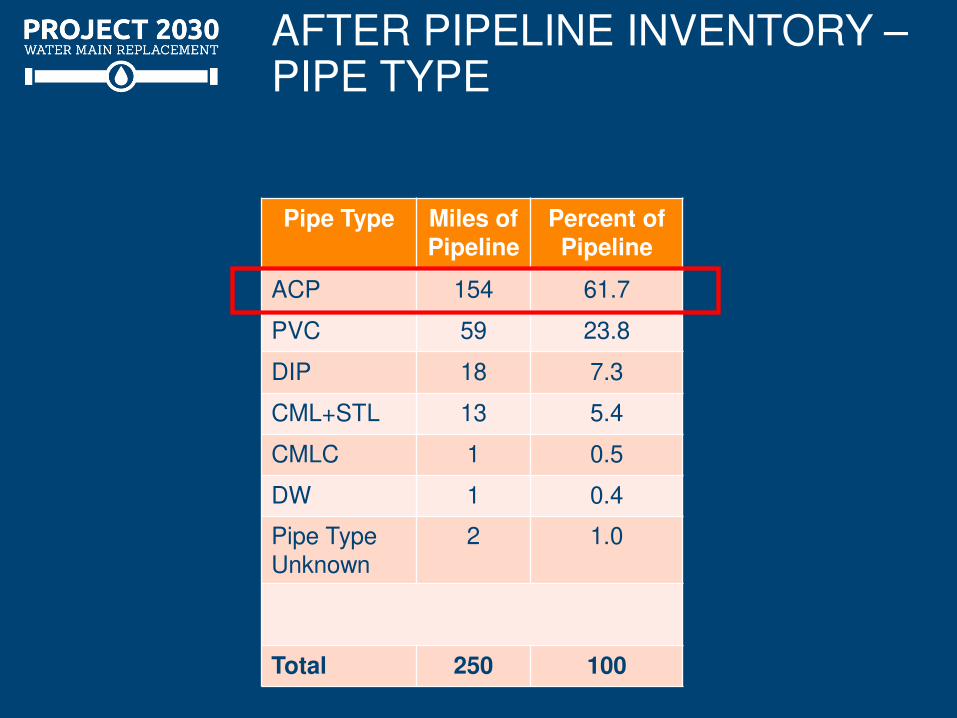
AFTER PIPELINE INVENTORY – PIPE TYPE
Pipe Type Miles of Pipeline
Percent of Pipeline
ACP 154 61.7
PVC 59 23.8
DIP 18 7.3
CML+STL 13 5.4
CMLC 1 0.5
DW 1 0.4
Pipe Type
Unknown
2 1.0
Total 250 100
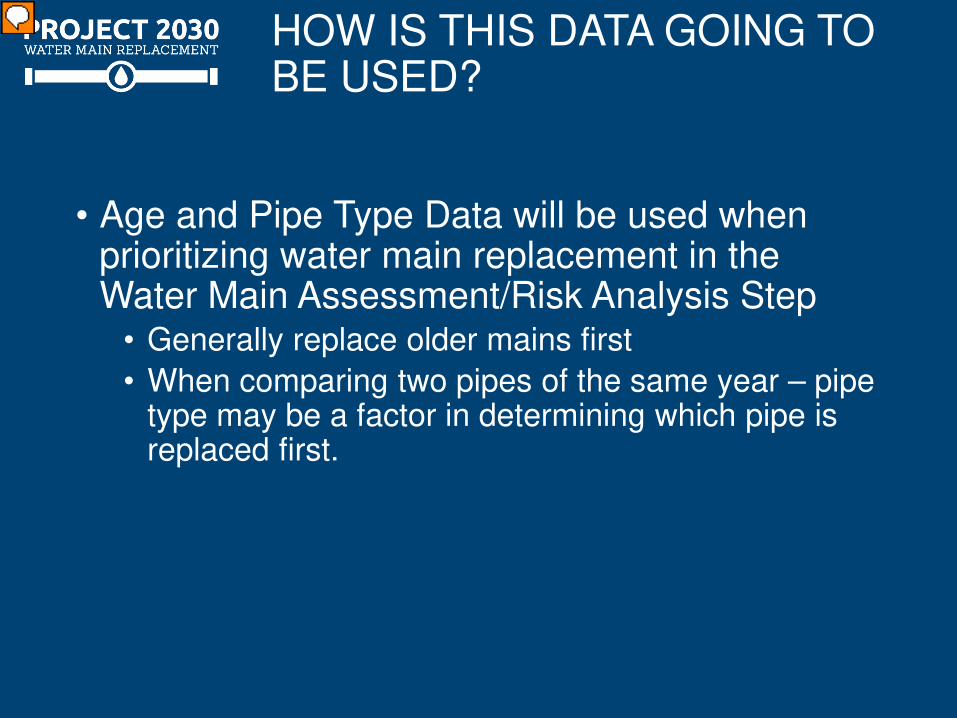
HOW IS THIS DATA GOING TO BE USED?
• Age and Pipe Type Data will be used when prioritizing water main replacement in the Water Main Assessment/Risk Analysis Step
• Generally replace older mains first
• When comparing two pipes of the same year – pipe type may be a factor in determining which pipe is replaced first.

QUESTIONS?

MAIN REPLACEMENT BASICS AND
BENCHMARKING
Major benchmarks to evaluate various options
MAIN REPLACEMENT BASICS
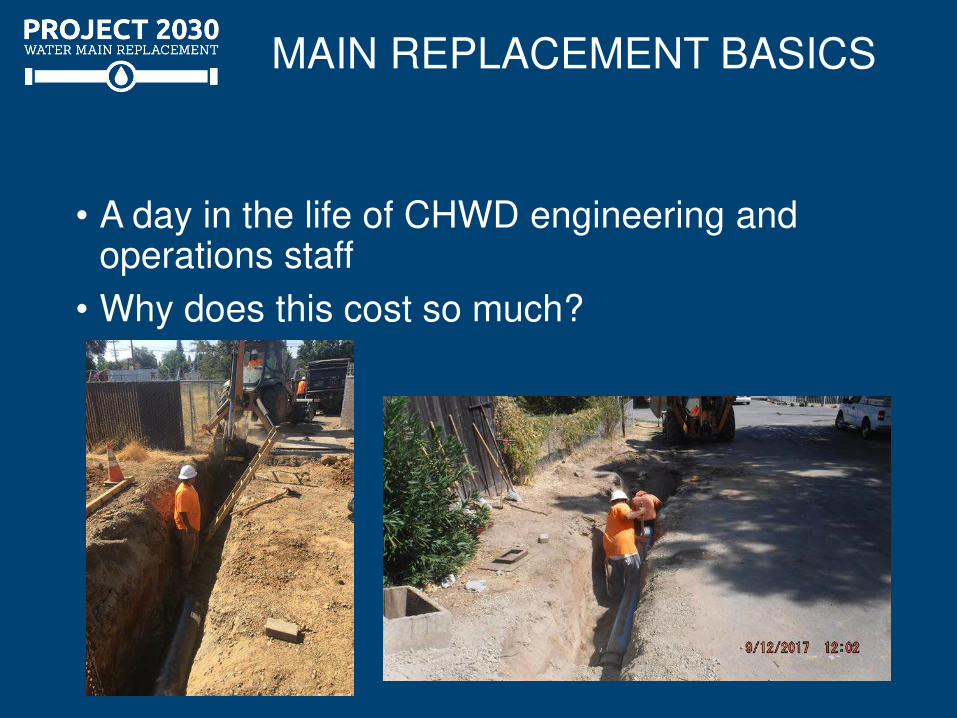
• A day in the life of CHWD engineering and operations staff
• Why does this cost so much?

A DAY IN THE LIFE OF…
• Operations • Ensure delivery and quality of supplied water • Schedule planned repairs / respond to unplanned
repairs • Exercise valves, flush hydrants and mains • Water quality sampling • Customer relations
• Engineering • Capital Improvement Plan implementation • Plan checking and inspections • GIS/mapping • Business relations
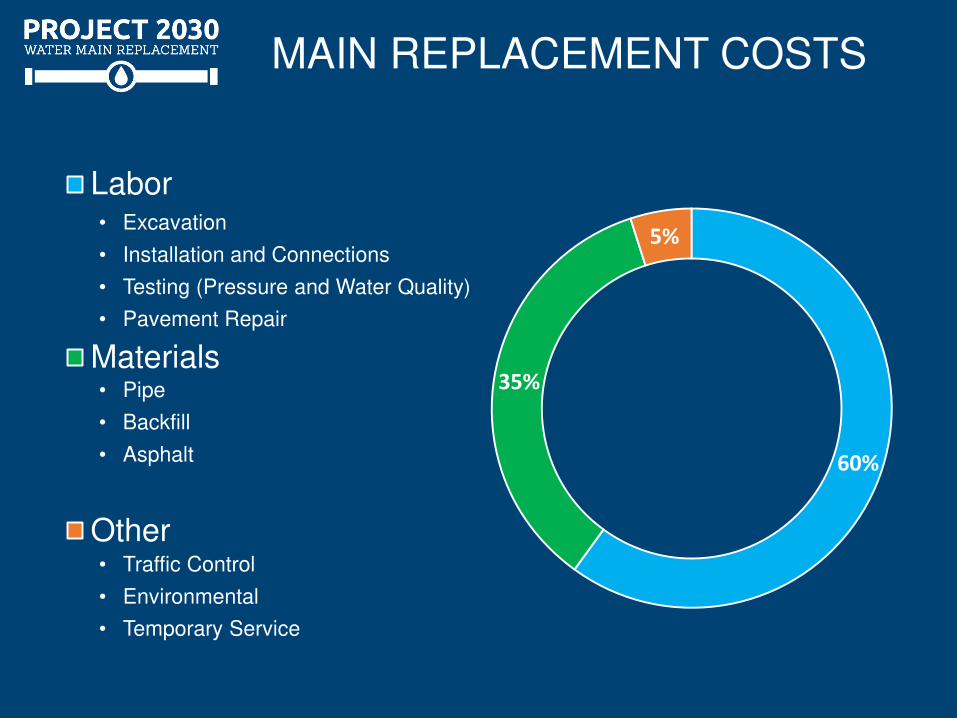
MAIN REPLACEMENT COSTS
60%
35%
5%
Labor
Materials
Other
• Excavation
• Installation and Connections
• Testing (Pressure and Water Quality)
• Pavement Repair
• Pipe
• Backfill
• Asphalt
• Traffic Control
• Environmental
• Temporary Service
WHAT IS BENCHMARKING?
• “A standard by which something can be measured or judged.”
• Track performance indicators
• Show whether goals are being met
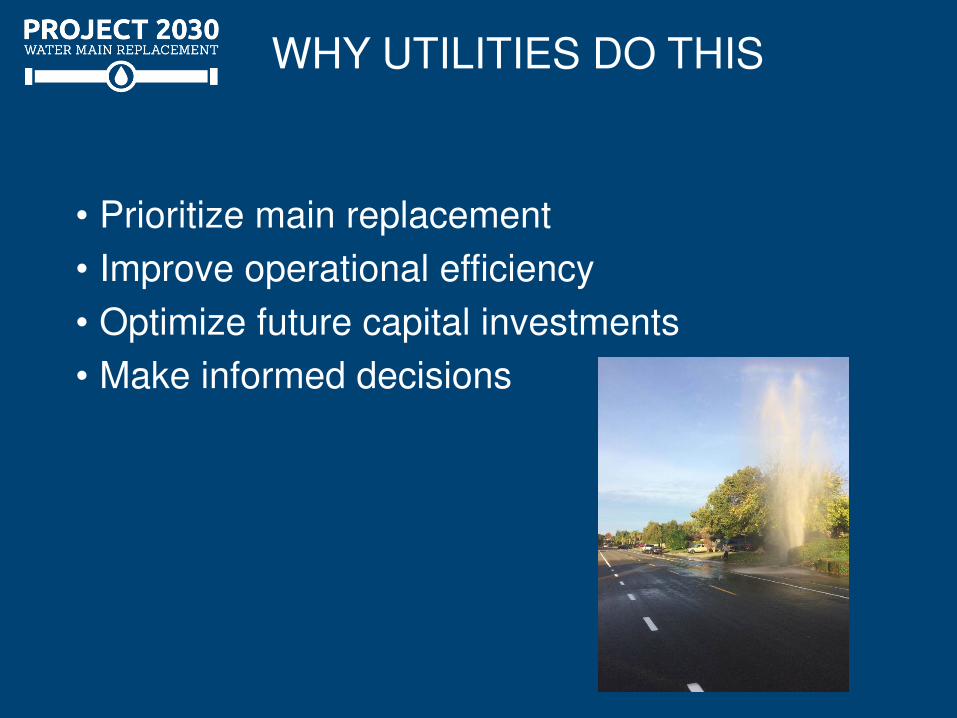
WHY UTILITIES DO THIS
• Prioritize main replacement
• Improve operational efficiency
• Optimize future capital investments
• Make informed decisions
BENCHMARKING STEPS
1. Identify Improvement Goals
2. Establish Benchmarks
3. Collect Data - goals need to be measurable
4. Track Progress and Identify Trends

48
PERFORMANCE VS. INVESTMENT
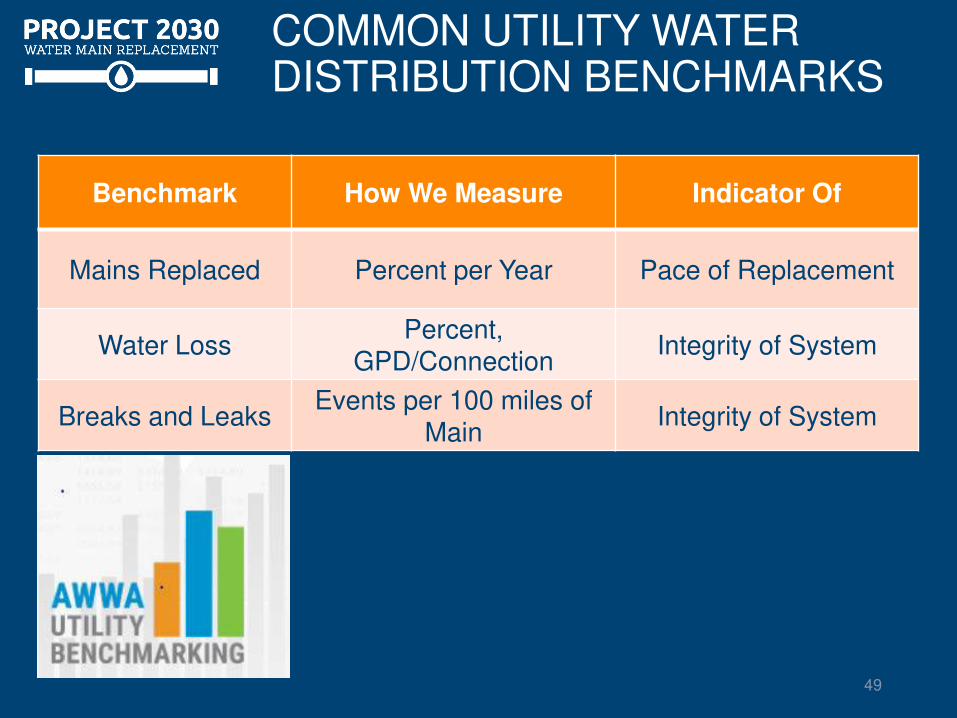
COMMON UTILITY WATER DISTRIBUTION BENCHMARKS
Benchmark How We Measure Indicator Of
Mains Replaced Percent per Year Pace of Replacement
Water Loss Percent,
GPD/Connection Integrity of System
Breaks and Leaks Events per 100 miles of
Main Integrity of System
49

CHWD MAIN REPLACEMENT BENCHMARK
0
0.5
1
1.5
2
2012 2013 2014 2015 2016
Perc
en
t / Y
ear
Year
Annual % 5 Yr Ave
1% Target 1.5% Target

WATER LOSS BENCHMARKS
Water Loss Benchmark
Units of Measure
AWWA Survey Median
(25th -75th %ile)
CHWD Performance
Real Losses per Service Connection
Gallons / day per connection
35.9 (29.5 – 48.3)
24.4
Leakage Index -- 1.9
(1.5 – 2.5) 1.2
51
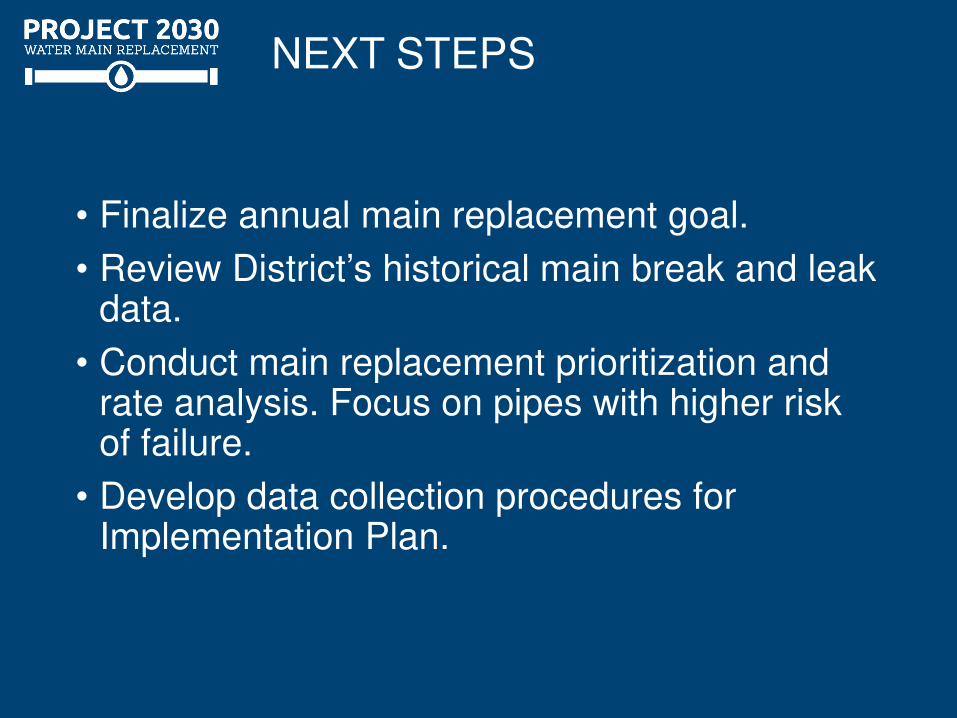
NEXT STEPS
• Finalize annual main replacement goal.
• Review District’s historical main break and leak data.
• Conduct main replacement prioritization and rate analysis. Focus on pipes with higher risk of failure.
• Develop data collection procedures for Implementation Plan.

QUESTIONS?

PUBLIC COMMENT
54

PUBLIC COMMENT
55
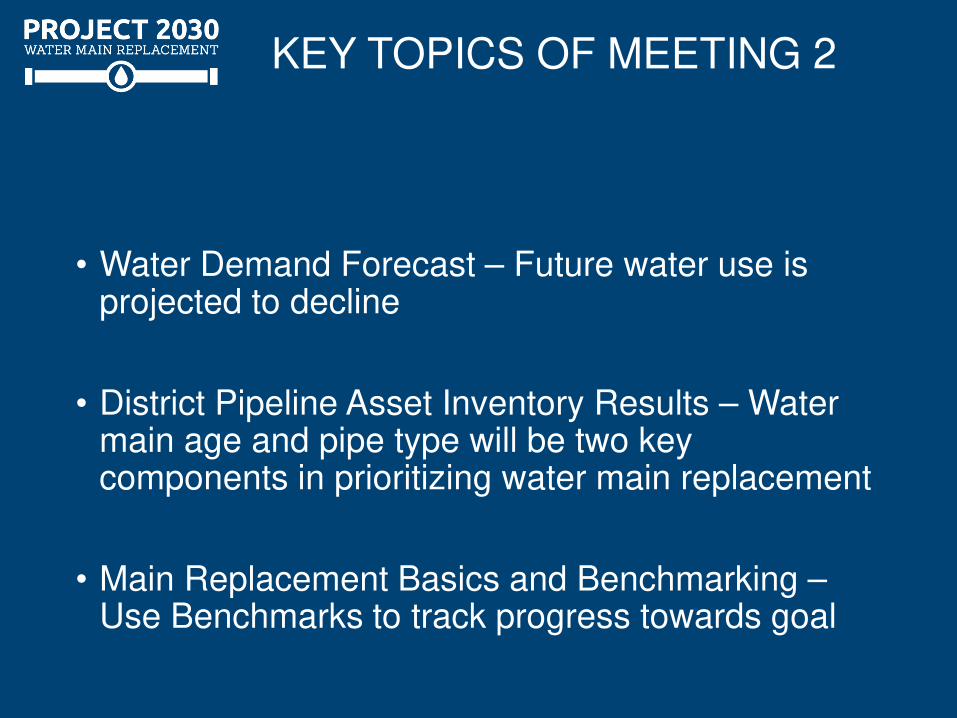
KEY TOPICS OF MEETING 2
• Water Demand Forecast – Future water use is projected to decline
• District Pipeline Asset Inventory Results – Water main age and pipe type will be two key components in prioritizing water main replacement
• Main Replacement Basics and Benchmarking – Use Benchmarks to track progress towards goal
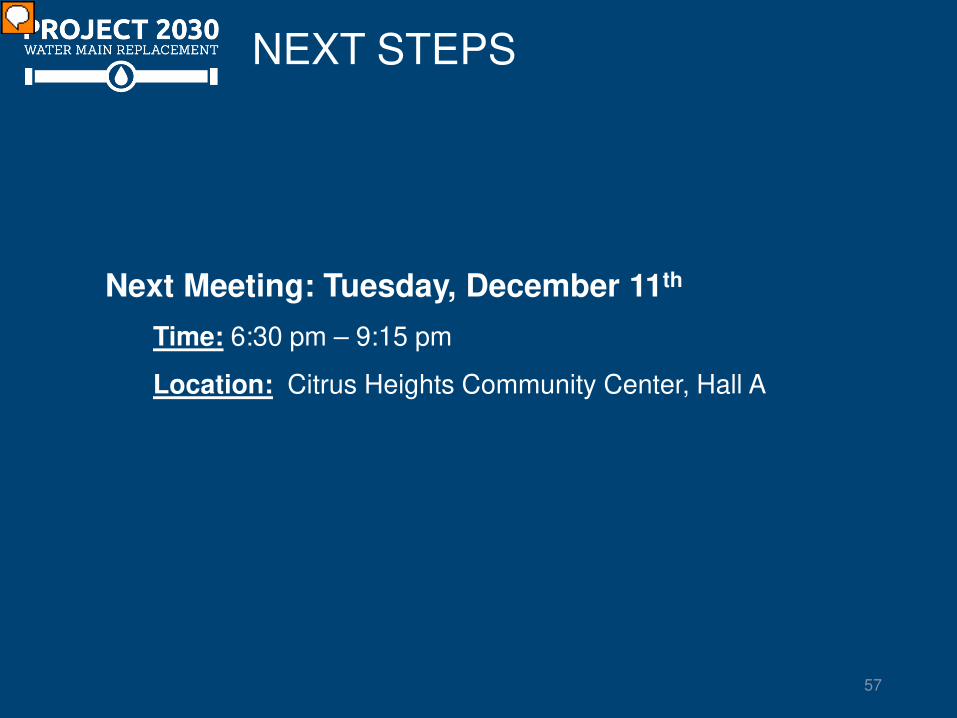
NEXT STEPS
• Next Meeting: Tuesday, December 11th
Time: 6:30 pm – 9:15 pm
Location: Citrus Heights Community Center, Hall A
57

PREVIEW OF CAC MEETING 3
58

VISIT THE CAC WEBPAGE chwd.org/customer-advisory-committee/

PARTICIPANT TAKE-AWAY’S
60

CLOSING
61