Embed Size (px)
Citation preview
Online power management with embedded optimization for a multi-source
hybrid with real time applications
Von der Fakultat fur Ingenieurwissenschaften,
Abteilung Maschinenbau und Verfahrenstechnik
der
Universitat Duisburg-Essen
zur Erlangung des akademischen Grades
einer
Doktorin der Ingenieurwissenschaften
Dr.-Ing.
genehmigte Dissertation
von
Bedatri Moulik
aus
Kalkutta, Indien
Gutachter: Univ.-Prof. Dr.-Ing. Dirk Soffker
Univ.-Prof. Dr.-Ing. Dirk Abel
Tag der mundlichen Prufung: 11. April 2016


IV
Acknowledgment
I would like to thank my supervisor Univ.-Prof. Dr.-Ing. Dirk Soffker for his constantsupport and valuable guidance which helped me achieve my goals. I also thank himfor giving me an opportunity to pursue my research in Germany. It is because ofthis chance that he gave me, I could develop my academic and professional skills. Iam grateful to him for helping me gain an insight on both scientific and as well ason other aspects of life.
I am also grateful to Univ.-Prof. Dr.-Ing. Dirk Abel for being the second supervisorfor my thesis. Without his keen scientific questions and helpful advice towards thethesis, I could not have improved my work.
I also wish to convey thanks to my committee members in the Chair of Dynamicsand Control at University of Duisburg-Essen for their both academical and personalsupport. It is these friends and co-workers both present and previous, who mademy stay in Germany so memorable.
Last but not the least, I would like to thank my parents who made all this possible,who stood by me whenever I needed them.
Duisburg, April 2016 Bedatri Moulik
I
Kurzfassung
Der Schwerpunkt dieser Arbeit beinhaltet die Entwicklung einer Power-Management-Optimierungsstrategie fur ein Drei-Quellen-Hybridfahrzeug. Diese Strategie berucksi-chtigt die Integration von optimierten Parametern, die eine dynamische Strombe-grenzung von Batterie und Brennstoffzelle umsetzen. Hierbei wird ein Superca-pacitor als dritte Stromquelle verwendet. Das Ziel ist die Entwicklung eine mod-ulare Struktur mit entkoppelten Online- und Offline-Teilen, so dass die Umset-zung bei realen Fahrzyklen moglich ist. Von der Literatur kann geschlossen wer-den, dass die Online Optimierung mehrerer Ziele eine Schwierigkeit darstellt. Einweiteres Problem ist die Anpassung einer optimierten Powermanagement Strategieauf reale Farzyklen. Die entwickelte Strategie/Methode verwendet online ein regel-basiertes Power management mit offline integriert optimierten Parametern. DieParameter werden in Bezug auf mehrere widerspuchliche Zeile optimiert, z.B. inBezug auf den maximalen Kraftstoffverbrauch im Widerspruch zur minimalen Ab-weichung des State-of-Charge. Durch eine geeignete Wahl der Parameter ist unterBerucksichtigung der Lastanforderung der Betrieb aller drei Quellen innerhalb dergewunschten Arbeitsbereiche moglich. Einem oder mehreren Optimierungszielenkann durch Variation der Gewichtungen der Ziele mehr Prioritat als anderen Zie-len zuordnet werden. Die Anwendung dieses Konzepts auf einen Brennstoffzellen-Batterie-Supercapacitor Hybrid wird in dieser Arbeit diskutiert. Eine detaillierteModellbildung aller Komponenten sowie Verifizierung und Plausibilitatsbewertungwird berucksichtigt/durchgefuhrt. Zum Zweck der experimentellen Validierung wer-den die eigentlichen Antriebskomponenten durch regelbare Stromquellen und -senkenersetzt, die die Dynamik der reellen Komponenten nachbilden. Schließlich wirdein Konzept zur Integration der entwickelten Powermanagement-Optimierung inreale Fahrszenarien vorgestellt. Zur Validierung/Verifikation wird eine Fahrsimu-latorumgebung mit dem experimentellen Hybrid-Elektrofahrzeug verbunden. MitHilfe eines erklarenden Beispiels werden die gewunschten optimalen Werte berech-net und dem menschlichen Fahrer uber eine geeignete Schnittstelle angezeigt.
II
Abstract
The focus of this thesis is to develop a suitable power management optimizationstrategy for a three-source hybrid vehicle powertrain. This strategy takes into ac-count the integration of optimized parameters that limit the battery and fuel cellcurrent by utilizing a third power source, namely supercapacitor. The goal is todevelop a modular structure with decoupled online and offline parts such that im-plementation in case of real driving conditions is feasible. Based on the literaturereview it can be concluded that providing optimal solutions in terms of multipleobjectives online is an issue. Adaption of optimized control strategy to real driv-ing data is another concern. The developed strategy employs an online rule-basedcontrol with embedded offline-optimized parameters. The parameters are optimizedwith respect to multiple and conflicting objectives such as fuel consumption andstate-of-charge deviation minimization. By a suitable selection of parameters, oper-ation of all three sources within desired working ranges is possible, keeping in mindthe load demand. By varying the weights between the objectives, one or more objec-tives can be given more priority than others. The application of this concept to fuelcell-battery-supercapacitor hybrid is discussed in this thesis. Detailed modeling ofall components along with verification and plausibility assessment is done. For thepurpose of experimental validation, the real powertrain components are replaced bycontrollable power sources and sinks that emulate the dynamics of real components.Finally, a brief concept is presented to integrate the developed power managementoptimization in real driving scenarios. For validation/verification purposes, a driv-ing simulator environment is connected to the experimental hybrid electric vehicleset-up and with the help of an illustrative example, the desired predicted optimalvalues are calculated online and displayed to the human driver by a suitable in-terface. The absence of online tuning of controller parameters in this example iscounteracted by developing a concept based on literature. With the help of thisconcept, the adaption of the power management control concept, developed in thisthesis, can be realized.
III
Contents
List of Figures VI
Nomenclature VIII
1 Introduction 2
1.1 Hybrid powertrains: applications and scope . . . . . . . . . . . . . . 2
1.2 Contribution of the thesis . . . . . . . . . . . . . . . . . . . . . . . . 3
2 Literature review 4
2.1 Introduction . . . . . . . . . . . . . . . . . . . . . . . . . . . . . . . . 4
2.2 Rule-based power management and optimization . . . . . . . . . . . . 8
2.3 Power management optimization with battery lifetime management . 11
2.4 Power management optimization with unknown velocity input . . . . 12
2.5 Need for a Generalized Optimal Rule-Based Control . . . . . . . . . . 14
2.6 Conclusions . . . . . . . . . . . . . . . . . . . . . . . . . . . . . . . . 15
3 Hybrid vehicle: Components and configurations 16
3.1 Types of modeling . . . . . . . . . . . . . . . . . . . . . . . . . . . . 16
3.1.1 Forward-backward modeling . . . . . . . . . . . . . . . . . . . 16
3.1.2 Quasistatic-dynamic modeling . . . . . . . . . . . . . . . . . . 17
3.2 Possible topologies and considered configuration . . . . . . . . . . . . 18
3.3 Modeling and plausibility assessment of components . . . . . . . . . . 20
3.3.1 Drive cycles . . . . . . . . . . . . . . . . . . . . . . . . . . . . 20
3.3.2 Backward/quasi-static models . . . . . . . . . . . . . . . . . . 21
3.3.3 Fuel cell . . . . . . . . . . . . . . . . . . . . . . . . . . . . . . 25
3.3.4 Battery . . . . . . . . . . . . . . . . . . . . . . . . . . . . . . 27
3.3.5 Supercapacitor . . . . . . . . . . . . . . . . . . . . . . . . . . 30
3.3.6 DC/DC converter . . . . . . . . . . . . . . . . . . . . . . . . . 33
3.3.7 Theoretical sizing of components . . . . . . . . . . . . . . . . 36
3.3.8 Model verification based on literature . . . . . . . . . . . . . . 39
3.3.9 Comparison of simulated powertrain dynamics with simplifiedand complex DC/DC converter models . . . . . . . . . . . . . 42
3.4 Emulation of powertrain components . . . . . . . . . . . . . . . . . . 43
3.4.1 Powertrain configuration with emulated components . . . . . . 45
3.4.2 Comparison of simulation and emulation results . . . . . . . . 46
IV Contents
4 Power management and optimization 49
4.1 Introduction . . . . . . . . . . . . . . . . . . . . . . . . . . . . . . . . 49
4.1.1 Classification and comparison of power management strategies 49
4.1.2 Concept of power management with embedded optimization . 51
4.2 Details of supervisory controller . . . . . . . . . . . . . . . . . . . . . 53
4.2.1 Mode selection block . . . . . . . . . . . . . . . . . . . . . . . 54
4.2.2 Look-up tables LUT block . . . . . . . . . . . . . . . . . . . . 54
4.2.3 PM controller block . . . . . . . . . . . . . . . . . . . . . . . . 56
4.2.4 Simulation results and discussion . . . . . . . . . . . . . . . . 58
4.3 Optimization as a decoupled process . . . . . . . . . . . . . . . . . . 60
4.3.1 Optimization goals and constraints . . . . . . . . . . . . . . . 62
4.3.2 Simulation results and discussion . . . . . . . . . . . . . . . . 63
4.4 Experimental results and discussion . . . . . . . . . . . . . . . . . . . 69
5 Scope of developed rule-based power management controller 72
5.0.1 Illustrative example: drive cycle prediction and optimization . 73
5.1 Adaptive power management for dynamic/variable driving behavior . 81
5.1.1 Driving condition recognition . . . . . . . . . . . . . . . . . . 82
5.1.2 Modified concept . . . . . . . . . . . . . . . . . . . . . . . . . 86
6 Summary, Conclusion, and Outlook 89
6.1 Conclusion . . . . . . . . . . . . . . . . . . . . . . . . . . . . . . . . . 89
6.2 Contributions . . . . . . . . . . . . . . . . . . . . . . . . . . . . . . . 90
6.3 Outlook . . . . . . . . . . . . . . . . . . . . . . . . . . . . . . . . . . 90
Bibliography 92

V
VI List of Figures
List of Figures
2.1 Rule-based controller for mode selection [TGGL14][MS15b]] 10
2.2 Optimization of battery charge patterns [BMFF11][MS15b] 12
2.3 Driving pattern recognition and control [LJPML04][MS15b] 14
3.1 Typical topologies in ICE-based powertrains 19
3.2 Typical topologies in electrical powertrains 19
3.3 Chosen configuration for HEV 20
3.4 New European Drive Cycle (NEDC) 21
3.5 Representation of motor/generator 22
3.6 Circuit diagram of motor model 23
3.7 Power demand for NEDC drive cycle 25
3.8 Look-up table for V-I characteristics 26
3.9 Look-up table for power-efficiency characteristics 26
3.10 Circuit diagram of battery model 28
3.11 Relation between SoC and voltage 28
3.12 Circuit diagram of supercapacitor model 29
3.13 Relationship between capacitance and voltage 30
3.14 Circuit diagram of DC/DC converter 31
3.15 Average fuel cell power 35
3.16 Battery voltage variation during charging and discharging 37
3.17 Battery SoC and energy during charging 38
3.18 Capacitor voltage during charging and discharging 38
3.19 Bus voltage during charging and discharging 39
3.20 Source current during charging and discharging 40
3.21 Comparison of battery current for both models 41
3.22 Comparison of fuel cell current for both models 41
3.23 Comparison of supercapacitor current for both models 42
3.24 Comparison of SoC for both models 42
3.25 Emulation experimental set-up 44
3.26 Emulation hardware configuration 44
3.27 Emulation of motor/generator behavior 45
3.28 Simulated and emulated load current 45
4.1 Classification of power management strategies 47
VII
4.2 Power management optimization concept [MS16a] 49
4.3 Details of mode selection block 52
4.4 Details of look-up table block 53
4.5 Details of PM controller block 5
4.6 Working of PM controller block 55
4.7 Power demand and actual power 56
4.8 Power from the three sources 57
4.9 Variation between t=670s-770s 57
4.10 Bus voltage 57
4.11 NSGA II and model interaction [MKS13] 57
4.12 Objective function convergence for a) Reference supercapacitor b)Double of reference supercapacitor c) Half of reference supercapacitord) One-fourth of reference supercapacitor [MS16a]
61
4.13 Confliction of objectives [MS16a] 62
4.14 Effect of optimization parameters at different supercapacitor sizes(Simulated) [MS16a]
65
4.15 Effect of varying priorities between optimization goals (Simulated)[MS16a]
66
4.16 Comparison of all results in terms of energy consumption 67
4.17 a) Simulated source and load current b) Emulated batttery and su-percapacitor current c) Emulated load current [MS16a]
68
5.1 Optimization concept for HEV-driving simulator coupling [MS16b] 71
5.2 Topology of HEV powertrain according to [OWMS13] 73
5.3 Displaying optimal velocity to the human driver [MWS15] 75
5.4 Displaying SOCs and velocity change suggestion to the human driver[MWS15]
75
5.5 Actual velocity and SoC variations [MWS15] 76
5.6 Actual and predicted velocities 77
5.7 Velocities between 25-60 s zoomed [MWS15] 77
5.8 Velocities between 90-130 s zoomed [MWS15] 77
5.9 Predicted velocity and SoC variations [MWS15] 78
5.10 Predicted and actual SoCs [MWS15] 78
5.11 State-of-Charge variations zoomed [MWS15] 79
5.12 Implementation possibilities of adaptive control (according to[FYR+14]) [MS16b]
80
5.13 Driving condition recognition [MS16b] 81
5.14 Creation of representative drive patterns (according to [LJPML04])[MS16b]
82
5.15 Driving condition recognition (modified from [LJPML04]) [MS16b] 85
VIII Nomenclature
Nomenclature
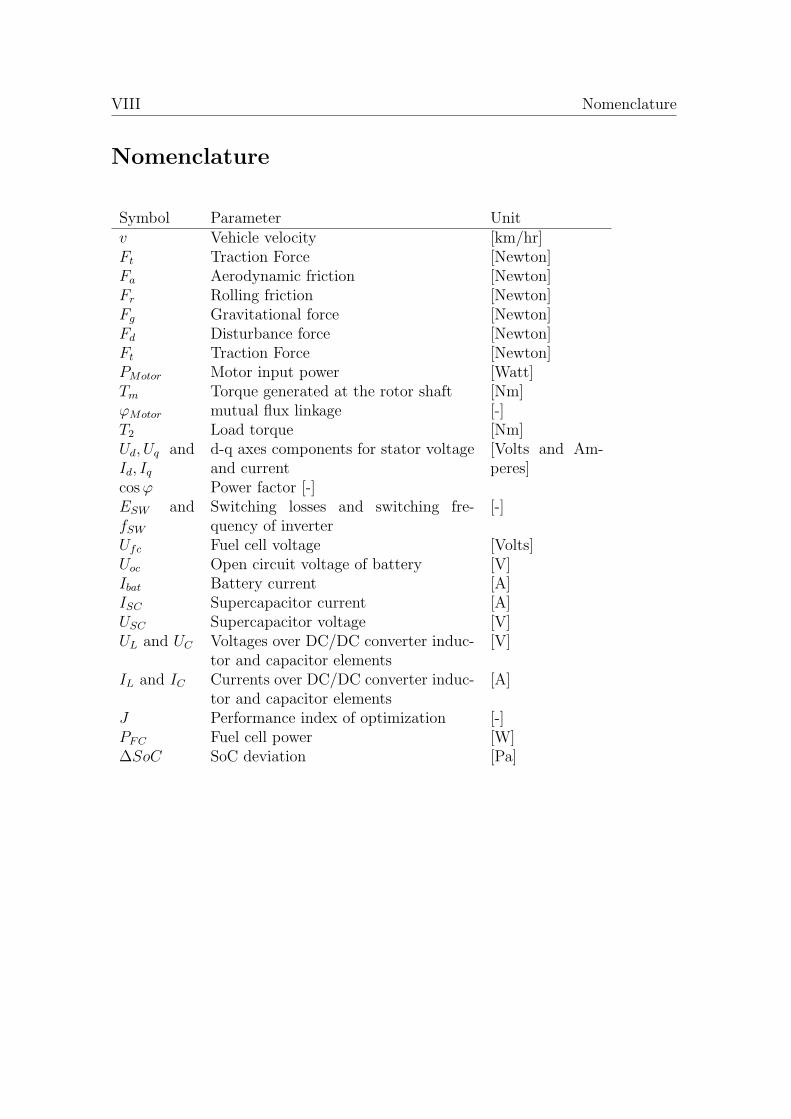
Symbol Parameter Unitv Vehicle velocity [km/hr]Ft Traction Force [Newton]Fa Aerodynamic friction [Newton]Fr Rolling friction [Newton]Fg Gravitational force [Newton]Fd Disturbance force [Newton]Ft Traction Force [Newton]PMotor Motor input power [Watt]Tm Torque generated at the rotor shaft [Nm]ϕMotor mutual flux linkage [-]T2 Load torque [Nm]Ud, Uq andId, Iq
d-q axes components for stator voltageand current
[Volts and Am-peres]
cosϕ Power factor [-]ESW andfSW
Switching losses and switching fre-quency of inverter
[-]
Ufc Fuel cell voltage [Volts]Uoc Open circuit voltage of battery [V]Ibat Battery current [A]ISC Supercapacitor current [A]USC Supercapacitor voltage [V]UL and UC Voltages over DC/DC converter induc-
tor and capacitor elements[V]
IL and IC Currents over DC/DC converter induc-tor and capacitor elements
[A]
J Performance index of optimization [-]PFC Fuel cell power [W]∆SoC SoC deviation [Pa]

Nomenclature 1
Abbreviations
EV Electric VehicleHEV Hybrid Electric VehicleICE Internal Combustion EngineFCEV Fuel Cell Electric VehicleESS Energy Storage SystemsDP Dynamic ProgrammingGA Genetic algorithmECMS Equivalent Consumption Minimization StrategyNSGA II Non-dominated Sorting Genetic Algorithm IISoC State of ChargeLUT Look-Up TableNEDC New European Drive CycleHiL Hardware-in-the-LoopPM Power Management
2
1 Introduction
The increasing problems of environmental pollution and fast depletion of fossil fuelreserves is a global issue that requires immediate attention. The transportationsector being one of the major consumers of fossil fuels and producers of pollutantsand greenhouse gases, makes a thorough retrospect of the existing technologies im-portant. A radical solution to lower fuel consumption and emissions is an alterna-tive powertrain, of which continuously variable transmission (CVT), electric vehicle(EV), fuel cell electric vehicle (FCEV), hybrid electric vehicle (HEV), and advancedpower net control are mentioned in [KKDJ+05]. A hybrid electric vehicle generallycombines two or more power sources such as an internal combustion engine (ICE),generator/motor or both, and a storage element such as a battery. An all-electricvehicle can be a battery electric vehicle (BEV) or a FCEV. A comparison of thecharacteristics of BEVs, HEVs, and FCEVs is given in [BGT10]. In this work, aFCEV is considered with two storage elements: battery and supercapacitor and isnamed as a multi-source HEV. The problem of controlling the power flows and otherparameters between different power sources such that desired behavior is achievedis considered as power management problem. Desired behavior in [KKDJ+05] is ex-pressed in terms of fuel consumption, emissions, component wear, and comfort withoperating points and storage levels of components within bounds. In this work, asuitable power management optimization strategy is developed for the consideredhybrid powertrain configuration. This newly developed concept of power manage-ment optimization addresses some of the open issues of existing methods namely,integration of multiple objectives of power management in online, real-time controlof hybrid powertrains. Adaption of the power management control strategy to realdriving behavior is another issue which is considered in this work.
1.1 Hybrid powertrains: applications and scope
The history of hybrid electric vehicles dates back to the 1900s when the first hybridvehicle was developed by Ferdinand Porsche in 1901 [Wik15]. Their popularity in-creased with the release of Toyota Prius in 1997 followed by Honda Insight in 1999[Wik15]. The more recent releases include Ford C-Max Hybrid, Toyota Prius C,Honda Accord, BMW i8, Porsche Panamera E-Hybrid, etc. in 2015. The technolog-ical innovations at the automobile industries are progressing at a fast pace. Toyotaproposes the use of electric motor powered by batteries at start-up to give a smoothstart, battery’s stored energy to run the car at low speed ranges, engine as the pri-mary source with energy-efficiency driving capacity [Glo15b]. It also boasts of thenew fuel cell car: Mirai [Glo15a]. Mercedes-Benz has also launched passenger carsand city buses based on fuel cell technology [Dai15]. Keeping the industrial demandsin mind, the research on hybrid vehicle technology has also escalated in the past
1.2 Contribution of the thesis 3
few years. Use of different alternative sources of energy are being considered alongwith power management strategies to ensure desired operation. However, one of themajor challenges faced by the ongoing research of hybrid powertrains is to developreal-time implementable power management that can provide solutions in unknowndriving situations.
1.2 Contribution of the thesis
In this thesis, an optimal power management strategy is developed which is basedon rules. The strategy is online implementable and is capable of providing in-tantaneous optimal solutions based on multiple objectives. The strategy is im-plemented on a multi-source hybrid electric vehicle model, subject to a particu-lar drive cycle. The application of the developed strategy in case the drive cy-cle is not given is also discussed. Parts of this thesis are published/submitted asjournal papers [MS16a],[MS16b],[MS15b] and presented in international conferences[MS15a],[MWS15],[MS14],[MKS13].
In chapter 2 [MS15b], a review of previous works is presented with focus on rule-based power management, its optimization methods, and its applications in real-timesystems. The alternatives of rule-based power management is also discussed. Theadvantages of combining storage elements commonly used in HEVs is given withrelevance to the chosen power management optimization strategy.
In chapter 3 , the configurations and modeling options in hybrid powertrains isdiscussed and the reasons for choosing the considered topology is emphasized. Thenthe detailed dynamical modeling of each component of the considered HEV is givenfollowed by a plausibility check where the behavior of each component is verifiedwith literature. Finally, a simplified version of the detailed dynamical model ispresented and compared.
In chapter 4 [MS16b], first a classification and comparison of different power man-agement strategies is given followed by the concept of the developed strategy. Next,each part of the power management control module is described followed by theworking of the controller. Next, the optimization of the controller parameters as adecoupled process is detailed emphasizing, the presence of multiple and conflictinggoals and therefore, the choice of an appropriate algorithm. Both simulation andemulation results for the optimized control strategy is presented.
In chapter 5 [MS16a], an application of the proposed power management optimiza-tion concept is given. An adaption/modification of the developed strategy to workwith real driver velocities is given based on concepts from literature. For the purposeof validation/verfication, an example is presented by using a driving simulator-hybridvehicle coupled experimental set-up.
In the last chapter a conclusion and summary of the thesis is given.
4
2 Literature review
2.1 Introduction
This chapter is published in the form of a scientific paper [MS15b]. For the pastseveral years, hybrid electric vehicles (HEVs) have mostly implied two power sourceswith power management approaches responsible for distributing power betweenthese two sources. However, the presence of multiple power sources with a suitablepower distribution between components makes further reduction in fuel consump-tion possible. In hybrid powertrains, two different sources of power are considered.As an example, in [KL10], the drivetrain output mechanically driven by an internalcombustion engine (ICE) is supplemented by an electric motor. However, due to thegrowing trend of all-electric powertrains [BGT10], the efficiency assessment of suchpowertrains becomes important. According to [KL10], the efficiency of all-electrichybrid vehicles depends on the capability of the energy storage systems (ESSs),where batteries and supercapacitors are considered as the most common options forvehicular ESSs. As stated in [KL10], a hybrid drive composed of batteries, super-capacitors and fuel cells could be considered as an appropriate option for advancedhybrid vehicular drives. According to [AK12], Li-ion batteries possess high energydensity, but have relatively poor power density, whereas supercapacitors possesshigh power density, but lower energy density, along with high charging/dischargingefficiency compared to batteries. As a result, hybridization of Li-ion batteries andsupercapacitors is considered in [AK12] to lead to a high performance storage unit.According to [AK12], the desired operation is when a nearly constant load currentis supplied by the battery. This reduces its I2R losses and prevents terminal voltagedrops. The dynamic current with zero average is supplied by the supercapacitorin order to match the battery to the load. A fuel cell-battery-supercapacitor com-bination was also chosen in [PDRL07], stating the advantage of this combination.The advantage of the battery-supercapacitor combination has also been stated in[KBK10], where the constraint for the control strategy was to remain charge deplet-ing. Due to the battery-supercapacitor combination, the supercapacitor can takeover more dynamic power fluctuations, while the battery takes a low pass filtered pro-file. According to [KBK10], this can extend the battery life. The advantage of fuelthe cell-battery-supercapacitor combination has also been discussed in [LCL+12],where fuzzy logic control was used to design energy management strategy for thehybrid powertrain. Along with primary energy sources (such as fuel cells) and ESSs,DC/DC converters are also integral parts of HEVs. The current flow into the DC buscan be controlled with the help of DC/DC converters. The power split ratio betweenthe battery and the fuel cell is obtained by sending the fuel cell net current requiredto the DC/DC converter. In [BMFF07], a supervisory controller is considered alongwith a combined power management and design optimization for a fuel cell hybridvehicle. This controller sends the current request to DC/DC converters. Here,
2.1 Introduction 5
the aim was to minimize the fuel consumption by maintaining the battery State ofCharge (SoC). by sending the appropriate current request command to the DC/DCconverter. The DC/DC converter, which plays a central role in power management,has also been considered in [NGK10] with fuel cell hybrids. However, an integrationof three DC/DC converters for all three sources in a fuel cell-battery-supercapacitorpowertrain, with at least two bi-directional DC/DC converters, provides more de-grees of freedom, as detailed in [AK12, CE12]. Power management with DC/DCconverter control can be realized with real hardware components, of which emulatorhardware [GBS+09] has been considered as a less expensive and more compact sub-stitute for complex real hardware. The emulator test-rig developed and implementedin [OWMS13] is capable of accurately replicating the vehicle dynamics and can alsobe used for validating power flow algorithms. This was extended and modified toemulate an entire hybrid powertrain in [MS14].
An important criteria in HEV design is to achieve an efficient conversion of energyon the powertrain [BGT10], where the effectiveness of the results can be checkedwith standard drive cycles. In order to achieve this purpose, in [BGT10], the needto design a suitable controller and control strategies is emphasized. Therefore, thecontrol strategies can satisfy a number of goals, such as maximum fuel economy, gooddriving performance, etc. Amongst these power management control strategies, theeffectiveness of rule-based power management in real-time supervisory control hasbeen stated in [Sal07]. According to [Sal07], under rule-based power management,deterministic rule-based power management, as an easy to realize method, relies onheuristics to design rules that are generally implemented via look-up tables. Anadaptive rule-based power management for optimization of both energy use andemissions is also mentioned. In the case of hybrid vehicles, which involve multi-variables and/or multi-objectives, rules that cover all important trade-offs amongdifferent optimization objectives are difficult to design, and therefore, in [LFL+04],dynamic programming (DP) is used to understand the deficiency of rules and toserve as a reference to construct improved rules in terms of a fuel economy-emissionsoptimization problem. In [MPP13], a two-mode, low and high level controller designis considered, which is subjected to an offline control variables’ optimization in termsof fuel consumption minimization. Similarly, in [TGGL14], a rule-based energymanagement controller was developed that includes off-line calculation relative tothe optimization problem. State-of-charge was the key variable that determined theselection between modes. Some of the earliest works in rule-based control include[JKS97], where optimal energy management deals with power split in series hybridelectric vehicles. A sub-categorization of rule-based control is considered in [BGT10].
Apart from online rule-based power management techniques, various offline opti-mization algorithms are also available, such as DP [BGR00, BLGP09, PBMG06] andGA [PIGV01, JDW09]. These methods are capable of producing globally-optimalsolutions, and some more sophisticated ones, such as the Non-dominated SortingGenetic Algorithm II (NSGA II) [DPAM02], are also capable of tackling multiple
6 Chapter 2. Literature review
and conflicting objectives, such as the problem of fuel consumption and emissionsminimization in [ZCMM09], fuel consumption and component sizing in [BLM+10]and fuel cost and battery health degradation minimization in [BMFF11]. The othercategory of power management optimization techniques includes those that can beimplemented in real-time, such as [PRS05], where along with a real-time controller,two optimization goals of fuel consumption and battery SoC deviation minimiza-tion were considered. Model predictive control (MPC) has also been widely usedfor real-time control. For instance, in [KMS09], a non-linear MPC was consideredto carry out the task of fuel efficiency maximization with battery SoC, vehicle rela-tive position and performance as constraints. Equivalent consumption minimizationstrategies (ECMS) [PDG+02, GS07], on the other hand, are instantaneous powermanagement strategies that can be implemented online, offline, as well as in realtime. A detailed classification of power management optimization methods hasbeen given in [KS14]. An interesting procedure to evaluate the performance of on-line power management strategies in terms of fuel consumption and computationalcost was carried out in [SSD+14]. Here, nine participating teams were provided witha hybrid vehicle model. Each of the power management solutions presented by par-ticipants were tested for two realistic driving cycles not known to the participants.The comparison results were obtained for rule-based vs. ECMS. The best solutionobtained was compared with global, offline optimization.
The non-optimality resulting from conventional rule-based power management withrespect to off-line techniques [KS14] leads to the consideration of improvement meth-ods in [MF08]. Here, a parameter optimization using genetic algorithms (GA) wasconsidered to determine the optimal control variables for fixed parameters. Usingthis as the baseline, an equivalent consumption management strategy (ECMS) todynamically control the controller parameters and a route-based strategy to dynam-ically control the parameters for current and predicted future routes were developed.The combination of rule-based control strategies with optimal power managementstrategies has also been considered in [SRA11]. Here, the performance of the rule-based strategy was assessed by comparing with GA, and the suitability of using GAwas established by comparing with dynamic programming (DP). Additionally, powerdelivered by primary source and SoC deviation are defined as functions of tractionpower. These functional dependencies were integrated as look-up tables (LUTs) foran online implementation. The values in the LUT were defined by optimizing interms of fuel efficiency. Battery SoC was taken as the state variable. Similarly,rule-based strategies were also considered in combination with ECMS, where op-timization is carried out offline with DP in [HS07] and with more sophisticatedmulti-objective techniques, such as NSGA II in [BLM+10].
Optimization in HEVs often involves multi-objectives [LFL+04], and for a multi-objective optimization problem where the objectives are conflicting, multi-objectivegenetic algorithms are considered suitable [BLM+10], as they search for a Paretooptimal set. In [BLM+10], the two conflicting objectives of fuel consumption min-
2.1 Introduction 7
imization and sizing were considered. When the configuration was evaluated, theparameters of the control strategy were optimized, whereas while evaluating thecontrol strategy, it was manually tuned for minimum fuel consumption for one com-bination of drivetrain components. In [PDRL07], on the other hand, the best hybridvehicle configuration and control strategy to reduce fuel consumption were identifiedat first. The control strategy was comprised of a set of rules based on both requiredpower and battery and supercapacitor SoCs. Optimization goals included findingparameters that minimized fuel consumption and sustained battery SoC at the sametime. The optimization results gave rise to a group of design parameters, indicatinga compromise between fuel consumption and battery SoC.
Hybrid vehicles are often equipped with batteries as secondary storage elements.The battery aging process and its integration as a power management objective hasalready been discussed in [BMS15]. The following material and text is based on[BMS15]. In [SOS+11], an optimal control problem is formulated to minimize fuelconsumption, as well as battery aging. With regards to battery lifetime, State ofHealth (SoH) estimation, commonly related to the battery capacity fade [EBV14],is important. The maximum peak of the battery current is one of the factors influ-encing SoH and has to be limited. The number of battery recharge cycles duringan interval have to be decreased as detailed in [HS06], but as mentioned in [HS06],this leads to more power generation from the primary source and, simultaneously,to higher fuel consumption. Thus, an inclusion of a second objective function as anoptimization goal is necessary for extending the system’s longevity without disre-garding functionality. The two goals, fuel efficiency and battery aging, are conflictingobjectives, as stated in [BMFF11]. Here, the requirement of high SoC for the min-imization of total energy cost and the requirement of limited charging/dischargingof the battery are the two conflicting objectives. In [BMFF11], two such conflictingobjectives are evaluated for a plug-in hybrid electric vehicle charge pattern opti-mization. The optimal parameters corresponding to the objectives can be generatedby optimization algorithms suitable for dealing with more than one objective.
In [BMFF11], these objectives are traded off using NSGA II. Here, the time, themaximum amount and the rate at which the HEV charges before each trip are takenas optimization variables. The consideration of both SoC and SoH is considered in[RBBP11], where, to carry out the task of optimal power management, a supervisoris presented. In [WY06a, WY06b], a genetic algorithm (GA) was used to fine-tunethe parameters of a fuzzy logic controller. Three aspects of battery managementwere considered: minimization of resistive losses, yet supplying peak power demands,balanced battery energy in the entire duty cycle and controlling of the depth ofcharge/discharge for preserving the battery life.
In the field of hybrid electric vehicles (HEVs), power management and optimizationstrategies are not just restricted to those cases where the entire driving pattern isconsidered. In [PIGV01, BGR00, LJPML04], for example, the optimal division of
8 Chapter 2. Literature review
output torque is based on a specific driving pattern, and in [PL00], DP is consideredfor the optimization of several respective driving patterns. On the other hand, in[IYD+04], a prediction of the future driving pattern is considered based on pastdata. Use of human-in-the-loop in order to analyze driver requirements and thecorresponding dynamic response of the vehicle is also not uncommon [VIPn+09].In [HS06], a fuzzy rule-based control was considered along with the prediction ofthe future path of the vehicle. Use of GPS for the knowledge of obstacles to comeand the assumption of drive cycle being provided as a reference were one of thekey aspects here. Apart from GPS, track-based prediction [CB11] and dynamicrecurrent neural networks (DRNN) [MSS12] have also been applied. Without theinformation available from telemetry, prediction strategies based on neural networksand stochastic Markov chain have been considered in [SHMS15] within an MPCframework. Past trajectories have been used for prediction, as considered in [MS12,MSS12, SWS+13]. Here, a prediction algorithm considers certain features of thepast trajectory measured over predefined time horizons. The adaption of horizonlength (the number of past measurements) depending on the prediction performanceis a key aspect here. The task of control optimization in [MS12] is carried out usingMPC, and the results are compared to globally-optimal solutions determined bydynamic programming. In [Mur08], an intelligent control, both with and withoutknowledge of the unknown, is considered; whereas in [WL11], control based on boththe driving cycle, as well as driving style is elaborated. Within driving cycle-basedcontrol, methods to recognize present and to predict future driving conditions aredetailed followed by methods for data analyses. In [PCM10], an intelligent strategybased on the prediction of both the driving environment, as well as driving trendsis considered. It consists of three major neural network systems: the first one forpredicting road type and traffic congestion; the second one for predicting drivingtrend; the third one as a suite of intelligent networks, trained for all roadway types.In driving style-based control, methods to recognize drivers’ driving styles, such asmild driving style, normal driving style, aggressive driving style, etc., are mentioned.The use of a driving simulator as an experimental platform is stated. In [WMS15],a driving simulator has been used for improving driving efficiency and safety.
2.2 Rule-based power management and optimization
According to [MF08], the available power management optimization strategies canbe categorized into three broad classes, namely global, static real time and dynamicreal time. The rule-based control strategy is a basic control strategy that involvesseveral modes of operation [MF08]. As detailed in [MF08], four operation modes areconsidered, namely motor and engine-only modes, hybrid braking mode and hybridpropelling mode. In these modes, an average constant charge is maintained in thestorage component. Hence, SoC of the storage component is a constraint or deter-mining factor for the switching between modes. Another factor is the desired torque.
2.2 Rule-based power management and optimization 9
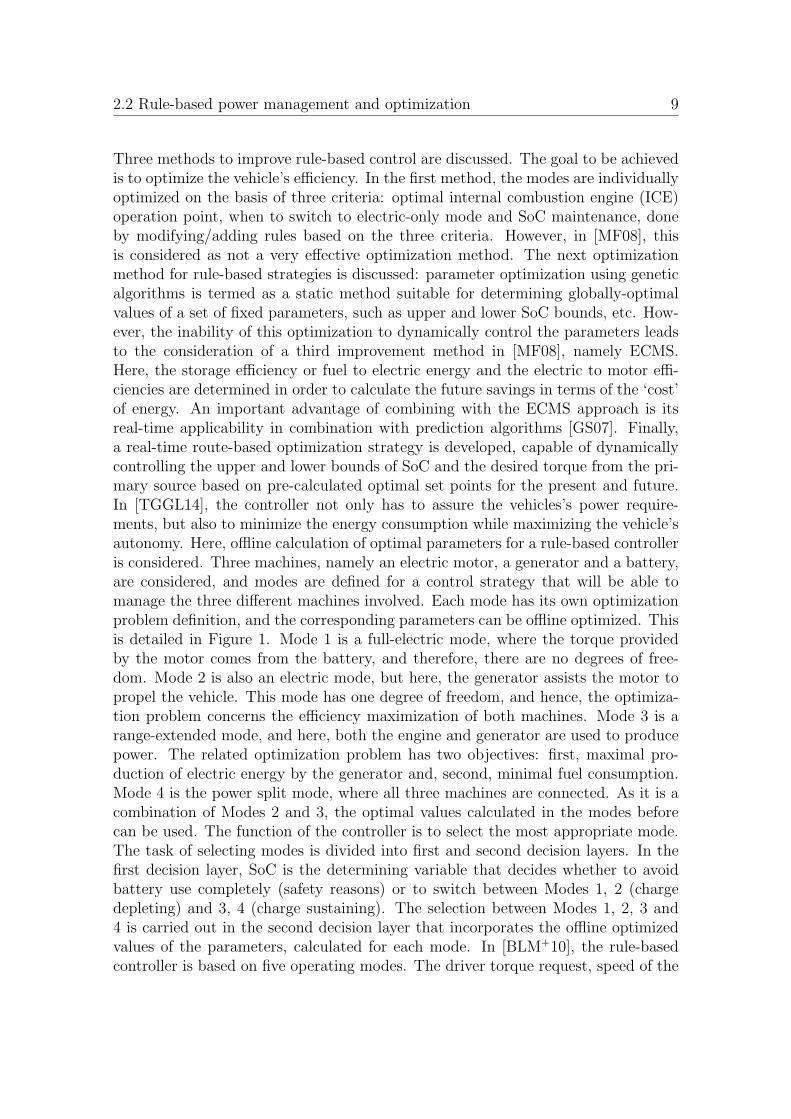
Three methods to improve rule-based control are discussed. The goal to be achievedis to optimize the vehicle’s efficiency. In the first method, the modes are individuallyoptimized on the basis of three criteria: optimal internal combustion engine (ICE)operation point, when to switch to electric-only mode and SoC maintenance, doneby modifying/adding rules based on the three criteria. However, in [MF08], thisis considered as not a very effective optimization method. The next optimizationmethod for rule-based strategies is discussed: parameter optimization using geneticalgorithms is termed as a static method suitable for determining globally-optimalvalues of a set of fixed parameters, such as upper and lower SoC bounds, etc. How-ever, the inability of this optimization to dynamically control the parameters leadsto the consideration of a third improvement method in [MF08], namely ECMS.Here, the storage efficiency or fuel to electric energy and the electric to motor effi-ciencies are determined in order to calculate the future savings in terms of the ‘cost’of energy. An important advantage of combining with the ECMS approach is itsreal-time applicability in combination with prediction algorithms [GS07]. Finally,a real-time route-based optimization strategy is developed, capable of dynamicallycontrolling the upper and lower bounds of SoC and the desired torque from the pri-mary source based on pre-calculated optimal set points for the present and future.In [TGGL14], the controller not only has to assure the vehicles’s power require-ments, but also to minimize the energy consumption while maximizing the vehicle’sautonomy. Here, offline calculation of optimal parameters for a rule-based controlleris considered. Three machines, namely an electric motor, a generator and a battery,are considered, and modes are defined for a control strategy that will be able tomanage the three different machines involved. Each mode has its own optimizationproblem definition, and the corresponding parameters can be offline optimized. Thisis detailed in Figure 1. Mode 1 is a full-electric mode, where the torque providedby the motor comes from the battery, and therefore, there are no degrees of free-dom. Mode 2 is also an electric mode, but here, the generator assists the motor topropel the vehicle. This mode has one degree of freedom, and hence, the optimiza-tion problem concerns the efficiency maximization of both machines. Mode 3 is arange-extended mode, and here, both the engine and generator are used to producepower. The related optimization problem has two objectives: first, maximal pro-duction of electric energy by the generator and, second, minimal fuel consumption.Mode 4 is the power split mode, where all three machines are connected. As it is acombination of Modes 2 and 3, the optimal values calculated in the modes beforecan be used. The function of the controller is to select the most appropriate mode.The task of selecting modes is divided into first and second decision layers. In thefirst decision layer, SoC is the determining variable that decides whether to avoidbattery use completely (safety reasons) or to switch between Modes 1, 2 (chargedepleting) and 3, 4 (charge sustaining). The selection between Modes 1, 2, 3 and4 is carried out in the second decision layer that incorporates the offline optimizedvalues of the parameters, calculated for each mode. In [BLM+10], the rule-basedcontroller is based on five operating modes. The driver torque request, speed of the
10 Chapter 2. Literature review
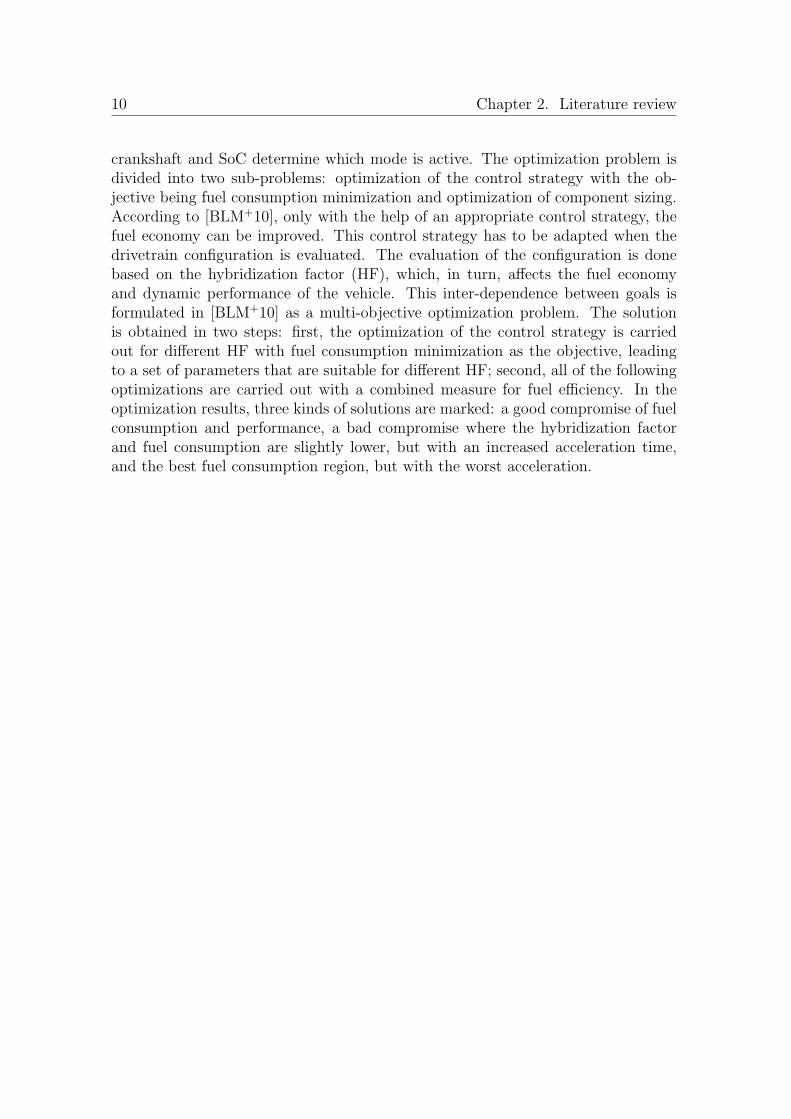
crankshaft and SoC determine which mode is active. The optimization problem isdivided into two sub-problems: optimization of the control strategy with the ob-jective being fuel consumption minimization and optimization of component sizing.According to [BLM+10], only with the help of an appropriate control strategy, thefuel economy can be improved. This control strategy has to be adapted when thedrivetrain configuration is evaluated. The evaluation of the configuration is donebased on the hybridization factor (HF), which, in turn, affects the fuel economyand dynamic performance of the vehicle. This inter-dependence between goals isformulated in [BLM+10] as a multi-objective optimization problem. The solutionis obtained in two steps: first, the optimization of the control strategy is carriedout for different HF with fuel consumption minimization as the objective, leadingto a set of parameters that are suitable for different HF; second, all of the followingoptimizations are carried out with a combined measure for fuel efficiency. In theoptimization results, three kinds of solutions are marked: a good compromise of fuelconsumption and performance, a bad compromise where the hybridization factorand fuel consumption are slightly lower, but with an increased acceleration time,and the best fuel consumption region, but with the worst acceleration.
Mode 2:Generator & motor
Optimization of:Efficiency of both
machines
Mode 3:Generator & engine
Optimization of:fuel consump.
& recharging perfm.
Mode 4:Generator, engine,
& batteryOptimization of:motor operation
Mode 1:Full electric RULE-
BASEDCONTROL
OPTIMIZATION OF MODES
Modes 1,2
Modes 1,2Flag=0
Modes 3,4Flag =1
Modes 3,4Flag =1
First decision layer
Second decision layer
EXECUTION OF MODES
Vehiclevelocity
SOC
Torquedemand
SOC<0.3
Flag=1
SOC<0.35
2.3 Power management optimization with battery lifetime management 11
2.3 Power management optimization with battery lifetime
management
This section discusses topics that have already been elaborated in [BMS15] and re-peats the material. In terms of power management and optimization, fuel consump-tion minimization is the commonly known and accepted design goal. Rule-basedpower management often takes the battery SoC into account while designing therules. In [Con06], based on battery SoC and SoH, as well as other relevant param-eters, the battery management system is able to deduce the electrical management.The results are communicated via controller area network (CAN bus) to the ve-hicle power management, which determines the power split between componentswhile keeping the currents and voltages within the limits to safeguard the battery.According to [Con06, KR99], overcharging, over-discharging, mechanical stress andhigh temperature are some of the factors that lead to safety issues. The consid-eration of both SoC and SoH is also considered in [RBBP11]. The battery agingand degradation is limited by using SoC and SoH as constraints. The proposedsupervisor consists of forecasting, predictive optimization and the local commandstage. The forecast of inputs is sent from the forecasting stage to the optimizationstage, which gives current commands to the DC/DC converter connected to thebatteries at the local command stage. The physical parameters interacting at thelocal command stage are battery current and battery SoC and SoH. The batterymodel considered estimates SoC, taking into account charge variation as a functionof current and temperature, SoH as a representation of capacity losses according tothe battery depth of discharge and voltage as a function of SoC. The power man-agement and optimization developed in [RBBP11] considers battery aging in theoptimization process for a grid-connected PV system with batteries. The resultsshow the reduction in grid power fluctuations, so that it is balanced to the powerexchanged with the batteries.
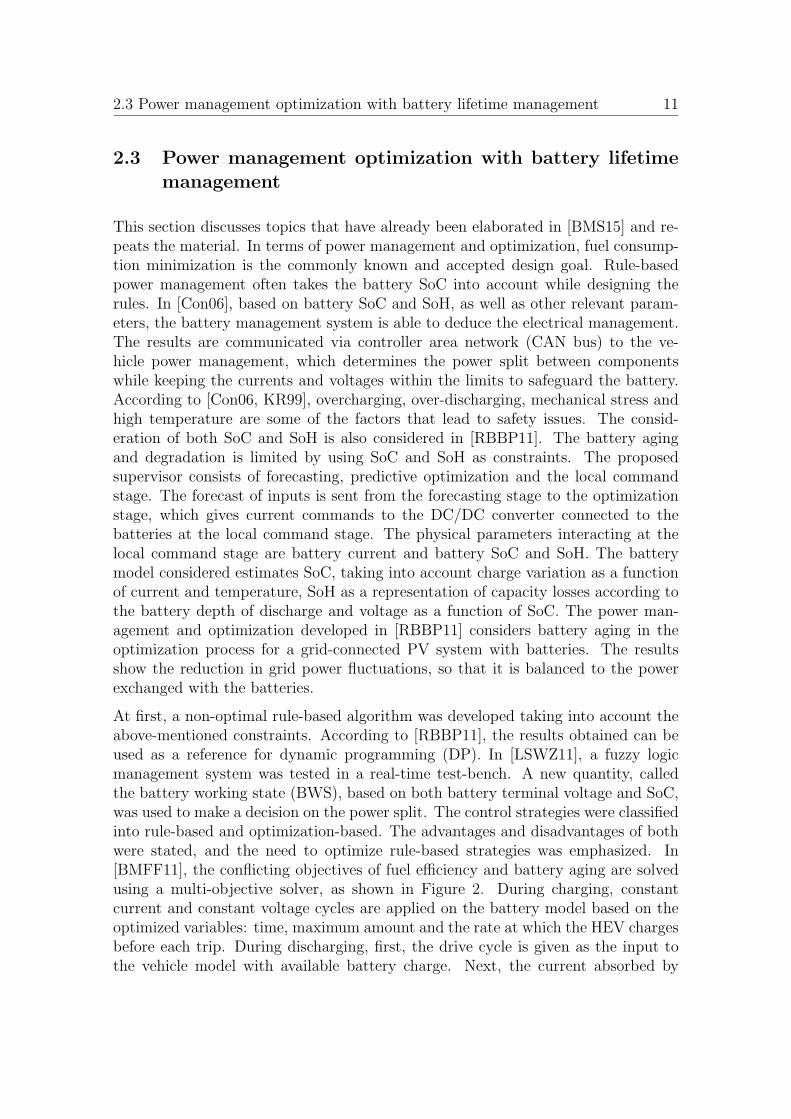
At first, a non-optimal rule-based algorithm was developed taking into account theabove-mentioned constraints. According to [RBBP11], the results obtained can beused as a reference for dynamic programming (DP). In [LSWZ11], a fuzzy logicmanagement system was tested in a real-time test-bench. A new quantity, calledthe battery working state (BWS), based on both battery terminal voltage and SoC,was used to make a decision on the power split. The control strategies were classifiedinto rule-based and optimization-based. The advantages and disadvantages of bothwere stated, and the need to optimize rule-based strategies was emphasized. In[BMFF11], the conflicting objectives of fuel efficiency and battery aging are solvedusing a multi-objective solver, as shown in Figure 2. During charging, constantcurrent and constant voltage cycles are applied on the battery model based on theoptimized variables: time, maximum amount and the rate at which the HEV chargesbefore each trip. During discharging, first, the drive cycle is given as the input tothe vehicle model with available battery charge. Next, the current absorbed by
12 Chapter 2. Literature review
Batterymodel
Hybridvehiclemodel
Drivecycle
Multi-objectiveoptimizer
Batterydegradation
Optimizationvariables
Optimizationvariables
Energycost
SoC
Currentdemand
Figure 2.2: Optimization of battery charge patterns (according to [BMFF11])[MS15b]
the powertrain during the trip is recorded and sent to the electrochemical batterymodel. According to [BMFF11], this can help in evaluating the battery degradationwhile driving. During standstill conditions, battery degradation is calculated fromthe battery model alone. The two objectives are calculated at the end of the drivecycle and sent back to the optimizer, as shown in Figure 2.2.
2.4 Power management optimization with unknown veloc-
ity input
Apart from battery lifetime management, another issue with hybrid vehicles is thereal-time applicability of power management optimization strategies. Under realdriving conditions, no pre-defined drive cycle is followed, and optimal future drivingbehavior needs to be predicted. In [HS06], both predictive and protective algo-rithms are considered, where in the first part, the energy management based on thepredicted future has fuel economy, performance and emission minimization as ob-jectives; and in the second part, the modified energy management has battery SoHimprovement as an additional objective. The controller based on fuzzy rules has twoinputs, that is the differences between future and present speeds and positions. Ithas one output that manipulates the charge and discharge of the battery. Here, GPShas been used to acquire knowledge of the obstacles in the future, but in the absenceof GPS, use of human-in-the-loop to analyze driver requirements and correspondingdynamic responses of the vehicle is also not uncommon [VIPn+09]. In [VIPn+09], ahardware test-bench used for HiL simulations of HEV powertrain was coupled withan advanced virtual driving simulator. First, a forward facing model was selected.This kind of model requires controllers and a driver who can either track a givendrive cycle or drive over a virtual scenario. The aim of using this model is to cal-culate vehicle speed and dynamic variables, such as forces in a forward directionalong the powertrain. A real driver is asked to drive over a virtual scenario of 3km, and some dynamic variables were saved in order to analyze and re-design the
2.4 Power management optimization with unknown velocity input 13
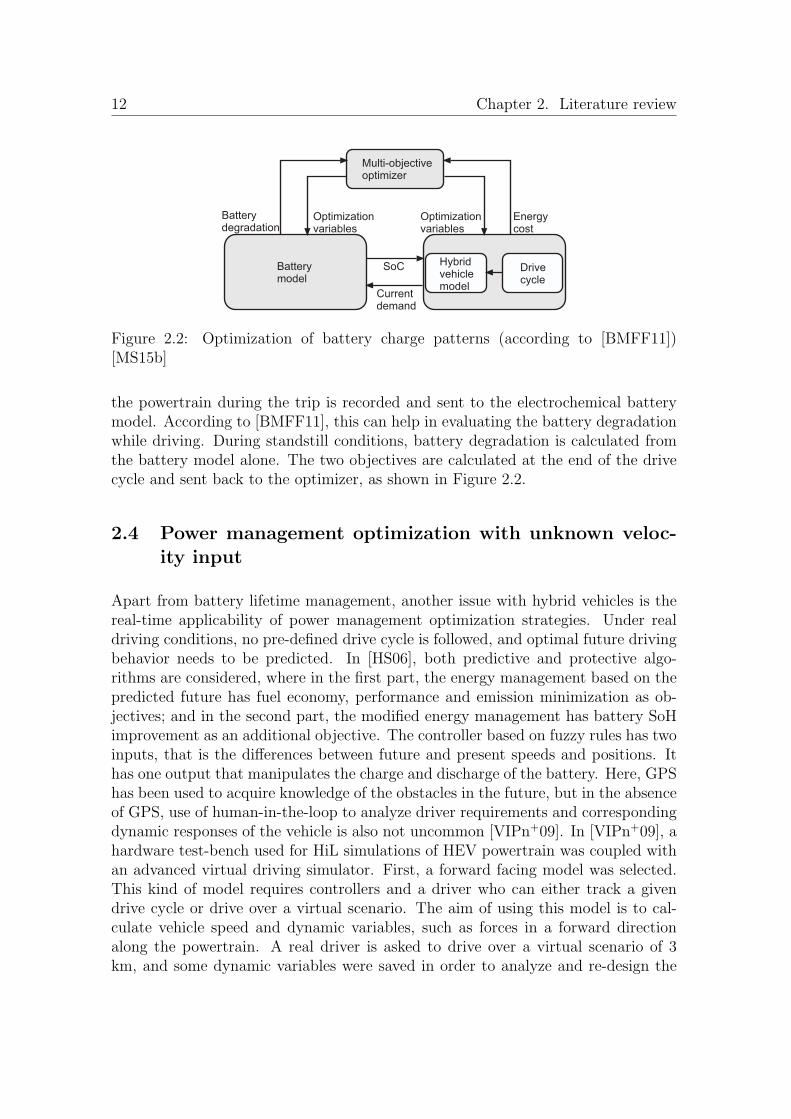
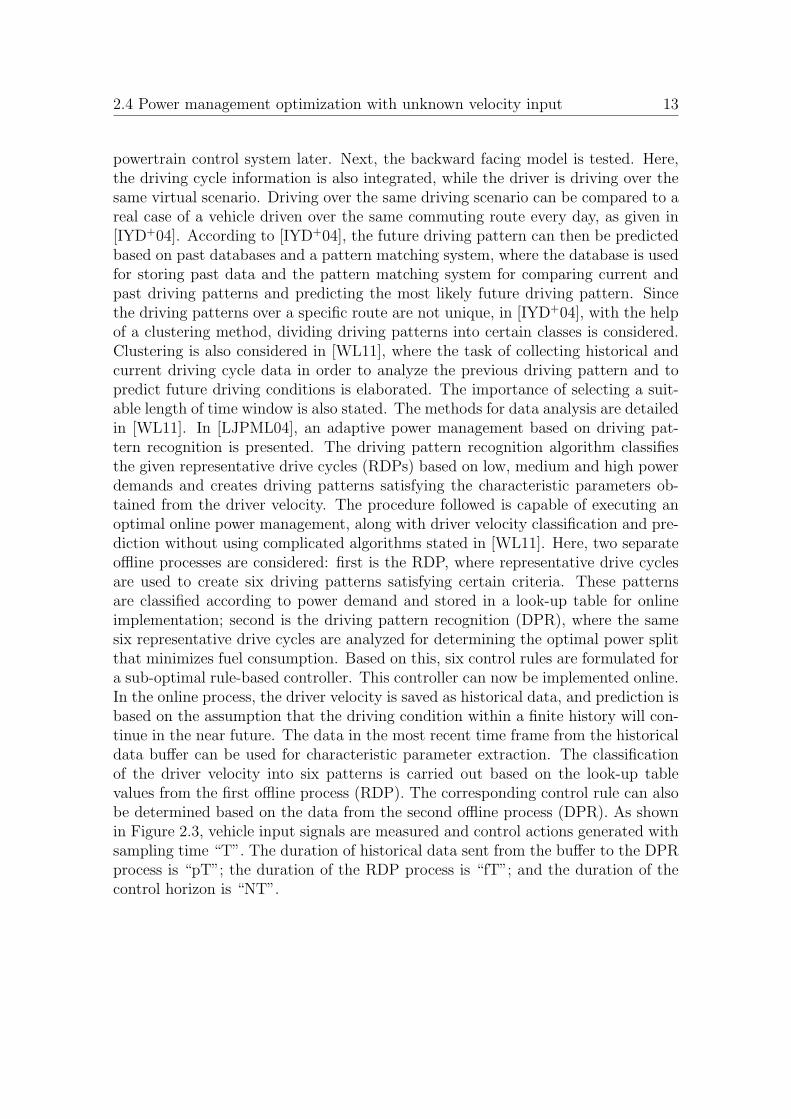
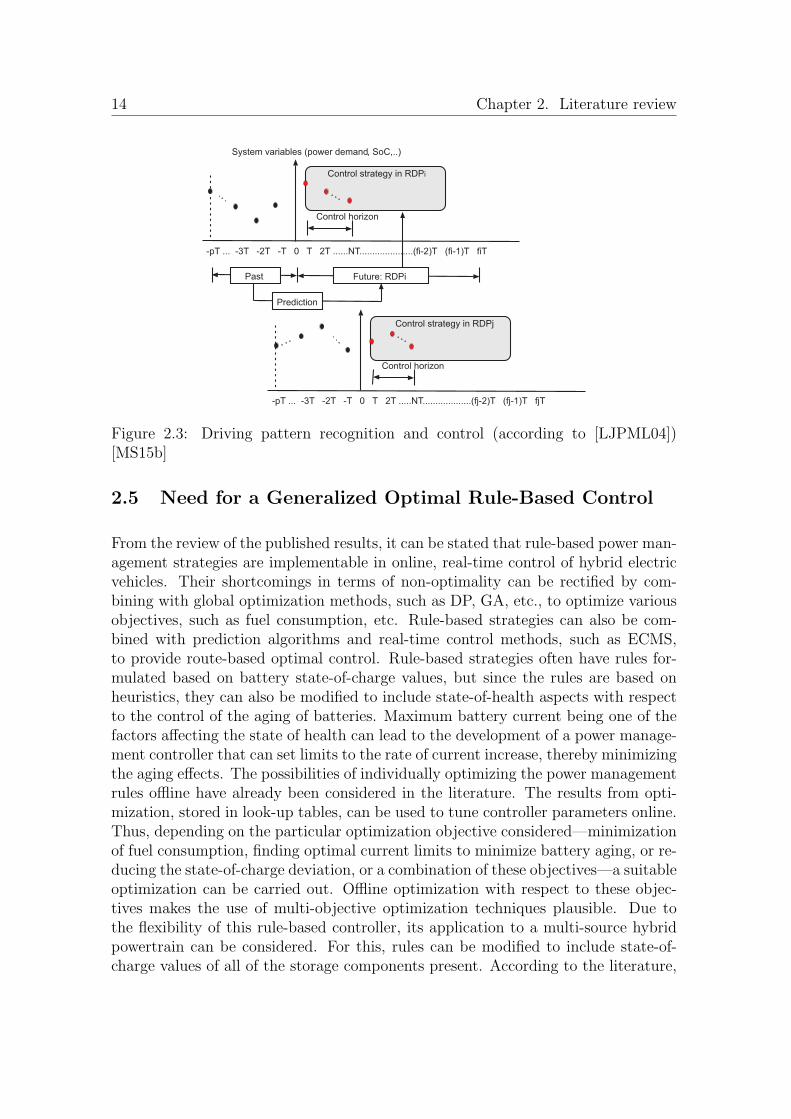
powertrain control system later. Next, the backward facing model is tested. Here,the driving cycle information is also integrated, while the driver is driving over thesame virtual scenario. Driving over the same driving scenario can be compared to areal case of a vehicle driven over the same commuting route every day, as given in[IYD+04]. According to [IYD+04], the future driving pattern can then be predictedbased on past databases and a pattern matching system, where the database is usedfor storing past data and the pattern matching system for comparing current andpast driving patterns and predicting the most likely future driving pattern. Sincethe driving patterns over a specific route are not unique, in [IYD+04], with the helpof a clustering method, dividing driving patterns into certain classes is considered.Clustering is also considered in [WL11], where the task of collecting historical andcurrent driving cycle data in order to analyze the previous driving pattern and topredict future driving conditions is elaborated. The importance of selecting a suit-able length of time window is also stated. The methods for data analysis are detailedin [WL11]. In [LJPML04], an adaptive power management based on driving pat-tern recognition is presented. The driving pattern recognition algorithm classifiesthe given representative drive cycles (RDPs) based on low, medium and high powerdemands and creates driving patterns satisfying the characteristic parameters ob-tained from the driver velocity. The procedure followed is capable of executing anoptimal online power management, along with driver velocity classification and pre-diction without using complicated algorithms stated in [WL11]. Here, two separateoffline processes are considered: first is the RDP, where representative drive cyclesare used to create six driving patterns satisfying certain criteria. These patternsare classified according to power demand and stored in a look-up table for onlineimplementation; second is the driving pattern recognition (DPR), where the samesix representative drive cycles are analyzed for determining the optimal power splitthat minimizes fuel consumption. Based on this, six control rules are formulated fora sub-optimal rule-based controller. This controller can now be implemented online.In the online process, the driver velocity is saved as historical data, and prediction isbased on the assumption that the driving condition within a finite history will con-tinue in the near future. The data in the most recent time frame from the historicaldata buffer can be used for characteristic parameter extraction. The classificationof the driver velocity into six patterns is carried out based on the look-up tablevalues from the first offline process (RDP). The corresponding control rule can alsobe determined based on the data from the second offline process (DPR). As shownin Figure 2.3, vehicle input signals are measured and control actions generated withsampling time “T”. The duration of historical data sent from the buffer to the DPRprocess is “pT”; the duration of the RDP process is “fT”; and the duration of thecontrol horizon is “NT”.
14 Chapter 2. Literature review
-pT ... -3T -2T -T 0 T 2T ......NT.....................( -2)T ( -1)T Tfi fi fi
Past
Prediction
-pT ... -3T -2T -T 0 T 2T .....NT...................(fj-2)T (fj-1)T fjT
Future: RDPi
System variables ( , SoC,..)power demand
Control horizon
Control strategy in RDPi
Control horizon
Control strategy in RDPj
Figure 2.3: Driving pattern recognition and control (according to [LJPML04])[MS15b]
2.5 Need for a Generalized Optimal Rule-Based Control
From the review of the published results, it can be stated that rule-based power man-agement strategies are implementable in online, real-time control of hybrid electricvehicles. Their shortcomings in terms of non-optimality can be rectified by com-bining with global optimization methods, such as DP, GA, etc., to optimize variousobjectives, such as fuel consumption, etc. Rule-based strategies can also be com-bined with prediction algorithms and real-time control methods, such as ECMS,to provide route-based optimal control. Rule-based strategies often have rules for-mulated based on battery state-of-charge values, but since the rules are based onheuristics, they can also be modified to include state-of-health aspects with respectto the control of the aging of batteries. Maximum battery current being one of thefactors affecting the state of health can lead to the development of a power manage-ment controller that can set limits to the rate of current increase, thereby minimizingthe aging effects. The possibilities of individually optimizing the power managementrules offline have already been considered in the literature. The results from opti-mization, stored in look-up tables, can be used to tune controller parameters online.Thus, depending on the particular optimization objective considered—minimizationof fuel consumption, finding optimal current limits to minimize battery aging, or re-ducing the state-of-charge deviation, or a combination of these objectives—a suitableoptimization can be carried out. Offline optimization with respect to these objec-tives makes the use of multi-objective optimization techniques plausible. Due tothe flexibility of this rule-based controller, its application to a multi-source hybridpowertrain can be considered. For this, rules can be modified to include state-of-charge values of all of the storage components present. According to the literature,
2.6 Conclusions 15
amongst multi-source hybrids, the use of a battery-supercapacitor combination canprove particularly beneficial. The main purpose of this literature research was toevaluate the potentials and application prospects of rule-based power managementand to lay the foundations for the development of an appropriate optimal powermanagement controller that takes into account multiple optimization objectives, inthe presence of multiple sources.
2.6 Conclusions
In this chapter, an elaborate view of rule-based power management, its alternatives,optimization potentials and applications are given. First, an overview of HEVs andthe advantages of selecting a suitable combination of components is given, followedby the details of optimizing rule-based power management. Then, optimization inthe presence of multiple, complex and conflicting goals is discussed. Finally, theextent of rule-based power management in solving the issues of battery aging anddealing with real driving scenarios is reported with the help of relevant literature.
16
3 Hybrid vehicle: Components and configurations
Mathematical models of hybrid vehicle components are often required for detailedanalysis of powertrain performance and power management strategies. Simulationof these models is the first step for realizing their behavior in experimental set-upsand real-time systems. In this chapter, a three-source hybrid vehicle comprisingof a fuel cell, battery, and supercapacitor is considered. The different modelingapproaches are discussed along with topologies available followed by reasons forchoosing the considered configuration. Mathematical models of the considered pow-ertrain are given, with complex dynamic models for battery, supercapacitor, andDC/DC converter. Dynamic modeling is followed by plausibility assessment of com-ponent dynamics. Finally, a simplified modeling approach is discussed, suitable foruse with the optimization toolbox. The comparison of results from complex andsimplified modeling approaches is also given. Parts from this section are based onthe text and material from [MS16b].
3.1 Types of modeling
In order to investigate the behavior of hybrid vehicles and evaluate the dynamicresponse of the system to varying load profiles, building a mathematical modelis often considered as a pre-requisite. Modeling can be done based on a givendrive cycle where the vehicle energy losses and its performance can be calculatedbackwards [GS07] or based on an unknown velocity pattern where forward modelingbecomes necessary. The individual components can also be modeled in two ways:quasi-static and dynamic depending on the control objectives considered.
3.1.1 Forward-backward modeling
Backward modeling is an important method to calculate energy consumption, effi-ciency, emissions, etc based on a pre-defined drive cycle. Simulating such modelsrequire vehicle speed and acceleration values from drive cycle in order to calculatethe required torques and speeds backwards through the drive train [VIPn+09]. Themodel may be based on static equations and efficiency maps of components as de-tailed in [VIPn+09]. The drivability that is the ability of the system to follow aparticular drive cycle can be determined using a backward model. In [GS07], thedynamics of the longitudinal motion of a general road vehicle are analyzed with thehelp of a backward model where, vehicle energy losses and performance calculationsare elaborated. The drivability can be defined as the ability of the system to followthe given drive cycle. It can be expressed in terms of power as follows
Drivability =
∫ tend
t0|Pref − Pact|dt
∫ tend
t0|Pref |dt
, (3.1)
3.1 Types of modeling 17
where Pref denotes the reference power or the power demand that the given drivecycle requires and Pact represents the actual power available. This drivability termis particularly useful in evaluating power management strategies. The error betweenthe power required by the backward modeled powertrain components and the actualpower available from the sources as defined by the power management can be keptas low as possible. This error is termed as drivability error.
A forward model is one which calculates the available power from the sources de-pending on the power demand. It is possible to combine a backward model witha forward model in order to measure the drivability error or to model an entirevehicle in a forward manner to investigate real time systems where the drive cycleis not given. In [VIPn+09], a forward model is considered for cases where a drivermodel or real driver is present. Here, differential equations of longitudinal and lat-eral vehicle dynamics are solved using throttle, brake, and steering wheel positionsas inputs, and vehicle speed and position as outputs. The advantage of backwardmodeling its lower computational time as compared to forward modeling where ap-propriate vehicle component models are required resulting in longer simulation times[GS07, VIPn+09].
3.1.2 Quasistatic-dynamic modeling
Depending on whether the HEV powertrain is forward or backward modeled, theindividual components have to be modeled accordingly. According to [GS07], thequasi-static models which generally take speed, acceleration, and road angle as in-puts can be useful in determining the fuel consumption. Together with a backwardmodeling approach, the speed and acceleration that the vehicle is required to followcan be calculated with the assumption that these values remain constant in a verysmall interval of the given drive cycle time. A dynamic model on the other hand,can be used to represent the dynamics of the mathematical model more correctlyand also be used in combination with forward simulation [GS07]. Here, the power-train model is expressed with sets of ordinary differential equations in state-spaceform. In [DCC+10], both quasi-static and dynamic models are considered where,the reason for considering a dynamic model of battery is stated. Therefore, com-ponents like batteries and supercapacitors where the state-of-charge is an unknownresult of power management and optimization algorithms need to be modeled dy-namically. A fuel cell on the other hand can be modeled based on experimentallydetermined parameters as detailed in [OIQ05]. Thus, instead of a complex dynamicalmodel as developed in [OWMS13], a quasi-static model can be used based on look-up table values of experimentally determined parameters in [OWMS13], namely,voltage-current and power-efficiency characteristics. A DC/DC converter which anessential component in pure-electric powertrains can also be dynamically modeledlike the battery and supercapacitor. The main elements in DC/DC converters are
18 Chapter 3. Hybrid vehicle: Components and configurations
inductances and capacitances. The switching between states to enable energy ex-change between these elements make DC/DC converters highly dynamic systems.The modeling of the entire powertrain in this work is a combination of forward-backward simulation as shown in Figure 3.3, comprising of both dynamically andquasi-statically modeled components. A suitable power management is designed forthe chosen configuration of fuel cell-battery-supercapacitor hybrid. The role of theforward part is to calculate, based on the available power from the three sources,and the desired power requirements from the power management, the total availablepower. The backward part on the other hand, calculates the power demand basedon the pre-defined drive cycle. If the drive cycle is unknown, then this part mustalso be forward modeled. The battery, supercapacitor, and DC/DC converters aremodeled dynamically whereas the fuel cell along with the backward part is mod-eled quasi-statically. A simplified version of the model which will be described inthe later sections can also be developed. The DC/DC converters in this simplifiedmodel can be modeled quasi-statically along with fuel cell and the backward part inorder to reduce the computational time. This is particularly suitable for use withthe optimization toolbox.
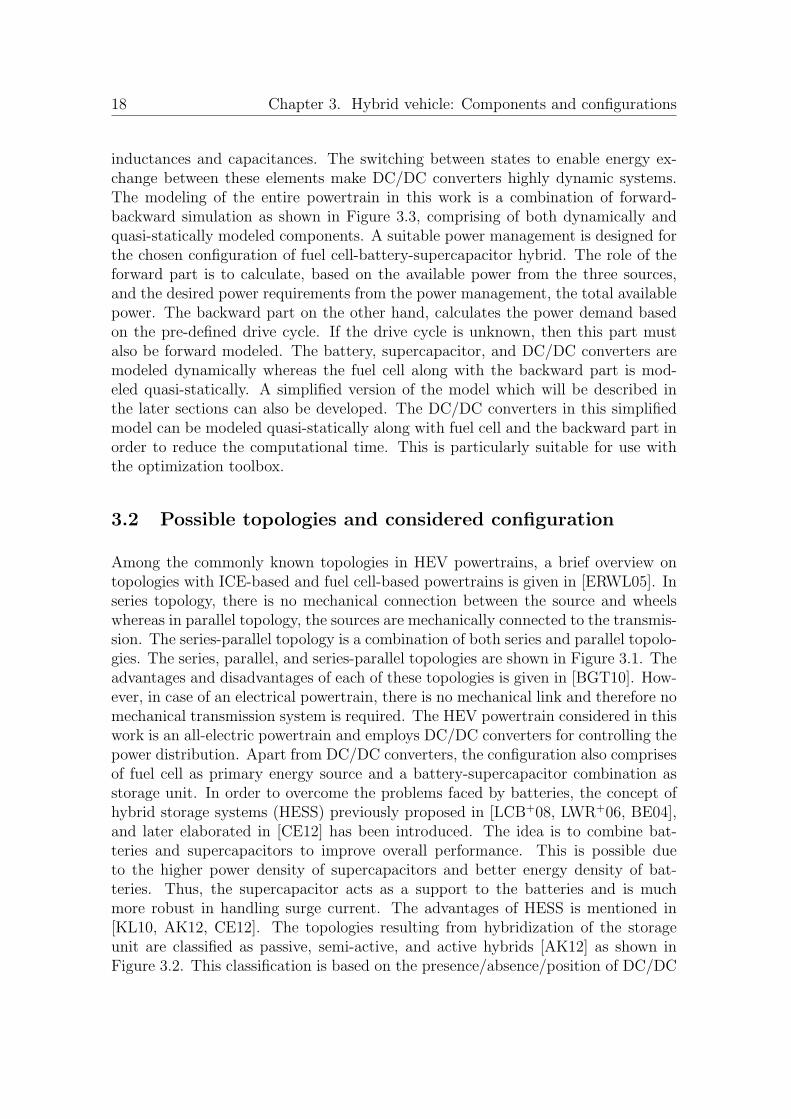
3.2 Possible topologies and considered configuration
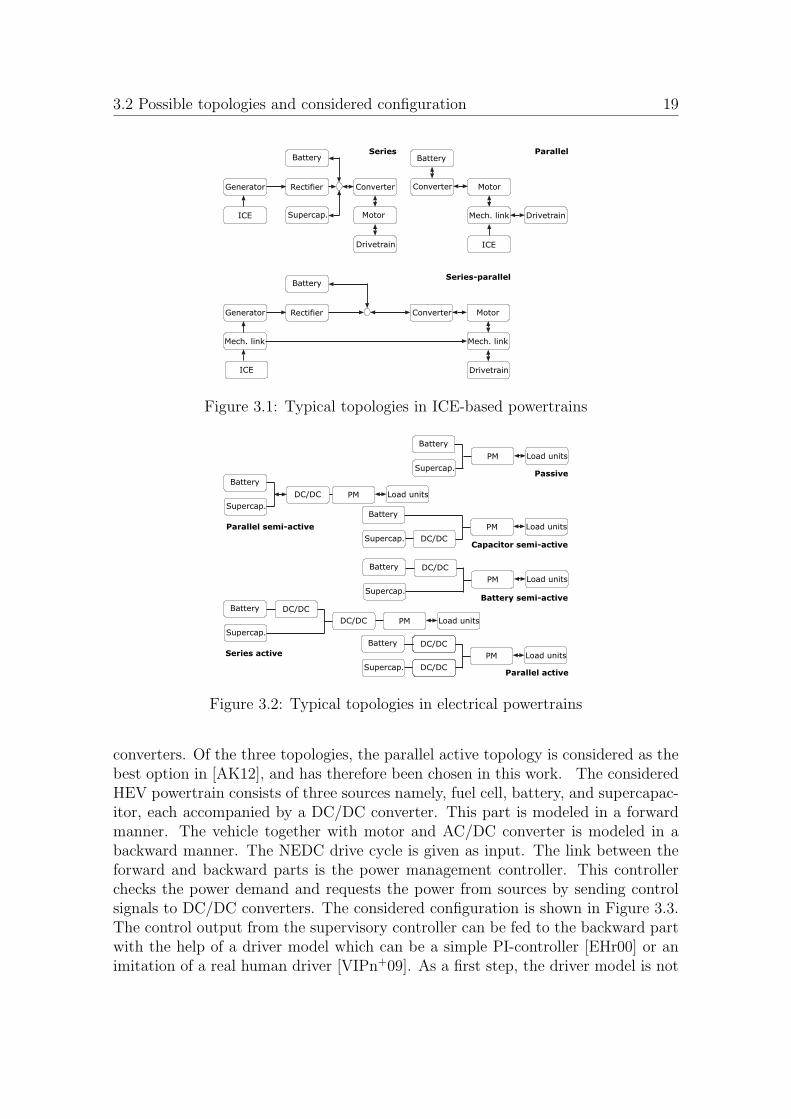
Among the commonly known topologies in HEV powertrains, a brief overview ontopologies with ICE-based and fuel cell-based powertrains is given in [ERWL05]. Inseries topology, there is no mechanical connection between the source and wheelswhereas in parallel topology, the sources are mechanically connected to the transmis-sion. The series-parallel topology is a combination of both series and parallel topolo-gies. The series, parallel, and series-parallel topologies are shown in Figure 3.1. Theadvantages and disadvantages of each of these topologies is given in [BGT10]. How-ever, in case of an electrical powertrain, there is no mechanical link and therefore nomechanical transmission system is required. The HEV powertrain considered in thiswork is an all-electric powertrain and employs DC/DC converters for controlling thepower distribution. Apart from DC/DC converters, the configuration also comprisesof fuel cell as primary energy source and a battery-supercapacitor combination asstorage unit. In order to overcome the problems faced by batteries, the concept ofhybrid storage systems (HESS) previously proposed in [LCB+08, LWR+06, BE04],and later elaborated in [CE12] has been introduced. The idea is to combine bat-teries and supercapacitors to improve overall performance. This is possible dueto the higher power density of supercapacitors and better energy density of bat-teries. Thus, the supercapacitor acts as a support to the batteries and is muchmore robust in handling surge current. The advantages of HESS is mentioned in[KL10, AK12, CE12]. The topologies resulting from hybridization of the storageunit are classified as passive, semi-active, and active hybrids [AK12] as shown inFigure 3.2. This classification is based on the presence/absence/position of DC/DC
3.2 Possible topologies and considered configuration 19
Converter
Motor
Drivetrain
Battery
Rectifier
Supercap.
Generator
ICE Drivetrain
MotorConverter
Battery
ICE
Mech. link
Motor
Drivetrain
Battery
RectifierGenerator
ICE
Converter
Mech. link Mech. link
Series Parallel
Series-parallel
Figure 3.1: Typical topologies in ICE-based powertrains
Load unitsPM
Battery
Supercap.
Load unitsPM
Battery
Supercap.
DC/DC
Load unitsPM
Battery
Supercap. DC/DC
Load unitsPM
Battery
Supercap.
DC/DC
Load unitsPM
Battery
Supercap.
DC/DC
DC/DC
Load unitsPM
Battery
Supercap.
DC/DC
DC/DC
Parallel semi-active
Battery semi-active
Capacitor semi-active
Passive
Series active
Parallel active
Figure 3.2: Typical topologies in electrical powertrains
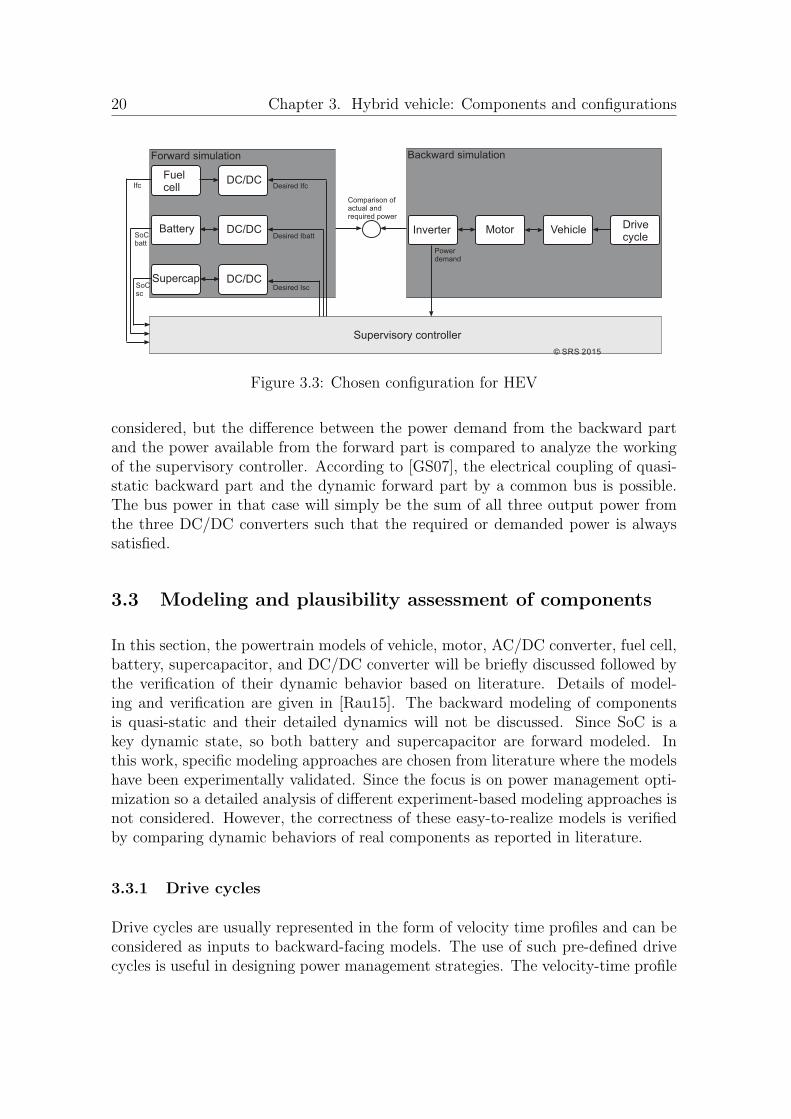
converters. Of the three topologies, the parallel active topology is considered as thebest option in [AK12], and has therefore been chosen in this work. The consideredHEV powertrain consists of three sources namely, fuel cell, battery, and supercapac-itor, each accompanied by a DC/DC converter. This part is modeled in a forwardmanner. The vehicle together with motor and AC/DC converter is modeled in abackward manner. The NEDC drive cycle is given as input. The link between theforward and backward parts is the power management controller. This controllerchecks the power demand and requests the power from sources by sending controlsignals to DC/DC converters. The considered configuration is shown in Figure 3.3.The control output from the supervisory controller can be fed to the backward partwith the help of a driver model which can be a simple PI-controller [EHr00] or animitation of a real human driver [VIPn+09]. As a first step, the driver model is not
20 Chapter 3. Hybrid vehicle: Components and configurations
Fuelcell
DC/DC
Battery DC/DC
Supercap DC/DC
Inverter Motor Vehicle Drivecycle
Supervisory controller
Desired Isc
Desired Ibatt
Desired Ifc
SoCbatt
SoCsc
Ifc
Powerdemand
© SRS 2015
Comparison ofactual andrequired power
Forward simulation Backward simulation
Figure 3.3: Chosen configuration for HEV
considered, but the difference between the power demand from the backward partand the power available from the forward part is compared to analyze the workingof the supervisory controller. According to [GS07], the electrical coupling of quasi-static backward part and the dynamic forward part by a common bus is possible.The bus power in that case will simply be the sum of all three output power fromthe three DC/DC converters such that the required or demanded power is alwayssatisfied.
3.3 Modeling and plausibility assessment of components
In this section, the powertrain models of vehicle, motor, AC/DC converter, fuel cell,battery, supercapacitor, and DC/DC converter will be briefly discussed followed bythe verification of their dynamic behavior based on literature. Details of model-ing and verification are given in [Rau15]. The backward modeling of componentsis quasi-static and their detailed dynamics will not be discussed. Since SoC is akey dynamic state, so both battery and supercapacitor are forward modeled. Inthis work, specific modeling approaches are chosen from literature where the modelshave been experimentally validated. Since the focus is on power management opti-mization so a detailed analysis of different experiment-based modeling approaches isnot considered. However, the correctness of these easy-to-realize models is verifiedby comparing dynamic behaviors of real components as reported in literature.
3.3.1 Drive cycles
Drive cycles are usually represented in the form of velocity time profiles and can beconsidered as inputs to backward-facing models. The use of such pre-defined drivecycles is useful in designing power management strategies. The velocity-time profile
3.3 Modeling and plausibility assessment of components 21
0 50 100 150 2000
20
40
60
80
100
120
Sp
ee
d [
km
/h]
Time [s]
0 100 200 300 400Time [s]
0
20
40
60
80
100
120
Sp
ee
d [
km
/h]
0 200 500 1000 1200Time [s]
400 8000
20
40
60
80
100
120
Sp
ee
d [
km
/h]
Figure 3.4: New European Drive Cycle (NEDC)
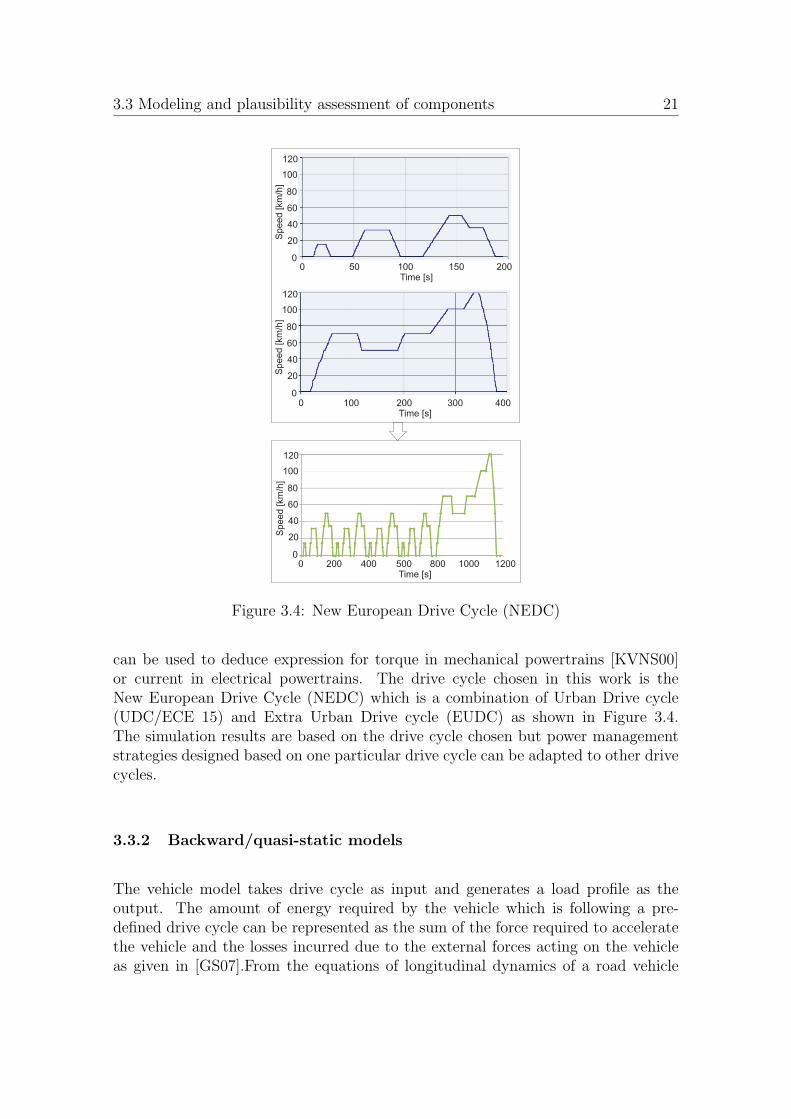
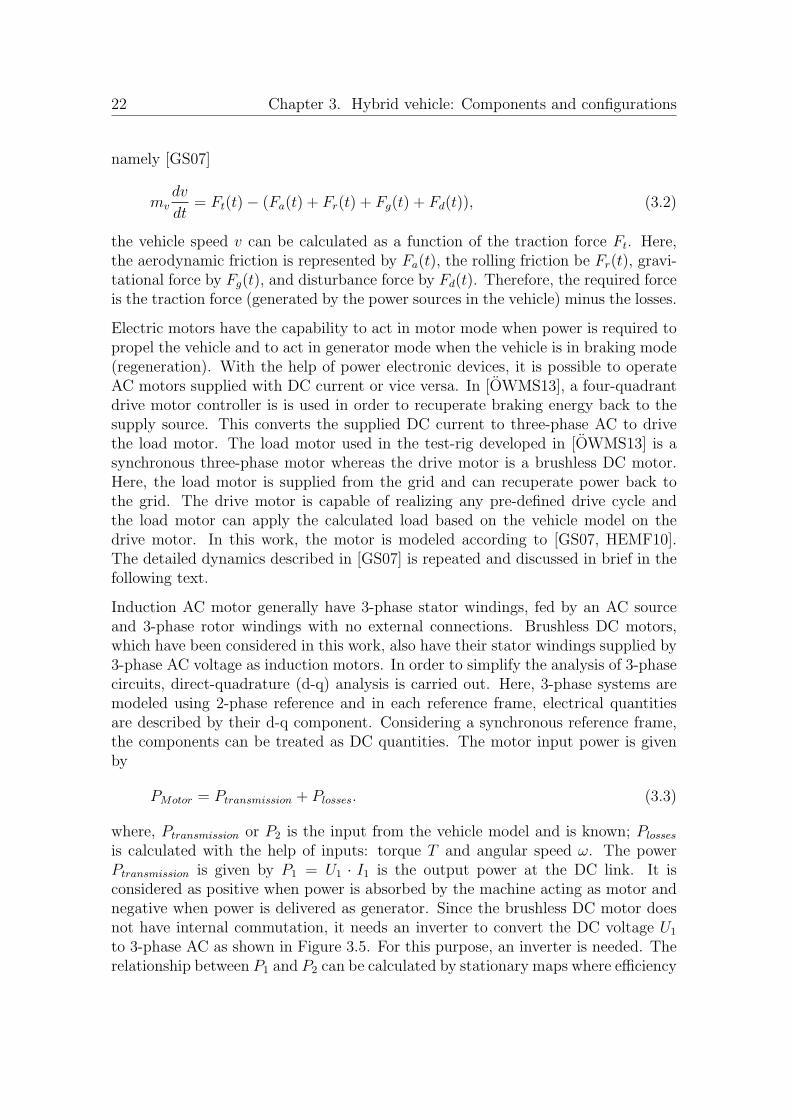
can be used to deduce expression for torque in mechanical powertrains [KVNS00]or current in electrical powertrains. The drive cycle chosen in this work is theNew European Drive Cycle (NEDC) which is a combination of Urban Drive cycle(UDC/ECE 15) and Extra Urban Drive cycle (EUDC) as shown in Figure 3.4.The simulation results are based on the drive cycle chosen but power managementstrategies designed based on one particular drive cycle can be adapted to other drivecycles.
3.3.2 Backward/quasi-static models
The vehicle model takes drive cycle as input and generates a load profile as theoutput. The amount of energy required by the vehicle which is following a pre-defined drive cycle can be represented as the sum of the force required to acceleratethe vehicle and the losses incurred due to the external forces acting on the vehicleas given in [GS07].From the equations of longitudinal dynamics of a road vehicle
22 Chapter 3. Hybrid vehicle: Components and configurations
namely [GS07]
mvdv
dt= Ft(t)− (Fa(t) + Fr(t) + Fg(t) + Fd(t)), (3.2)
the vehicle speed v can be calculated as a function of the traction force Ft. Here,the aerodynamic friction is represented by Fa(t), the rolling friction be Fr(t), gravi-tational force by Fg(t), and disturbance force by Fd(t). Therefore, the required forceis the traction force (generated by the power sources in the vehicle) minus the losses.
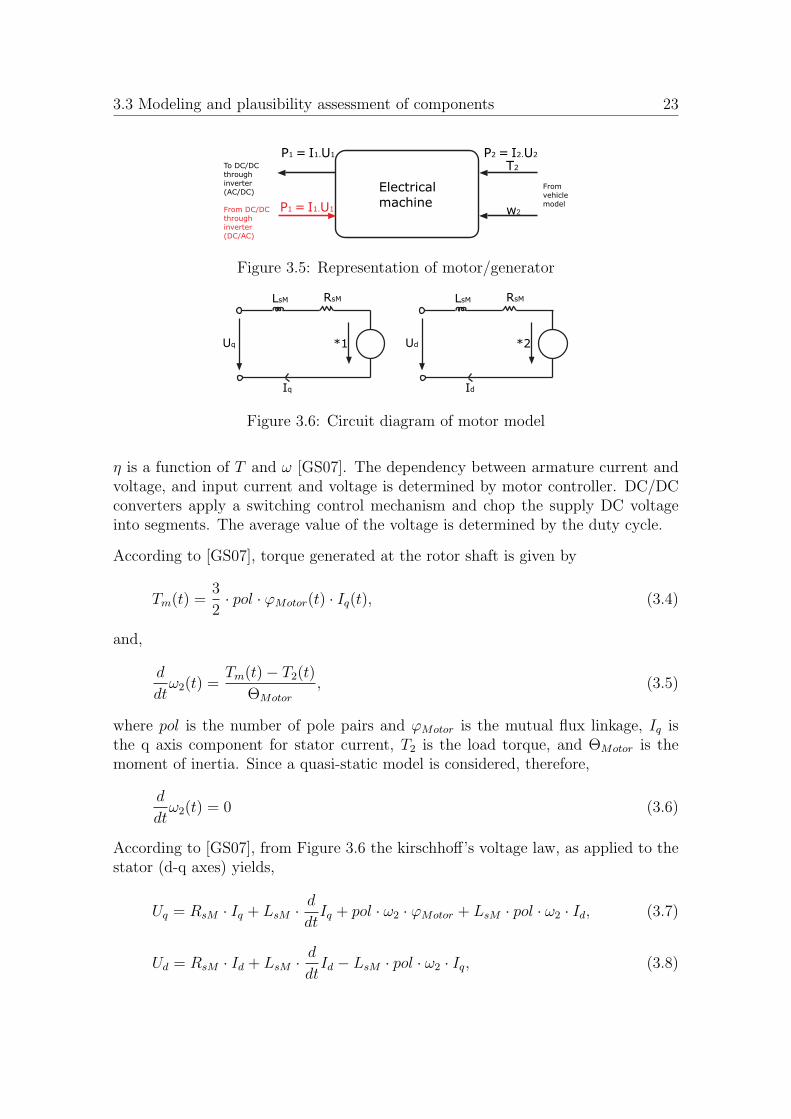
Electric motors have the capability to act in motor mode when power is required topropel the vehicle and to act in generator mode when the vehicle is in braking mode(regeneration). With the help of power electronic devices, it is possible to operateAC motors supplied with DC current or vice versa. In [OWMS13], a four-quadrantdrive motor controller is is used in order to recuperate braking energy back to thesupply source. This converts the supplied DC current to three-phase AC to drivethe load motor. The load motor used in the test-rig developed in [OWMS13] is asynchronous three-phase motor whereas the drive motor is a brushless DC motor.Here, the load motor is supplied from the grid and can recuperate power back tothe grid. The drive motor is capable of realizing any pre-defined drive cycle andthe load motor can apply the calculated load based on the vehicle model on thedrive motor. In this work, the motor is modeled according to [GS07, HEMF10].The detailed dynamics described in [GS07] is repeated and discussed in brief in thefollowing text.
Induction AC motor generally have 3-phase stator windings, fed by an AC sourceand 3-phase rotor windings with no external connections. Brushless DC motors,which have been considered in this work, also have their stator windings supplied by3-phase AC voltage as induction motors. In order to simplify the analysis of 3-phasecircuits, direct-quadrature (d-q) analysis is carried out. Here, 3-phase systems aremodeled using 2-phase reference and in each reference frame, electrical quantitiesare described by their d-q component. Considering a synchronous reference frame,the components can be treated as DC quantities. The motor input power is givenby
PMotor = Ptransmission + Plosses. (3.3)
where, Ptransmission or P2 is the input from the vehicle model and is known; Plosses
is calculated with the help of inputs: torque T and angular speed ω. The powerPtransmission is given by P1 = U1 · I1 is the output power at the DC link. It isconsidered as positive when power is absorbed by the machine acting as motor andnegative when power is delivered as generator. Since the brushless DC motor doesnot have internal commutation, it needs an inverter to convert the DC voltage U1
to 3-phase AC as shown in Figure 3.5. For this purpose, an inverter is needed. Therelationship between P1 and P2 can be calculated by stationary maps where efficiency
3.3 Modeling and plausibility assessment of components 23
Electrical
machine
T2
w2
P1 1. 1= I U
P1 1. 1= I UFrom DC/DC
through
inverter
(DC/AC)
To DC/DC
through
inverter
(AC/DC)From
vehicle
model
P2 2. 2= I U
Figure 3.5: Representation of motor/generator
LsM RsM
Uq *1
Iq
LsM RsM
Ud *2
Id
Figure 3.6: Circuit diagram of motor model
η is a function of T and ω [GS07]. The dependency between armature current andvoltage, and input current and voltage is determined by motor controller. DC/DCconverters apply a switching control mechanism and chop the supply DC voltageinto segments. The average value of the voltage is determined by the duty cycle.
According to [GS07], torque generated at the rotor shaft is given by
Tm(t) =3
2· pol · ϕMotor(t) · Iq(t), (3.4)
and,
d
dtω2(t) =
Tm(t)− T2(t)
ΘMotor
, (3.5)
where pol is the number of pole pairs and ϕMotor is the mutual flux linkage, Iq isthe q axis component for stator current, T2 is the load torque, and ΘMotor is themoment of inertia. Since a quasi-static model is considered, therefore,
d
dtω2(t) = 0 (3.6)
According to [GS07], from Figure 3.6 the kirschhoff’s voltage law, as applied to thestator (d-q axes) yields,
Uq = RsM · Iq + LsM · d
dtIq + pol · ω2 · ϕMotor + LsM · pol · ω2 · Id, (3.7)
Ud = RsM · Id + LsM · d
dtId − LsM · pol · ω2 · Iq, (3.8)
24 Chapter 3. Hybrid vehicle: Components and configurations
where, LsM and RsM are inductance and resistance of the stator, Ud, Uq and Id, Iq arethe d-q axes components for stator voltage and current. The relationship betweenT2 and ω2 as derived from equations 3.4-3.8 is given by
T2 =3
2· pol ·ϕMotor ·
RsM · Uq − pol · ω2 ·RsM · ϕMotor − pol · ω2 · Ls · Ud
R2s ·+pole2 · ω2
2 · L2s
. (3.9)
Considering L2s to be negligible, T2 can be represented as an affine function of ω2 as
explained in [GS07]. Thus, the expression for Uq is given by
Uq =2 ·RsM · T2
3 · pol · ϕMotor
+2 · L2
s · pol · ω2 · T2
3 · RsM · ϕMotor
+ pol · ω2 · ϕMotor. (3.10)
The generation and waveform of stator phase voltages is determined by the sequenceof switch operation of the inverter connected to the motor. The power balance atthe two sides of the inverter is given as [GS07]
P1 =3
2· (Uq · Iq + Ud · Id) + Plosses (3.11)
where Plosses is calculated in [GS07] as
Plosses =2
3
T 22
ϕ2Motor
·(RsM
pol2+
L2sM · ω2
2
RsM
)
+ Pinverterloss. (3.12)
In order to calculate the inverter losses, phase voltage (Ueff or U) and current (Ieff )are calculated as
Ieff =PMotor
Ueff ·√3 · cosϕ
=PMotor ·
√2
U ·√3 · cosϕ
, (3.13)
where cosϕ is the power factor.
The inverter circuit mainly consists of IGBTs and diodes. It is an important taskof the inverter to ensure both motor and generator operations of the brushless DCmotor. The chosen approach in this work as according to [HEMF10], is to calculatethe switching and conduction losses of the inverter. The 3-phase motor current isreduced to a single phase. Again, considering a quasi-static modeling approach, theswitching losses can be calculated as [HEMF10]
PSW =fSW · ESW · I · UBus
π · I0 · U0
, (3.14)
where the switching losses ESW lie in the operating point U0, I0 and are proportionalto the switching frequency fSW , bus voltage UBus, and switching current I0. thecalculation of conduction losses (at the diodes and IGBTs) is as follows
PDC−IGBT = VCE0·I ·(
1
2π+
mACDC · cosϕ8
)
+rI ·I2·(1
8+
mACDC · cosϕ3π
)
, (3.15)
3.3 Modeling and plausibility assessment of components 25
Pow
er
[kW
]
Time [s]
Pref
Figure 3.7: HEV power demand according NEDC drive cycle
PDC−D = VF0 · I ·(
1
2π+
mACDC · cosϕ8
)
+rD · I2 ·(1
8− mACDC · cosϕ
3π
)
, (3.16)
with
mACDC =U
UBus
, I =
√2
3· Ieff , (3.17)
where U and I are the peak values of motor voltage and current and mACDC givesthe relation between motor peak voltage and bus voltage. The voltage and resistanceVCE0 and rI for the IGBTs and VF0 and rD for the diodes are responsible for theconduction losses. The parameters chosen in this work are according to [HEMF10].The total inverter loss is given by
Pinverterloss = 6 · [PSW + PDC−IGBT + PDC−D] , (3.18)
The power at the bus can now be calculated as
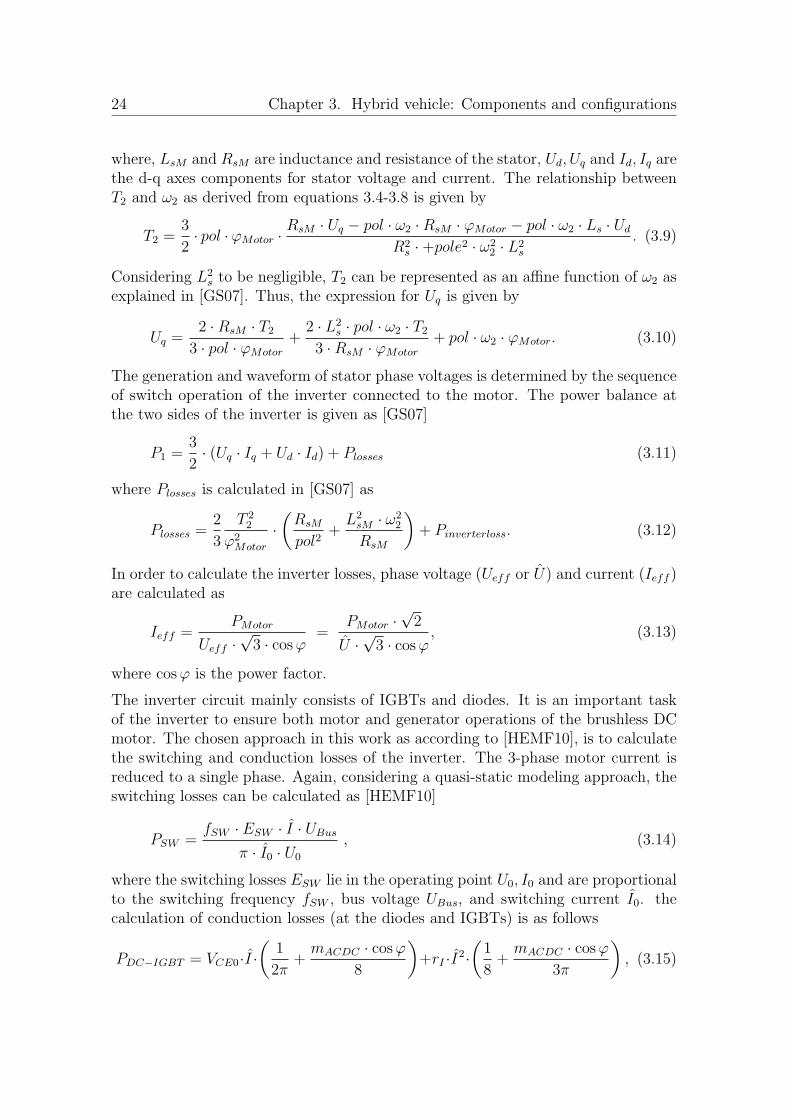
Pbus = PMotor + Pinverterloss , (3.19)
The load profile corresponding to the velocity-time profile of the input drive cycleis calculated as shown in Figure 3.7. This load profile corresponds to the bus powerPbus. This variation of power with time is termed as power demand in this work.
3.3.3 Fuel cell
Fuel cells are electrochemical devices that convert chemical energy to electrical en-ergy. Unlike internal combustion engines, they deliver pure electrical energy. Fuel
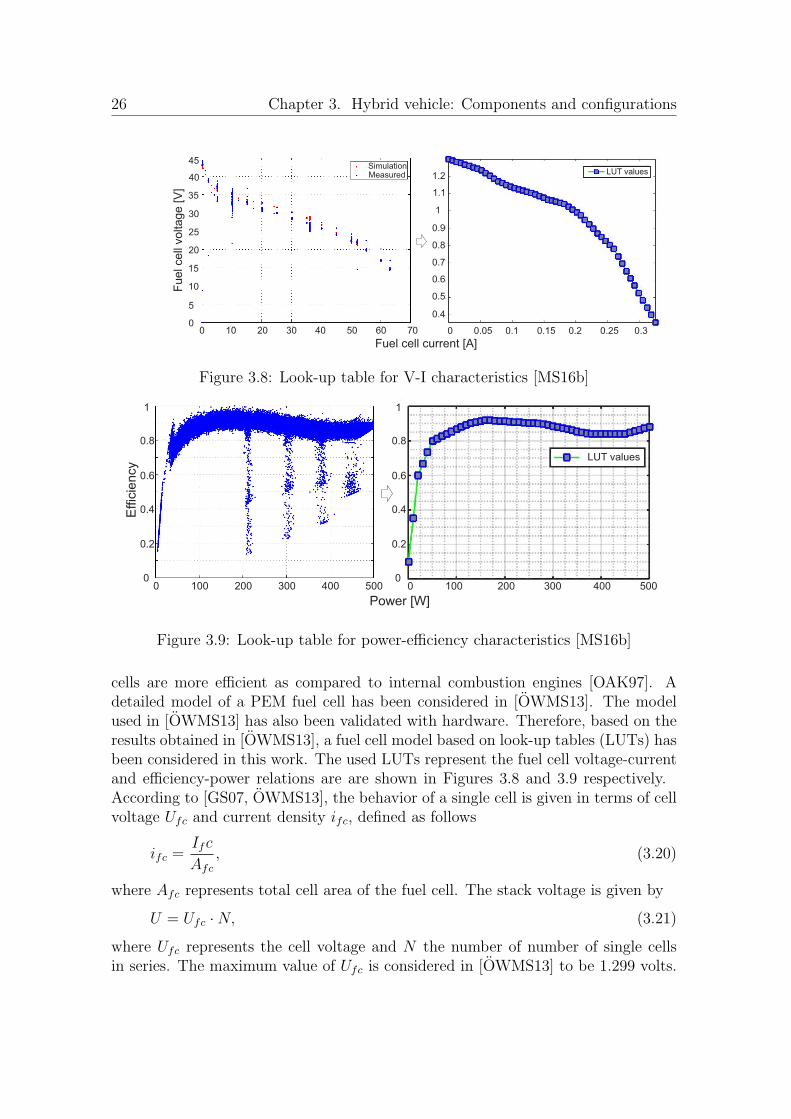
26 Chapter 3. Hybrid vehicle: Components and configurations
Fuel cell
voltage [V
]
Fuel cell current [A]0 0.05 0.1 0.15 0.2 0.25 0.3
1.2
1.1
1
0.9
0.8
0.7
0.6
0.5
0.4
MeasuredSimulation
45
40
35
30
25
20
15
10
5
00 10 20 30 40 50 60 70
LUT values
Figure 3.8: Look-up table for V-I characteristics [MS16b]
1
0.8
0.6
0.4
0.2
0
LUT values
Effi
cie
ncy
Power [W]
1
0.8
0.6
0.4
0.2
00 100 200 300 400 500 0 100 200 300 400 500
Figure 3.9: Look-up table for power-efficiency characteristics [MS16b]
cells are more efficient as compared to internal combustion engines [OAK97]. Adetailed model of a PEM fuel cell has been considered in [OWMS13]. The modelused in [OWMS13] has also been validated with hardware. Therefore, based on theresults obtained in [OWMS13], a fuel cell model based on look-up tables (LUTs) hasbeen considered in this work. The used LUTs represent the fuel cell voltage-currentand efficiency-power relations are are shown in Figures 3.8 and 3.9 respectively.According to [GS07, OWMS13], the behavior of a single cell is given in terms of cellvoltage Ufc and current density ifc, defined as follows
ifc =Ifc
Afc
, (3.20)
where Afc represents total cell area of the fuel cell. The stack voltage is given by
U = Ufc ·N, (3.21)
where Ufc represents the cell voltage and N the number of number of single cellsin series. The maximum value of Ufc is considered in [OWMS13] to be 1.299 volts.
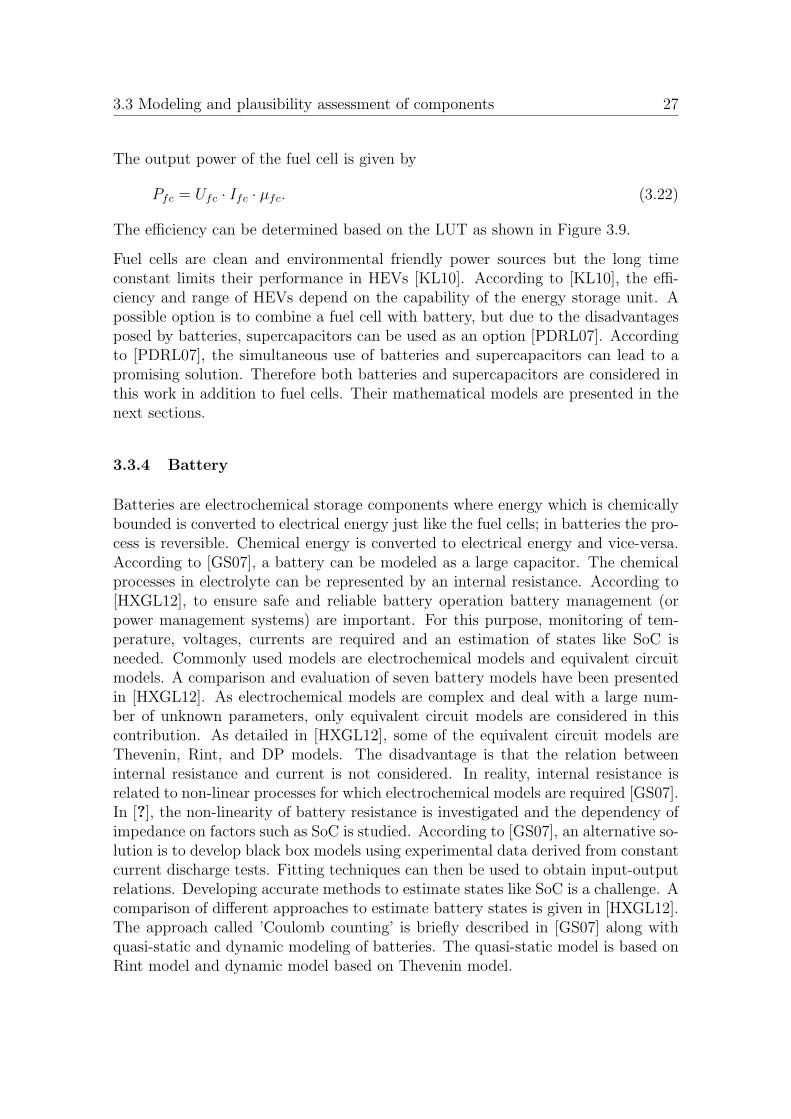
3.3 Modeling and plausibility assessment of components 27
The output power of the fuel cell is given by
Pfc = Ufc · Ifc · µfc. (3.22)
The efficiency can be determined based on the LUT as shown in Figure 3.9.
Fuel cells are clean and environmental friendly power sources but the long timeconstant limits their performance in HEVs [KL10]. According to [KL10], the effi-ciency and range of HEVs depend on the capability of the energy storage unit. Apossible option is to combine a fuel cell with battery, but due to the disadvantagesposed by batteries, supercapacitors can be used as an option [PDRL07]. Accordingto [PDRL07], the simultaneous use of batteries and supercapacitors can lead to apromising solution. Therefore both batteries and supercapacitors are considered inthis work in addition to fuel cells. Their mathematical models are presented in thenext sections.
3.3.4 Battery
Batteries are electrochemical storage components where energy which is chemicallybounded is converted to electrical energy just like the fuel cells; in batteries the pro-cess is reversible. Chemical energy is converted to electrical energy and vice-versa.According to [GS07], a battery can be modeled as a large capacitor. The chemicalprocesses in electrolyte can be represented by an internal resistance. According to[HXGL12], to ensure safe and reliable battery operation battery management (orpower management systems) are important. For this purpose, monitoring of tem-perature, voltages, currents are required and an estimation of states like SoC isneeded. Commonly used models are electrochemical models and equivalent circuitmodels. A comparison and evaluation of seven battery models have been presentedin [HXGL12]. As electrochemical models are complex and deal with a large num-ber of unknown parameters, only equivalent circuit models are considered in thiscontribution. As detailed in [HXGL12], some of the equivalent circuit models areThevenin, Rint, and DP models. The disadvantage is that the relation betweeninternal resistance and current is not considered. In reality, internal resistance isrelated to non-linear processes for which electrochemical models are required [GS07].In [?], the non-linearity of battery resistance is investigated and the dependency ofimpedance on factors such as SoC is studied. According to [GS07], an alternative so-lution is to develop black box models using experimental data derived from constantcurrent discharge tests. Fitting techniques can then be used to obtain input-outputrelations. Developing accurate methods to estimate states like SoC is a challenge. Acomparison of different approaches to estimate battery states is given in [HXGL12].The approach called ’Coulomb counting’ is briefly described in [GS07] along withquasi-static and dynamic modeling of batteries. The quasi-static model is based onRint model and dynamic model based on Thevenin model.
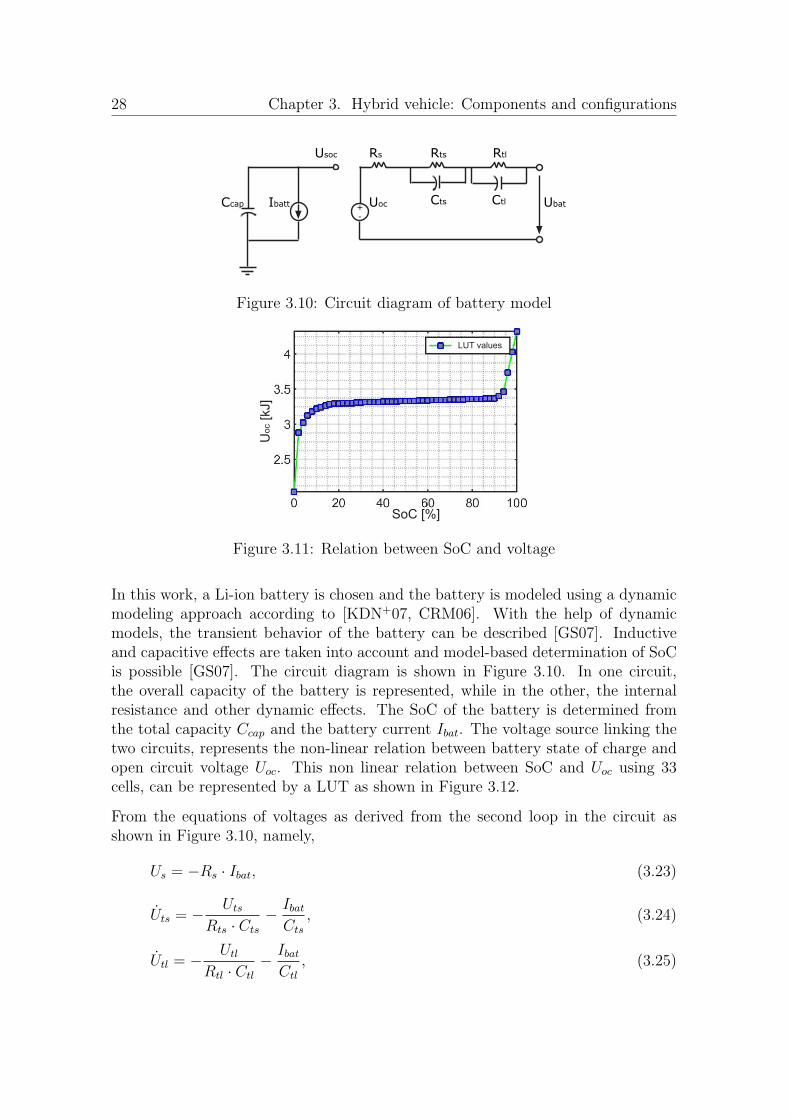
28 Chapter 3. Hybrid vehicle: Components and configurations
Ccap Ibatt
Usoc Rs Rts Rtl
Uoc Cts Ctl Ubat+-
Figure 3.10: Circuit diagram of battery model
U[k
J]
oc
LUT values
SoC [%]
Figure 3.11: Relation between SoC and voltage
In this work, a Li-ion battery is chosen and the battery is modeled using a dynamicmodeling approach according to [KDN+07, CRM06]. With the help of dynamicmodels, the transient behavior of the battery can be described [GS07]. Inductiveand capacitive effects are taken into account and model-based determination of SoCis possible [GS07]. The circuit diagram is shown in Figure 3.10. In one circuit,the overall capacity of the battery is represented, while in the other, the internalresistance and other dynamic effects. The SoC of the battery is determined fromthe total capacity Ccap and the battery current Ibat. The voltage source linking thetwo circuits, represents the non-linear relation between battery state of charge andopen circuit voltage Uoc. This non linear relation between SoC and Uoc using 33cells, can be represented by a LUT as shown in Figure 3.12.
From the equations of voltages as derived from the second loop in the circuit asshown in Figure 3.10, namely,
Us = −Rs · Ibat, (3.23)
Uts = − Uts
Rts · Cts
− Ibat
Cts
, (3.24)
Utl = − Utl
Rtl · Ctl
− Ibat
Ctl
, (3.25)
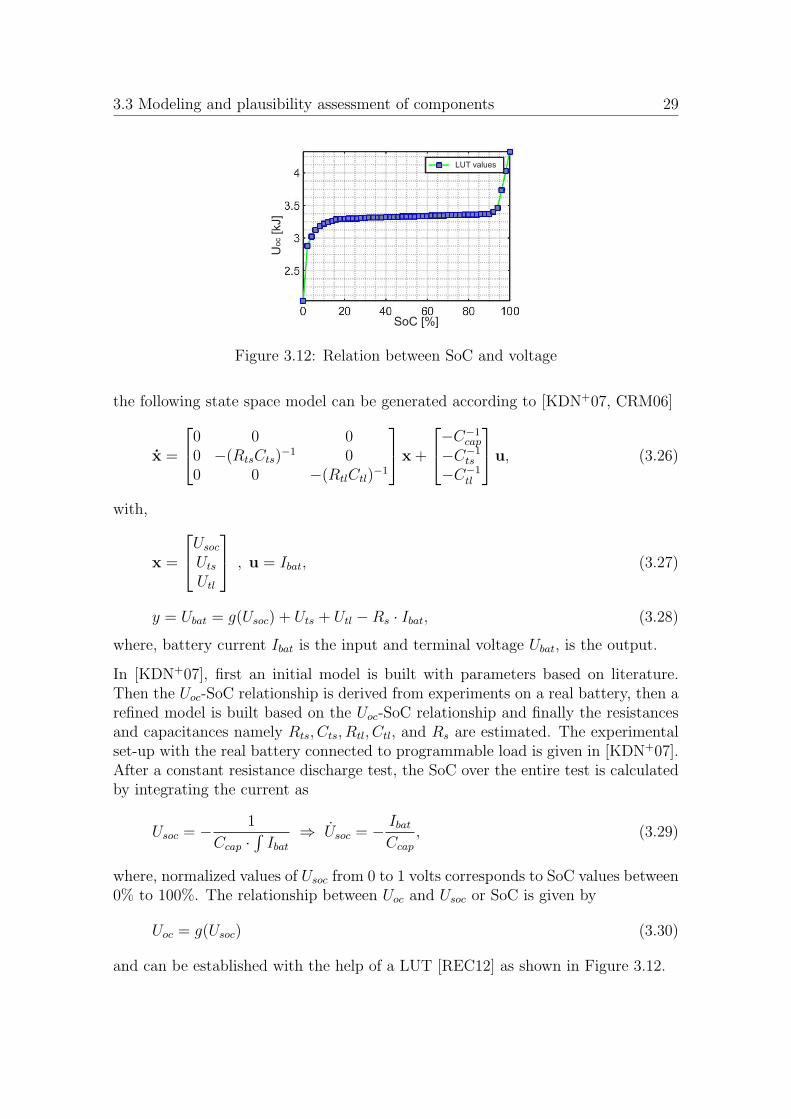
3.3 Modeling and plausibility assessment of components 29
U[k
J]
oc
LUT values
SoC [%]
Figure 3.12: Relation between SoC and voltage
the following state space model can be generated according to [KDN+07, CRM06]
x =
0 0 00 −(RtsCts)
−1 00 0 −(RtlCtl)
−1
x+
−C−1cap
−C−1ts
−C−1tl
u, (3.26)
with,
x =
Usoc
Uts
Utl
, u = Ibat, (3.27)
y = Ubat = g(Usoc) + Uts + Utl −Rs · Ibat, (3.28)
where, battery current Ibat is the input and terminal voltage Ubat, is the output.
In [KDN+07], first an initial model is built with parameters based on literature.Then the Uoc-SoC relationship is derived from experiments on a real battery, then arefined model is built based on the Uoc-SoC relationship and finally the resistancesand capacitances namely Rts, Cts, Rtl, Ctl, and Rs are estimated. The experimentalset-up with the real battery connected to programmable load is given in [KDN+07].After a constant resistance discharge test, the SoC over the entire test is calculatedby integrating the current as
Usoc = − 1
Ccap ·∫Ibat
⇒ Usoc = − Ibat
Ccap
, (3.29)
where, normalized values of Usoc from 0 to 1 volts corresponds to SoC values between0% to 100%. The relationship between Uoc and Usoc or SoC is given by
Uoc = g(Usoc) (3.30)
and can be established with the help of a LUT [REC12] as shown in Figure 3.12.
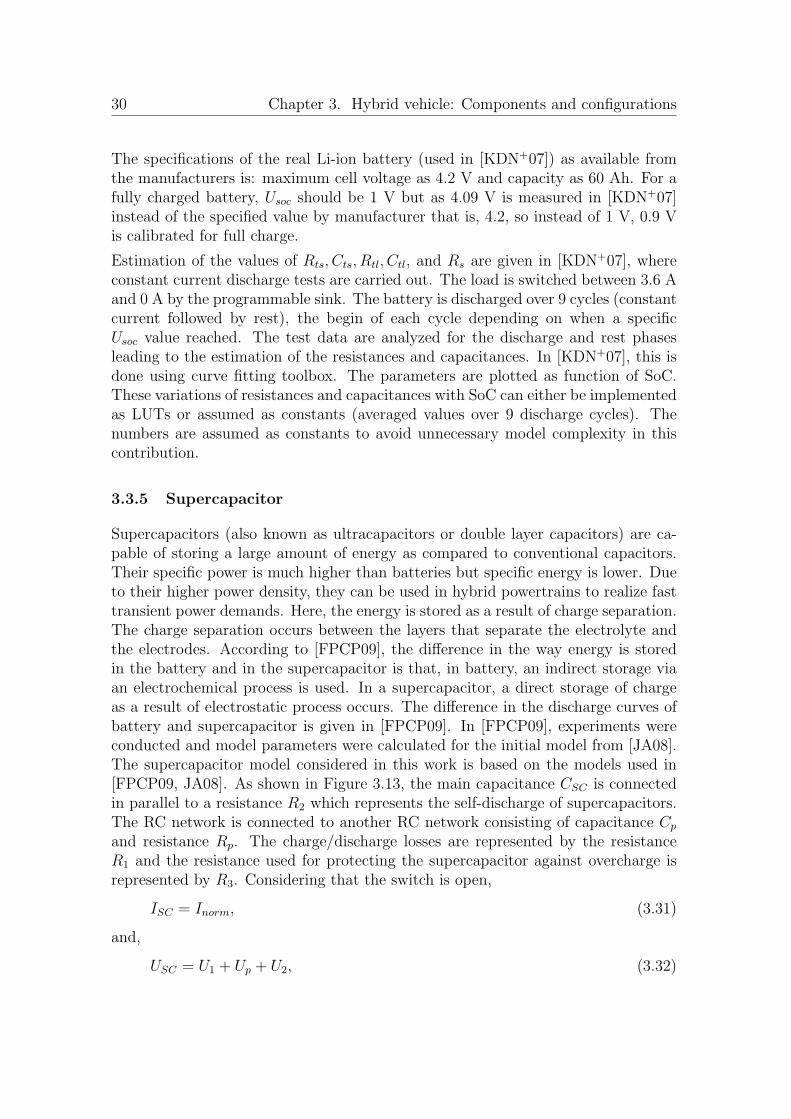
30 Chapter 3. Hybrid vehicle: Components and configurations
The specifications of the real Li-ion battery (used in [KDN+07]) as available fromthe manufacturers is: maximum cell voltage as 4.2 V and capacity as 60 Ah. For afully charged battery, Usoc should be 1 V but as 4.09 V is measured in [KDN+07]instead of the specified value by manufacturer that is, 4.2, so instead of 1 V, 0.9 Vis calibrated for full charge.
Estimation of the values of Rts, Cts, Rtl, Ctl, and Rs are given in [KDN+07], whereconstant current discharge tests are carried out. The load is switched between 3.6 Aand 0 A by the programmable sink. The battery is discharged over 9 cycles (constantcurrent followed by rest), the begin of each cycle depending on when a specificUsoc value reached. The test data are analyzed for the discharge and rest phasesleading to the estimation of the resistances and capacitances. In [KDN+07], this isdone using curve fitting toolbox. The parameters are plotted as function of SoC.These variations of resistances and capacitances with SoC can either be implementedas LUTs or assumed as constants (averaged values over 9 discharge cycles). Thenumbers are assumed as constants to avoid unnecessary model complexity in thiscontribution.
3.3.5 Supercapacitor
Supercapacitors (also known as ultracapacitors or double layer capacitors) are ca-pable of storing a large amount of energy as compared to conventional capacitors.Their specific power is much higher than batteries but specific energy is lower. Dueto their higher power density, they can be used in hybrid powertrains to realize fasttransient power demands. Here, the energy is stored as a result of charge separation.The charge separation occurs between the layers that separate the electrolyte andthe electrodes. According to [FPCP09], the difference in the way energy is storedin the battery and in the supercapacitor is that, in battery, an indirect storage viaan electrochemical process is used. In a supercapacitor, a direct storage of chargeas a result of electrostatic process occurs. The difference in the discharge curves ofbattery and supercapacitor is given in [FPCP09]. In [FPCP09], experiments wereconducted and model parameters were calculated for the initial model from [JA08].The supercapacitor model considered in this work is based on the models used in[FPCP09, JA08]. As shown in Figure 3.13, the main capacitance CSC is connectedin parallel to a resistance R2 which represents the self-discharge of supercapacitors.The RC network is connected to another RC network consisting of capacitance Cp
and resistance Rp. The charge/discharge losses are represented by the resistanceR1 and the resistance used for protecting the supercapacitor against overcharge isrepresented by R3. Considering that the switch is open,
ISC = Inorm, (3.31)
and,
USC = U1 + Up + U2, (3.32)
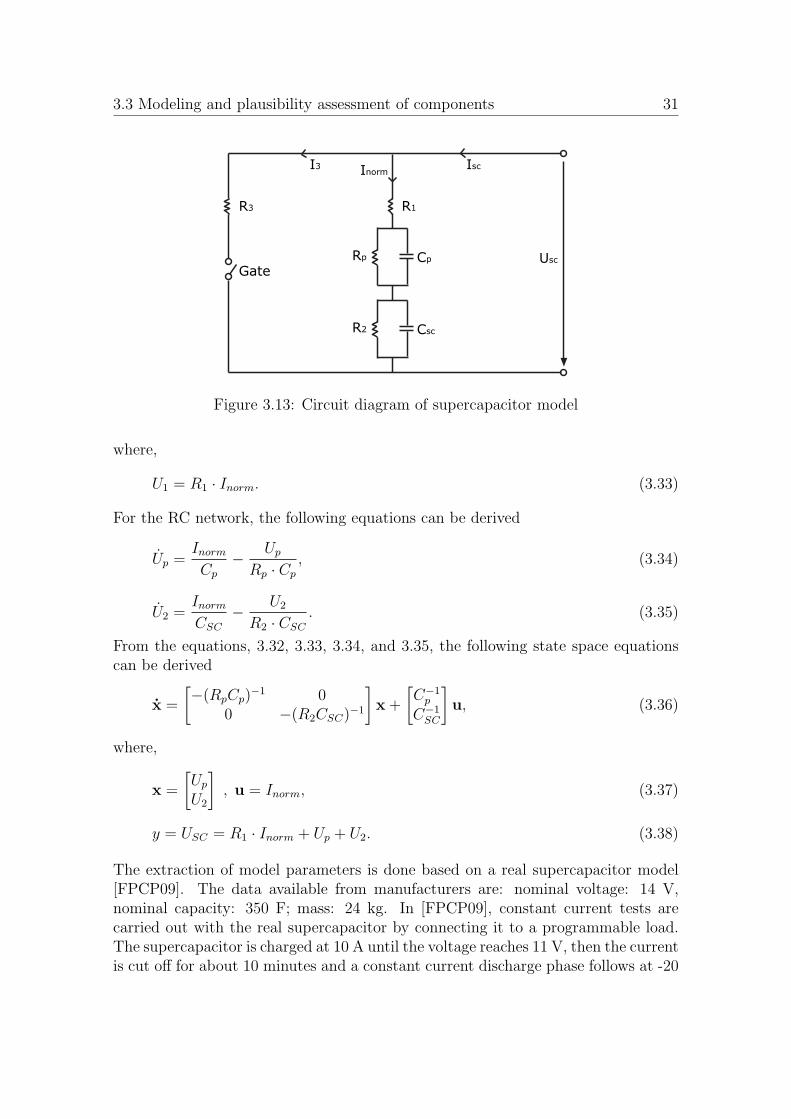
3.3 Modeling and plausibility assessment of components 31
Rp Cp
R2 Csc
R1R3
I3 IscInorm
Usc
Gate
Figure 3.13: Circuit diagram of supercapacitor model
where,
U1 = R1 · Inorm. (3.33)
For the RC network, the following equations can be derived
Up =Inorm
Cp
− Up
Rp · Cp
, (3.34)
U2 =Inorm
CSC
− U2
R2 · CSC
. (3.35)
From the equations, 3.32, 3.33, 3.34, and 3.35, the following state space equationscan be derived
x =
[−(RpCp)
−1 00 −(R2CSC)
−1
]
x+
[C−1
p
C−1SC
]
u, (3.36)
where,
x =
[Up
U2
]
, u = Inorm, (3.37)
y = USC = R1 · Inorm + Up + U2. (3.38)
The extraction of model parameters is done based on a real supercapacitor model[FPCP09]. The data available from manufacturers are: nominal voltage: 14 V,nominal capacity: 350 F; mass: 24 kg. In [FPCP09], constant current tests arecarried out with the real supercapacitor by connecting it to a programmable load.The supercapacitor is charged at 10 A until the voltage reaches 11 V, then the currentis cut off for about 10 minutes and a constant current discharge phase follows at -20
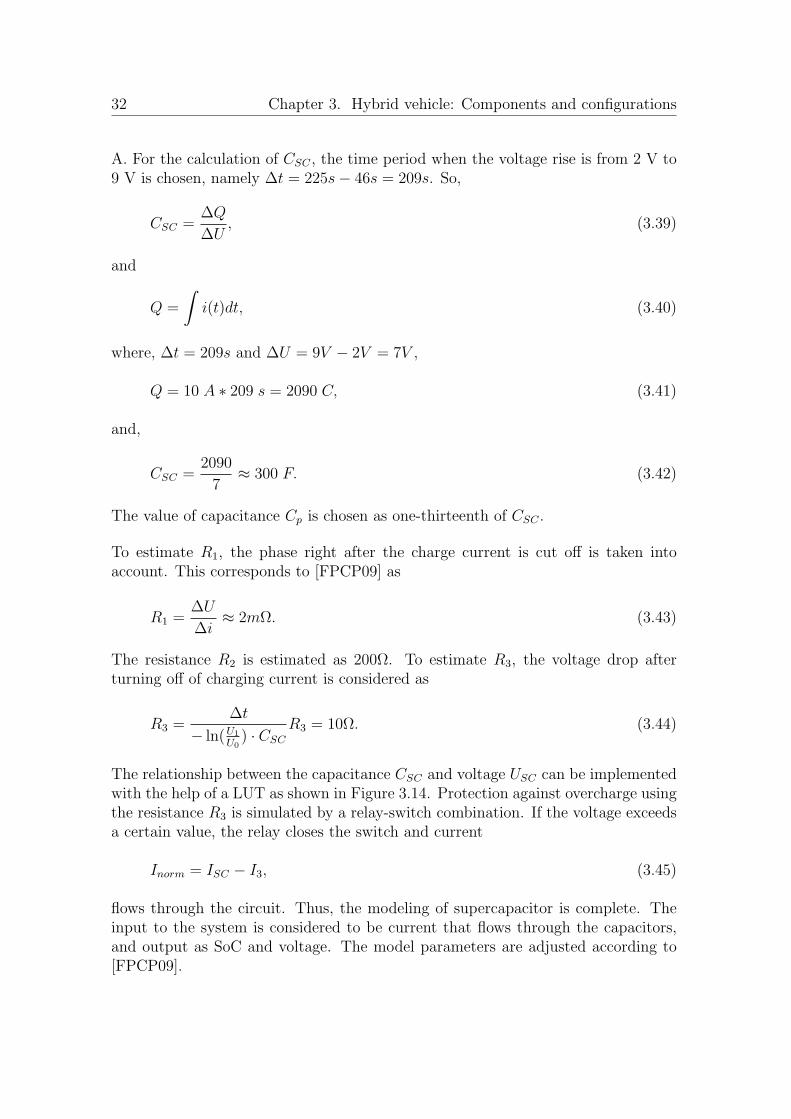
32 Chapter 3. Hybrid vehicle: Components and configurations
A. For the calculation of CSC , the time period when the voltage rise is from 2 V to9 V is chosen, namely ∆t = 225s− 46s = 209s. So,
CSC =∆Q
∆U, (3.39)
and
Q =
∫
i(t)dt, (3.40)
where, ∆t = 209s and ∆U = 9V − 2V = 7V ,
Q = 10 A ∗ 209 s = 2090 C, (3.41)
and,
CSC =2090
7≈ 300 F. (3.42)
The value of capacitance Cp is chosen as one-thirteenth of CSC .
To estimate R1, the phase right after the charge current is cut off is taken intoaccount. This corresponds to [FPCP09] as
R1 =∆U
∆i≈ 2mΩ. (3.43)
The resistance R2 is estimated as 200Ω. To estimate R3, the voltage drop afterturning off of charging current is considered as
R3 =∆t
− ln(U1
U0
) · CSC
R3 = 10Ω. (3.44)
The relationship between the capacitance CSC and voltage USC can be implementedwith the help of a LUT as shown in Figure 3.14. Protection against overcharge usingthe resistance R3 is simulated by a relay-switch combination. If the voltage exceedsa certain value, the relay closes the switch and current
Inorm = ISC − I3, (3.45)
flows through the circuit. Thus, the modeling of supercapacitor is complete. Theinput to the system is considered to be current that flows through the capacitors,and output as SoC and voltage. The model parameters are adjusted according to[FPCP09].
3.3 Modeling and plausibility assessment of components 33
Total drive cycle
Capacity [F
]
Voltage [V]
Figure 3.14: Relationship between capacitance and voltage
L1 R1
UoutGate 0 C2
U0 = 0Gate 1U0 = 1
Uin
C1 L2 R2
3 2 1
IL1 IL2 I0
IC2
Figure 3.15: Circuit diagram of DC/DC converter
3.3.6 DC/DC converter
The purpose of the DC/DC converter in this work is to maintain a constant outputvoltage despite varying input voltage. It is also possible to control the outputvoltage in order to track a reference, but this makes the DC/DC converter morecomplex and expensive. The converter should be dynamic enough to respond to thechanges in demanded power and make the required power available on the bus. Buck,boost and buck-boost DC/DC converters are the commonly known types. DC/DCconverters can also be mono- or bi-directional. Bi-directional DC/DC converters cantransfer power to and from source thus allowing the regenerated energy to be saved.Therefore, they have been considered in this work for the two storage elements:battery and supercapacitor. The DC/DC converter model chosen in this work isa CUK-DC/DC converter with buck-boost behavior and is in accordance with themodel already described in [OWMS13]. The circuit diagram of the DC/DC converteris shown in Figure 3.15. The two states of the DC/DC converter can given as
1. Gate 0 is closed and Gate 1 open ⇒ u0 = 0 ; u1 = 1 ,
2. Gate 0 is open und Gate 1 closed ⇒ u0 = 1 ; u1 = 2 .
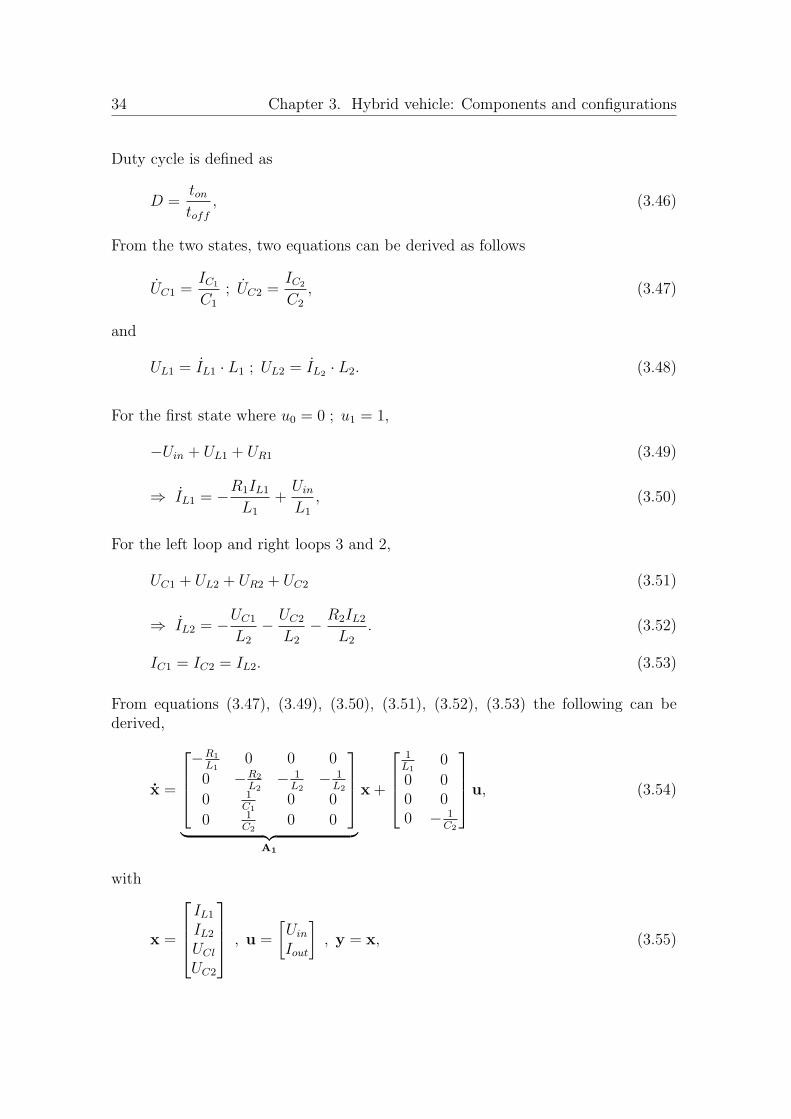
34 Chapter 3. Hybrid vehicle: Components and configurations
Duty cycle is defined as
D =ton
toff, (3.46)
From the two states, two equations can be derived as follows
UC1 =IC1
C1
; UC2 =IC2
C2
, (3.47)
and
UL1 = IL1 · L1 ; UL2 = IL2· L2. (3.48)
For the first state where u0 = 0 ; u1 = 1,
−Uin + UL1 + UR1 (3.49)
⇒ IL1 = −R1IL1
L1
+Uin
L1
, (3.50)
For the left loop and right loops 3 and 2,
UC1 + UL2 + UR2 + UC2 (3.51)
⇒ IL2 = −UC1
L2
− UC2
L2
− R2IL2
L2
. (3.52)
IC1 = IC2 = IL2. (3.53)
From equations (3.47), (3.49), (3.50), (3.51), (3.52), (3.53) the following can bederived,
x =
−R1
L1
0 0 0
0 −R2
L2
− 1L2
− 1L2
0 1C1
0 0
0 1C2
0 0
︸ ︷︷ ︸
A1
x+
1L1
0
0 00 00 − 1
C2
u, (3.54)
with
x =
IL1IL2UCl
UC2
, u =
[Uin
Iout
]
, y = x, (3.55)
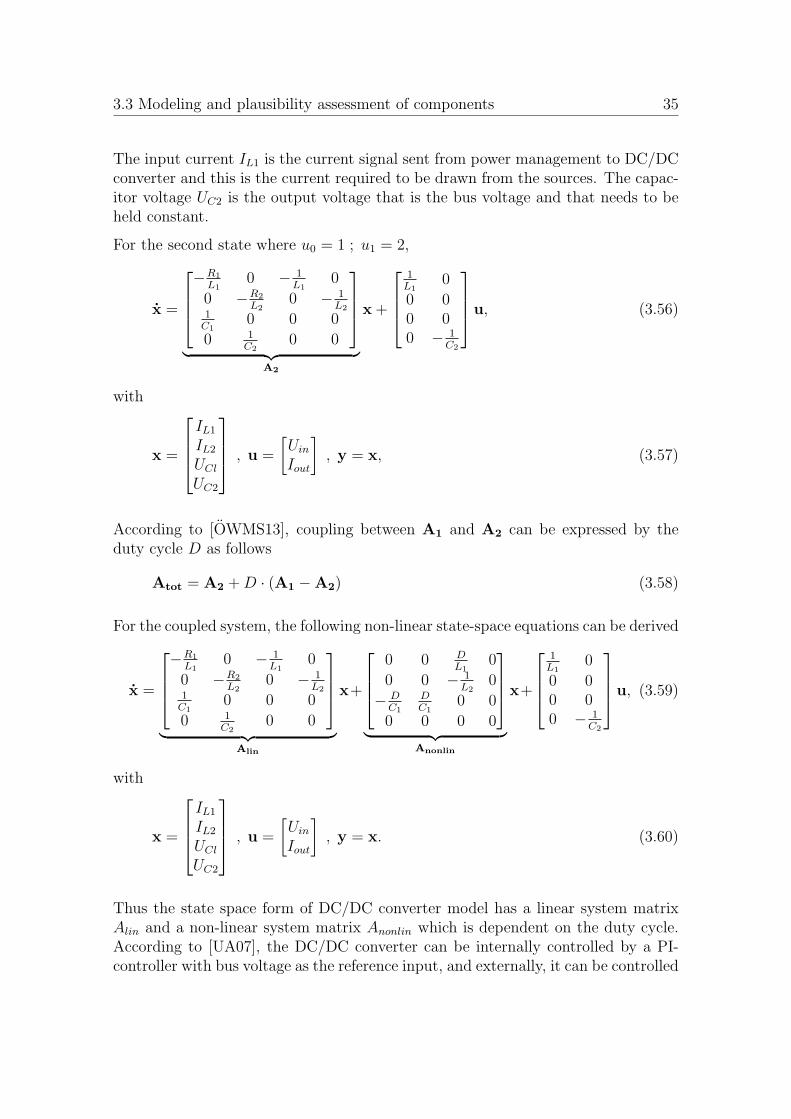
3.3 Modeling and plausibility assessment of components 35
The input current IL1 is the current signal sent from power management to DC/DCconverter and this is the current required to be drawn from the sources. The capac-itor voltage UC2 is the output voltage that is the bus voltage and that needs to beheld constant.
For the second state where u0 = 1 ; u1 = 2,
x =
−R1
L1
0 − 1L1
0
0 −R2
L2
0 − 1L2
1C1
0 0 0
0 1C2
0 0
︸ ︷︷ ︸
A2
x+
1L1
0
0 00 00 − 1
C2
u, (3.56)
with
x =
IL1IL2UCl
UC2
, u =
[Uin
Iout
]
, y = x, (3.57)
According to [OWMS13], coupling between A1 and A2 can be expressed by theduty cycle D as follows
Atot = A2 +D · (A1 −A2) (3.58)
For the coupled system, the following non-linear state-space equations can be derived
x =
−R1
L1
0 − 1L1
0
0 −R2
L2
0 − 1L2
1C1
0 0 0
0 1C2
0 0
︸ ︷︷ ︸
Alin
x+
0 0 DL1
0
0 0 − 1L2
0
− DC1
DC1
0 0
0 0 0 0
︸ ︷︷ ︸
Anonlin
x+
1L1
0
0 00 00 − 1
C2
u, (3.59)
with
x =
IL1IL2UCl
UC2
, u =
[Uin
Iout
]
, y = x. (3.60)
Thus the state space form of DC/DC converter model has a linear system matrixAlin and a non-linear system matrix Anonlin which is dependent on the duty cycle.According to [UA07], the DC/DC converter can be internally controlled by a PI-controller with bus voltage as the reference input, and externally, it can be controlled
36 Chapter 3. Hybrid vehicle: Components and configurations
by the power management controller that sends the required current output signalto the converter. The switching losses of the DC/DC converter can be calculatedbased on a LUT which is based on the validated results from [Bru15, Bru14]. Fromthis LUT, the energy conversion efficiency µDC/DC can be calculated. Thereforefrom,
Pout = PDC/DC · µDC/DC = Iout · UC2 · µDC/DC (3.61)
the output power of the converter Pout can be determined.
3.3.6.1 Simplification of the DC/DC converter model
The model of DC/DC converter considered in the previous section is based on com-plex dynamical equations and therefore, increases the computational cost of thesystem. Due to the presence of three DC/DC converters, the simulation time andmemory required are large. Since the optimization of power management (discussedin chapter 4) is considered as a separate offline process, therefore, a simplified ver-sion of the DC/DC converter for the optimization loop is used to ease the simulationprocess. The optimization algorithm involves a complicated and time-consumingprocedure to optimize the controller parameters and therefore, a simplified versionof the HEV model (which contains simplified DC/DC converter models) is helpfulin generating solutions at lower computational cost and memory. In the simplifiedDC/DC converter model, only the losses are taken into account and the switch-ing dynamics omitted. The calculation of µDC/DC based on LUT has already beenmention and therefore from 3.61,
Pin · µDC/DC = Pout ⇒ Iin = Iout ·Uout
Uin
· 1
µDC/DC
. (3.62)
The main task of DC/DC converter here is to regulate the voltage level. In otherwords, it is sufficient to consider the power balance at the two sides of the converter[GS07]. The term Iin which is the input to the converter, is the required currentfrom sources to be calculated by power management.
3.3.7 Theoretical sizing of components
3.3.7.1 Component sizing
The fuel cell, being a primary energy source, should be able to supply the totalrequired power as demanded by the given drive cycle. For the given drive cycle, thetotal energy can be calculated as
Etotal = 3821 kJ, (3.63)
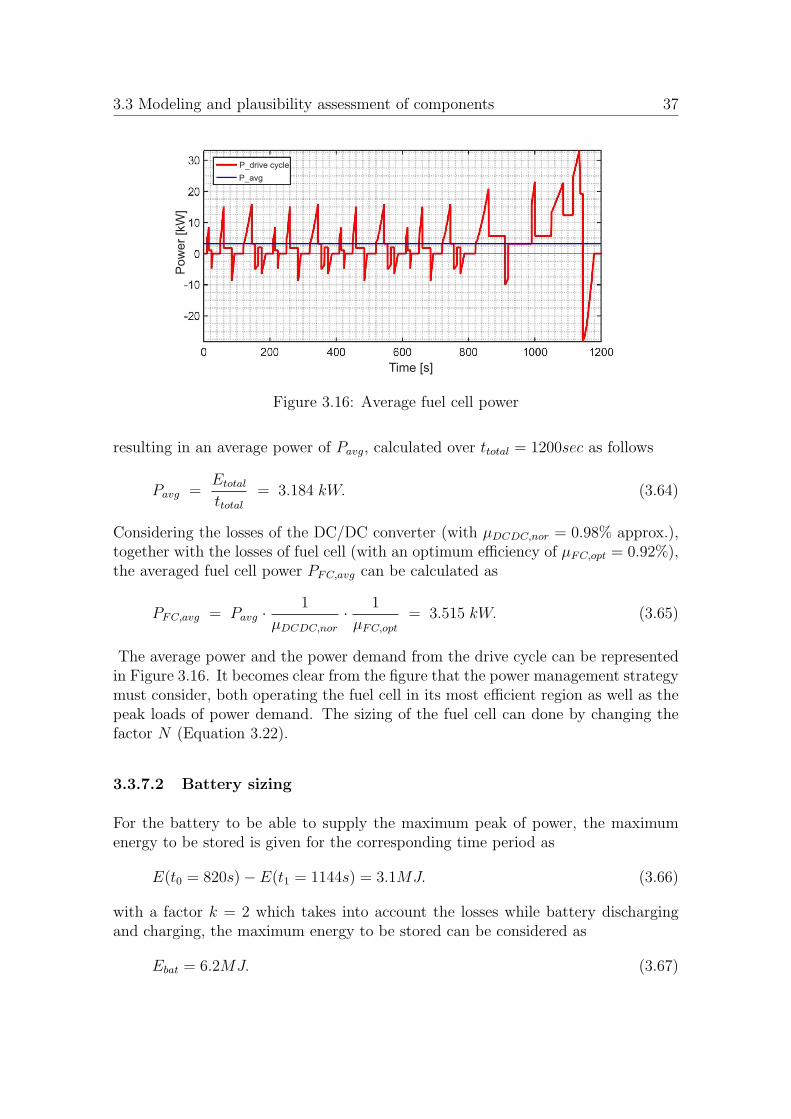
3.3 Modeling and plausibility assessment of components 37
Po
we
r [k
W]
Time [s]
P_drive cycle
P_avg
Figure 3.16: Average fuel cell power
resulting in an average power of Pavg, calculated over ttotal = 1200sec as follows
Pavg =Etotal
ttotal= 3.184 kW. (3.64)
Considering the losses of the DC/DC converter (with µDCDC,nor = 0.98% approx.),together with the losses of fuel cell (with an optimum efficiency of µFC,opt = 0.92%),the averaged fuel cell power PFC,avg can be calculated as
PFC,avg = Pavg ·1
µDCDC,nor
· 1
µFC,opt
= 3.515 kW. (3.65)
The average power and the power demand from the drive cycle can be representedin Figure 3.16. It becomes clear from the figure that the power management strategymust consider, both operating the fuel cell in its most efficient region as well as thepeak loads of power demand. The sizing of the fuel cell can done by changing thefactor N (Equation 3.22).
3.3.7.2 Battery sizing
For the battery to be able to supply the maximum peak of power, the maximumenergy to be stored is given for the corresponding time period as
E(t0 = 820s)− E(t1 = 1144s) = 3.1MJ. (3.66)
with a factor k = 2 which takes into account the losses while battery dischargingand charging, the maximum energy to be stored can be considered as
Ebat = 6.2MJ. (3.67)
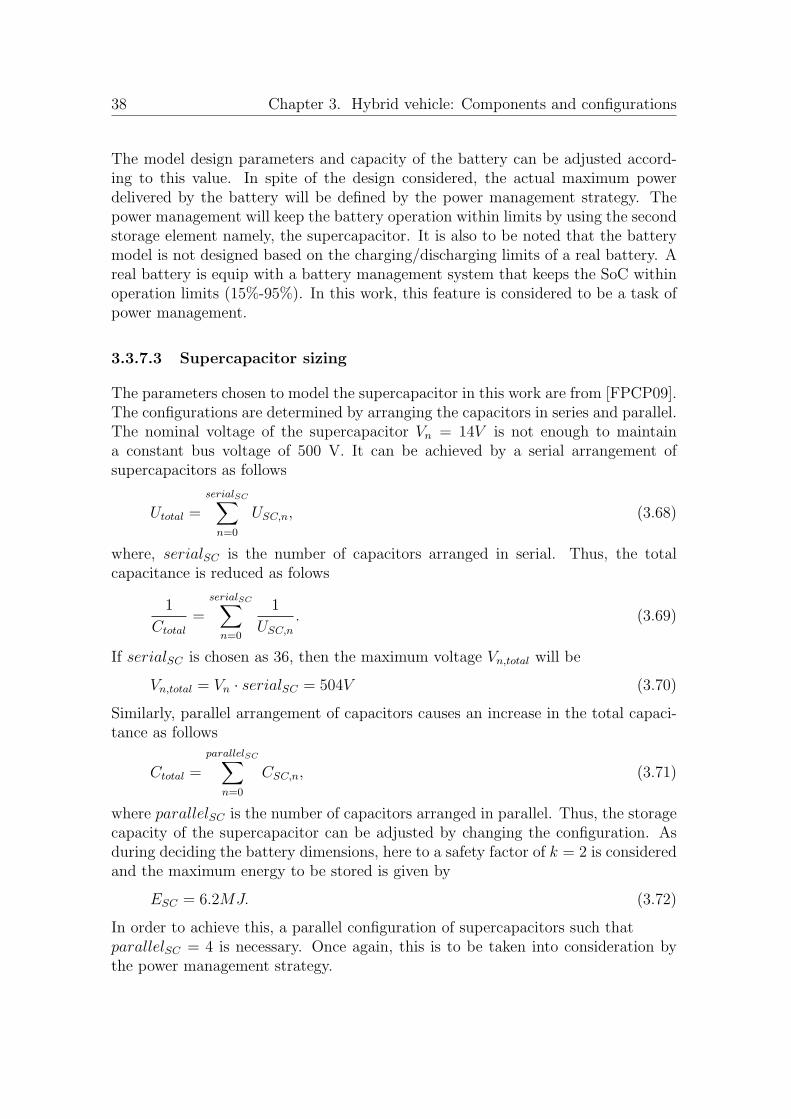
38 Chapter 3. Hybrid vehicle: Components and configurations
The model design parameters and capacity of the battery can be adjusted accord-ing to this value. In spite of the design considered, the actual maximum powerdelivered by the battery will be defined by the power management strategy. Thepower management will keep the battery operation within limits by using the secondstorage element namely, the supercapacitor. It is also to be noted that the batterymodel is not designed based on the charging/discharging limits of a real battery. Areal battery is equip with a battery management system that keeps the SoC withinoperation limits (15%-95%). In this work, this feature is considered to be a task ofpower management.
3.3.7.3 Supercapacitor sizing
The parameters chosen to model the supercapacitor in this work are from [FPCP09].The configurations are determined by arranging the capacitors in series and parallel.The nominal voltage of the supercapacitor Vn = 14V is not enough to maintaina constant bus voltage of 500 V. It can be achieved by a serial arrangement ofsupercapacitors as follows
Utotal =
serialSC∑
n=0
USC,n, (3.68)
where, serialSC is the number of capacitors arranged in serial. Thus, the totalcapacitance is reduced as folows
1
Ctotal
=
serialSC∑
n=0
1
USC,n
. (3.69)
If serialSC is chosen as 36, then the maximum voltage Vn,total will be
Vn,total = Vn · serialSC = 504V (3.70)
Similarly, parallel arrangement of capacitors causes an increase in the total capaci-tance as follows
Ctotal =
parallelSC∑
n=0
CSC,n, (3.71)
where parallelSC is the number of capacitors arranged in parallel. Thus, the storagecapacity of the supercapacitor can be adjusted by changing the configuration. Asduring deciding the battery dimensions, here to a safety factor of k = 2 is consideredand the maximum energy to be stored is given by
ESC = 6.2MJ. (3.72)
In order to achieve this, a parallel configuration of supercapacitors such thatparallelSC = 4 is necessary. Once again, this is to be taken into consideration bythe power management strategy.
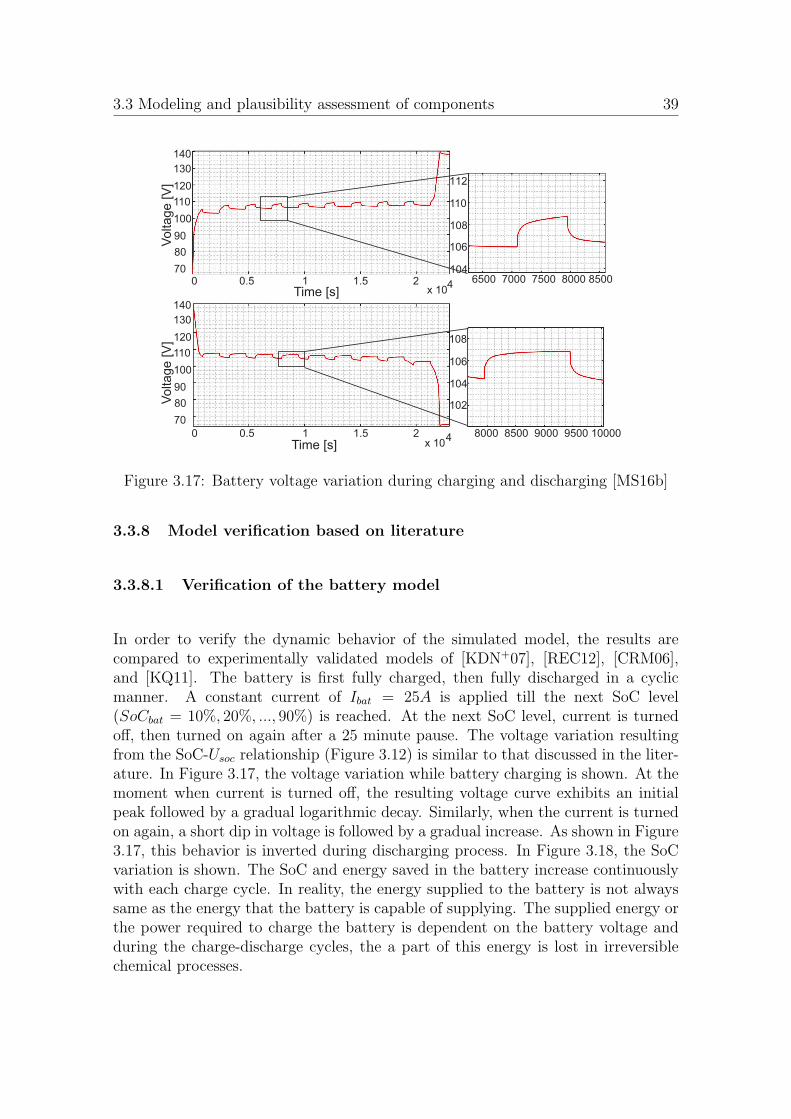
3.3 Modeling and plausibility assessment of components 39
Time [s]0 0.5 1 1.5 2
x 104
Time [s]0 0.5 1 1.5 2
x 104
Vo
lta
ge
[V
]140
130
120
110
100
90
80
70
Vo
lta
ge
[V
]
140
130
120
110
100
90
80
70
800 8500 9000 9500 100000
650 7000 7500 8000 85000
112
110
108
106
104
108
106
104
102
Figure 3.17: Battery voltage variation during charging and discharging [MS16b]
3.3.8 Model verification based on literature
3.3.8.1 Verification of the battery model
In order to verify the dynamic behavior of the simulated model, the results arecompared to experimentally validated models of [KDN+07], [REC12], [CRM06],and [KQ11]. The battery is first fully charged, then fully discharged in a cyclicmanner. A constant current of Ibat = 25A is applied till the next SoC level(SoCbat = 10%, 20%, ..., 90%) is reached. At the next SoC level, current is turnedoff, then turned on again after a 25 minute pause. The voltage variation resultingfrom the SoC-Usoc relationship (Figure 3.12) is similar to that discussed in the liter-ature. In Figure 3.17, the voltage variation while battery charging is shown. At themoment when current is turned off, the resulting voltage curve exhibits an initialpeak followed by a gradual logarithmic decay. Similarly, when the current is turnedon again, a short dip in voltage is followed by a gradual increase. As shown in Figure3.17, this behavior is inverted during discharging process. In Figure 3.18, the SoCvariation is shown. The SoC and energy saved in the battery increase continuouslywith each charge cycle. In reality, the energy supplied to the battery is not alwayssame as the energy that the battery is capable of supplying. The supplied energy orthe power required to charge the battery is dependent on the battery voltage andduring the charge-discharge cycles, the a part of this energy is lost in irreversiblechemical processes.
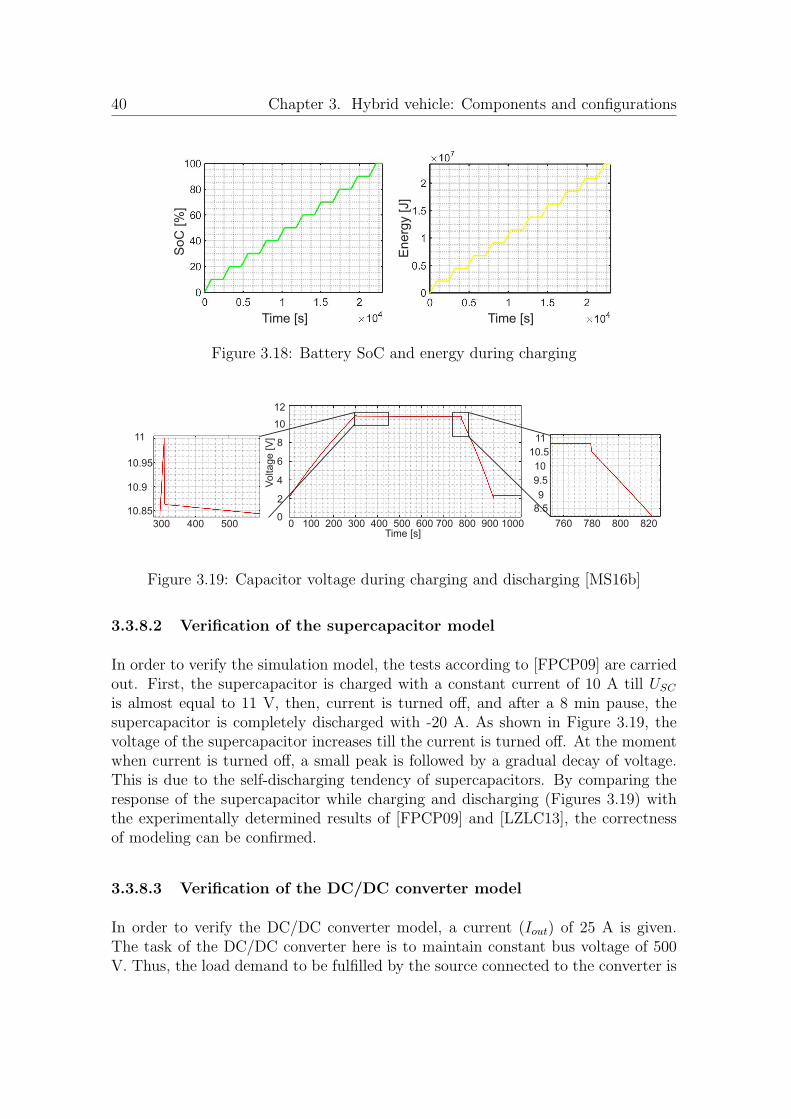
40 Chapter 3. Hybrid vehicle: Components and configurations
Energ
y [J]
Time [s]
SoC
[%
]
Time [s]
Figure 3.18: Battery SoC and energy during charging
Time [s]
11
10.95
10.9
10.85
300 400 500 600 700 800 900 10000 100 200 300 400 500
Voltage [V
]
12
10
8
6
4
2
0760 780 800 820
11
10.5
10
9.5
9
8.5
Figure 3.19: Capacitor voltage during charging and discharging [MS16b]
3.3.8.2 Verification of the supercapacitor model
In order to verify the simulation model, the tests according to [FPCP09] are carriedout. First, the supercapacitor is charged with a constant current of 10 A till USC
is almost equal to 11 V, then, current is turned off, and after a 8 min pause, thesupercapacitor is completely discharged with -20 A. As shown in Figure 3.19, thevoltage of the supercapacitor increases till the current is turned off. At the momentwhen current is turned off, a small peak is followed by a gradual decay of voltage.This is due to the self-discharging tendency of supercapacitors. By comparing theresponse of the supercapacitor while charging and discharging (Figures 3.19) withthe experimentally determined results of [FPCP09] and [LZLC13], the correctnessof modeling can be confirmed.
3.3.8.3 Verification of the DC/DC converter model
In order to verify the DC/DC converter model, a current (Iout) of 25 A is given.The task of the DC/DC converter here is to maintain constant bus voltage of 500V. Thus, the load demand to be fulfilled by the source connected to the converter is
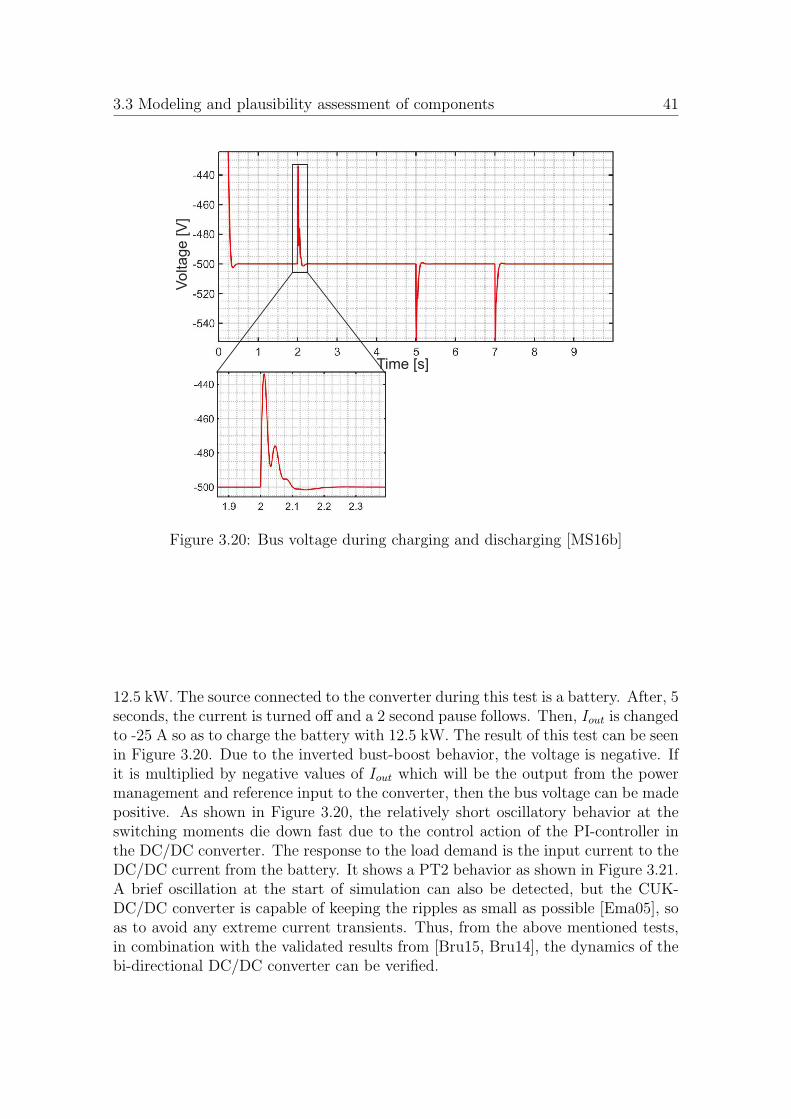
3.3 Modeling and plausibility assessment of components 41
Voltage [V
]
Time [s]
Figure 3.20: Bus voltage during charging and discharging [MS16b]
12.5 kW. The source connected to the converter during this test is a battery. After, 5seconds, the current is turned off and a 2 second pause follows. Then, Iout is changedto -25 A so as to charge the battery with 12.5 kW. The result of this test can be seenin Figure 3.20. Due to the inverted bust-boost behavior, the voltage is negative. Ifit is multiplied by negative values of Iout which will be the output from the powermanagement and reference input to the converter, then the bus voltage can be madepositive. As shown in Figure 3.20, the relatively short oscillatory behavior at theswitching moments die down fast due to the control action of the PI-controller inthe DC/DC converter. The response to the load demand is the input current to theDC/DC current from the battery. It shows a PT2 behavior as shown in Figure 3.21.A brief oscillation at the start of simulation can also be detected, but the CUK-DC/DC converter is capable of keeping the ripples as small as possible [Ema05], soas to avoid any extreme current transients. Thus, from the above mentioned tests,in combination with the validated results from [Bru15, Bru14], the dynamics of thebi-directional DC/DC converter can be verified.
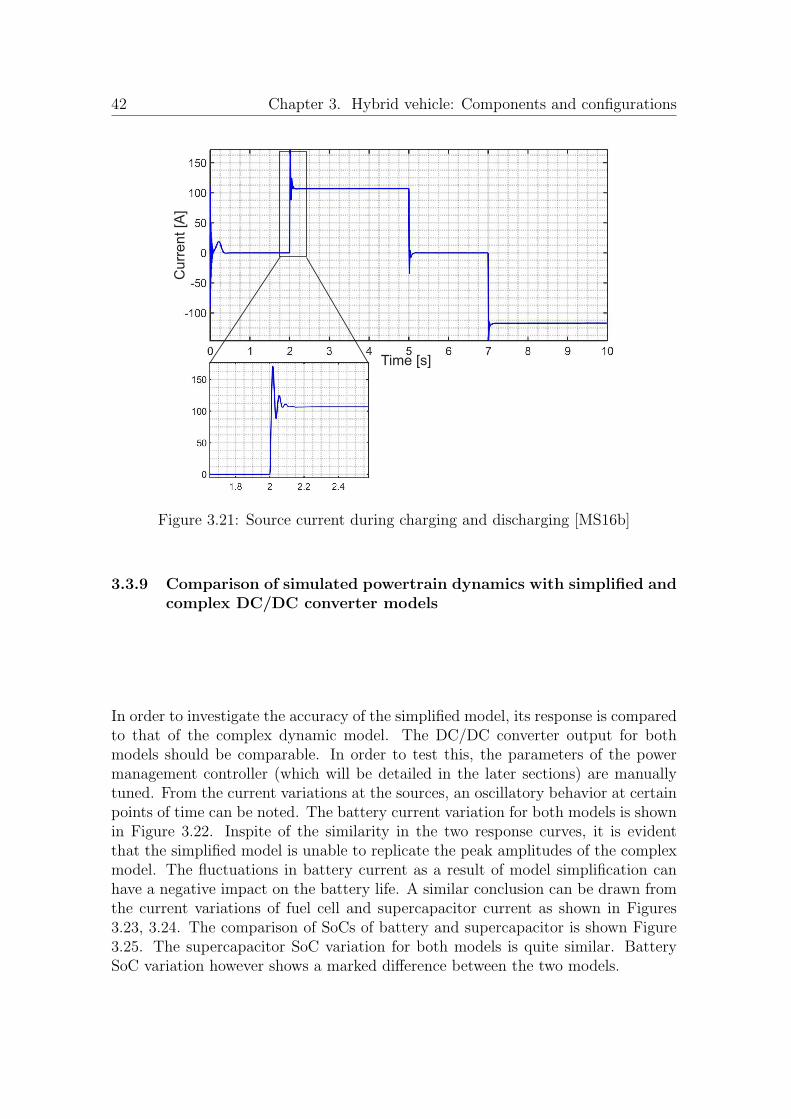
42 Chapter 3. Hybrid vehicle: Components and configurations
Cu
rre
nt
[A]
Time [s]
Figure 3.21: Source current during charging and discharging [MS16b]
3.3.9 Comparison of simulated powertrain dynamics with simplified andcomplex DC/DC converter models
In order to investigate the accuracy of the simplified model, its response is comparedto that of the complex dynamic model. The DC/DC converter output for bothmodels should be comparable. In order to test this, the parameters of the powermanagement controller (which will be detailed in the later sections) are manuallytuned. From the current variations at the sources, an oscillatory behavior at certainpoints of time can be noted. The battery current variation for both models is shownin Figure 3.22. Inspite of the similarity in the two response curves, it is evidentthat the simplified model is unable to replicate the peak amplitudes of the complexmodel. The fluctuations in battery current as a result of model simplification canhave a negative impact on the battery life. A similar conclusion can be drawn fromthe current variations of fuel cell and supercapacitor current as shown in Figures3.23, 3.24. The comparison of SoCs of battery and supercapacitor is shown Figure3.25. The supercapacitor SoC variation for both models is quite similar. BatterySoC variation however shows a marked difference between the two models.
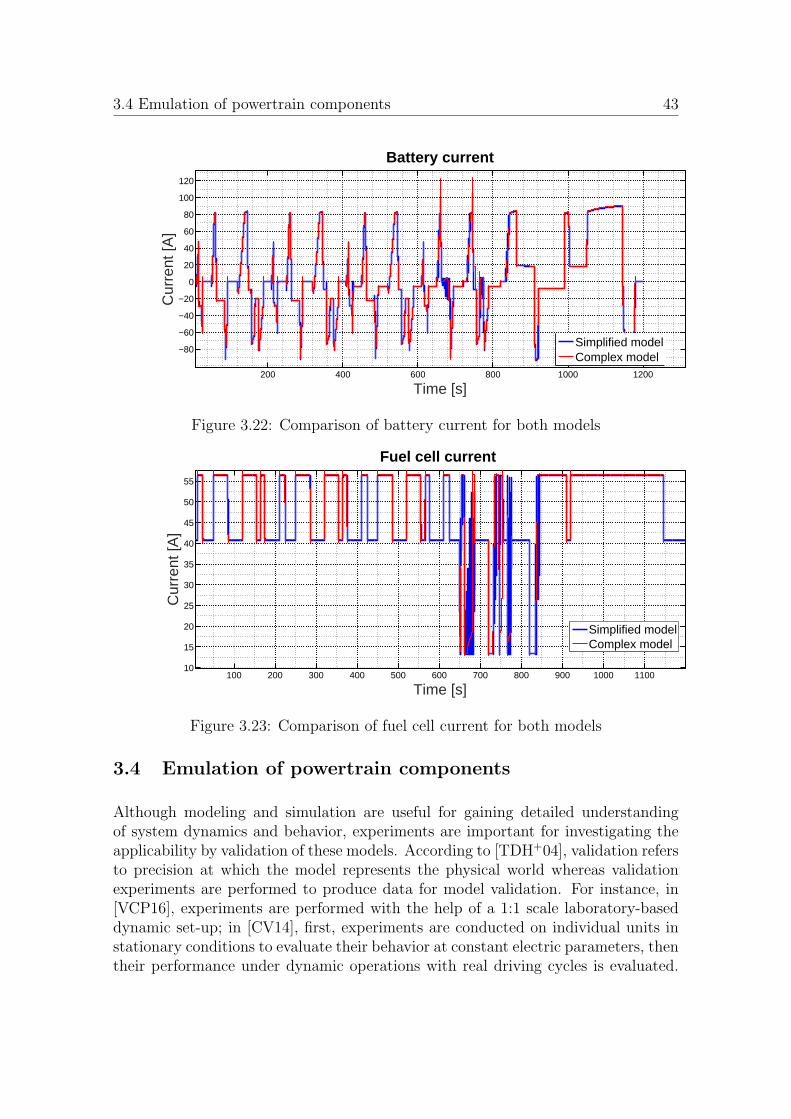
3.4 Emulation of powertrain components 43
200 400 600 800 1000 1200
−80
−60
−40
−20
0
20
40
60
80
100
120
Time [s]
Cur
rent
[A]
Battery current
Simplified modelComplex model
Figure 3.22: Comparison of battery current for both models
100 200 300 400 500 600 700 800 900 1000 110010
15
20
25
30
35
40
45
50
55
Time [s]
Cur
rent
[A]
Fuel cell current
Simplified modelComplex model
Figure 3.23: Comparison of fuel cell current for both models
3.4 Emulation of powertrain components
Although modeling and simulation are useful for gaining detailed understandingof system dynamics and behavior, experiments are important for investigating theapplicability by validation of these models. According to [TDH+04], validation refersto precision at which the model represents the physical world whereas validationexperiments are performed to produce data for model validation. For instance, in[VCP16], experiments are performed with the help of a 1:1 scale laboratory-baseddynamic set-up; in [CV14], first, experiments are conducted on individual units instationary conditions to evaluate their behavior at constant electric parameters, thentheir performance under dynamic operations with real driving cycles is evaluated.
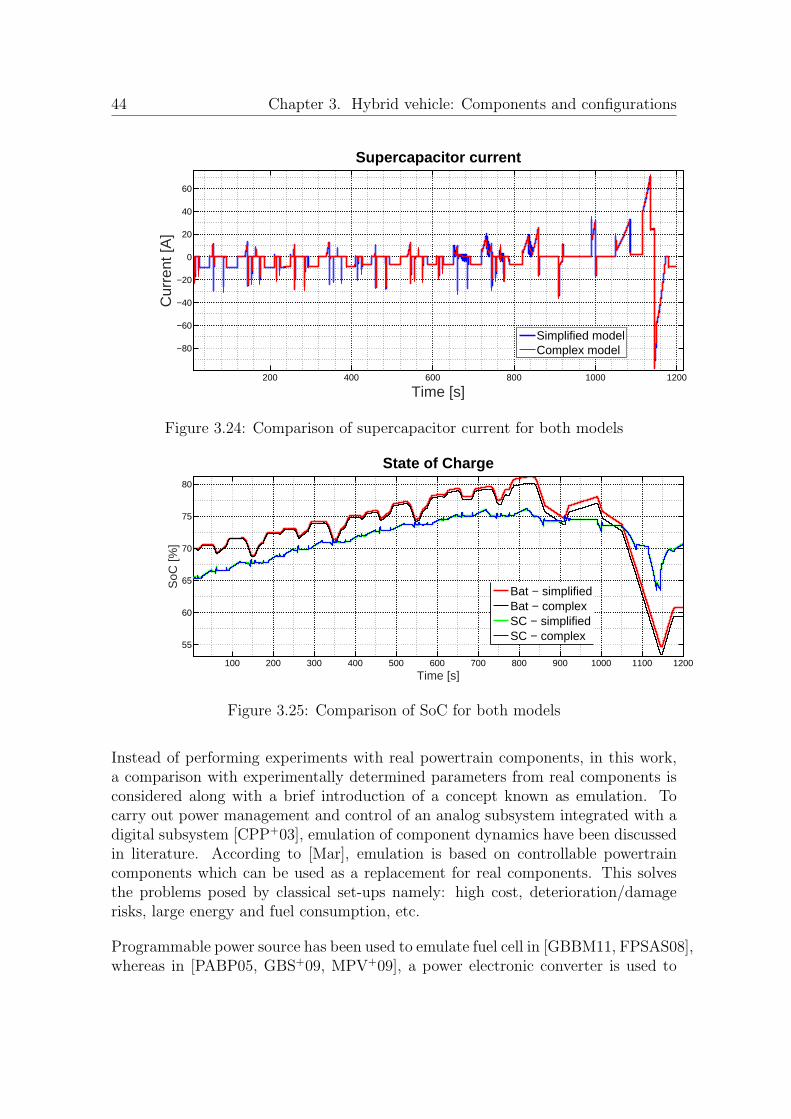
44 Chapter 3. Hybrid vehicle: Components and configurations
200 400 600 800 1000 1200
−80
−60
−40
−20
0
20
40
60
Time [s]
Cur
rent
[A]
Supercapacitor current
Simplified modelComplex model
Figure 3.24: Comparison of supercapacitor current for both models
100 200 300 400 500 600 700 800 900 1000 1100 1200
55
60
65
70
75
80
Time [s]
SoC
[%]
State of Charge
Bat − simplifiedBat − complexSC − simplifiedSC − complex
Figure 3.25: Comparison of SoC for both models
Instead of performing experiments with real powertrain components, in this work,a comparison with experimentally determined parameters from real components isconsidered along with a brief introduction of a concept known as emulation. Tocarry out power management and control of an analog subsystem integrated with adigital subsystem [CPP+03], emulation of component dynamics have been discussedin literature. According to [Mar], emulation is based on controllable powertraincomponents which can be used as a replacement for real components. This solvesthe problems posed by classical set-ups namely: high cost, deterioration/damagerisks, large energy and fuel consumption, etc.
Programmable power source has been used to emulate fuel cell in [GBBM11, FPSAS08],whereas in [PABP05, GBS+09, MPV+09], a power electronic converter is used to
3.4 Emulation of powertrain components 45
emulate fuel cell dynamics. Along with a programmable power source, an additionalelectronic load is added in [GBBM11] to emulate a supercapacitor. Power source-sink combination has also been used to emulate battery dynamics in [CPP+03,Gmb15]. According to [Gmb15], not only batteries and supercapacitors, but alsobi-directional DC/DC converters can be emulated using source-sink combination.In [RC08], emulation of load is considered using voltage source inverter (VSI). TheVSI emulates a three phase induction motor connected to grid. Thus along withpower sources and storage components, load emulation using dynamically control-lable source-sink [RC08], to ensure bi-directional power exchange can also be con-sidered.
As stated in [CPP+03, Gmb15], the problem encountered while using real batteriesfor experimental purposes is that, the discharge and charge history affects the totalcharge level at each cycle. Various battery models have been proposed to considerthese aging effects. However, in the absence of an aging model, an emulator set-upcan be used to realize battery dynamics. Similarly using real fuel cells, which areexpensive components, can lead to an increase in damage risks [PABP05, GBS+09].Thus a compact and easily replaceable emulator set-up is useful when powertrainmodels and control strategies are to be experimentally tested. The process of testingeither real powertrain components or a scaled down version of real components incombination with software models is termed as Hardware-in-the-Loop (HiL) simu-lation/emulation [PABP05].
3.4.1 Powertrain configuration with emulated components
At the Chair of Dynamics and Control (University of Duisburg-Essen), a fuel cell-supercapacitor based Hardware-in-the-Loop (HiL) test rig was built [OWMS13]. Itwas later modified and generalized for the emulation of different powertrains for ex-ample hybrid hydraulic powertrains and wind energy conversion systems [MOS14,LMMS13] along with hybrid electric powertrains. In this work, a further general-ization is considered by replacing all the real powertrain components by emulatedcomponents. The experimental set-up is shown in Figure 3.26 and is explained inFigure 3.27. On the left side is the model layer comprising of the configurationshown in Figure 3.3. This simulation model of HEV along with the supervisory con-troller are compiled into a real time interface that enables communication with theemulation layer. On the right side is the emulation layer comprising of real hardwarecomponents. Here, the simulated models of fuel cell and DC/DC converter can beconsidered as a single unit and the corresponding hardware component- controllablepower source q1, can be used. Similarly, for battery and supercapacitor, source-sinkcombination q2− s2 and source-sink combination q3− s3 can be used. Correspond-ing to the backward simulated part, the power demand or load can be emulated byanother source-sink combination q4− s4.
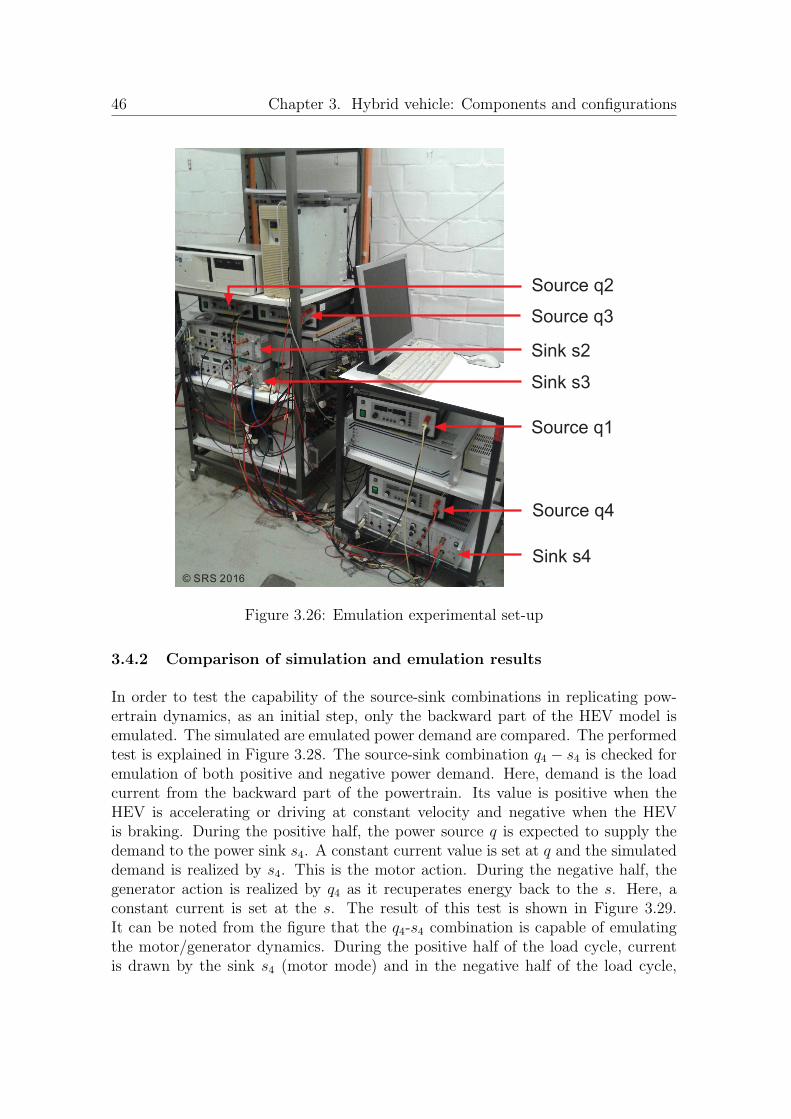
46 Chapter 3. Hybrid vehicle: Components and configurations
Source q2
Source q3
Sink s2
Sink s3
Source q1
Source q4
Sink s4© SRS 2016
Figure 3.26: Emulation experimental set-up
3.4.2 Comparison of simulation and emulation results
In order to test the capability of the source-sink combinations in replicating pow-ertrain dynamics, as an initial step, only the backward part of the HEV model isemulated. The simulated are emulated power demand are compared. The performedtest is explained in Figure 3.28. The source-sink combination q4 − s4 is checked foremulation of both positive and negative power demand. Here, demand is the loadcurrent from the backward part of the powertrain. Its value is positive when theHEV is accelerating or driving at constant velocity and negative when the HEVis braking. During the positive half, the power source q is expected to supply thedemand to the power sink s4. A constant current value is set at q and the simulateddemand is realized by s4. This is the motor action. During the negative half, thegenerator action is realized by q4 as it recuperates energy back to the s. Here, aconstant current is set at the s. The result of this test is shown in Figure 3.29.It can be noted from the figure that the q4-s4 combination is capable of emulatingthe motor/generator dynamics. During the positive half of the load cycle, currentis drawn by the sink s4 (motor mode) and in the negative half of the load cycle,
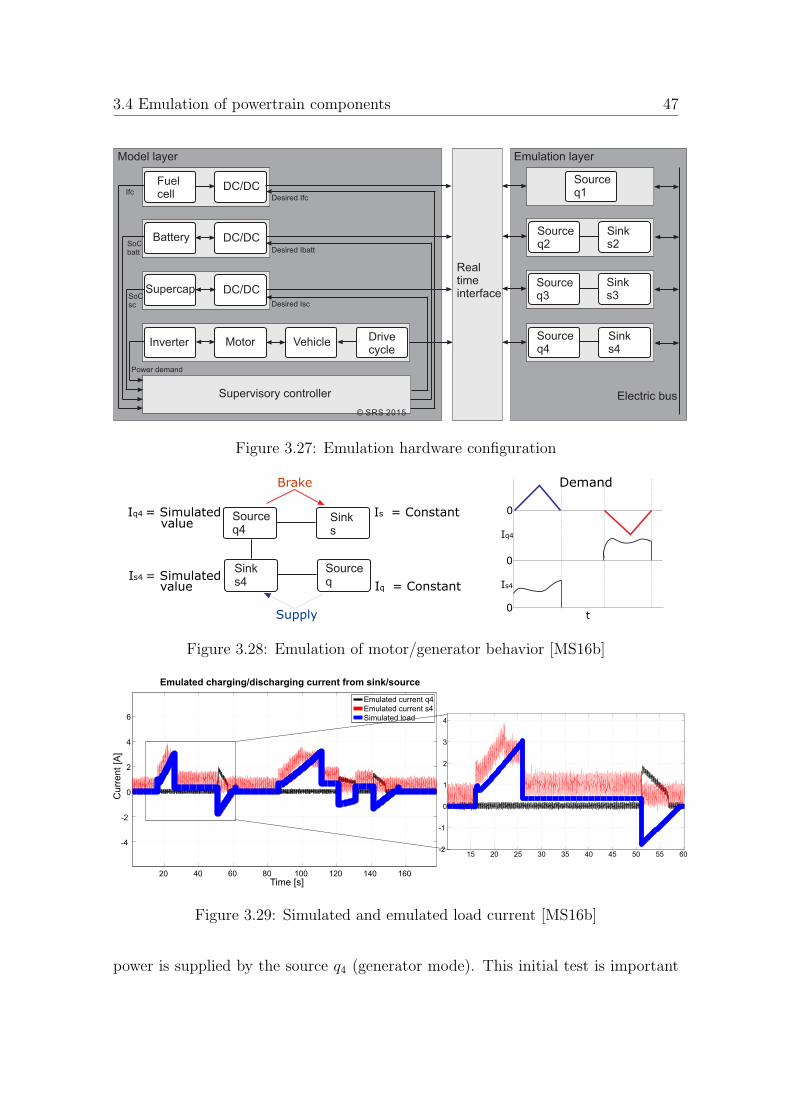
3.4 Emulation of powertrain components 47
Fuelcell
DC/DC
Battery DC/DC
Supercap DC/DC
Inverter Motor Vehicle Drivecycle
Supervisory controller
Sourceq1
Sourceq2
Sinks2
Sourceq3
Sourceq4
Sinks3
Sinks4
Realtimeinterface
Electric bus
Desired Isc
Desired Ibatt
Desired Ifc
SoCbatt
SoCsc
Ifc
Power demand
© SRS 2015
Model layer Emulation layer
Figure 3.27: Emulation hardware configuration
Demand
Iq4
Is4
Supply
Brake
I = Constantq
I = Simulateds4
value
I = Simulatedq4 I = Constants
valueSourceq4
Sinks4
Sinks
Sourceq
0
0
0t
Figure 3.28: Emulation of motor/generator behavior [MS16b]
15 20 25 30 35 40 45 50 55 60-2
-1
0
1
2
3
4
Time [s]
Cu
rre
nt
[A]
Emulated charging/discharging current from sink/source
20 40 60 80 100 120 140 160
-4
-2
0
2
4
6
Emulated current q4
Emulated current s4
Simulated load
Figure 3.29: Simulated and emulated load current [MS16b]
power is supplied by the source q4 (generator mode). This initial test is important

48 Chapter 3. Hybrid vehicle: Components and configurations
to check the ability of power source-sink combinations in emulating not just the mo-tor/generator dynamics, but also battery and supercapacitor. The constant currentsupplied by q in the positive half will be replaced by supply from each/either of thesources as defined by power management. The constant current demanded by s inthe negative half will be replaced by the demand from each/either of the storagecomponents.
49
4 Power management and optimization
This chapter is published in the form of scientific papers [MS16b],[MS15a]. As thevehicle considered is a hybrid vehicle and involves multiple sources of power, a super-visory power management control strategy is needed to determine the power flowsalong single power flow paths in order to satisfy various objectives while satisfyingthe power demand at the same time [GS07]. Some of the key goals according to[BGT10] are: maximum fuel economy, minimum emissions, minimum system cost,and good driving performance. Due to increasing environmental issues and fast de-pletion of fossil fuels, the control of hybrid vehicles in terms of fuel consumption hasbecome a global issue. According to [BDGB10], the power management strategyshould also keep the state of charge of energy buffer/buffers used within reasonablebounds, while reducing fuel consumption. In this chapter, an introduction on dif-ferent power management optimization strategies with focus on rule-based powermanagement is given. Details of the power management control strategy developedin this work and parameter optimization strategy considered is given followed bysimulation results.
4.1 Introduction
The need for the development of online power management strategies applicableto real-time hybrid powertrain systems is an important issue in the transportationsector. A power management strategy alone does not necessarily ensure optimalpower distribution amongst the drive train components. Thus optimization of powermanagement is another task which needs to be considered in terms of multipleobjectives.
4.1.1 Classification and comparison of power management strategies
In order to select a suitable power management strategy, it is important to compareexisting methods and related advantages and disadvantages. An evaluation of theirperformance and applications makes it possible to choose an appropriate powermanagement optimization approach for this work. According to [GS07], two kindsof classification can be made: first, based on knowledge of future situations, where,non-causal controllers require knowledge of the future i.e. a drive cycle and causalcontrollers do not need a priori knowledge of future driving profiles; second based onoptimality, like heuristic, optimal, and sub-optimal controllers. Within these threetypes, some can be causal and others non-causal. They are listed in [BGT10, Sal07]and in Figure 4.1.
Rule-based strategies are generally designed based on heuristics, human expertise,or mathematical models and do not require a prior knowledge of the drive cycle
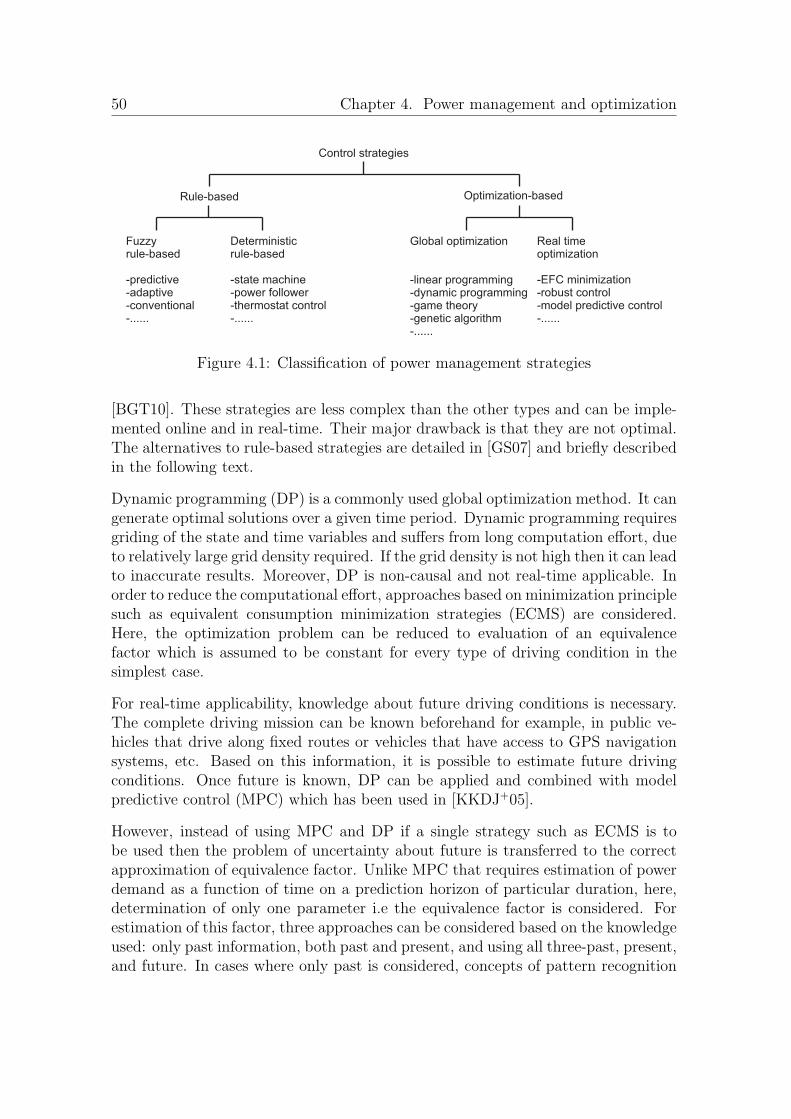
50 Chapter 4. Power management and optimization
Control strategies
Rule-based Optimization-based
Fuzzyrule-based
-predictive-adaptive-conventional-......
Deterministicrule-based
-state machine-power follower-thermostat control-......
Global optimization
-linear programming-dynamic programming-game theory-genetic algorithm-......
Real timeoptimization
-EFC minimization-robust control-model predictive control-......
Figure 4.1: Classification of power management strategies
[BGT10]. These strategies are less complex than the other types and can be imple-mented online and in real-time. Their major drawback is that they are not optimal.The alternatives to rule-based strategies are detailed in [GS07] and briefly describedin the following text.
Dynamic programming (DP) is a commonly used global optimization method. It cangenerate optimal solutions over a given time period. Dynamic programming requiresgriding of the state and time variables and suffers from long computation effort, dueto relatively large grid density required. If the grid density is not high then it can leadto inaccurate results. Moreover, DP is non-causal and not real-time applicable. Inorder to reduce the computational effort, approaches based on minimization principlesuch as equivalent consumption minimization strategies (ECMS) are considered.Here, the optimization problem can be reduced to evaluation of an equivalencefactor which is assumed to be constant for every type of driving condition in thesimplest case.
For real-time applicability, knowledge about future driving conditions is necessary.The complete driving mission can be known beforehand for example, in public ve-hicles that drive along fixed routes or vehicles that have access to GPS navigationsystems, etc. Based on this information, it is possible to estimate future drivingconditions. Once future is known, DP can be applied and combined with modelpredictive control (MPC) which has been used in [KKDJ+05].
However, instead of using MPC and DP if a single strategy such as ECMS is tobe used then the problem of uncertainty about future is transferred to the correctapproximation of equivalence factor. Unlike MPC that requires estimation of powerdemand as a function of time on a prediction horizon of particular duration, here,determination of only one parameter i.e the equivalence factor is considered. Forestimation of this factor, three approaches can be considered based on the knowledgeused: only past information, both past and present, and using all three-past, present,and future. In cases where only past is considered, concepts of pattern recognition
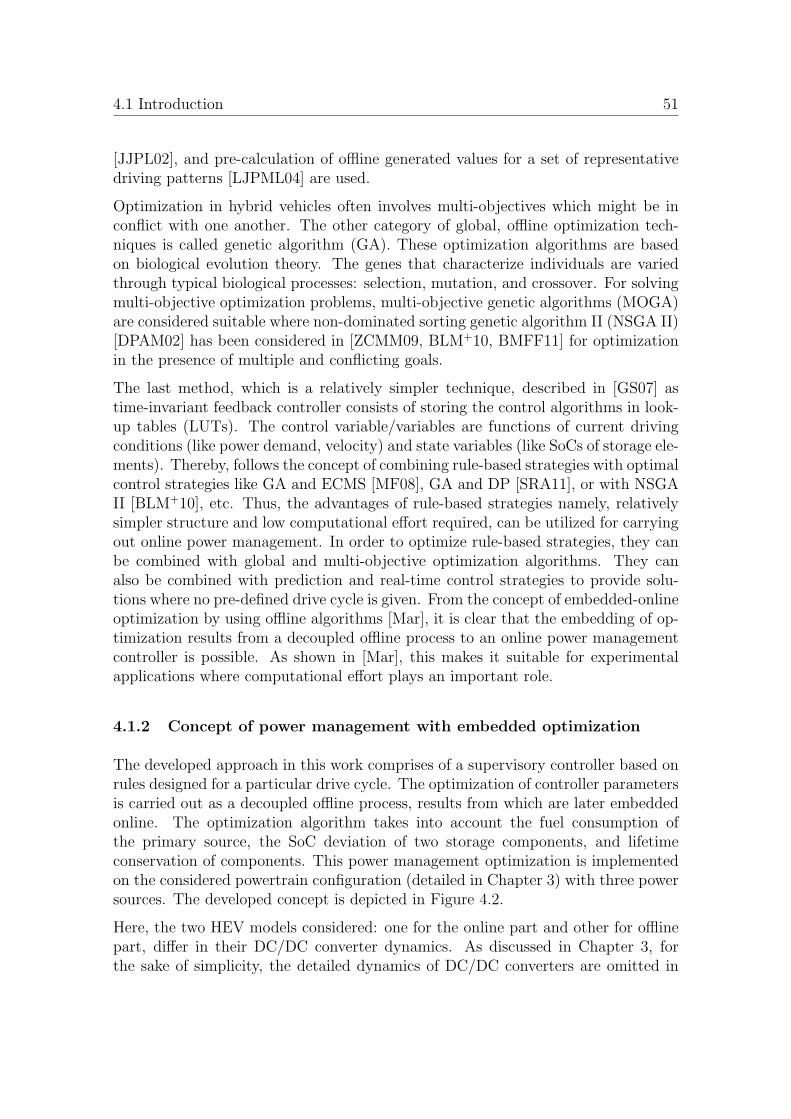
4.1 Introduction 51
[JJPL02], and pre-calculation of offline generated values for a set of representativedriving patterns [LJPML04] are used.
Optimization in hybrid vehicles often involves multi-objectives which might be inconflict with one another. The other category of global, offline optimization tech-niques is called genetic algorithm (GA). These optimization algorithms are basedon biological evolution theory. The genes that characterize individuals are variedthrough typical biological processes: selection, mutation, and crossover. For solvingmulti-objective optimization problems, multi-objective genetic algorithms (MOGA)are considered suitable where non-dominated sorting genetic algorithm II (NSGA II)[DPAM02] has been considered in [ZCMM09, BLM+10, BMFF11] for optimizationin the presence of multiple and conflicting goals.
The last method, which is a relatively simpler technique, described in [GS07] astime-invariant feedback controller consists of storing the control algorithms in look-up tables (LUTs). The control variable/variables are functions of current drivingconditions (like power demand, velocity) and state variables (like SoCs of storage ele-ments). Thereby, follows the concept of combining rule-based strategies with optimalcontrol strategies like GA and ECMS [MF08], GA and DP [SRA11], or with NSGAII [BLM+10], etc. Thus, the advantages of rule-based strategies namely, relativelysimpler structure and low computational effort required, can be utilized for carryingout online power management. In order to optimize rule-based strategies, they canbe combined with global and multi-objective optimization algorithms. They canalso be combined with prediction and real-time control strategies to provide solu-tions where no pre-defined drive cycle is given. From the concept of embedded-onlineoptimization by using offline algorithms [Mar], it is clear that the embedding of op-timization results from a decoupled offline process to an online power managementcontroller is possible. As shown in [Mar], this makes it suitable for experimentalapplications where computational effort plays an important role.
4.1.2 Concept of power management with embedded optimization
The developed approach in this work comprises of a supervisory controller based onrules designed for a particular drive cycle. The optimization of controller parametersis carried out as a decoupled offline process, results from which are later embeddedonline. The optimization algorithm takes into account the fuel consumption ofthe primary source, the SoC deviation of two storage components, and lifetimeconservation of components. This power management optimization is implementedon the considered powertrain configuration (detailed in Chapter 3) with three powersources. The developed concept is depicted in Figure 4.2.
Here, the two HEV models considered: one for the online part and other for offlinepart, differ in their DC/DC converter dynamics. As discussed in Chapter 3, forthe sake of simplicity, the detailed dynamics of DC/DC converters are omitted in
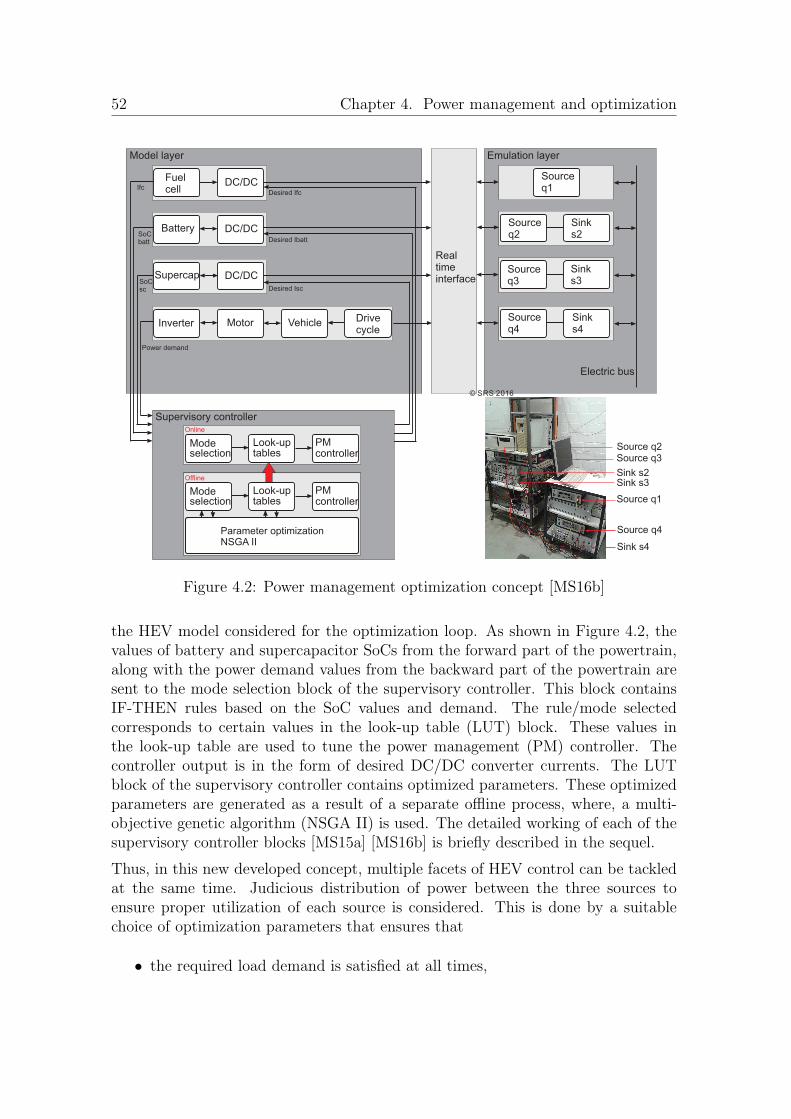
52 Chapter 4. Power management and optimization
Fuelcell
DC/DC
Battery DC/DC
Supercap DC/DC
Inverter Motor Vehicle Drivecycle
Sourceq1
Sourceq2
Sinks2
Sourceq3
Sourceq4
Sinks3
Sinks4
Realtimeinterface
Electric bus
Desired Isc
Desired Ibatt
Desired Ifc
SoCbatt
SoCsc
Ifc
Power demand
© SRS 2016
Model layer Emulation layer
Supervisory controller
Mode Look-up PMselection tables controller
Mode Look-up PMselection tables controller
Online
Offline
Parameter optimizationNSGA II
Source q2Source q3
Sink s2Sink s3
Source q1
Source q4
Sink s4
Figure 4.2: Power management optimization concept [MS16b]
the HEV model considered for the optimization loop. As shown in Figure 4.2, thevalues of battery and supercapacitor SoCs from the forward part of the powertrain,along with the power demand values from the backward part of the powertrain aresent to the mode selection block of the supervisory controller. This block containsIF-THEN rules based on the SoC values and demand. The rule/mode selectedcorresponds to certain values in the look-up table (LUT) block. These values inthe look-up table are used to tune the power management (PM) controller. Thecontroller output is in the form of desired DC/DC converter currents. The LUTblock of the supervisory controller contains optimized parameters. These optimizedparameters are generated as a result of a separate offline process, where, a multi-objective genetic algorithm (NSGA II) is used. The detailed working of each of thesupervisory controller blocks [MS15a] [MS16b] is briefly described in the sequel.
Thus, in this new developed concept, multiple facets of HEV control can be tackledat the same time. Judicious distribution of power between the three sources toensure proper utilization of each source is considered. This is done by a suitablechoice of optimization parameters that ensures that
• the required load demand is satisfied at all times,
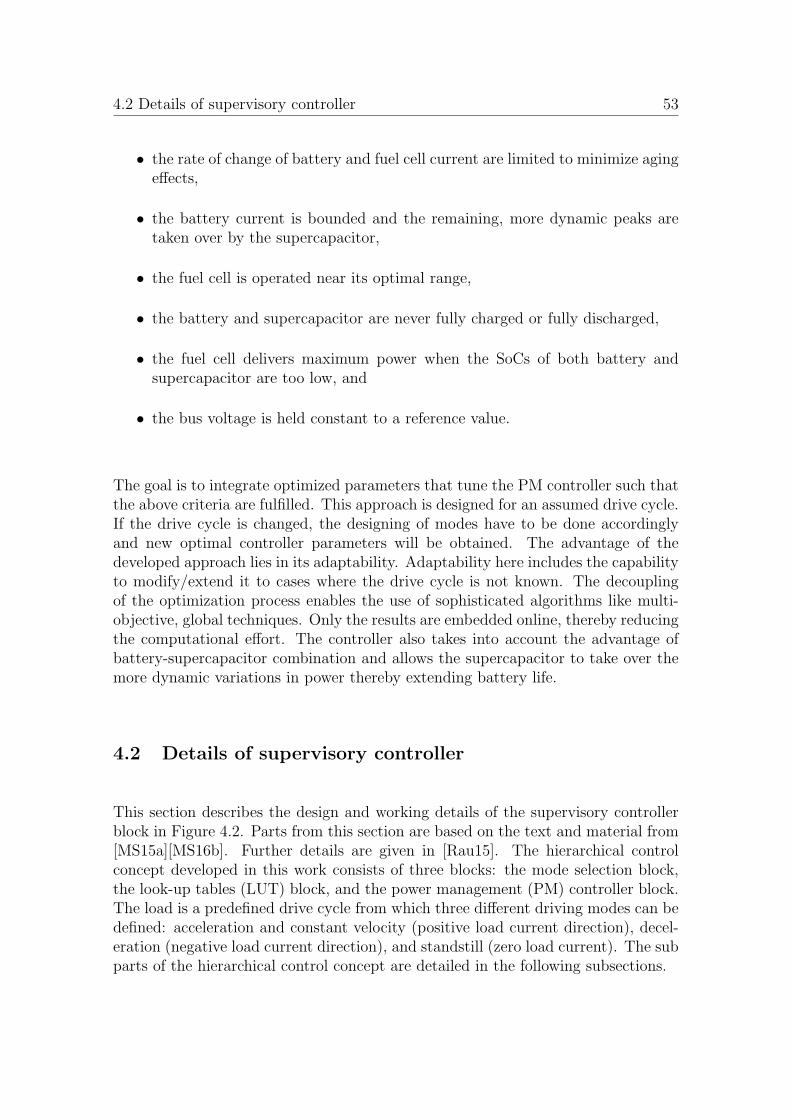
4.2 Details of supervisory controller 53
• the rate of change of battery and fuel cell current are limited to minimize agingeffects,
• the battery current is bounded and the remaining, more dynamic peaks aretaken over by the supercapacitor,
• the fuel cell is operated near its optimal range,
• the battery and supercapacitor are never fully charged or fully discharged,
• the fuel cell delivers maximum power when the SoCs of both battery andsupercapacitor are too low, and
• the bus voltage is held constant to a reference value.
The goal is to integrate optimized parameters that tune the PM controller such thatthe above criteria are fulfilled. This approach is designed for an assumed drive cycle.If the drive cycle is changed, the designing of modes have to be done accordinglyand new optimal controller parameters will be obtained. The advantage of thedeveloped approach lies in its adaptability. Adaptability here includes the capabilityto modify/extend it to cases where the drive cycle is not known. The decouplingof the optimization process enables the use of sophisticated algorithms like multi-objective, global techniques. Only the results are embedded online, thereby reducingthe computational effort. The controller also takes into account the advantage ofbattery-supercapacitor combination and allows the supercapacitor to take over themore dynamic variations in power thereby extending battery life.
4.2 Details of supervisory controller
This section describes the design and working details of the supervisory controllerblock in Figure 4.2. Parts from this section are based on the text and material from[MS15a][MS16b]. Further details are given in [Rau15]. The hierarchical controlconcept developed in this work consists of three blocks: the mode selection block,the look-up tables (LUT) block, and the power management (PM) controller block.The load is a predefined drive cycle from which three different driving modes can bedefined: acceleration and constant velocity (positive load current direction), decel-eration (negative load current direction), and standstill (zero load current). The subparts of the hierarchical control concept are detailed in the following subsections.
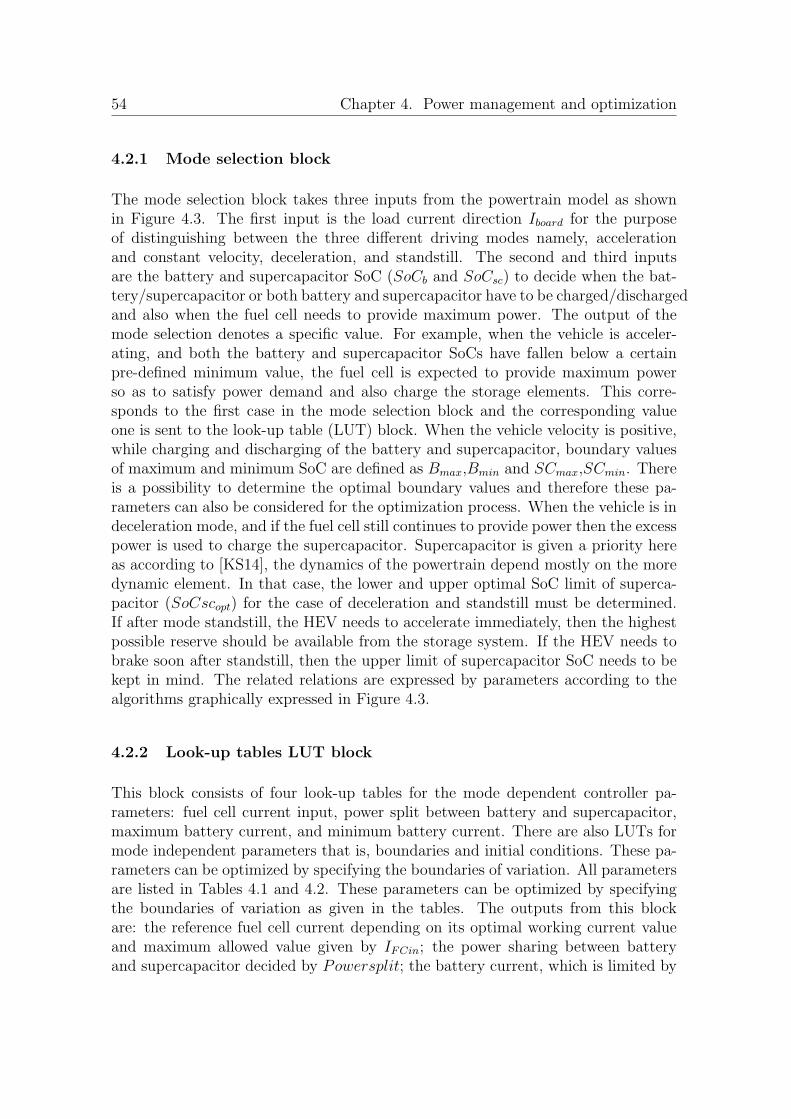
54 Chapter 4. Power management and optimization
4.2.1 Mode selection block
The mode selection block takes three inputs from the powertrain model as shownin Figure 4.3. The first input is the load current direction Iboard for the purposeof distinguishing between the three different driving modes namely, accelerationand constant velocity, deceleration, and standstill. The second and third inputsare the battery and supercapacitor SoC (SoCb and SoCsc) to decide when the bat-tery/supercapacitor or both battery and supercapacitor have to be charged/dischargedand also when the fuel cell needs to provide maximum power. The output of themode selection denotes a specific value. For example, when the vehicle is acceler-ating, and both the battery and supercapacitor SoCs have fallen below a certainpre-defined minimum value, the fuel cell is expected to provide maximum powerso as to satisfy power demand and also charge the storage elements. This corre-sponds to the first case in the mode selection block and the corresponding valueone is sent to the look-up table (LUT) block. When the vehicle velocity is positive,while charging and discharging of the battery and supercapacitor, boundary valuesof maximum and minimum SoC are defined as Bmax,Bmin and SCmax,SCmin. Thereis a possibility to determine the optimal boundary values and therefore these pa-rameters can also be considered for the optimization process. When the vehicle is indeceleration mode, and if the fuel cell still continues to provide power then the excesspower is used to charge the supercapacitor. Supercapacitor is given a priority hereas according to [KS14], the dynamics of the powertrain depend mostly on the moredynamic element. In that case, the lower and upper optimal SoC limit of superca-pacitor (SoCscopt) for the case of deceleration and standstill must be determined.If after mode standstill, the HEV needs to accelerate immediately, then the highestpossible reserve should be available from the storage system. If the HEV needs tobrake soon after standstill, then the upper limit of supercapacitor SoC needs to bekept in mind. The related relations are expressed by parameters according to thealgorithms graphically expressed in Figure 4.3.
4.2.2 Look-up tables LUT block
This block consists of four look-up tables for the mode dependent controller pa-rameters: fuel cell current input, power split between battery and supercapacitor,maximum battery current, and minimum battery current. There are also LUTs formode independent parameters that is, boundaries and initial conditions. These pa-rameters can be optimized by specifying the boundaries of variation. All parametersare listed in Tables 4.1 and 4.2. These parameters can be optimized by specifyingthe boundaries of variation as given in the tables. The outputs from this blockare: the reference fuel cell current depending on its optimal working current valueand maximum allowed value given by IFCin; the power sharing between batteryand supercapacitor decided by Powersplit; the battery current, which is limited by
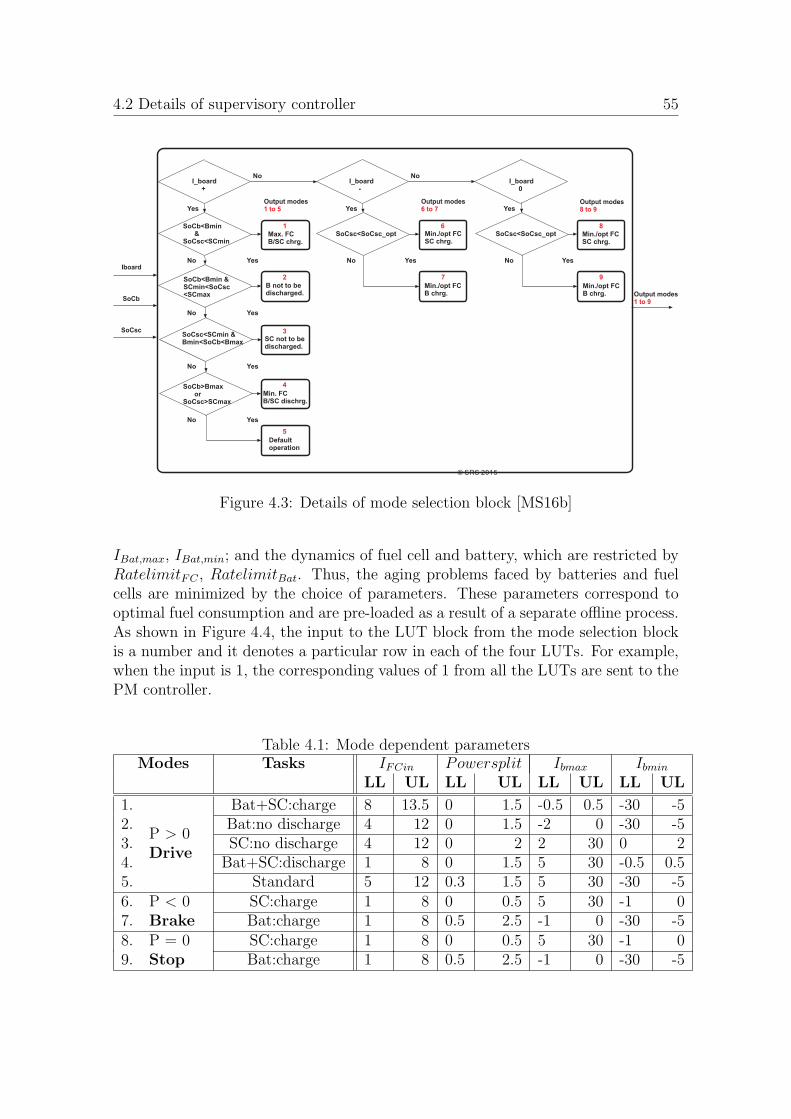
4.2 Details of supervisory controller 55
I_board+
SoCb<Bmin&
SoCsc<SCmin
SoCb<Bmin &SCmin<SoCsc<SCmax
SoCsc<SCmin &Bmin<SoCb<Bmax
SoCb>Bmaxor
SoCsc>SCmax
I_board-
SoCsc<SoCsc_opt
Yes
No
No
No
No
4
Min. FCB/SC dischrg.
3SC not to bedischarged.
2
B not to bedischarged.
1
Max. FCB/SC chrg.
5
Defaultoperation
No
Yes
Yes
Yes
Yes
Yes
NoIboard
SoCb
SoCsc
I_board0
SoCsc<SoCsc_opt6
Min./opt FCSC chrg.
7
Min./opt FCB chrg.
8
Min./opt FCSC chrg.
9
Min./opt FCB chrg.
Yes
No
YesNo
Yes
Output modes1 to 9
Output modes1 to 5
Output modes6 to 7
Output modes8 to 9
© SRS 2015
Figure 4.3: Details of mode selection block [MS16b]
IBat,max, IBat,min; and the dynamics of fuel cell and battery, which are restricted byRatelimitFC , RatelimitBat. Thus, the aging problems faced by batteries and fuelcells are minimized by the choice of parameters. These parameters correspond tooptimal fuel consumption and are pre-loaded as a result of a separate offline process.As shown in Figure 4.4, the input to the LUT block from the mode selection blockis a number and it denotes a particular row in each of the four LUTs. For example,when the input is 1, the corresponding values of 1 from all the LUTs are sent to thePM controller.
Table 4.1: Mode dependent parametersModes Tasks IFCin Powersplit Ibmax Ibmin
LL UL LL UL LL UL LL UL
1.
P > 0Drive
Bat+SC:charge 8 13.5 0 1.5 -0.5 0.5 -30 -52. Bat:no discharge 4 12 0 1.5 -2 0 -30 -53. SC:no discharge 4 12 0 2 2 30 0 24. Bat+SC:discharge 1 8 0 1.5 5 30 -0.5 0.55. Standard 5 12 0.3 1.5 5 30 -30 -56. P < 0
BrakeSC:charge 1 8 0 0.5 5 30 -1 0
7. Bat:charge 1 8 0.5 2.5 -1 0 -30 -58. P = 0
StopSC:charge 1 8 0 0.5 5 30 -1 0
9. Bat:charge 1 8 0.5 2.5 -1 0 -30 -5
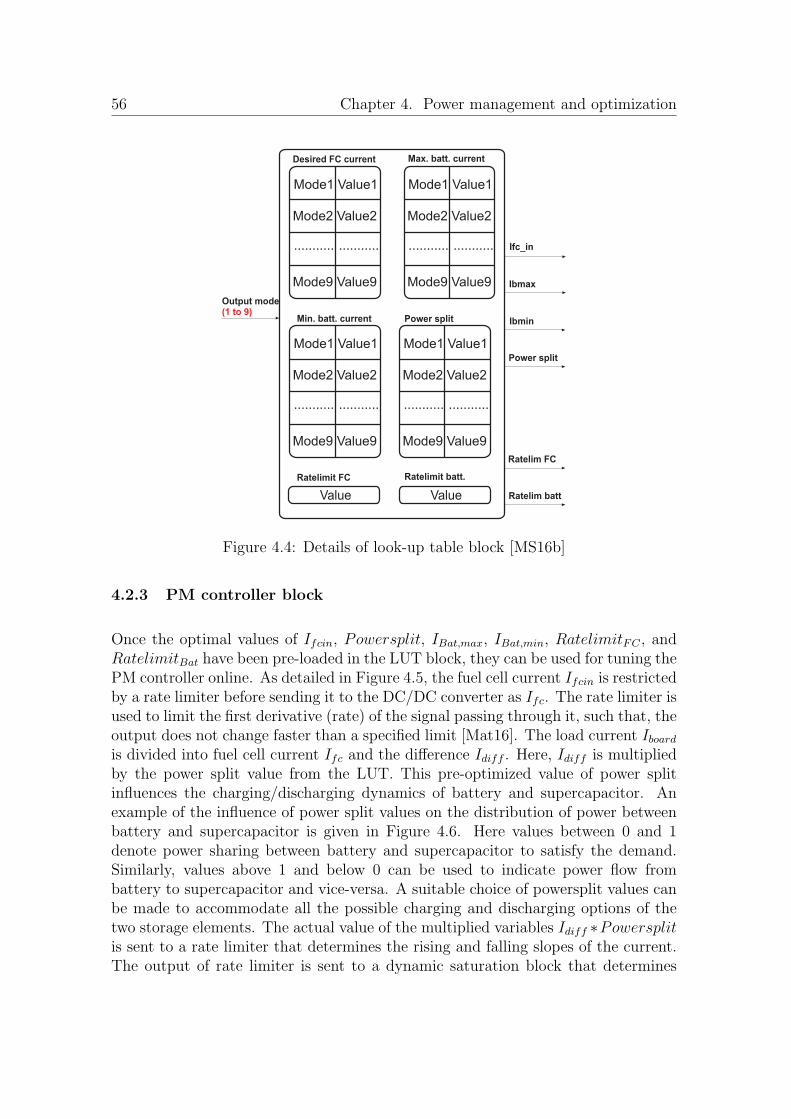
56 Chapter 4. Power management and optimization
Ifc_in
Ibmax
Ibmin
Output mode(1 to 9)
Desired FC current Max. batt. current
Min. batt. current Power split
Power split
Mode1
Mode9
Mode2
Value1
Value9
Value2
........... ...........
Mode1
Mode9
Mode2
Value1
Value9
Value2
........... ...........
Mode1
Mode9
Mode2
Value1
Value9
Value2
........... ...........
Mode1
Mode9
Mode2
Value1
Value9
Value2
........... ...........
Ratelimit FC Ratelimit batt.
Value Value
Ratelim FC
Ratelim batt
Figure 4.4: Details of look-up table block [MS16b]
4.2.3 PM controller block
Once the optimal values of Ifcin, Powersplit, IBat,max, IBat,min, RatelimitFC , andRatelimitBat have been pre-loaded in the LUT block, they can be used for tuning thePM controller online. As detailed in Figure 4.5, the fuel cell current Ifcin is restrictedby a rate limiter before sending it to the DC/DC converter as Ifc. The rate limiter isused to limit the first derivative (rate) of the signal passing through it, such that, theoutput does not change faster than a specified limit [Mat16]. The load current Iboardis divided into fuel cell current Ifc and the difference Idiff . Here, Idiff is multipliedby the power split value from the LUT. This pre-optimized value of power splitinfluences the charging/discharging dynamics of battery and supercapacitor. Anexample of the influence of power split values on the distribution of power betweenbattery and supercapacitor is given in Figure 4.6. Here values between 0 and 1denote power sharing between battery and supercapacitor to satisfy the demand.Similarly, values above 1 and below 0 can be used to indicate power flow frombattery to supercapacitor and vice-versa. A suitable choice of powersplit values canbe made to accommodate all the possible charging and discharging options of thetwo storage elements. The actual value of the multiplied variables Idiff ∗Powersplit
is sent to a rate limiter that determines the rising and falling slopes of the current.The output of rate limiter is sent to a dynamic saturation block that determines
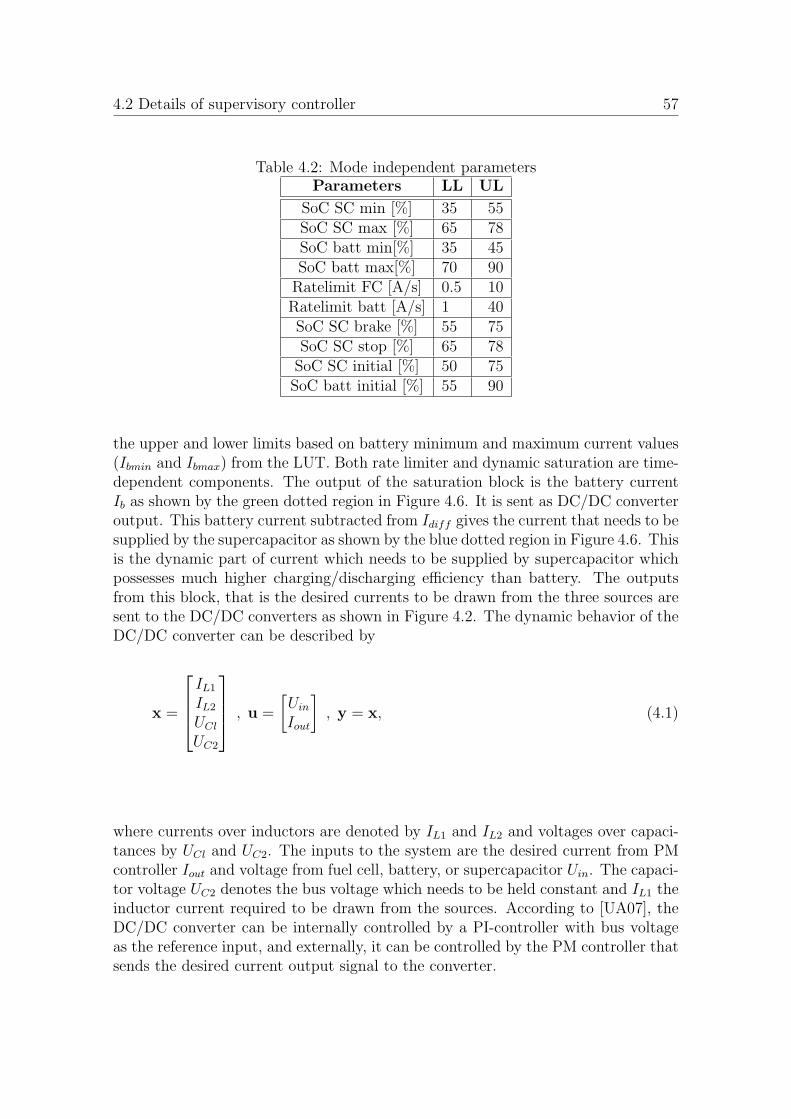
4.2 Details of supervisory controller 57
Table 4.2: Mode independent parametersParameters LL UL
SoC SC min [%] 35 55SoC SC max [%] 65 78SoC batt min[%] 35 45SoC batt max[%] 70 90Ratelimit FC [A/s] 0.5 10Ratelimit batt [A/s] 1 40SoC SC brake [%] 55 75SoC SC stop [%] 65 78SoC SC initial [%] 50 75SoC batt initial [%] 55 90
the upper and lower limits based on battery minimum and maximum current values(Ibmin and Ibmax) from the LUT. Both rate limiter and dynamic saturation are time-dependent components. The output of the saturation block is the battery currentIb as shown by the green dotted region in Figure 4.6. It is sent as DC/DC converteroutput. This battery current subtracted from Idiff gives the current that needs to besupplied by the supercapacitor as shown by the blue dotted region in Figure 4.6. Thisis the dynamic part of current which needs to be supplied by supercapacitor whichpossesses much higher charging/discharging efficiency than battery. The outputsfrom this block, that is the desired currents to be drawn from the three sources aresent to the DC/DC converters as shown in Figure 4.2. The dynamic behavior of theDC/DC converter can be described by
x =
IL1IL2UCl
UC2
, u =
[Uin
Iout
]
, y = x, (4.1)
where currents over inductors are denoted by IL1 and IL2 and voltages over capaci-tances by UCl and UC2. The inputs to the system are the desired current from PMcontroller Iout and voltage from fuel cell, battery, or supercapacitor Uin. The capaci-tor voltage UC2 denotes the bus voltage which needs to be held constant and IL1 theinductor current required to be drawn from the sources. According to [UA07], theDC/DC converter can be internally controlled by a PI-controller with bus voltageas the reference input, and externally, it can be controlled by the PM controller thatsends the desired current output signal to the converter.
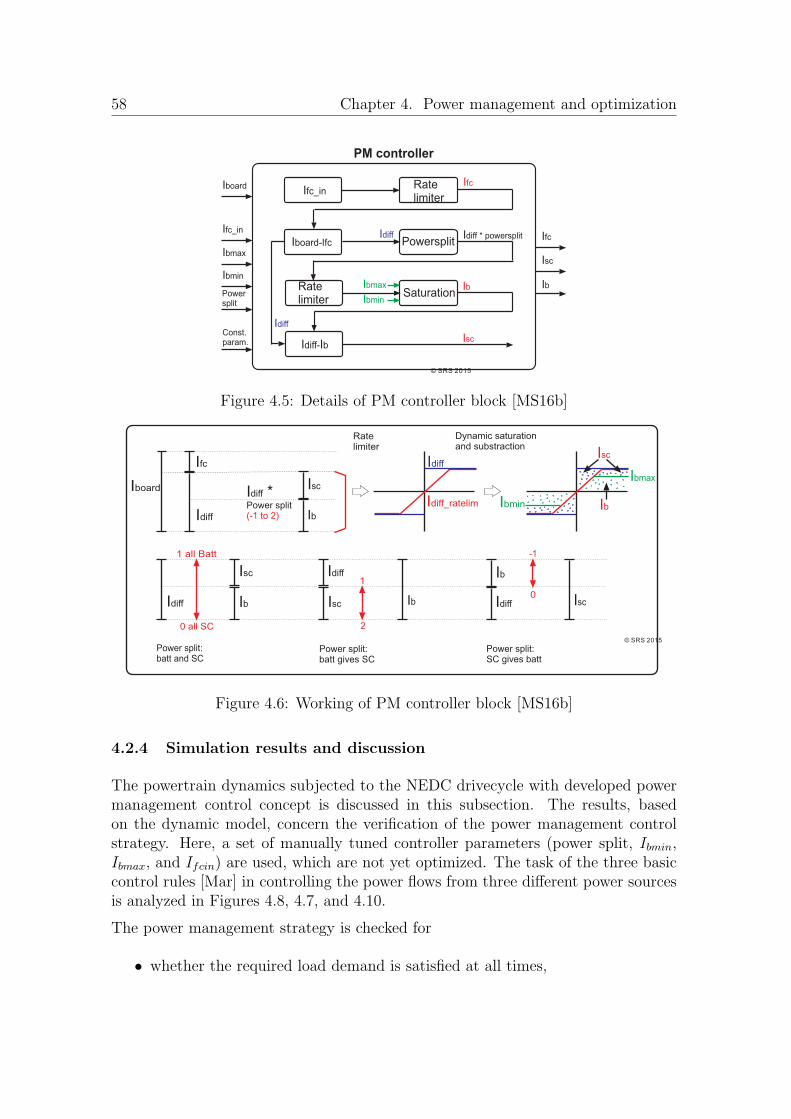
58 Chapter 4. Power management and optimization
Ifc_in
Iboard-Ifc
Ratelimiter
Powersplit
Saturation
I Idiff- b
Idiff
Ibmax
Ibmin
Idiff * powersplit
Idiff
Ifc
Ib
Isc
PM controller
Iboard
Ifc_in
Powersplit
Ibmin
Ibmax
Const.param.
Ifc
Ib
Isc
© SRS 2015
Ratelimiter
Figure 4.5: Details of PM controller block [MS16b]
Iboard
Ifc
Idiff
Isc
Ib
I *diff
Power split(-1 to 2)
Isc
Ib
Idiff
IscIdiff Ib Isc
1 all Batt
0 all SC
Power split:batt and SC
Power split:batt gives SC
Power split:SC gives batt
1
2
-1
0
Ratelimiter
Dynamic saturationand substraction
Idiff
Idiff_ratelim
Ibmax
Ibmin Ib
Isc
Idiff
Ib
© SRS 2015
Figure 4.6: Working of PM controller block [MS16b]
4.2.4 Simulation results and discussion
The powertrain dynamics subjected to the NEDC drivecycle with developed powermanagement control concept is discussed in this subsection. The results, basedon the dynamic model, concern the verification of the power management controlstrategy. Here, a set of manually tuned controller parameters (power split, Ibmin,Ibmax, and Ifcin) are used, which are not yet optimized. The task of the three basiccontrol rules [Mar] in controlling the power flows from three different power sourcesis analyzed in Figures 4.8, 4.7, and 4.10.
The power management strategy is checked for
• whether the required load demand is satisfied at all times,

4.2 Details of supervisory controller 59
100 200 300 400 500 600 700 800 900 1000 1100 1200
−2
−1
0
1
2
3
x 104
Time [s]
Po
we
r [w
]
Comparison of power demand and actual power
P_actual
P_diff
P_demand
200 300 400 500 600 700 800 900 1000 1100 1200
−5
−4
−3
−2
−1
0
1
Figure 4.7: Power demand and actual power (realized by numerical simulation)
• the rate of change of battery and fuel cell current are limited,
• the battery current is bounded and the remaining, more dynamic peaks aretaken over by the supercapacitor,
• the fuel cell is operated near its optimal range, and
• the battery and supercapacitor are never fully charged or fully discharged.
In Figure 4.7, the total power from the three sources is given. This illustrated poweris the actual output power from the sources and it should be same as the powerdemand resulting from the chosen drive cycle. The error, termed as drivability errorcan be detected in red. It can be considered negligibly small in this work and istherefore not considered as an optimization goal. From the Figure 4.8, it is clearthat, the fuel cell is operated under two position or on/off control and the powersharing between battery and supercapacitor is such that the supercapacitor takesover the more dynamic power fluctuations. The fuel cell is operated at around 4kWwhich is close to its efficient operating point as calculated in Equation 3.26.
As an example operation of the power management strategy, a zoomed part ofFigure 4.8 for the time period t = 670s to t = 770s is shown in Figure 4.9 alongwith the switching between operation modes for the given drive cycle. As soon as
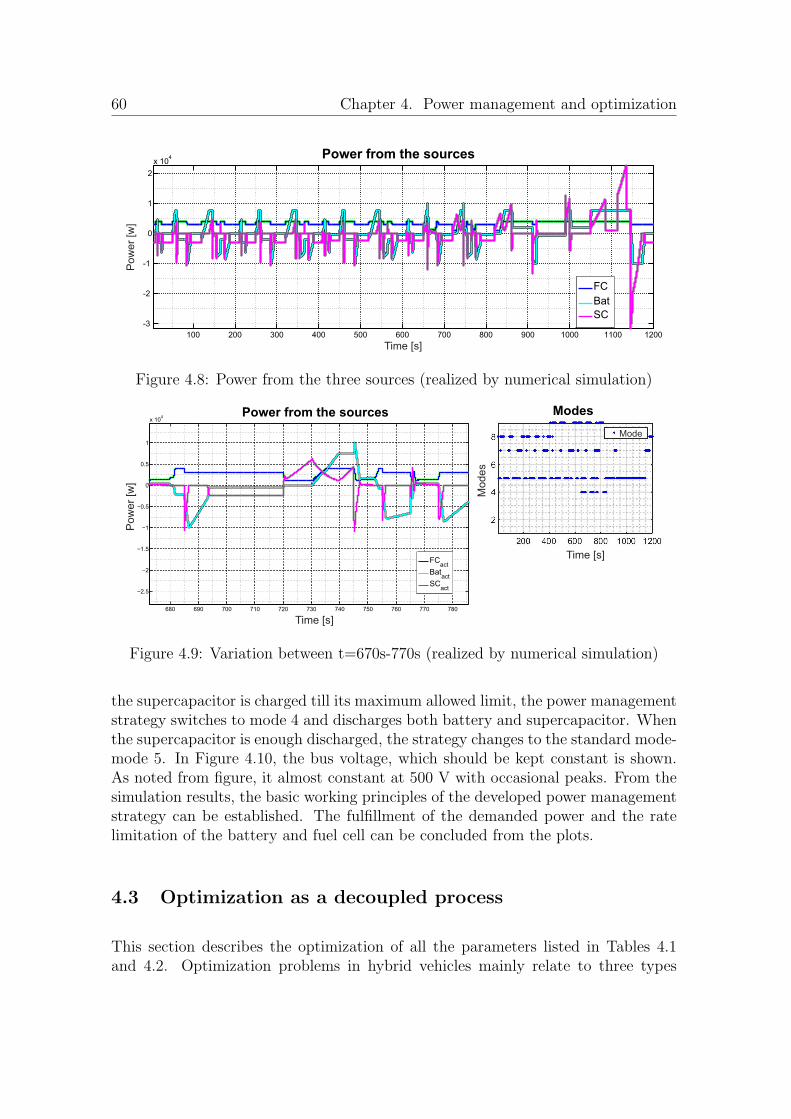
60 Chapter 4. Power management and optimization
100 200 300 400 500 600 700 800 900 1000 1200
-3
-2
-1
0
1
2
x 104
Time [s]
Po
we
r [w
]
Power from the sources
FC
Bat
SC
1 001
Figure 4.8: Power from the three sources (realized by numerical simulation)
680 690 700 710 720 730 740 750 760 770 780
−2.5
−2
−1.5
−1
−0.5
0
0.5
1
x 104
Time [s]
Pow
er
[w]
Power from the sources
FCact
Batact
SCact
Modes
Modes
Time [s]
Mode
Figure 4.9: Variation between t=670s-770s (realized by numerical simulation)
the supercapacitor is charged till its maximum allowed limit, the power managementstrategy switches to mode 4 and discharges both battery and supercapacitor. Whenthe supercapacitor is enough discharged, the strategy changes to the standard mode-mode 5. In Figure 4.10, the bus voltage, which should be kept constant is shown.As noted from figure, it almost constant at 500 V with occasional peaks. From thesimulation results, the basic working principles of the developed power managementstrategy can be established. The fulfillment of the demanded power and the ratelimitation of the battery and fuel cell can be concluded from the plots.
4.3 Optimization as a decoupled process
This section describes the optimization of all the parameters listed in Tables 4.1and 4.2. Optimization problems in hybrid vehicles mainly relate to three types
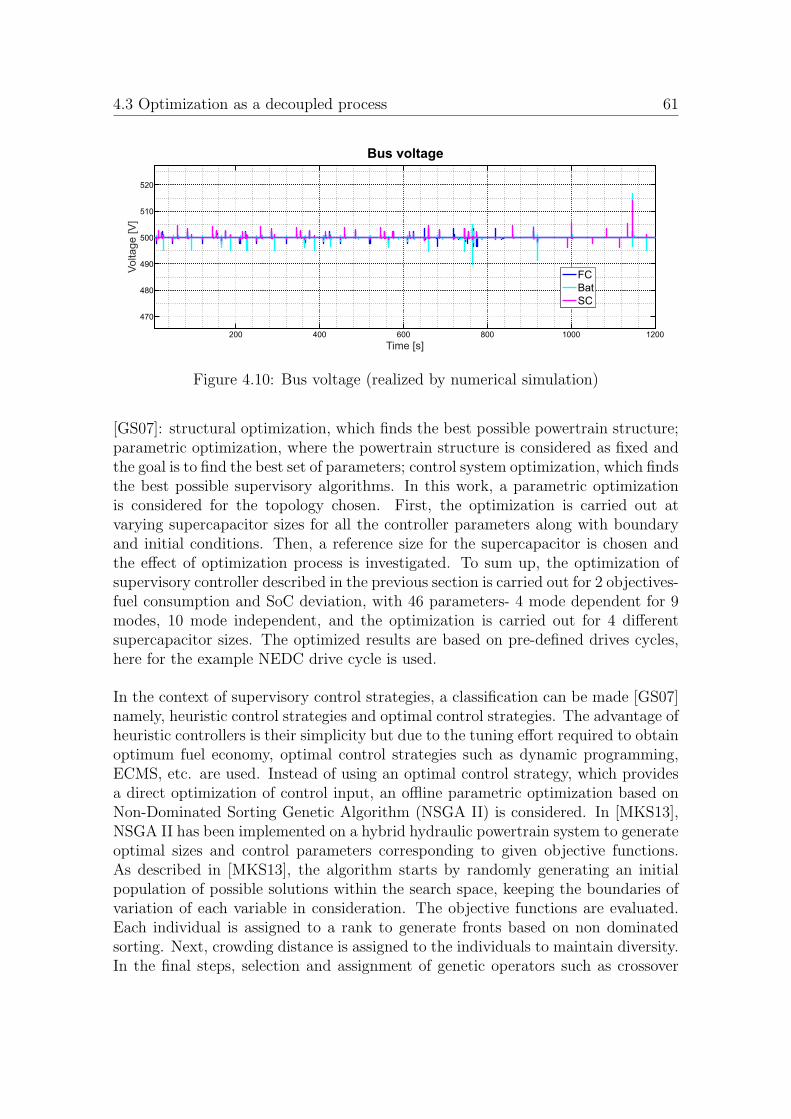
4.3 Optimization as a decoupled process 61
200 400 600 800 1000 1200
470
480
490
500
510
520
Time [s]
Vo
lta
ge
[V
]
Bus voltage
FC
Bat
SC
Figure 4.10: Bus voltage (realized by numerical simulation)
[GS07]: structural optimization, which finds the best possible powertrain structure;parametric optimization, where the powertrain structure is considered as fixed andthe goal is to find the best set of parameters; control system optimization, which findsthe best possible supervisory algorithms. In this work, a parametric optimizationis considered for the topology chosen. First, the optimization is carried out atvarying supercapacitor sizes for all the controller parameters along with boundaryand initial conditions. Then, a reference size for the supercapacitor is chosen andthe effect of optimization process is investigated. To sum up, the optimization ofsupervisory controller described in the previous section is carried out for 2 objectives-fuel consumption and SoC deviation, with 46 parameters- 4 mode dependent for 9modes, 10 mode independent, and the optimization is carried out for 4 differentsupercapacitor sizes. The optimized results are based on pre-defined drives cycles,here for the example NEDC drive cycle is used.
In the context of supervisory control strategies, a classification can be made [GS07]namely, heuristic control strategies and optimal control strategies. The advantage ofheuristic controllers is their simplicity but due to the tuning effort required to obtainoptimum fuel economy, optimal control strategies such as dynamic programming,ECMS, etc. are used. Instead of using an optimal control strategy, which providesa direct optimization of control input, an offline parametric optimization based onNon-Dominated Sorting Genetic Algorithm (NSGA II) is considered. In [MKS13],NSGA II has been implemented on a hybrid hydraulic powertrain system to generateoptimal sizes and control parameters corresponding to given objective functions.As described in [MKS13], the algorithm starts by randomly generating an initialpopulation of possible solutions within the search space, keeping the boundaries ofvariation of each variable in consideration. The objective functions are evaluated.Each individual is assigned to a rank to generate fronts based on non dominatedsorting. Next, crowding distance is assigned to the individuals to maintain diversity.In the final steps, selection and assignment of genetic operators such as crossover
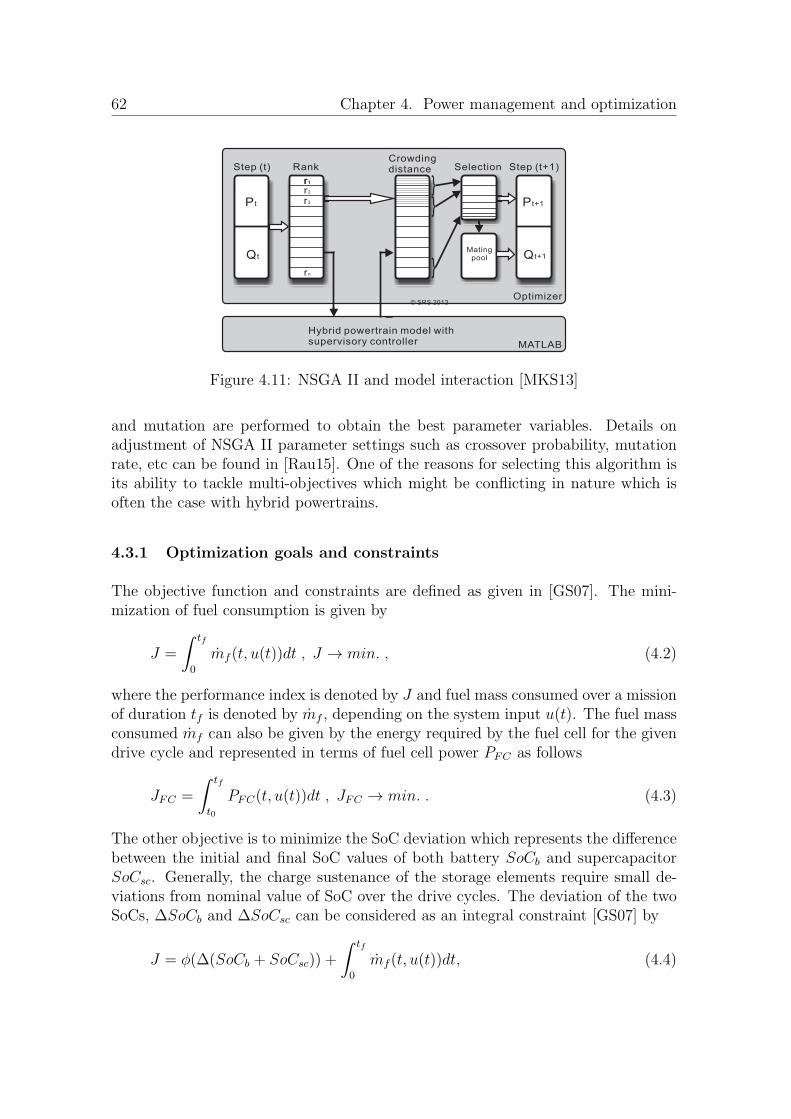
62 Chapter 4. Power management and optimization
P t
© SRS 2013
r1
Q t
P t+1
Q t+1
r2
r3
rn
r1
Step (t+1)RankCrowdingdistance SelectionStep (t)
Matingpool
Hybrid powertrain model withsupervisory controller
Optimizer
MATLAB
Figure 4.11: NSGA II and model interaction [MKS13]
and mutation are performed to obtain the best parameter variables. Details onadjustment of NSGA II parameter settings such as crossover probability, mutationrate, etc can be found in [Rau15]. One of the reasons for selecting this algorithm isits ability to tackle multi-objectives which might be conflicting in nature which isoften the case with hybrid powertrains.
4.3.1 Optimization goals and constraints
The objective function and constraints are defined as given in [GS07]. The mini-mization of fuel consumption is given by
J =
∫ tf
0
mf (t, u(t))dt , J → min. , (4.2)
where the performance index is denoted by J and fuel mass consumed over a missionof duration tf is denoted by mf , depending on the system input u(t). The fuel massconsumed mf can also be given by the energy required by the fuel cell for the givendrive cycle and represented in terms of fuel cell power PFC as follows
JFC =
∫ tf
t0
PFC(t, u(t))dt , JFC → min. . (4.3)
The other objective is to minimize the SoC deviation which represents the differencebetween the initial and final SoC values of both battery SoCb and supercapacitorSoCsc. Generally, the charge sustenance of the storage elements require small de-viations from nominal value of SoC over the drive cycles. The deviation of the twoSoCs, ∆SoCb and ∆SoCsc can be considered as an integral constraint [GS07] by
J = φ(∆(SoCb + SoCsc)) +
∫ tf
0
mf (t, u(t))dt, (4.4)
4.3 Optimization as a decoupled process 63
where the penalty term φ called the charge-sustaining performance index given as
φ(∆SoCb) = α |(SoCb(t0)− SoCb(tf ))| , (4.5)
φ(∆SoCsc) = β |(SoCsc(t0)− SoCsc(tf ))| , (4.6)
with ∆SoCsc and ∆SoCb as the SoC deviations of supercapacitor and battery attime interval t0 to tf .
Some of the other relevant objective functions are
• Maximization of drivability or minimization of the error between the velocityrequired to be followed and the actual velocity. According to [MOS14], if thedrive cycle is considered as a reference signal, then drivability can be defined asthe system’s capability to fulfil it. It can be given using the integral absoluteerror as [MOS14]
Pdriv = f1(
∫
| vref − vmeas | dt). (4.7)
• Minimization of aging of fuel cell and battery. Both fuel cell and battery tendto degrade faster when subject to frequent and large magnitude changes inpower. In [MOS14], a high pass filter and a suitable function f2 is applied torepresent fuel cell aging minimization as an objective for optimization
Paging = f2(PFC,filt(t))), (4.8)
where PFC,filt(t) is the high pass filtered fuel cell power. The main indicationof battery age is its charge capacity [SOS+11]. Since the traditional cyclesused to evaluate battery aging in laboratories are not same as the real drivingconditions, therefore in [SOS+11], the aging effect has been characterized usingseverity factor σ as
σ(I, θ, SoC) =γ(I, θ, SoC)
Γ=
∫ EOL
0| I(t) | dt
∫ EOL
0| Inorm(t) | dt
, (4.9)
where γ(I, θ, SoC) is the battery Ah-throughput corresponding to given cur-rent I, temperature θ and SoC; Γ is the total Ah-throuput corresponding tothe nominal cycle and nominal current Inorm and EOL is the end of life.
4.3.2 Simulation results and discussion
In this subsection, HEV dynamics corresponding to optimized controller parametersare analyzed. For the two chosen objectives, namely, minimization of fuel consump-tion and SoC deviation of both battery and supercapacitor, the results are analyzedin the following manner:
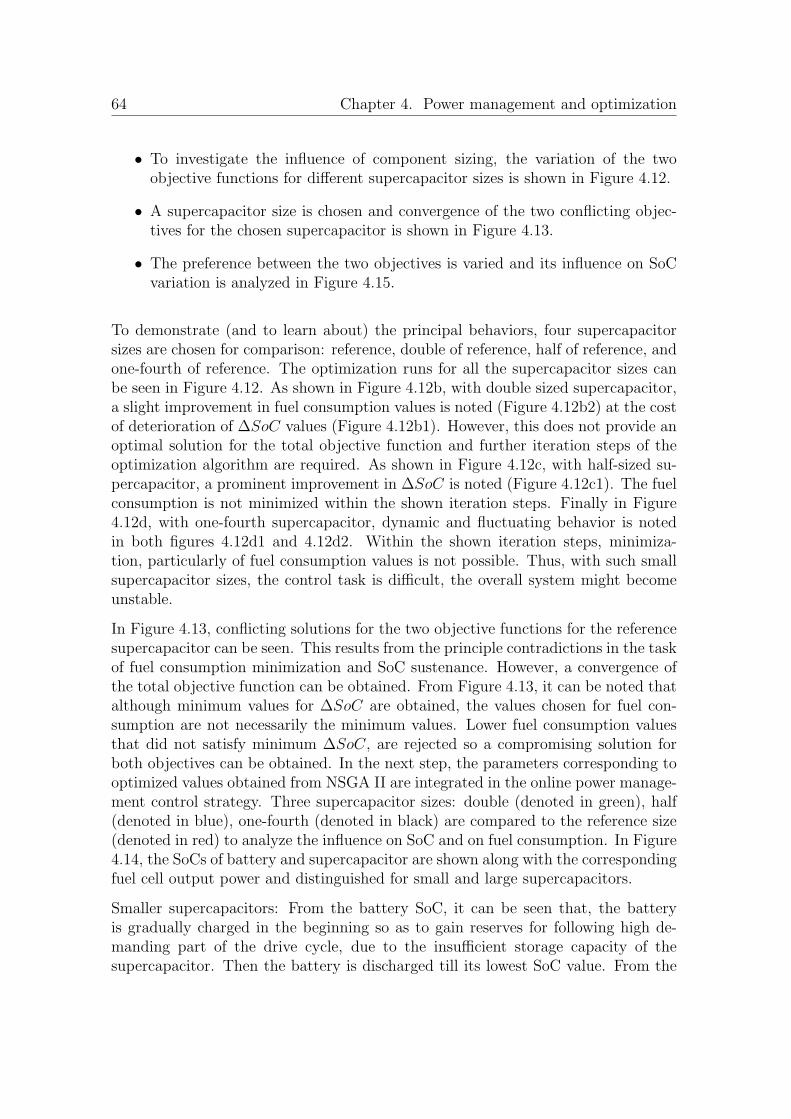
64 Chapter 4. Power management and optimization
• To investigate the influence of component sizing, the variation of the twoobjective functions for different supercapacitor sizes is shown in Figure 4.12.
• A supercapacitor size is chosen and convergence of the two conflicting objec-tives for the chosen supercapacitor is shown in Figure 4.13.
• The preference between the two objectives is varied and its influence on SoCvariation is analyzed in Figure 4.15.
To demonstrate (and to learn about) the principal behaviors, four supercapacitorsizes are chosen for comparison: reference, double of reference, half of reference, andone-fourth of reference. The optimization runs for all the supercapacitor sizes canbe seen in Figure 4.12. As shown in Figure 4.12b, with double sized supercapacitor,a slight improvement in fuel consumption values is noted (Figure 4.12b2) at the costof deterioration of ∆SoC values (Figure 4.12b1). However, this does not provide anoptimal solution for the total objective function and further iteration steps of theoptimization algorithm are required. As shown in Figure 4.12c, with half-sized su-percapacitor, a prominent improvement in ∆SoC is noted (Figure 4.12c1). The fuelconsumption is not minimized within the shown iteration steps. Finally in Figure4.12d, with one-fourth supercapacitor, dynamic and fluctuating behavior is notedin both figures 4.12d1 and 4.12d2. Within the shown iteration steps, minimiza-tion, particularly of fuel consumption values is not possible. Thus, with such smallsupercapacitor sizes, the control task is difficult, the overall system might becomeunstable.
In Figure 4.13, conflicting solutions for the two objective functions for the referencesupercapacitor can be seen. This results from the principle contradictions in the taskof fuel consumption minimization and SoC sustenance. However, a convergence ofthe total objective function can be obtained. From Figure 4.13, it can be noted thatalthough minimum values for ∆SoC are obtained, the values chosen for fuel con-sumption are not necessarily the minimum values. Lower fuel consumption valuesthat did not satisfy minimum ∆SoC, are rejected so a compromising solution forboth objectives can be obtained. In the next step, the parameters corresponding tooptimized values obtained from NSGA II are integrated in the online power manage-ment control strategy. Three supercapacitor sizes: double (denoted in green), half(denoted in blue), one-fourth (denoted in black) are compared to the reference size(denoted in red) to analyze the influence on SoC and on fuel consumption. In Figure4.14, the SoCs of battery and supercapacitor are shown along with the correspondingfuel cell output power and distinguished for small and large supercapacitors.
Smaller supercapacitors: From the battery SoC, it can be seen that, the batteryis gradually charged in the beginning so as to gain reserves for following high de-manding part of the drive cycle, due to the insufficient storage capacity of thesupercapacitor. Then the battery is discharged till its lowest SoC value. From the
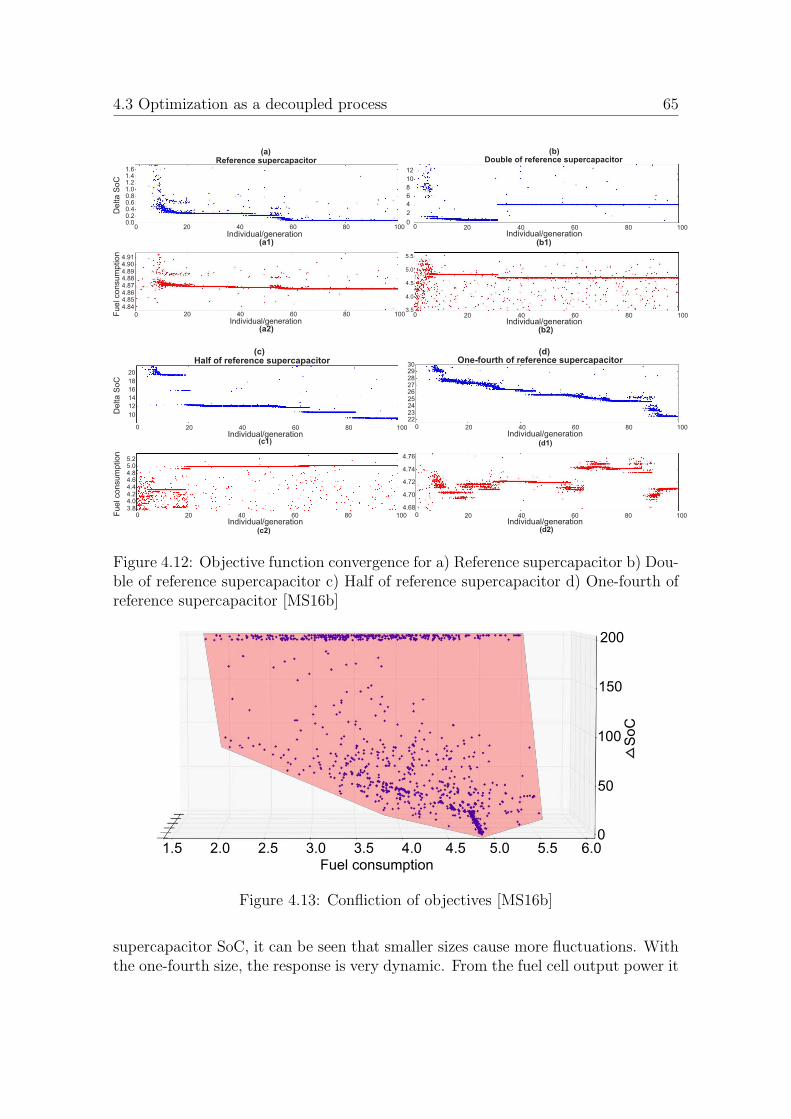
4.3 Optimization as a decoupled process 65
Individual/generation
Fuel consum
ption
Delta S
oC
Individual/generation20 40 60 80 100
1.61.41.21.00.80.60.40.20.0
4.914.904.894.884.874.864.854.84
0
0
Reference supercapacitor
20 40 60 80 100
12
10
8
6
4
2
5.5
5.0
4.5
4.0
3.5
Individual/generation0
Individual/generation0
Double of reference supercapacitor
020 40 60 80 100
20 40 60 80 100
Individual/generation0
Individual/generation0
28272625242322
4.76
4.74
4.72
4.70
4.68
2930
One-fourth of reference supercapacitor
20 40 60 80 100
20 40 60 80 100
(a)
20
18
16
14
12
10
5.25.04.84.64.44.24.03.8
Delta S
oC
Individual/generation0
Individual/generation0
Half of reference supercapacitor
20 40 60 80 100
20 40 60 80 100
(c)
(b)
(d)
(a1)
(a2)
(c1)
(c2)
(b2)
(d2)
(d1)
(b1)
Fuel consum
ption
Figure 4.12: Objective function convergence for a) Reference supercapacitor b) Dou-ble of reference supercapacitor c) Half of reference supercapacitor d) One-fourth ofreference supercapacitor [MS16b]
Fuel consumption1.5 2.0 2.5 3.0 3.5 4.0 4.5 5.0 5.5 6.0
0
50
100
150
200S
oC
Figure 4.13: Confliction of objectives [MS16b]
supercapacitor SoC, it can be seen that smaller sizes cause more fluctuations. Withthe one-fourth size, the response is very dynamic. From the fuel cell output power it
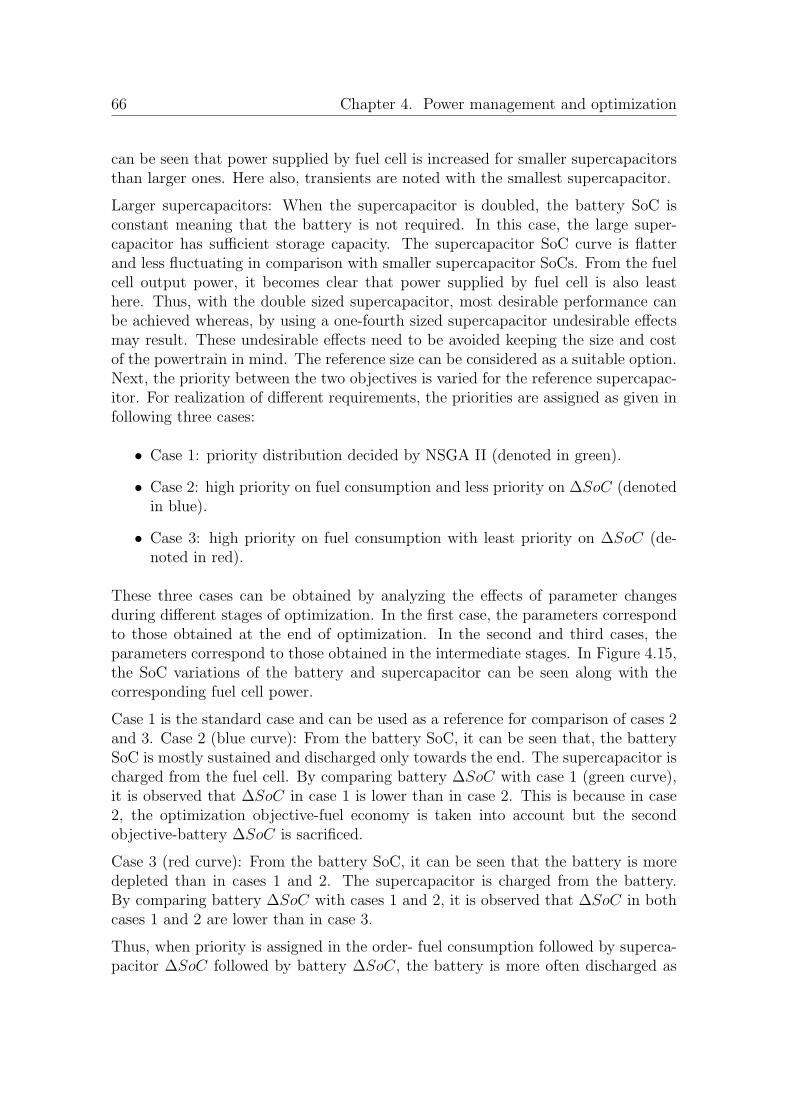
66 Chapter 4. Power management and optimization
can be seen that power supplied by fuel cell is increased for smaller supercapacitorsthan larger ones. Here also, transients are noted with the smallest supercapacitor.
Larger supercapacitors: When the supercapacitor is doubled, the battery SoC isconstant meaning that the battery is not required. In this case, the large super-capacitor has sufficient storage capacity. The supercapacitor SoC curve is flatterand less fluctuating in comparison with smaller supercapacitor SoCs. From the fuelcell output power, it becomes clear that power supplied by fuel cell is also leasthere. Thus, with the double sized supercapacitor, most desirable performance canbe achieved whereas, by using a one-fourth sized supercapacitor undesirable effectsmay result. These undesirable effects need to be avoided keeping the size and costof the powertrain in mind. The reference size can be considered as a suitable option.Next, the priority between the two objectives is varied for the reference supercapac-itor. For realization of different requirements, the priorities are assigned as given infollowing three cases:
• Case 1: priority distribution decided by NSGA II (denoted in green).
• Case 2: high priority on fuel consumption and less priority on ∆SoC (denotedin blue).
• Case 3: high priority on fuel consumption with least priority on ∆SoC (de-noted in red).
These three cases can be obtained by analyzing the effects of parameter changesduring different stages of optimization. In the first case, the parameters correspondto those obtained at the end of optimization. In the second and third cases, theparameters correspond to those obtained in the intermediate stages. In Figure 4.15,the SoC variations of the battery and supercapacitor can be seen along with thecorresponding fuel cell power.
Case 1 is the standard case and can be used as a reference for comparison of cases 2and 3. Case 2 (blue curve): From the battery SoC, it can be seen that, the batterySoC is mostly sustained and discharged only towards the end. The supercapacitor ischarged from the fuel cell. By comparing battery ∆SoC with case 1 (green curve),it is observed that ∆SoC in case 1 is lower than in case 2. This is because in case2, the optimization objective-fuel economy is taken into account but the secondobjective-battery ∆SoC is sacrificed.
Case 3 (red curve): From the battery SoC, it can be seen that the battery is moredepleted than in cases 1 and 2. The supercapacitor is charged from the battery.By comparing battery ∆SoC with cases 1 and 2, it is observed that ∆SoC in bothcases 1 and 2 are lower than in case 3.
Thus, when priority is assigned in the order- fuel consumption followed by superca-pacitor ∆SoC followed by battery ∆SoC, the battery is more often discharged as
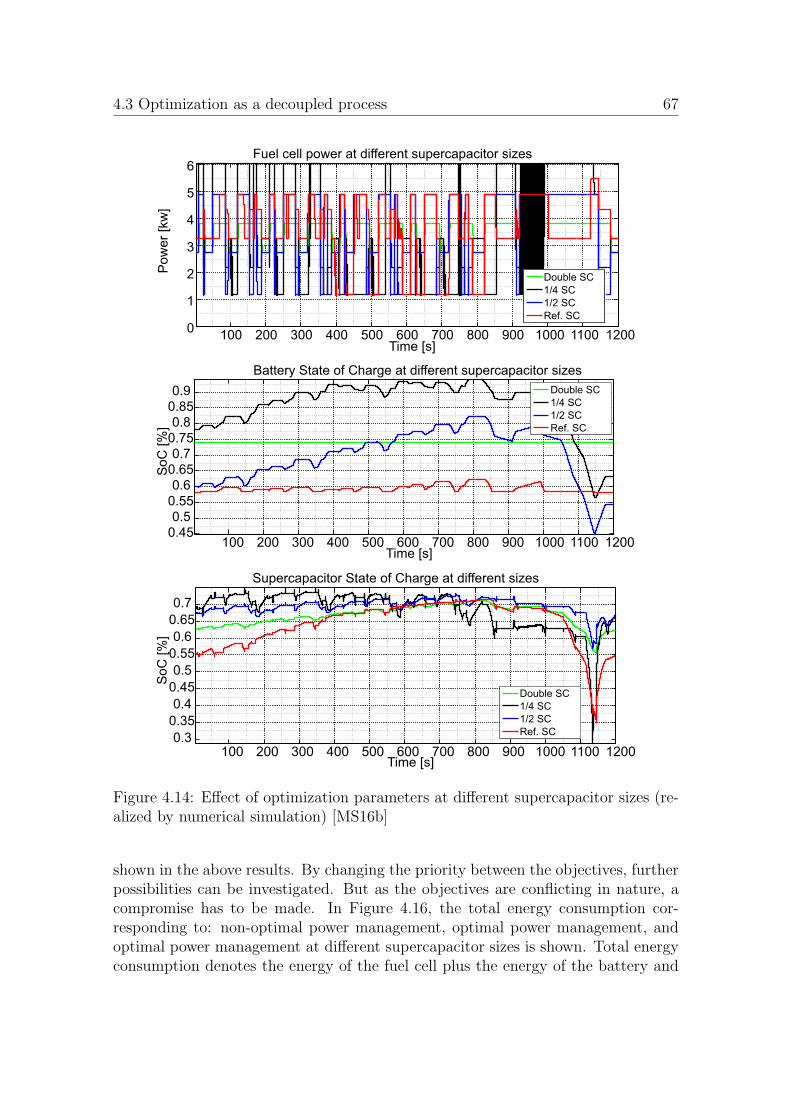
4.3 Optimization as a decoupled process 67
100 200 300 400 500 600 700 800 900 1000 1100 12000
1
2
3
4
5
6
Time [s]
Po
we
r [k
w]
Fuel cell power at different supercapacitor sizes
Double SC
1/4 SC
1/2 SC
Ref. SC
100 200 300 400 500 600 700 800 900 1000 1100 12000.45
0.5
0.55
0.6
0.65
0.7
0.75
0.8
0.85
0.9
Time [s]
So
C [
%]
Battery State of Charge at different supercapacitor sizes
Double SC
1/4 SC
1/2 SC
Ref. SC
100 200 300 400 500 600 700 800 900 1000 1100 12000.3
0.35
0.4
0.45
0.5
0.55
0.6
0.65
0.7
Time [s]
SoC
[%
]
Supercapacitor State of Charge at different sizes
Double SC
1/4 SC
1/2 SC
Ref. SC
Figure 4.14: Effect of optimization parameters at different supercapacitor sizes (re-alized by numerical simulation) [MS16b]
shown in the above results. By changing the priority between the objectives, furtherpossibilities can be investigated. But as the objectives are conflicting in nature, acompromise has to be made. In Figure 4.16, the total energy consumption cor-responding to: non-optimal power management, optimal power management, andoptimal power management at different supercapacitor sizes is shown. Total energyconsumption denotes the energy of the fuel cell plus the energy of the battery and
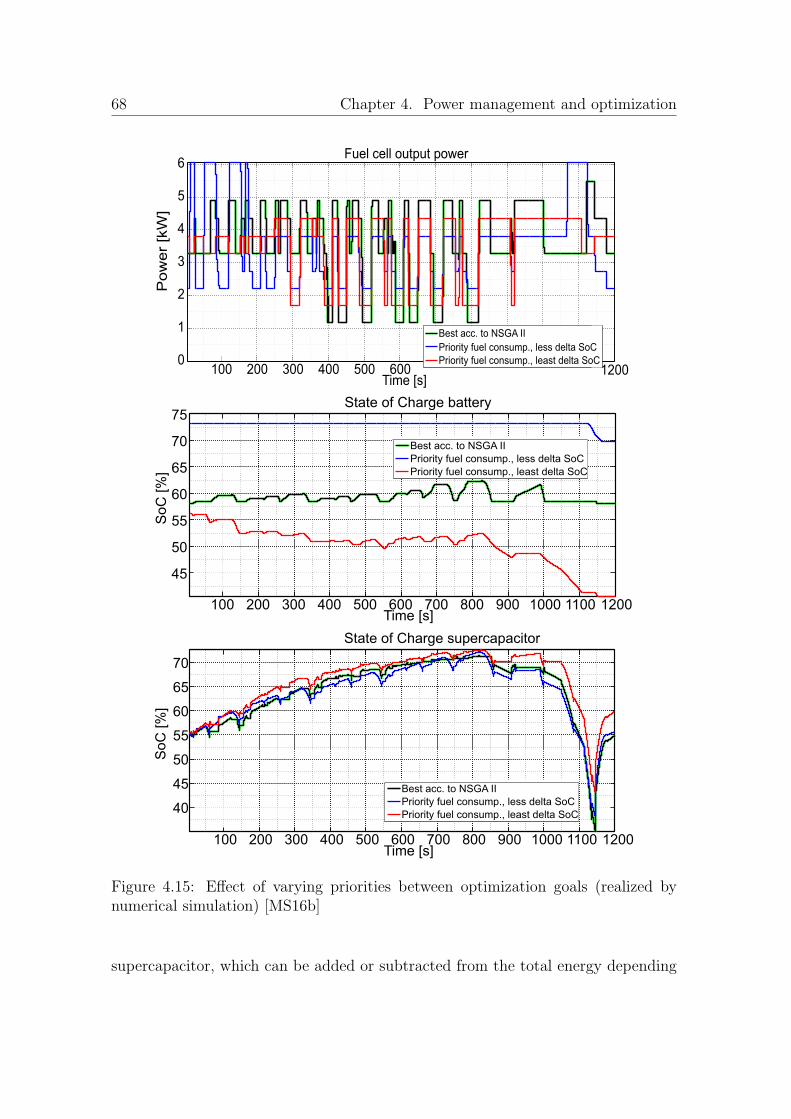
68 Chapter 4. Power management and optimization
100 200 300 400 500 600 700 800 900 1000 1100 1200
45
50
55
60
65
70
75
Time [s]
So
C [
%]
State of Charge battery
Best acc. to NSGA II
Priority fuel consump., less delta SoC
Priority fuel consump., least delta SoC
100 200 300 400 500 600 700 800 900 1000 1100 1200
40
45
50
55
60
65
70
Time [s]
SoC
[%
]
State of Charge supercapacitor
Best acc. to NSGA II
Priority fuel consump., less delta SoC
Priority fuel consump., least delta SoC
100 200 300 400 500 600700 800 900 1000 1100
12000
1
2
3
4
5
6
Time [s]
Po
we
r [k
W]
Fuel cell output power
Best acc. to NSGA II
Priority fuel consump., less delta SoC
Priority fuel consump., least delta SoC
Figure 4.15: Effect of varying priorities between optimization goals (realized bynumerical simulation) [MS16b]
supercapacitor, which can be added or subtracted from the total energy depending
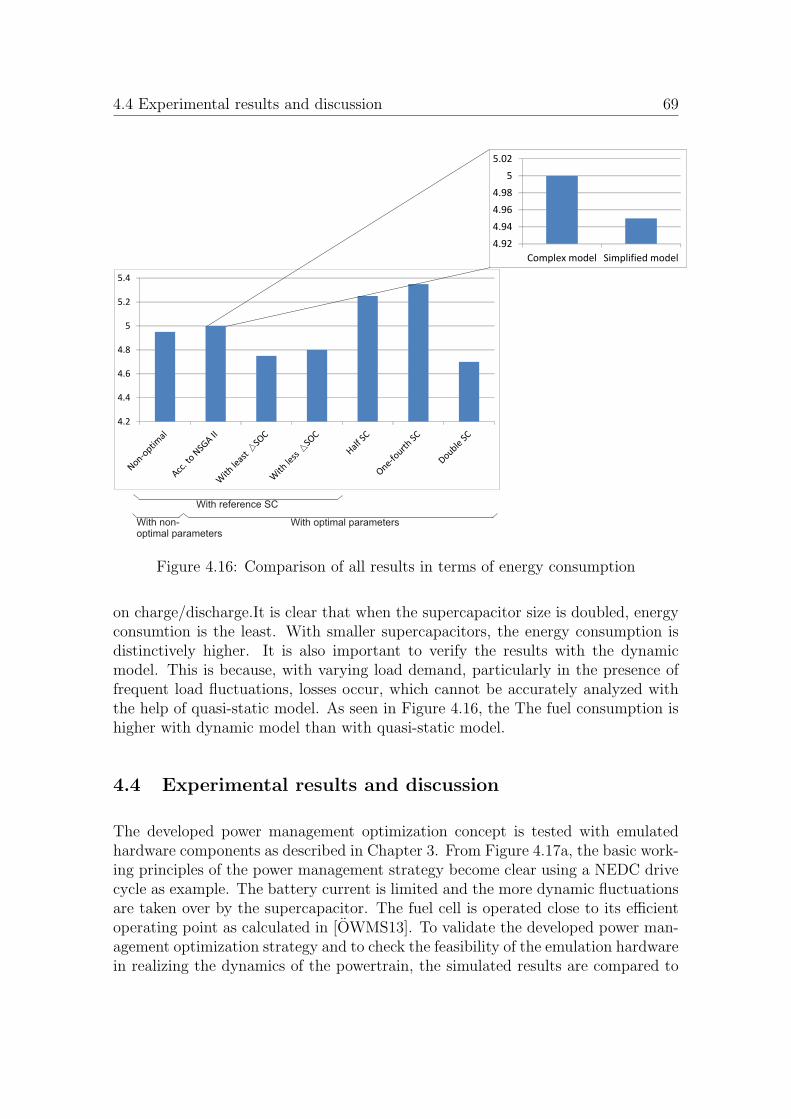
4.4 Experimental results and discussion 69
With reference SC
With optimal parametersWith non-optimal parameters
4.92
4.94
4.96
4.98
5
5.02
Complex model Simplified model
4.2
4.4
4.6
4.8
5
5.2
5.4
Figure 4.16: Comparison of all results in terms of energy consumption
on charge/discharge.It is clear that when the supercapacitor size is doubled, energyconsumtion is the least. With smaller supercapacitors, the energy consumption isdistinctively higher. It is also important to verify the results with the dynamicmodel. This is because, with varying load demand, particularly in the presence offrequent load fluctuations, losses occur, which cannot be accurately analyzed withthe help of quasi-static model. As seen in Figure 4.16, the The fuel consumption ishigher with dynamic model than with quasi-static model.
4.4 Experimental results and discussion
The developed power management optimization concept is tested with emulatedhardware components as described in Chapter 3. From Figure 4.17a, the basic work-ing principles of the power management strategy become clear using a NEDC drivecycle as example. The battery current is limited and the more dynamic fluctuationsare taken over by the supercapacitor. The fuel cell is operated close to its efficientoperating point as calculated in [OWMS13]. To validate the developed power man-agement optimization strategy and to check the feasibility of the emulation hardwarein realizing the dynamics of the powertrain, the simulated results are compared to
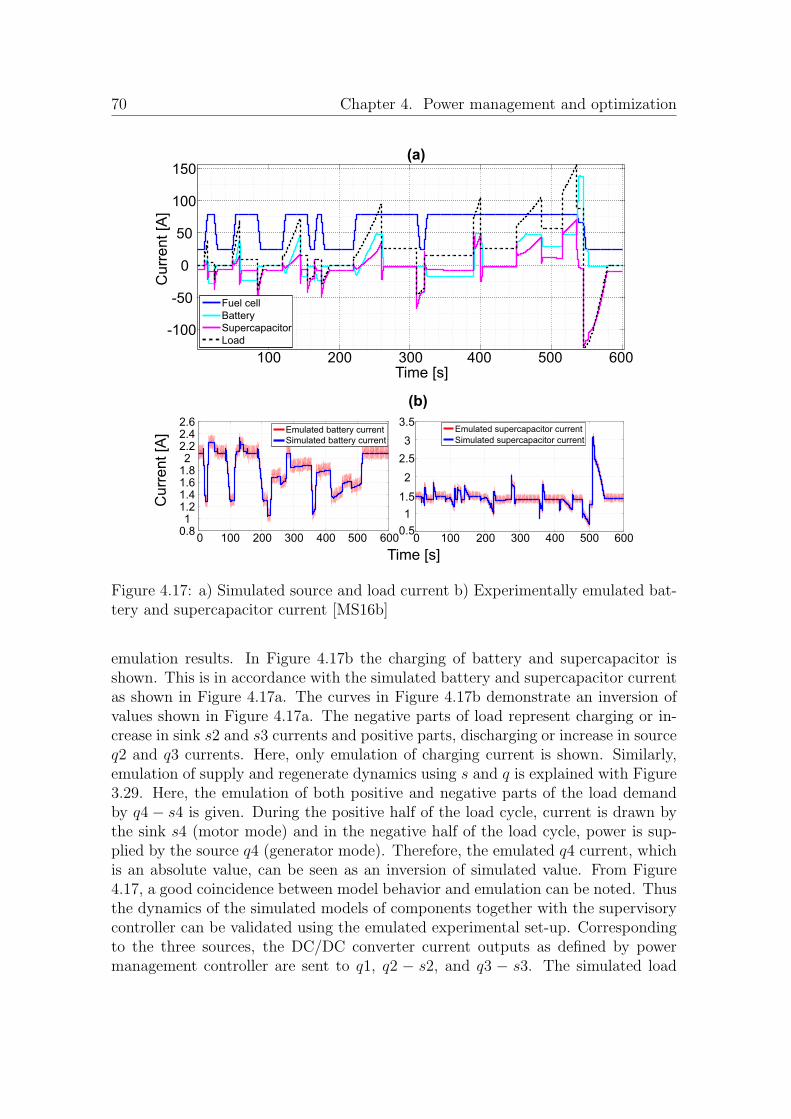
70 Chapter 4. Power management and optimization
100 200 300 400 500 600
-100
-50
0
50
100
150
Time [s]
Cu
rre
nt
[A]
Fuel cell
Battery
Supercapacitor
Load
(a)
0 100 200 300 400 500 6000.81
1.21.41.61.82
2.22.42.6
Emulated battery current
Simulated battery current
0 100 200 300 400 500 6000.5
1
1.5
2
2.5
3
3.5Emulated supercapacitor current
Simulated supercapacitor current
Cu
rre
nt
[A]
Time [s]
(b)
Figure 4.17: a) Simulated source and load current b) Experimentally emulated bat-tery and supercapacitor current [MS16b]
emulation results. In Figure 4.17b the charging of battery and supercapacitor isshown. This is in accordance with the simulated battery and supercapacitor currentas shown in Figure 4.17a. The curves in Figure 4.17b demonstrate an inversion ofvalues shown in Figure 4.17a. The negative parts of load represent charging or in-crease in sink s2 and s3 currents and positive parts, discharging or increase in sourceq2 and q3 currents. Here, only emulation of charging current is shown. Similarly,emulation of supply and regenerate dynamics using s and q is explained with Figure3.29. Here, the emulation of both positive and negative parts of the load demandby q4− s4 is given. During the positive half of the load cycle, current is drawn bythe sink s4 (motor mode) and in the negative half of the load cycle, power is sup-plied by the source q4 (generator mode). Therefore, the emulated q4 current, whichis an absolute value, can be seen as an inversion of simulated value. From Figure4.17, a good coincidence between model behavior and emulation can be noted. Thusthe dynamics of the simulated models of components together with the supervisorycontroller can be validated using the emulated experimental set-up. Correspondingto the three sources, the DC/DC converter current outputs as defined by powermanagement controller are sent to q1, q2 − s2, and q3 − s3. The simulated load

4.4 Experimental results and discussion 71
current from the backward modeled part is sent to q4− s4.
72
5 Scope of developed rule-based power manage-
ment controller
This chapter is published in the form of scientific papers [MS16a],[MWS15]. To in-vestigate the adaption of the developed power management strategy with respect tounknown driving patterns, three contributions can be considered. These three differ-ent directions of contributions are relevant because all three deal with multiple powersources and implement online power management based on rules. In all three direc-tions, the developed power management has either been tested on a variety of drivecycles or subjected to real driving data. Typical for the first direction as publishedin [PDRL07], a fuel cell-battery-supercapacitor hybrid electric vehicle is considered.The control strategy for power split and charge sustainment is derived based on theadvantage of battery-supercapacitor combination. The power demand is addressedby the sources in the following order: fuel cell followed by supercapacitor and thenbattery. The power sharing between battery and supercapacitors is governed by apower split value which is one of the optimization variables. Along with power split,the other optimization parameters include both control and design parameters suchas battery and supercapacitor upper and lower bounds. The optimization methodchosen is a multi-objective genetic algorithm with the aim to minimize both fuelconsumption and difference between final and initial battery state-of-charge (SoC).The optimization is carried out with two constraints: first with designs that limitthe hydrogen fuel consumption, second with designs that preserve the total amountof energy stored in the battery i.e., the initial battery SoC is set to 70%. Differentpareto optimal fronts are obtained for 4 different driving cycles from where pointof minimum fuel consumption is chosen. The utilization percentages show that theoptimal utilization of the three power sources vary with the drive cycle chosen. Arepresentative for the second direction is the contribution given in [TGGL14], herean engine-battery-motor and generator PHEV is considered. The goal of the devel-oped power management strategy is to improve fuel efficiency without deterioratingperformance considering that the vehicle is steered by a human. The strategy istested for three different drive cycles repeated over different geographic locations.Here, four operation modes are defined and each mode has its own optimizationproblem definition. The modes are individually offline optimized and then imple-mented in the online rule based controller. The control strategy selects the mostappropriate mode depending on the SoC of the battery. Thus, here SoC is consideredas a criteria for selecting modes. The third direction is described by contribution[CMM]. The optimal online power management developed in [CMM] is a step fur-ther in considering four sources: engine, fuel cell, battery, and supercapacitor. Afuzzy-rule-based power management is combined with machine learning algorithmto train an intelligent controller that has the capability to find the optimal com-bination of power sources that minimize power losses, keep the SoCs of all storagecomponents within bounds, and minimize bus voltage fluctuation. Here, the con-
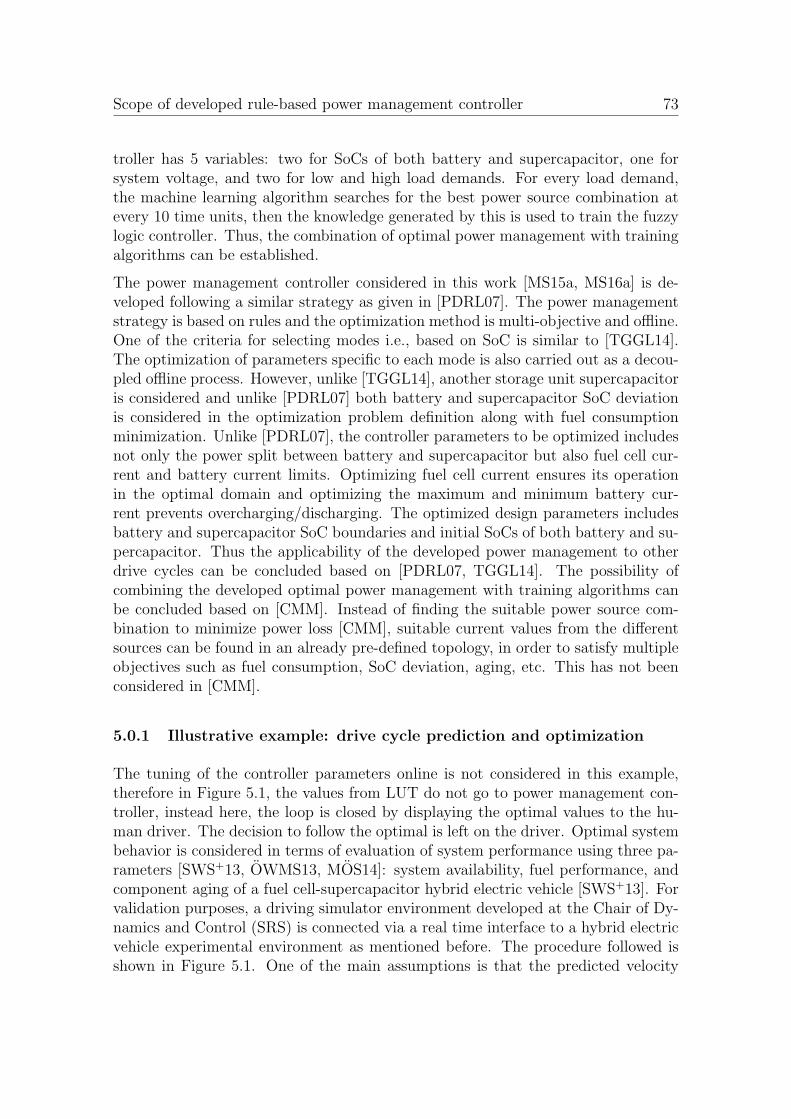
Scope of developed rule-based power management controller 73
troller has 5 variables: two for SoCs of both battery and supercapacitor, one forsystem voltage, and two for low and high load demands. For every load demand,the machine learning algorithm searches for the best power source combination atevery 10 time units, then the knowledge generated by this is used to train the fuzzylogic controller. Thus, the combination of optimal power management with trainingalgorithms can be established.
The power management controller considered in this work [MS15a, MS16a] is de-veloped following a similar strategy as given in [PDRL07]. The power managementstrategy is based on rules and the optimization method is multi-objective and offline.One of the criteria for selecting modes i.e., based on SoC is similar to [TGGL14].The optimization of parameters specific to each mode is also carried out as a decou-pled offline process. However, unlike [TGGL14], another storage unit supercapacitoris considered and unlike [PDRL07] both battery and supercapacitor SoC deviationis considered in the optimization problem definition along with fuel consumptionminimization. Unlike [PDRL07], the controller parameters to be optimized includesnot only the power split between battery and supercapacitor but also fuel cell cur-rent and battery current limits. Optimizing fuel cell current ensures its operationin the optimal domain and optimizing the maximum and minimum battery cur-rent prevents overcharging/discharging. The optimized design parameters includesbattery and supercapacitor SoC boundaries and initial SoCs of both battery and su-percapacitor. Thus the applicability of the developed power management to otherdrive cycles can be concluded based on [PDRL07, TGGL14]. The possibility ofcombining the developed optimal power management with training algorithms canbe concluded based on [CMM]. Instead of finding the suitable power source com-bination to minimize power loss [CMM], suitable current values from the differentsources can be found in an already pre-defined topology, in order to satisfy multipleobjectives such as fuel consumption, SoC deviation, aging, etc. This has not beenconsidered in [CMM].
5.0.1 Illustrative example: drive cycle prediction and optimization
The tuning of the controller parameters online is not considered in this example,therefore in Figure 5.1, the values from LUT do not go to power management con-troller, instead here, the loop is closed by displaying the optimal values to the hu-man driver. The decision to follow the optimal is left on the driver. Optimal systembehavior is considered in terms of evaluation of system performance using three pa-rameters [SWS+13, OWMS13, MOS14]: system availability, fuel performance, andcomponent aging of a fuel cell-supercapacitor hybrid electric vehicle [SWS+13]. Forvalidation purposes, a driving simulator environment developed at the Chair of Dy-namics and Control (SRS) is connected via a real time interface to a hybrid electricvehicle experimental environment as mentioned before. The procedure followed isshown in Figure 5.1. One of the main assumptions is that the predicted velocity
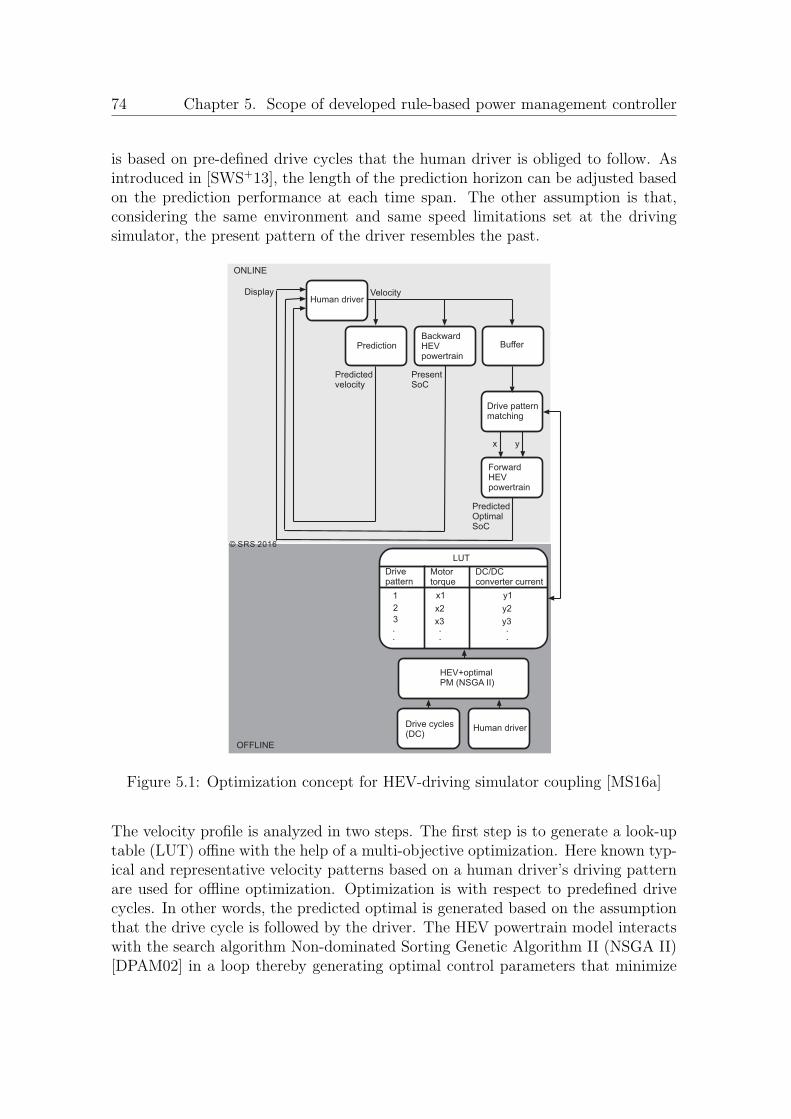
74 Chapter 5. Scope of developed rule-based power management controller
is based on pre-defined drive cycles that the human driver is obliged to follow. Asintroduced in [SWS+13], the length of the prediction horizon can be adjusted basedon the prediction performance at each time span. The other assumption is that,considering the same environment and same speed limitations set at the drivingsimulator, the present pattern of the driver resembles the past.
Drive patternmatching
OFFLINE
ONLINE
© SRS 2016
Prediction
Velocity
Drive cycles(DC)
HEV+optimalPM (NSGA II)
ForwardHEVpowertrain
Drivepattern
Motortorque
1 x1
LUT
2
3
x2
x3
Human driver
DC/DCconverter current
.
...
y1
y2
y3..
BufferBackwardHEVpowertrain
Human driverDisplay
Predictedvelocity
PresentSoC
PredictedOptimalSoC
x y
Figure 5.1: Optimization concept for HEV-driving simulator coupling [MS16a]
The velocity profile is analyzed in two steps. The first step is to generate a look-uptable (LUT) offine with the help of a multi-objective optimization. Here known typ-ical and representative velocity patterns based on a human driver’s driving patternare used for offline optimization. Optimization is with respect to predefined drivecycles. In other words, the predicted optimal is generated based on the assumptionthat the drive cycle is followed by the driver. The HEV powertrain model interactswith the search algorithm Non-dominated Sorting Genetic Algorithm II (NSGA II)[DPAM02] in a loop thereby generating optimal control parameters that minimize
Scope of developed rule-based power management controller 75
the cost function for the predicted velocity. The optimal parameters are obtainedfor each representative driver velocity pattern. These parameters are motor torqueand DC/DC converter current. The velocity values obtained from the driver arerecorded and analyzed in a discrete manner. For example, if the optimization loopis run for every 5 seconds of the driver velocity recorded, then an optimal set of pa-rameters are obtained for each of these velocity segments. The intervals of recordingcan be chosen small enough to ensure accuracy. A look-up table constructed at theend of the last optimization run provides a pattern analysis for the human driver’svelocity values whereby each pattern is accompanied by its corresponding optimalparameter values.
The next step is to implement this look-up table online. Considering the same en-vironment and same speed limitations set at the driving simulator, the velocity ofthe human driver is now analyzed with the help of this look-up table. A program tomatch the incoming velocity values with the values in the table sends the correspond-ing optimal motor torque and DC/DC converter current (for the predicted velocity)to the forward powertrain. Forward modeling in this case allows the realization ofthe vehicle behavior corresponding to optimal parameters, hence the correspondingoptimal SoC is calculated. The incoming driver velocity is also sent to a backwardmodeled HEV in order to calculate the present SoC. Backward model in this caseimplies that velocity is taken as input and vehicle behavior is calculated backwards.An online prediction of the driver velocity according to the prediction algorithm in[SWS+13], [MS12] is carried out. Here, prediction is based on reference drive cyclesand the assumption that the present behavioral pattern of the driver resembles thepast. The predicted velocity, present SoC, and optimal SoC for predicted velocityare displayed to the human driver by a suitable interface.
5.0.1.1 Powertrain configuration and optimization goals
The HEV powertrain in range extender topology is shown in Figure 5.2. As detailedin [Mar], the charging/discharging dynamics of the supercapacitor is related to thecontrol of mono directional DC/DC converter. Here the bus voltage is equal tosupercapacitor and motor voltage. The modeling corresponding to this topology isdone according to [Mar, MOS14, OWMS13]. The emulator system for this power-train topology is given in [Mar]. The primary source (fuel cell) emulation is realizedby controlled power source and voltage-current controlled mono-directional DC/DCconverter. The supercapacitor dynamics is realized by controlled power source-sinkcombination. The drivetrain is emulated by a speed controlled electric drive motorand torque controlled load motor. The charging dynamics of suercapacitor is givenby [Mar]
Usc =1
C
∫
Iscdt, (5.1)
76 Chapter 5. Scope of developed rule-based power management controller
Fuelcell
DC/DCconverter
InverterElectricalmotor
Super-capacitor
Figure 5.2: Topology of HEV powertrain according to [OWMS13]
where C denotes the capacity, Isc, the current flow, and Usc the voltage which isproportional to SoC. The power flow control is realized by DC/DC converter as
[Ubus
Ibus
]
(k + 1) = f(Ubus(k), Ibus(k), sDCDC(k)), (5.2)
where the bus voltage (Ubus) and current (Ibus) are defined as the output of theDC/DC converter. The control signal is given by (sDCDC). The power managementin [Mar] includes two control signals: current flow of DC/DC converter and vehiclespeed. Here, the rotational speed of the powertrain model relates to the rotationalspeed of the emulator motor and the current relates to the load applied. Thus,the dynamical model of the complete powertrain is described by a discrete-timenonlinear state space model. The dynamic behavior of the motor is given by
xmot(k + 1) =
[imot
vmot
]
(k+1)
, (5.3)
where,
xmot(k + 1) = f(smot(k), xmot(k)). (5.4)
The motor current and speed are denoted by imot and vmot respectively. The controlinput is denoted by smot. The dynamic behavior of the supercapacitors is given bya LTI discrete-time state space model as follows
xSC(k + 1) = ASCxSC(k) +BSCuSC(k), (5.5)
where the state of the supercapacitor is denoted by xSC . In range extender topology,the bus voltage is defined as the state of the supercapcitor model. The input isdenoted by uSC denoting the supercapacitor current iSC . With the chosen range
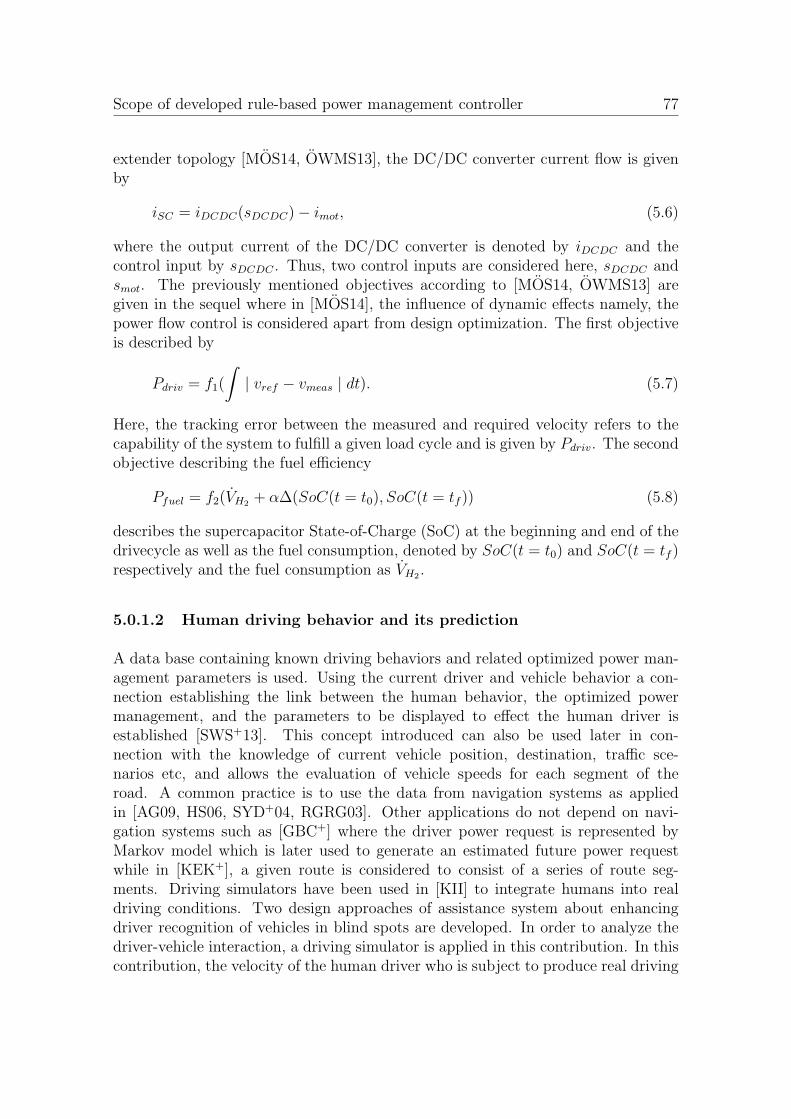
Scope of developed rule-based power management controller 77
extender topology [MOS14, OWMS13], the DC/DC converter current flow is givenby
iSC = iDCDC(sDCDC)− imot, (5.6)
where the output current of the DC/DC converter is denoted by iDCDC and thecontrol input by sDCDC . Thus, two control inputs are considered here, sDCDC andsmot. The previously mentioned objectives according to [MOS14, OWMS13] aregiven in the sequel where in [MOS14], the influence of dynamic effects namely, thepower flow control is considered apart from design optimization. The first objectiveis described by
Pdriv = f1(
∫
| vref − vmeas | dt). (5.7)
Here, the tracking error between the measured and required velocity refers to thecapability of the system to fulfill a given load cycle and is given by Pdriv. The secondobjective describing the fuel efficiency
Pfuel = f2(VH2+ α∆(SoC(t = t0), SoC(t = tf )) (5.8)
describes the supercapacitor State-of-Charge (SoC) at the beginning and end of thedrivecycle as well as the fuel consumption, denoted by SoC(t = t0) and SoC(t = tf )respectively and the fuel consumption as VH2
.
5.0.1.2 Human driving behavior and its prediction
A data base containing known driving behaviors and related optimized power man-agement parameters is used. Using the current driver and vehicle behavior a con-nection establishing the link between the human behavior, the optimized powermanagement, and the parameters to be displayed to effect the human driver isestablished [SWS+13]. This concept introduced can also be used later in con-nection with the knowledge of current vehicle position, destination, traffic sce-narios etc, and allows the evaluation of vehicle speeds for each segment of theroad. A common practice is to use the data from navigation systems as appliedin [AG09, HS06, SYD+04, RGRG03]. Other applications do not depend on navi-gation systems such as [GBC+] where the driver power request is represented byMarkov model which is later used to generate an estimated future power requestwhile in [KEK+], a given route is considered to consist of a series of route seg-ments. Driving simulators have been used in [KII] to integrate humans into realdriving conditions. Two design approaches of assistance system about enhancingdriver recognition of vehicles in blind spots are developed. In order to analyze thedriver-vehicle interaction, a driving simulator is applied in this contribution. In thiscontribution, the velocity of the human driver who is subject to produce real driving
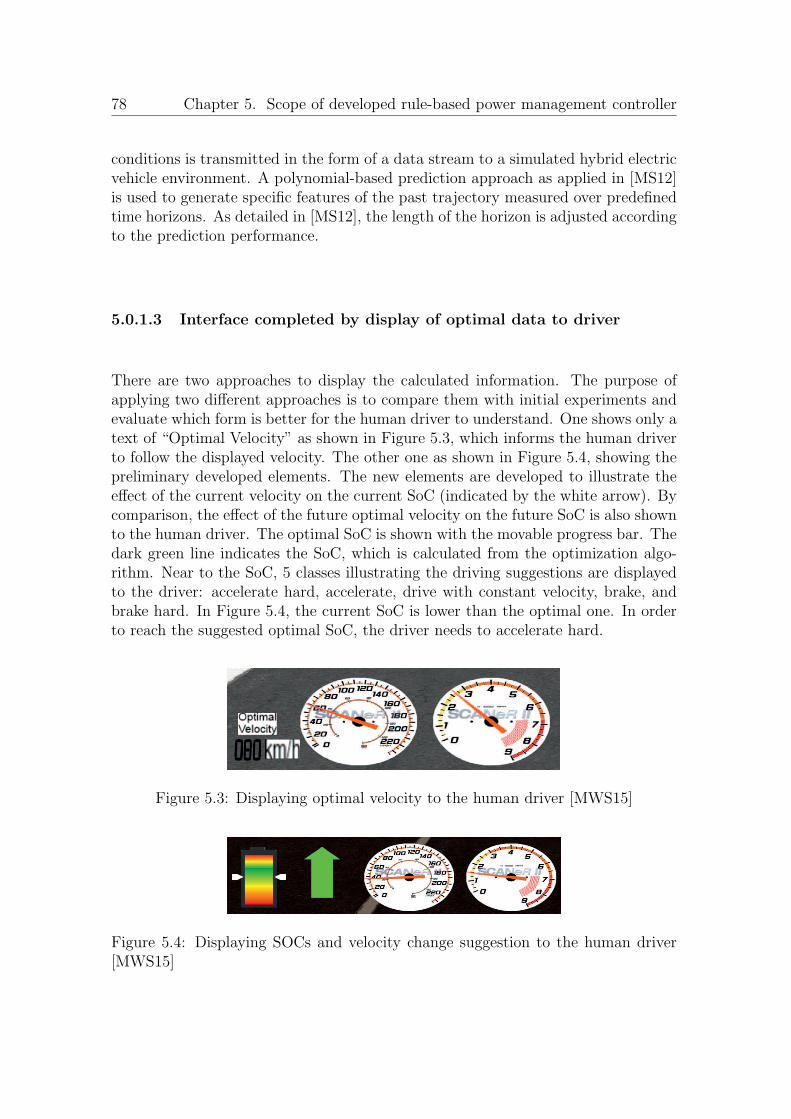
78 Chapter 5. Scope of developed rule-based power management controller
conditions is transmitted in the form of a data stream to a simulated hybrid electricvehicle environment. A polynomial-based prediction approach as applied in [MS12]is used to generate specific features of the past trajectory measured over predefinedtime horizons. As detailed in [MS12], the length of the horizon is adjusted accordingto the prediction performance.
5.0.1.3 Interface completed by display of optimal data to driver
There are two approaches to display the calculated information. The purpose ofapplying two different approaches is to compare them with initial experiments andevaluate which form is better for the human driver to understand. One shows only atext of “Optimal Velocity” as shown in Figure 5.3, which informs the human driverto follow the displayed velocity. The other one as shown in Figure 5.4, showing thepreliminary developed elements. The new elements are developed to illustrate theeffect of the current velocity on the current SoC (indicated by the white arrow). Bycomparison, the effect of the future optimal velocity on the future SoC is also shownto the human driver. The optimal SoC is shown with the movable progress bar. Thedark green line indicates the SoC, which is calculated from the optimization algo-rithm. Near to the SoC, 5 classes illustrating the driving suggestions are displayedto the driver: accelerate hard, accelerate, drive with constant velocity, brake, andbrake hard. In Figure 5.4, the current SoC is lower than the optimal one. In orderto reach the suggested optimal SoC, the driver needs to accelerate hard.
Figure 5.3: Displaying optimal velocity to the human driver [MWS15]
Figure 5.4: Displaying SOCs and velocity change suggestion to the human driver[MWS15]
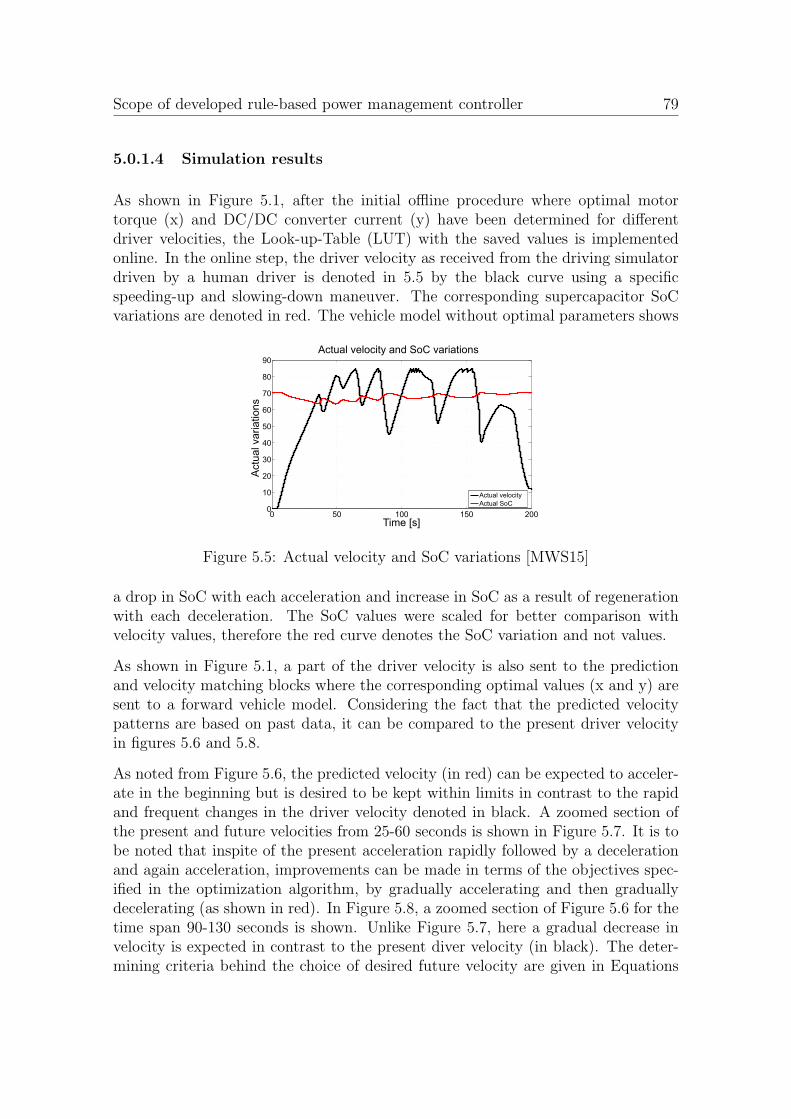
Scope of developed rule-based power management controller 79
5.0.1.4 Simulation results
As shown in Figure 5.1, after the initial offline procedure where optimal motortorque (x) and DC/DC converter current (y) have been determined for differentdriver velocities, the Look-up-Table (LUT) with the saved values is implementedonline. In the online step, the driver velocity as received from the driving simulatordriven by a human driver is denoted in 5.5 by the black curve using a specificspeeding-up and slowing-down maneuver. The corresponding supercapacitor SoCvariations are denoted in red. The vehicle model without optimal parameters shows
0 50 100 150 2000
10
20
30
40
50
60
70
80
90
Time [s]
Actu
al va
ria
tio
ns
Actual velocity and SoC variations
Actual velocity
Actual SoC
Figure 5.5: Actual velocity and SoC variations [MWS15]
a drop in SoC with each acceleration and increase in SoC as a result of regenerationwith each deceleration. The SoC values were scaled for better comparison withvelocity values, therefore the red curve denotes the SoC variation and not values.
As shown in Figure 5.1, a part of the driver velocity is also sent to the predictionand velocity matching blocks where the corresponding optimal values (x and y) aresent to a forward vehicle model. Considering the fact that the predicted velocitypatterns are based on past data, it can be compared to the present driver velocityin figures 5.6 and 5.8.
As noted from Figure 5.6, the predicted velocity (in red) can be expected to acceler-ate in the beginning but is desired to be kept within limits in contrast to the rapidand frequent changes in the driver velocity denoted in black. A zoomed section ofthe present and future velocities from 25-60 seconds is shown in Figure 5.7. It is tobe noted that inspite of the present acceleration rapidly followed by a decelerationand again acceleration, improvements can be made in terms of the objectives spec-ified in the optimization algorithm, by gradually accelerating and then graduallydecelerating (as shown in red). In Figure 5.8, a zoomed section of Figure 5.6 for thetime span 90-130 seconds is shown. Unlike Figure 5.7, here a gradual decrease invelocity is expected in contrast to the present diver velocity (in black). The deter-mining criteria behind the choice of desired future velocity are given in Equations
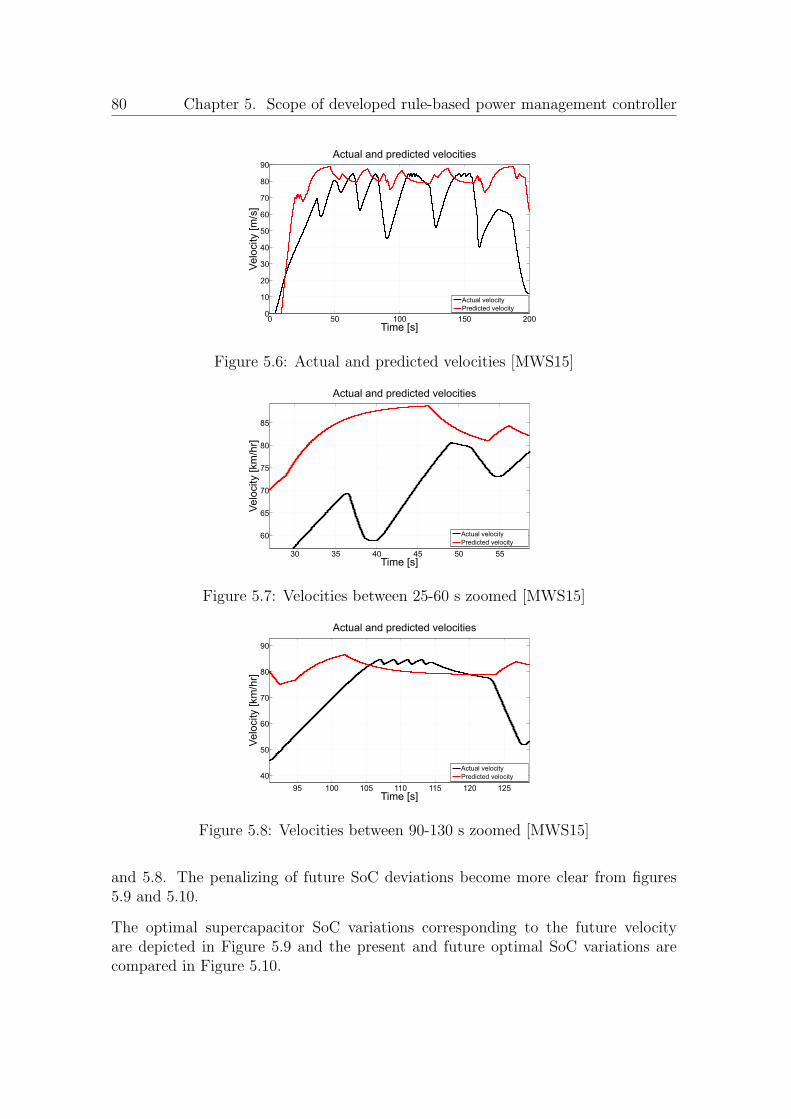
80 Chapter 5. Scope of developed rule-based power management controller
0 50 100 150 2000
10
20
30
40
50
60
70
80
90
Time [s]
Velo
city [m
/s]
Actual and predicted velocities
Actual velocity
Predicted velocity
Figure 5.6: Actual and predicted velocities [MWS15]
30 35 40 45 50 55
60
65
70
75
80
85
Time [s]
Velo
city [km
/hr]
Actual and predicted velocities
Actual velocity
Predicted velocity
Figure 5.7: Velocities between 25-60 s zoomed [MWS15]
95 100 105 110 115 120 125
40
50
60
70
80
90
Time [s]
Velo
city [km
/hr]
Actual and predicted velocities
Actual velocity
Predicted velocity
Figure 5.8: Velocities between 90-130 s zoomed [MWS15]
and 5.8. The penalizing of future SoC deviations become more clear from figures5.9 and 5.10.
The optimal supercapacitor SoC variations corresponding to the future velocityare depicted in Figure 5.9 and the present and future optimal SoC variations arecompared in Figure 5.10.
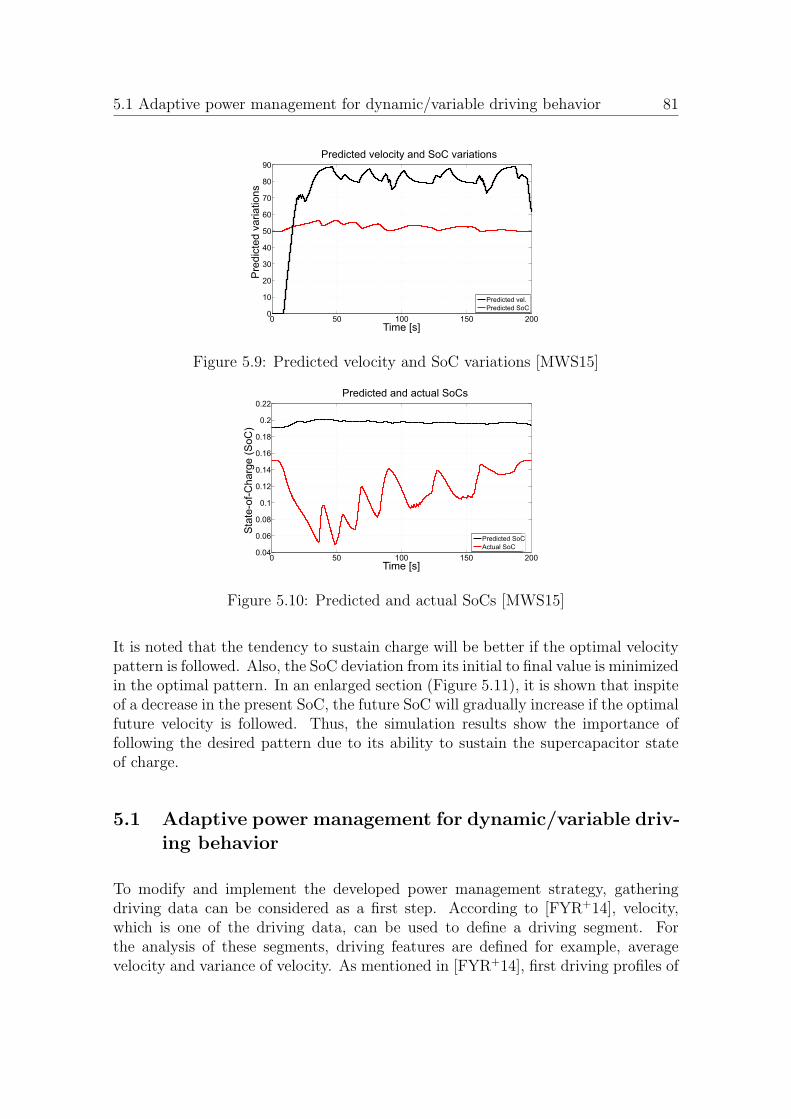
5.1 Adaptive power management for dynamic/variable driving behavior 81
0 50 100 150 2000
10
20
30
40
50
60
70
80
90
Time [s]
Pre
dic
ted
va
ria
tio
ns
Predicted velocity and SoC variations
Predicted vel.
Predicted SoC
Figure 5.9: Predicted velocity and SoC variations [MWS15]
0 50 100 150 2000.04
0.06
0.08
0.1
0.12
0.14
0.16
0.18
0.2
0.22
Time [s]
Sta
te-o
f-C
harg
e (
SoC
)
Predicted and actual SoCs
Predicted SoC
Actual SoC
Figure 5.10: Predicted and actual SoCs [MWS15]
It is noted that the tendency to sustain charge will be better if the optimal velocitypattern is followed. Also, the SoC deviation from its initial to final value is minimizedin the optimal pattern. In an enlarged section (Figure 5.11), it is shown that inspiteof a decrease in the present SoC, the future SoC will gradually increase if the optimalfuture velocity is followed. Thus, the simulation results show the importance offollowing the desired pattern due to its ability to sustain the supercapacitor stateof charge.
5.1 Adaptive power management for dynamic/variable driv-
ing behavior
To modify and implement the developed power management strategy, gatheringdriving data can be considered as a first step. According to [FYR+14], velocity,which is one of the driving data, can be used to define a driving segment. Forthe analysis of these segments, driving features are defined for example, averagevelocity and variance of velocity. As mentioned in [FYR+14], first driving profiles of
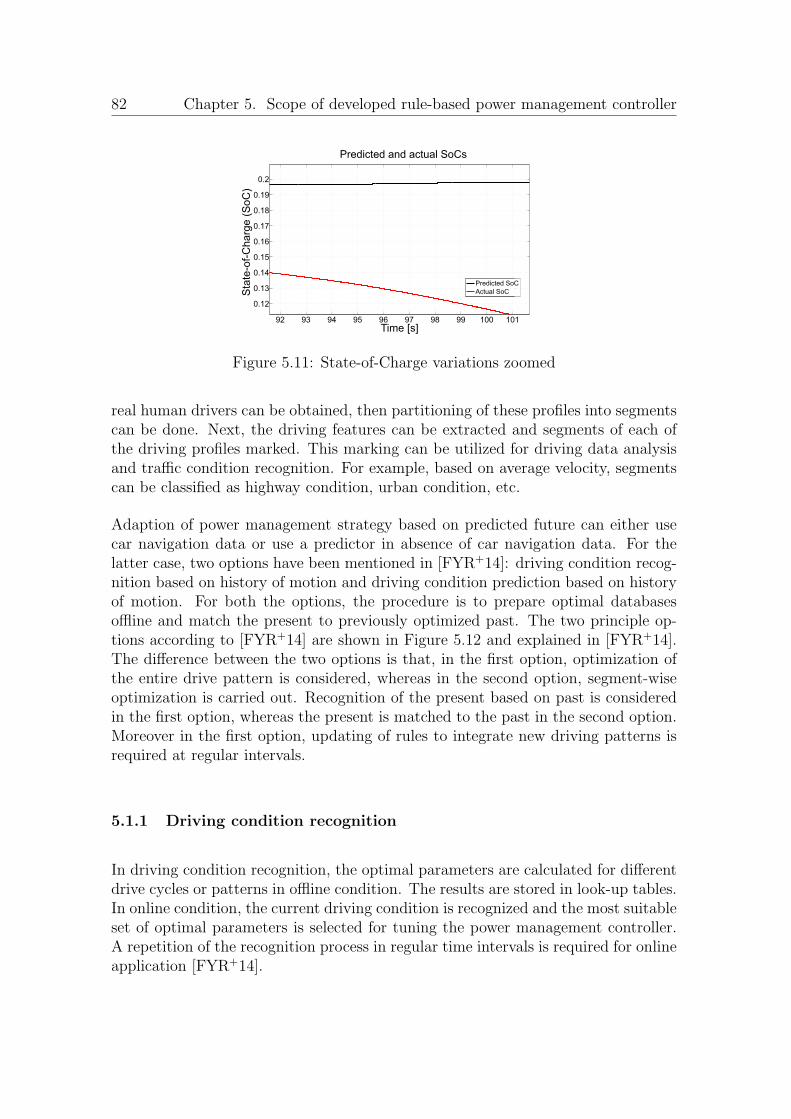
82 Chapter 5. Scope of developed rule-based power management controller
92 93 94 95 96 97 98 99 100 101
0.12
0.13
0.14
0.15
0.16
0.17
0.18
0.19
0.2
Time [s]
Sta
te-o
f-C
ha
rge
(S
oC
)
Predicted and actual SoCs
Predicted SoC
Actual SoC
Figure 5.11: State-of-Charge variations zoomed
real human drivers can be obtained, then partitioning of these profiles into segmentscan be done. Next, the driving features can be extracted and segments of each ofthe driving profiles marked. This marking can be utilized for driving data analysisand traffic condition recognition. For example, based on average velocity, segmentscan be classified as highway condition, urban condition, etc.
Adaption of power management strategy based on predicted future can either usecar navigation data or use a predictor in absence of car navigation data. For thelatter case, two options have been mentioned in [FYR+14]: driving condition recog-nition based on history of motion and driving condition prediction based on historyof motion. For both the options, the procedure is to prepare optimal databasesoffline and match the present to previously optimized past. The two principle op-tions according to [FYR+14] are shown in Figure 5.12 and explained in [FYR+14].The difference between the two options is that, in the first option, optimization ofthe entire drive pattern is considered, whereas in the second option, segment-wiseoptimization is carried out. Recognition of the present based on past is consideredin the first option, whereas the present is matched to the past in the second option.Moreover in the first option, updating of rules to integrate new driving patterns isrequired at regular intervals.
5.1.1 Driving condition recognition
In driving condition recognition, the optimal parameters are calculated for differentdrive cycles or patterns in offline condition. The results are stored in look-up tables.In online condition, the current driving condition is recognized and the most suitableset of optimal parameters is selected for tuning the power management controller.A repetition of the recognition process in regular time intervals is required for onlineapplication [FYR+14].

5.1 Adaptive power management for dynamic/variable driving behavior 83
Driving conditionrecognition HEV controller
Driving pro lefi
Trained neural networksfor velocity timeseries prediction
No. of optimized controlmodes ( ) for timesm mn ec.s driving segments
Prediction of sn ec.ahead usingneural networks
Similarity search,selection of most similarn ec.s in database
Using the tunedcontroller for nextn ec.s
Velocity pro lefievery sn ec,
Tuning ofcontrollerparameters
Driving database prepared of inefl
Driving condition prediction
Driving condition recognition
Figure 5.12: Implementation possibilities of adaptive control (according to[FYR+14])[MS16a]
As detailed in [MS15b], an adaptive power management based on driving patternrecognition is presented in [LJPML04]. The procedure followed is capable of execut-ing an optimal online power management, along with driver velocity classificationand prediction without using complicated algorithms. Here, two separate offlineprocesses are considered as shown in Figure 5.13: first, representative drive cyclesare used to generate six driving patterns satisfying certain criteria. These patternsare classified according to power demand and stored in a look-up table for onlineimplementation; second, where the same six representative drive cycles are analyzedfor determining the optimal power split that minimizes fuel consumption. Based on
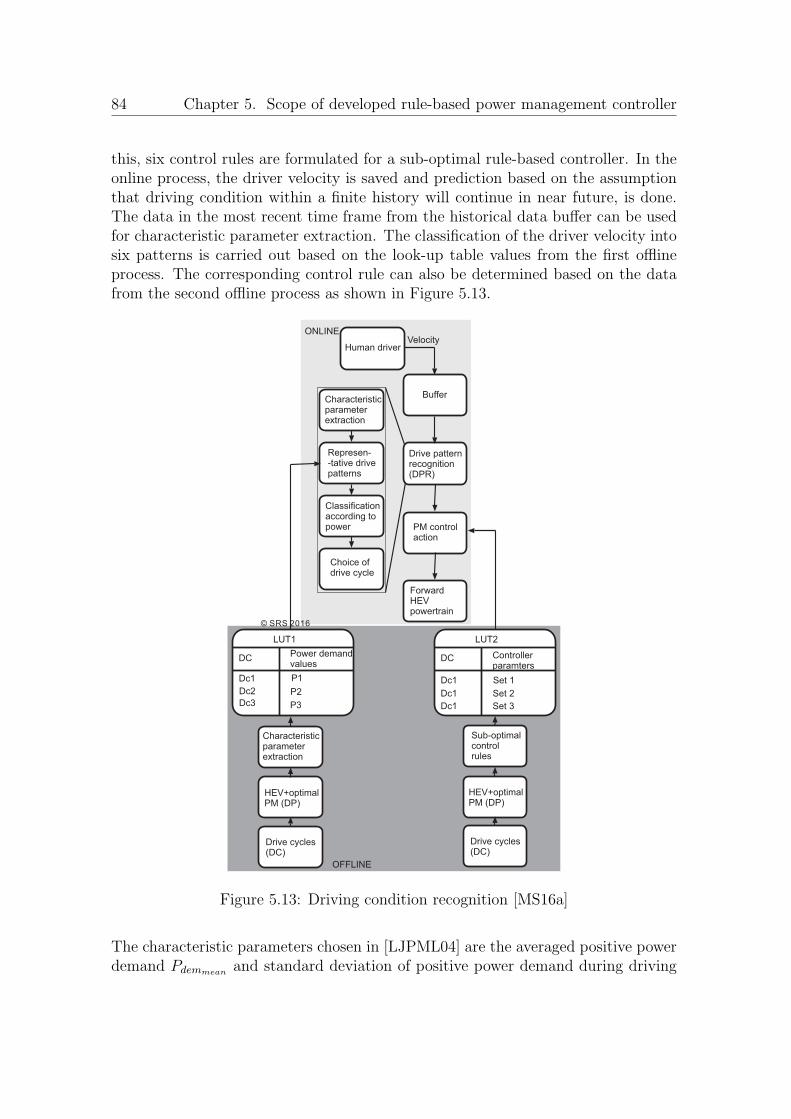
84 Chapter 5. Scope of developed rule-based power management controller
this, six control rules are formulated for a sub-optimal rule-based controller. In theonline process, the driver velocity is saved and prediction based on the assumptionthat driving condition within a finite history will continue in near future, is done.The data in the most recent time frame from the historical data buffer can be usedfor characteristic parameter extraction. The classification of the driver velocity intosix patterns is carried out based on the look-up table values from the first offlineprocess. The corresponding control rule can also be determined based on the datafrom the second offline process as shown in Figure 5.13.
.
Human driver
Drive patternrecognition(DPR)
Characteristicparameterextraction
OFFLINE
ONLINE
PM controlaction
© SRS 2016
Buffer
Velocity
Drive cycles(DC)
HEV+optimalPM (DP)
.
Sub-optimalcontrolrules
Drive cycles(DC)
HEV+optimalPM (DP)
Characteristicparameterextraction
Represen--tative drivepatterns
Classificationaccording topower
Choice ofdrive cycle
ForwardHEVpowertrain
DCPower demandvalues
Dc1 P1
LUT1
Dc2
Dc3
P2
P3
Controllerparamters
Set 1
Set 2
Set 3
DC
LUT2
Dc1
Dc1
Dc1
Figure 5.13: Driving condition recognition [MS16a]
The characteristic parameters chosen in [LJPML04] are the averaged positive powerdemand Pdemmean
and standard deviation of positive power demand during driving
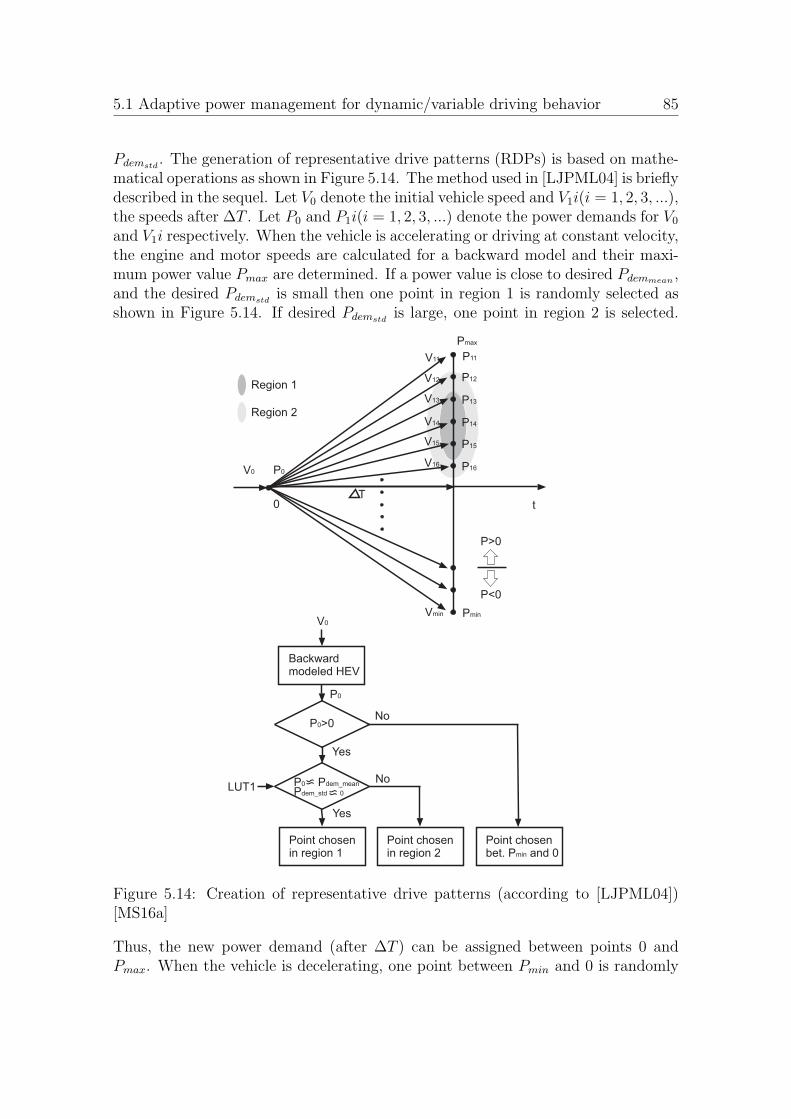
5.1 Adaptive power management for dynamic/variable driving behavior 85
Pdemstd. The generation of representative drive patterns (RDPs) is based on mathe-
matical operations as shown in Figure 5.14. The method used in [LJPML04] is brieflydescribed in the sequel. Let V0 denote the initial vehicle speed and V1i(i = 1, 2, 3, ...),the speeds after ∆T . Let P0 and P1i(i = 1, 2, 3, ...) denote the power demands for V0
and V1i respectively. When the vehicle is accelerating or driving at constant velocity,the engine and motor speeds are calculated for a backward model and their maxi-mum power value Pmax are determined. If a power value is close to desired Pdemmean
,and the desired Pdemstd
is small then one point in region 1 is randomly selected asshown in Figure 5.14. If desired Pdemstd
is large, one point in region 2 is selected.
V0 P0
P>0
P<0
V11
V12
V13
V14
V15
V16
Vmin
P11
P12
P13
P14
P15
Pmin
P16
T
Region 1
Region 2
P P0 dem_mean
Pdem_std 0
P >00
Point chosenin region 1
Backwardmodeled HEV
Point chosenin region 2
Point chosenbet. P and 0min
Pmax
V0
P0
LUT1
0 t
No
Yes
Yes
No
Figure 5.14: Creation of representative drive patterns (according to [LJPML04])[MS16a]
Thus, the new power demand (after ∆T ) can be assigned between points 0 andPmax. When the vehicle is decelerating, one point between Pmin and 0 is randomly
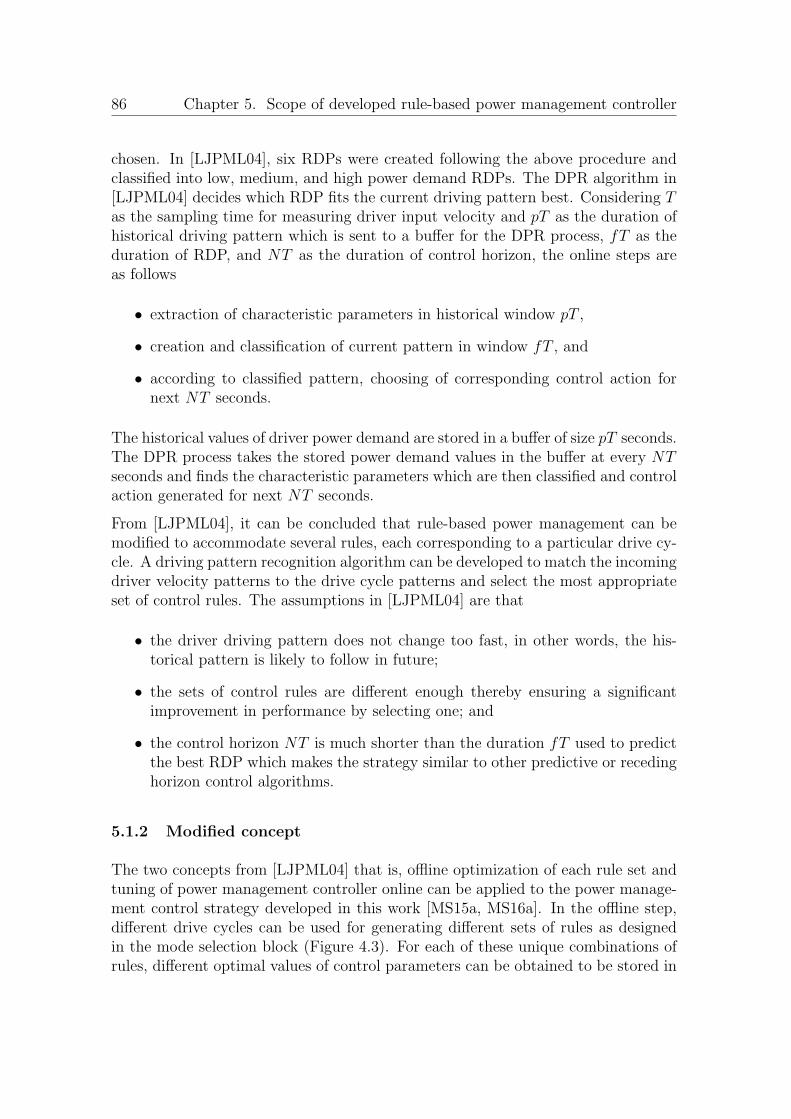
86 Chapter 5. Scope of developed rule-based power management controller
chosen. In [LJPML04], six RDPs were created following the above procedure andclassified into low, medium, and high power demand RDPs. The DPR algorithm in[LJPML04] decides which RDP fits the current driving pattern best. Considering T
as the sampling time for measuring driver input velocity and pT as the duration ofhistorical driving pattern which is sent to a buffer for the DPR process, fT as theduration of RDP, and NT as the duration of control horizon, the online steps areas follows
• extraction of characteristic parameters in historical window pT ,
• creation and classification of current pattern in window fT , and
• according to classified pattern, choosing of corresponding control action fornext NT seconds.
The historical values of driver power demand are stored in a buffer of size pT seconds.The DPR process takes the stored power demand values in the buffer at every NT
seconds and finds the characteristic parameters which are then classified and controlaction generated for next NT seconds.
From [LJPML04], it can be concluded that rule-based power management can bemodified to accommodate several rules, each corresponding to a particular drive cy-cle. A driving pattern recognition algorithm can be developed to match the incomingdriver velocity patterns to the drive cycle patterns and select the most appropriateset of control rules. The assumptions in [LJPML04] are that
• the driver driving pattern does not change too fast, in other words, the his-torical pattern is likely to follow in future;
• the sets of control rules are different enough thereby ensuring a significantimprovement in performance by selecting one; and
• the control horizon NT is much shorter than the duration fT used to predictthe best RDP which makes the strategy similar to other predictive or recedinghorizon control algorithms.
5.1.2 Modified concept
The two concepts from [LJPML04] that is, offline optimization of each rule set andtuning of power management controller online can be applied to the power manage-ment control strategy developed in this work [MS15a, MS16a]. In the offline step,different drive cycles can be used for generating different sets of rules as designedin the mode selection block (Figure 4.3). For each of these unique combinations ofrules, different optimal values of control parameters can be obtained to be stored in
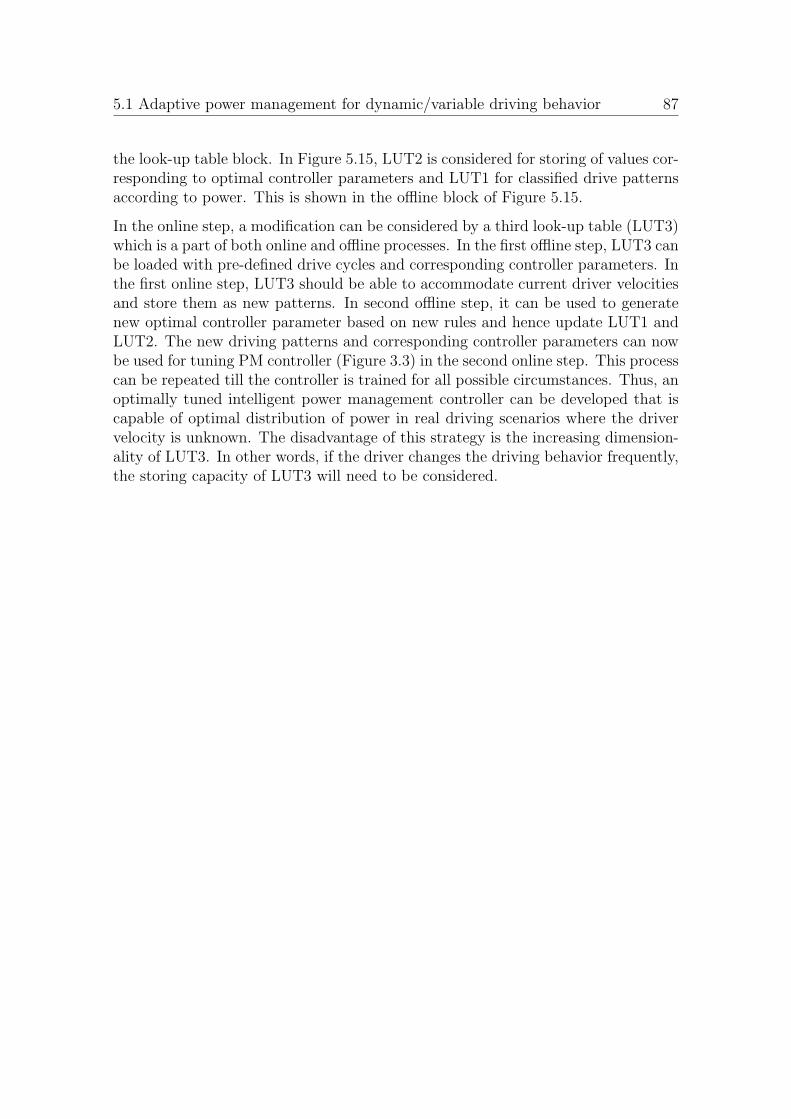
5.1 Adaptive power management for dynamic/variable driving behavior 87
the look-up table block. In Figure 5.15, LUT2 is considered for storing of values cor-responding to optimal controller parameters and LUT1 for classified drive patternsaccording to power. This is shown in the offline block of Figure 5.15.
In the online step, a modification can be considered by a third look-up table (LUT3)which is a part of both online and offline processes. In the first offline step, LUT3 canbe loaded with pre-defined drive cycles and corresponding controller parameters. Inthe first online step, LUT3 should be able to accommodate current driver velocitiesand store them as new patterns. In second offline step, it can be used to generatenew optimal controller parameter based on new rules and hence update LUT1 andLUT2. The new driving patterns and corresponding controller parameters can nowbe used for tuning PM controller (Figure 3.3) in the second online step. This processcan be repeated till the controller is trained for all possible circumstances. Thus, anoptimally tuned intelligent power management controller can be developed that iscapable of optimal distribution of power in real driving scenarios where the drivervelocity is unknown. The disadvantage of this strategy is the increasing dimension-ality of LUT3. In other words, if the driver changes the driving behavior frequently,the storing capacity of LUT3 will need to be considered.
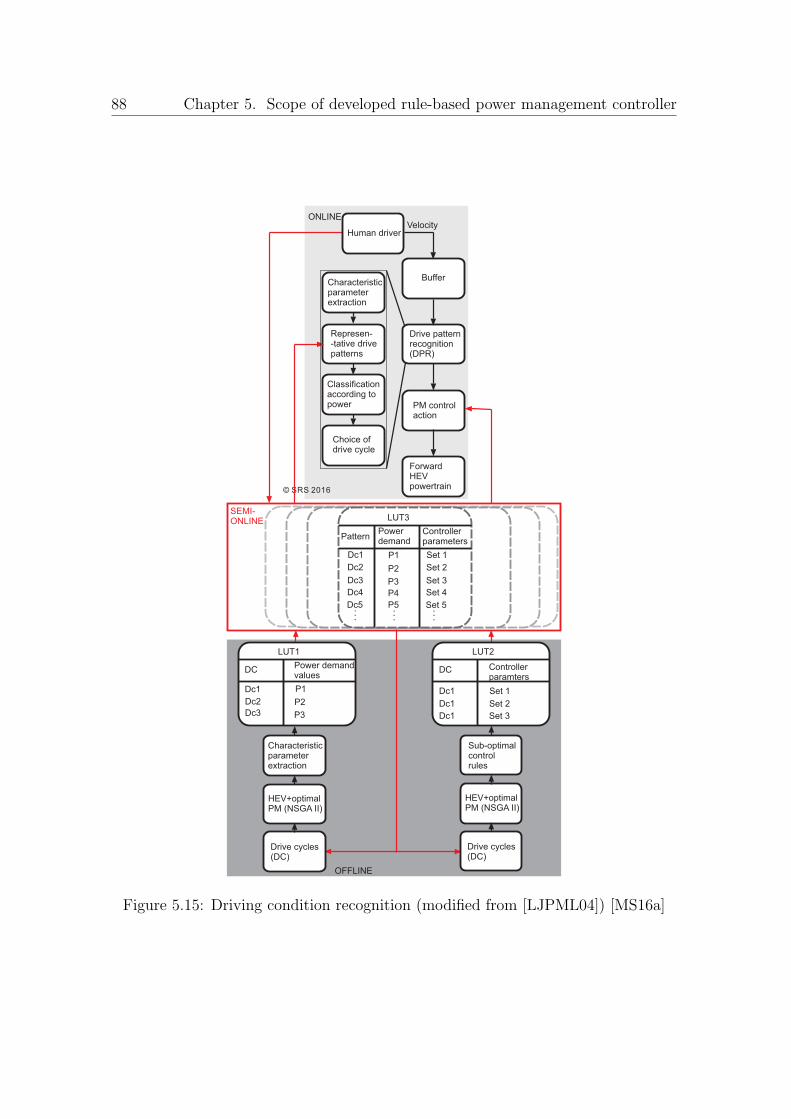
88 Chapter 5. Scope of developed rule-based power management controller
Powerdemand
P1
P2
P3
Controllerparameters
Set 1
Set 2
Set 3
LUT3
Pattern
Dc1
Dc2
Dc3
SEMI-ONLINE
Set 4
Set 5
Dc4
Dc5 .. . .. . .. .
P4
P5
.
Human driver
Drive patternrecognition(DPR)
Characteristicparameterextraction
OFFLINE
ONLINE
PM controlaction
© SRS 2016
Buffer
Velocity
Drive cycles(DC)
HEV+optimalPM (NSGA II)
.
Sub-optimalcontrolrules
Drive cycles(DC)
HEV+optimalPM (NSGA II)
Characteristicparameterextraction
Represen--tative drivepatterns
Classificationaccording topower
Choice ofdrive cycle
ForwardHEVpowertrain
DCPower demandvalues
Dc1 P1
LUT1
Dc2
Dc3
P2
P3
Controllerparamters
Set 1
Set 2
Set 3
DC
LUT2
Dc1
Dc1
Dc1
Figure 5.15: Driving condition recognition (modified from [LJPML04]) [MS16a]
89
6 Summary, Conclusion, and Outlook
This work focuses on the development of a suitable power management and optimiza-tion strategy for implementation in real driving scenarios. The existing strategieslack the ability to provide optimal solutions in terms of multiple objectives online.Along with online optimization, adaption of optimized control rules to real drivingdata is also an issue. Thus, the existing strategies and their deficits are evaluated,leading to the development of a rule-based power management concept which istuned online with offline-generated optimal parameters. The power managementstrategy is implemented on a three-source HEV powertrain and validated on anemulation test-rig. A possibility to adapt the developed concept to real (unknowndynamic) driving patterns is also given.
6.1 Conclusion
The literature review presented in this work, emphasizes the role of rule-based powermanagement and optimization strategies. To overcome the deficits of existing strate-gies, namely integration of multiple objectives along with adaptability to real drivingpatterns, an optimized power management controller for a three-source HEV is de-veloped and validated on an emulation test-rig.
The newly introduced power management concept is capable of determining theoptimal power distribution between the three sources online, such that, the dynamicpart of the load is supplied by the supercapacitor and battery current is limited.The rate limitation of battery and fuel current prevents over-charging/dischargingof these components, whereas, utilizing the higher charging/discharging efficiencyof the supecapacitor ensures that the peak load demands are also satisfied. Thedecoupling of optimization process from the online part enables the use of offline-implementable, multi-objective algorithms. From the simulation results, it can beconcluded that: multiple, even conflicting optimization objectives can be integratedin this control strategy; by changing the priority between the objectives, furtheroptions can be investigated; and by a suitable selection of parameters, all threesources can be operated within desired working ranges while satisfying the loaddemand at the same time. From the experimental results, the advantages of theconcept introduced can be demonstrated by observing the the system dynamicsfrom the hardware set-up.
Due to the modular structure of the power management optimization concept anextension of the concept can be easily realized by integrating more LUTs with sets ofoptimized parameters. Real (unknown dynamic) drive cycles can be used to generatethese parameters offline to be embedded online. Two adaption possibilities areconsidered based on literature: driving condition prediction and driving condition
90 Chapter 6. Summary, Conclusion, and Outlook
recognition. For driving condition prediction, an example application is given wherethe emulation hardware set-up is connected to a driving simulator operated by realhuman driver. Here, optimal predicted velocity is based on known or assumed drivecycles. The optimal controller is not integrated online, only the optimal values aredisplayed to the driver. For driving condition recognition, a concept is presented tointegrate the optimal controller online. Here, a possibility to accomodate currentdriving patterns along with the existing patterns is considered. Thus, from thediscussed example and concept it can be concluded that, the application of developedpower management optimization concept to cases where the driver velocity patternis unknown is possible.
6.2 Contributions
The main contributions of this work include
• Embedding of offline parameters in online rule-based controller: due to thedecoupling of online and offline parts of the modular power management op-timization concept, it is possible to carry out optimization with respect tomultiple, even conflicting objectives.
• Rate limitation of battery and fuel cell current: overcharging and over dis-charging of battery is minimized by utilizing the supercapacitor to supply dy-namic loads. This is done by a suitable choice of parameters that are preloadedfrom the offline optimization process.
• Validation using emulation test-rig: real powertrain components are replacedby controllable power sources and sinks that are capable of replicating power-train dynamics. This is done by considering storage components like batteriesand supercapacitors as source-sink combinations where, charging implies sup-ply to sink and discharging, supply from source. Motor/generator dynamicsare also emulated by source-sink combination.
• Adaption to real drive patterns: due to the modular structure of developedconcept, integration of optimized parameter-sets for real (unknown) drive cy-cles is possible. A new concept for updating the control rules with respect torecent drive patterns is proposed.
6.3 Outlook
Due to the novelty of the proposed concept, several aspects can be considered forfuture work. The adaptation of the controller can be tested with real driver veloci-ties (as collected from driving simulator test-rig) and the corresponding realization

6.3 Outlook 91
of power train dynamics noted (by using the HEV emulator test-rig). In this work,a display option is considered for the optimal parameters, however, by adding morelook-up tables an intelligent controller can be realized. The developed power man-agement concept can also be extended to cases where battery aging minimizationis an objective. In combination with an aging model, the integration of batterylifetime as an optimization goal can be considered.
92
Bibliography
[AG09] Ambuhl, D. ; Guzzella, L.: Predictive reference signal generator forhybrid electric vehicles. In: IEEE Transactions on Vehicular Technology58 (2009), pp. 4730–4740
[AK12] Aharon, I. ; Kuperman, A.: Topological overview of powertrains forbattery-powered vehicles with range extenders. In: IEEE Transactionson Power Electronics 26 (2012), pp. 868–876
[BDGB10] Bernard, J. ; Delprat, S. ; Guerra, T. M. ; Buchi, F. N.: Fuelefficient power management strategy for fuel cell hybrid powertrains.In: Control engineering practice 18 (2010), pp. 408–417
[BE04] Baisden, A.C. ; Emadi, A.: ADVISOR-based model of a battery andan ultra-capacitor energy source for hybrid electric vehicles. In: IEEETransactions on Vehicular Technology 53 (2004), pp. 199–205
[BGR00] Brahma, A. ; Guezennec, Y. ; Rizzoni, G.: Optimal energy man-agement in series hybrid electric vehicles. In: In Proceedings of theAmerican Control Conference (ACC), Chicago, IL (2000)
[BGT10] Bayindir, K. ; Gozukucuk, M.A. ; Teke, A: A comprehensiveoverview of hybrid electric vehicle: powertrain configurations, power-train control techniques and electronic control units. In: Energy Con-version and Management 52 (2010), pp. 1305–1313
[BLGP09] Bin, Y. ; Li, Y. ; Gong, Q. ; Peng, Z.: Multi-information integratedtrip specific optimal power management for plug-in hybrid electric ve-hicles. In: In Proceedings of the American Control Conference (ACC),St. Louis, MO (2009)
[BLM+10] Buerger, S. ; Lohmann, B. ; Merz, M. ; Vogel-Heuser, B. ;Hallmannsegger, M.: Multi-objective parameter optimization ofa series hybrid electric vehicle using evolutionary algorithms. In: InProceedings of the IEEE Vehicle Power and Propulsion Conference(VPPC), Lille, France (2010)
[BMFF07] Bashash, S. ; Moura, S.J. ; Forman, J.C. ; Fathy, H.K.: Powermanagement and design optimization of fuel cell/battery hybrid vehi-cles. In: Journal of Power Sources, Elsevier 165 (2007), pp. 819–832
[BMFF11] Bashash, S. ; Moura, S.J. ; Forman, J.C. ; Fathy, H.K.: Plug-inhybrid electric vehicle charge pattern optimization for energy cost andbattery longevity. In: Journal of power sources, Elsevier 196 (2011),pp. 541–549
BIBLIOGRAPHY 93
[BMS15] Beganovic, N. ; Moulik, B. ; Soffker, D.: Li-O battery agingprocess: A smart review with respect to the integration of aging intosystem’s power management. In: In Proceedings of the ASME DynamicSystems and Control (DSC) Conference, Columbus, Ohio (2015)
[Bru14] Brusa: Validierungsbericht DC/DC-Wandler BDC546-B06/BrusaElektronik AG.Forschungsbericht. (2014)
[Bru15] Brusa: Brusa Elektronik AG. In: http://www.brusa.eu/ (last visted:10.11.2015)
[CB11] Cassebaum, O. ; Biiker, B.: Predictive supervisory control strategyfor parallel HEVs using former velocity trajectories. In: In Proceed-ings of the IEEE Vehicle Power and Propulsion Conference (VPPC),Chicago, IL (2011)
[CE12] Cao, J. ; Emadi, A.: A new battery/ultracapacitor hybrid energystorage system for electric, hybrid, and plug-in hybrid electric vehicles.In: IEEE Transactions on Power Electronics 27 (2012), pp. 122–132
[CMM] Chen, Z. ; Masrur, M. ; Murphey, Y.L.: Intelligent vehicle powermanagement using machine learning and fuzzy logic. In: In Proceedingsof the IEEE International Conference on Fuzzy Systems, Hong Kong
[Con06] Conte, F.V.: Battery and battery management for hybrid electricvehicles: a review. In: e & i Elektrotechnik und Informationstechnik123 (2006), pp. 424–431
[CPP+03] Chou, P.H. ; Park, C. ; Park, J. ; Pham, K. ; Liu, J.: B#: abattery emulator and power profiling instrument. In: In Proceedingsof the international symposium on Low power electronics and design,Seoul (2003)
[CRM06] Chen, M. ; Rincon-Mora, G.A.: Accurate electrical battery modelcapable of predicting runtime and I-V performance. In: IEEE Trans-actions on Energy Conversion 21 (2006), pp. 504–511
[CV14] Capasso, C. ; Veneri, O.: Experimental analysis on the performanceof lithium based batteries for road full electric and hybrid vehicles. In:Applied Energy 136 (2014), pp. 921–930
[Dai15] Daimler: Technology and nnovation-Drive technologies-Fuel cell. In:http://www.daimler.com/ (last visited: 10.11.2015)
94 BIBLIOGRAPHY
[DCC+10] Debert, M. ; Colin, G. ; Chamaillard, Y. ; Guzzella, L. ; Ketfi-
Cherif, A. ; Bellicaud, B.: Predictive energy management for hy-brid electric vehicles-Prediction horizon and battery capacity sensitiv-ity. In: In Proceedings of the IFAC Symposium Advances in AutomotiveControl, Munich, Germany (2010)
[DPAM02] Deb, K. ; Pratap, A. ; Agarwal, S. ; Meyarivan, T.: A fast andelitist multiobjective genetic algorithm: NSGA-II. In: IEEE Transac-tions on Evolutionary Computation 6 (2002), pp. 182–197
[EBV14] Eddahech, A. ; Briaat, O. ; Vinassa, J.M.: Determination oflithium-ion battery state-of-health based on constant-voltage chargephase. In: Journal of power sources, Elsevier 258 (2014), pp. 218–227
[EHr00] Eker, J. ; Hagander, P. ; Arzen, K.E.: A feedback scheduler forreal-time controller tasks. In: Control Engineering Practice 12 (2000),pp. 1369–1378
[Ema05] Emadi, A.: Handbook of automotive power electronics and motordrives. CRC Press, 2005
[ERWL05] Emadi, A. ; Rajashekara, K. ; Williamson, S. S. ; Lukic, S. M.:Topological overview of hybrid electric and fuel cell vehicular powersystem architectures and configurations. In: IEEE Transactions onVehicular Technology 54 (2005), pp. 763–770
[FPCP09] Farcas, C. ; Petreus, D. ; Ciocan, I. ; Palaghita, N.: Modelingand simulation of supercapacitors. In: In Proceedings of 15th Interna-tional Symposium for Design and Technology of Electronics Packages,Gyula (2009)
[FPSAS08] Ferreira, A. ; Pomilio, J.A. ; Spiazzi, G. ; Araujo Silva, L.de: Energy management fuzzy logic supervisory for electric vehiclepower supplies system. In: IEEE Transactions on Power Electronics23 (2008), pp. 107–115
[FYR+14] Fotouhi, A. ; Yusof, R. ; Rahmani, R. ; Mekhilef, S. ; Shateri,N.: A review on the applications of driving data and traffic informationfor vehicles’ energy conservation. In: Renewable and Sustainable Energy37 (2014), pp. 822–833
[GBBM11] Gao, F. ; Blunier, B. ; Bouquain, D. ; Miraoui, A.: Model basedDC power source emulator for electrical and hybrid electrical vehiclesdrive train tests. In: In Proceedings of the IEEE Vehicle Power andPropulsion Conference (VPPC), Chicago (2011)
BIBLIOGRAPHY 95
[GBC+] Giulio, R. ; Bernardini, D. ; Cairano, S.D. ; Bemporad, A. ;Kolmanovsky, I.V.: A stochastic model predictive control approachfor series hybrid electric vehicle power management. In: In Proceedingsof the American Control Conference (ACC), Maryland, USA
[GBS+09] Gao, F. ; Blunier, B. ; Simoes, M. ; Miraoui, A. ; El-Moudni,A.: PEM fuel cell stack hardware-in-the-loop emulation using DC/DCconverter design. In: In Proceedings of Electrical Power and EnergyConference (EPEC), Montreal, Canada (2009)
[Glo15a] Global, Toyota: Innovation-Environmental Technology-Fuel cell. In:http://www.toyota-global.com/ (last visited: 10.11.2015)
[Glo15b] Global, Toyota: Innovation-Environmental Technology-Hybrid. In:http://www.toyota-global.com/ (last visited: 10.11.2015)
[Gmb15] GmbH, Hocher & H.: Battery emulation with NL Source-Sink,H&HCustomer Application 12. In: http://www.hoecherl-hackl.com (last vis-ited: 11.25.15)
[GS07] Guzzella, L. ; Sciarretta, A.: Vehicle propulsion systems: Intro-duction to modeling and optimization. Springer-Verlag Berlin Heidel-berg, 2007
[HEMF10] Hofmann, M. ; Eckardt, B. ; Marz, M. ; Frey, L.: Effizienzop-timierung integrierter elektrischer Antriebssysteme fuer Hybrid- undElektrofahrzeuge. In: In Proceedings of the EMA Elektromobilausstel-lung - Fachtagung - Wettbewerbe, Aschaffenburg, Germany (2010)
[HS06] Hajimiri, M.H. ; Salmasi, F.R.: A fuzzy energy management strategyfor series hybrid electric vehicle with predictive control and durabilityextension of the battery. In: In Proceedings of the IEEE Conference onElectric and Hybrid Vehicles (ICEHV), Pune, India (2006)
[HS07] Hofman, T. ; Steinbuch, M.: Rule-based energy management strate-gies for hybrid vehicles. In: International Journal of Electric and HybridVehicles 1 (2007), pp. 71–94
[HXGL12] He, H. ; Xiong, R. ; Guo, H. ; Li, S.: Comparison study on thebattery models used for the energy management of batteries in electricvehicles. In: Energy Conversion and Management 64 (2012), pp. 113–121
[IYD+04] Ichikawa, S. ; Yokoi, Y. ; Doki, S. ; Okuma, S. ; Naitou, T. ;Shiimado, T. ; Miki, N.: Novel energy management system for hybridelectric vehicles utilizing car navigation over a commuting route. In:Intelligent Vehicles Symposium,IEEE 124 (2004), pp. 161–166
96 BIBLIOGRAPHY
[JA08] Johansson, P. ; Andersson, B.: Comparison of simulation programsfor supercapacitor modelling. In: Master of Science Thesis. ChalmersUniversity of Technology, Sweden. (2008)
[JDW09] Jain, M. ; Desai, C. ; Williamson, S.S.: Genetic algorithm basedoptimal powertrain component sizing and control strategy design for afuel cell hybrid electric bus. In: In Proceedings of the IEEE VehiclePower and Propulsion Conference (VPPC), Dearborn, MI (2009)
[JJPL02] Jeon, S.I. ; Jo, S.T. ; Park, Y.I. ; Lee, J.M.: Multi-mode drivingcontrol of a parallel hybrid electric vehicle using driving pattern recog-nition. In: Journal of dynamic systems, measurement, and control 124(2002), pp. 141–149
[JKS97] Jalil, N. ; Kheir, N.A. ; Salman, M.: A rule-based energy man-agement strategy for a series hybrid vehicle. In: In Proceedings of theAmerican Control Conference (ACC), Albuquerque, NM (1997)
[KBK10] Khoucha, F. ; Benbouzid, M.E.H. ; Kheloui, A.: An optimal fuzzylogic power sharing strategy for parallel hybrid electric vehicles. In:In Proceedings of the IEEE Vehicle Power and Propulsion Conference(VPPC), Lille, France (2010)
[KDN+07] Knauff, M. C. ; Dafis, C. J. ; Niebur, D. ; Kwatny, H. G. ;Nwankpa, C. O.: Simulink model for hybrid power system test-bed.In: In Proceedings of IEEE Electric Ship Technologies Symposium, Ar-lington, VA (2007), Mai
[KEK+] Katsargyri ; Evangelia, G. ; Kolmanovsky, I.V. ; Michelini,J. ; Kuang, M.L. ; Phillips, A.M. ; Rinehart, M. ; Dahleh, M.A.:Optimally controlling hybrid electric vehicles using path forecasting. In:In Proceedings of the American Control Conference (ACC), Missouri,USA
[KII] Kuwana, J. ; Itoh, M. ; Inagaki, T.: Dynamic side-view mirror:Assisting situation awareness in blind spots. In: In Proceedings of theIEEE Intelligent Vehicles Symposium (IV)), Gold Coast, Australia
[KKDJ+05] Koot, M. ; Kessels, J.T. ; De Jager, B. ; Heemels, W.P.M.H. ;Bosch, P.P.J. Van d. ; Steinbuch, M.: Energy management strate-gies for vehicular electric power systems. In: IEEE Transactions onVehicular Technology 54 (2005), pp. 771–782
[KL10] Khaligh, A. ; Li, Z.: Battery, ultracapacitor, fuel cell, and hybridenergy storage systems for electric, hybrid electric, fuel cell, and plug-in hybrid electric vehicles: state of the art. In: IEEE Transactions onVehicular Technology 59 (2010), pp. 2806–2814
BIBLIOGRAPHY 97
[KMS09] Kim, T.S. ; Manzie, C. ; Sharma, R.: Model predictive control of ve-locity and torque split in a parallel hybrid vehicle. In: In Proceedings ofthe IEEE International Conference on Systems, Man, and Cybernetics,San Antonio, Texas (2009)
[KQ11] Kim, T. ; Qiao, A.: A hybrid battery model capable of capturingdynamic circuit characteristics and nonlinear capacity effects. In: IEEETransactions on Energy Conversion 26 (2011), pp. 1172–1180
[KR99] Kitoh, K. ; Remoto, H.: 100 Wh large size Li-ion batteries and safetytests. In: Journal of Power Sources 2 (1999), pp. 887890
[KS14] Karbaschian, M.A. ; Soffker, D.: Review and comparison of powermanagement approaches for hybrid vehicles with focus on hydraulicdrives. In: Energies 7 (2014), pp. 3512–3536
[KVNS00] Kolmanovsky, I. ; Van Nieuwstadt, M. ; Sun, J.: Optimizationof complex powertrain systems for fuel economy and emissions. In:Nonlinear Analysis: Real World Applications 1 (2000), pp. 205–221
[LCB+08] Lukic, S.M. ; Cao, J. ; Bansal, R.C. ; Rodriguez, F. ; Emadi,A.: Energy storage systems for automotive applications. In: IEEETransactions on Industrial electronics 55 (2008), pp. 2258–2267
[LCL+12] Li, Q. ; Chen, W. ; Li, Y. ; Liu, S. ; Huang, J.: Energy managementstrategy for fuel cell/battery/ultracapacitor hybrid vehicle based onfuzzy logic. In: Journal of Electrical Power and Energy Systems 43(2012), pp. 514–525
[LFL+04] Lin, C. ; Filipi, Z. ; Louca, L. ; Peng, H. ; Assanis, D. ; Stein,J.: Modeling and control of a medium-duty hybrid electric truck. In:International Journal of Vehicle Design 11 (2004), pp. 349–370
[LJPML04] Lin, C.C. ; Jeon, S. ; Peng, H. ; Moo Lee, J.: Driving patternrecognition for control of hybrid electric trucks. In: Vehicle SystemDynamics 42 (2004), pp. 41–58
[LMMS13] Liu, Y. ; Marx, M. ; Moulik, B. ; Soffker, D.: Experiment-based simulation and optimization of wind powertrain systems based onelectric power flow emulation. In: In Proceedings of the first Conferencefor Wind Power Drives, Aachen (2013)
[LSWZ11] Li, S.G. ; Sharkh, S.M. ; Walsh, F.C. ; Zhang, C.N.: Energy andbattery management of a plug-in series hybrid electric vehicle usingfuzzy logic. In: IEEE Transactions on Vehicular Technology 60 (2011),pp. 3571–3585
98 BIBLIOGRAPHY
[LWR+06] Lukic, S.M. ; Wirasingha, S.G. ; Rodriguez, F. ; Cao, J. ; Emadi,A.: Power management of an ultracapacitor/battery hybrid energystorage system in an HEV. In: In Proceedings of the IEEE VehiclePower and Propulsion Conference (VPPC), Windsor (2006)
[LZLC13] Liu, K. ; Zhu, C. ; Lu, R. ; Chan, C.C.: Improved study of tem-perature dependence equivalent circuit model for supercapacitors. In:IEEE Transactions on Plasma Science 41 (2013), pp. 1267–1271
[Mar] Marx, M.: Multiobjective obtimization of the power flow control ofhybrid electric power train systems within simulation and experimen-tal emulation applications. In: Chair of dynamics and control (SRS),University of Duisburg-Essen, Dissertation, 2014
[Mat16] MathWorks: Rate Limiter. In: http://www.mathworks.com, lastvisited: 01.26.16 (last visited: 01.26.16)
[MF08] Meintz, A. ; Ferdowsi, M.: Control strategy optimization for aparallel hybrid electric vehicle. In: In Proceedings of the IEEE VehiclePower and Propulsion Conference (VPPC), Harbin, China (2008)
[MKS13] Moulik, B. ; Karbaschian, M.A. ; Soffker, D.: Size and param-eter adjustment of a hybrid hydraulic powertrain using a global multi-objective optimization algorithm. In: In Proceedings of the IEEE Vehi-cle Power and Propulsion Conference (VPPC), Beijing, China (2013)
[MOS14] Marx, M. ; Ozbek, M. ; Soffker, D.: Power management of a hybridelectric powertrain system - design, power flow control and optimizationtargets. In: International Journal of Powertrains 3 (2014), pp. 221241
[MPP13] Mihael, C. ; Pavkovic, D. ; Petric, J.: A Control-oriented simula-tion model of a power-split hybrid electric vehicle. In: Applied Energy101 (2013), pp. 121–133
[MPV+09] Marsala, G. ; Pucci, M. ; Vitale, G. ; Cirrincione, M. ; Mi-
raoui, A.: A prototype of a fuel cell PEM emulator based on a buckconverter. In: Applied Energy 86 (2009), pp. 2192–2203
[MS12] Marx, M. ; Soffker, D.: Optimization of the powerflow controlof a hybrid electric powertrain including load profile prediction. In:In Proceedings of the IEEE Vehicle Power and Propulsion Conference(VPPC), Seoul, Korea (2012)
[MS14] Moulik, B. ; Soffker, D.: Combined voltage-current control ofDC/DC converters for power management of a multi-power source hy-brid with HIL tests. In: In Proceedings of the ASME Dynamic Systemsand Control Conference, San Antonio, Texas (2014)
BIBLIOGRAPHY 99
[MS15a] Moulik, B. ; Soffker, D.: Online Powermanagement with Embed-ded Optimization for a Multi-source Hybrid with Dynamic Power Shar-ing between Components. In: In Proceedings of the ASME DynamicSystems and Control (DSC) Conference, Ohio, USA (2015)
[MS15b] Moulik, B. ; Soffker, D.: Optimal rule-based powermanagementfor online, real-time applications with multiple sources and objectives:A review. In: Energies - Open Access Energy Research, Engineeringand Policy Journal 8 (2015), pp. 9049–9063
[MS16a] Moulik, B. ; Soffker, D.: Adapted power management for unknowndrive patterns: Development of a new concept from systematic analysisof existing approaches. In: IEEE Transactions on Vehicular Technology,submitted (2016)
[MS16b] Moulik, B. ; Soffker, D.: Online power management with embeddedoffline-optimized parameters for three-source hybrid powertrain withexperimental application. In: Energies - Open Access Energy Research,Engineering and Policy Journal, submitted (2016)
[MSS12] Marx, M. ; Shen, X. ; Soffker, D.: A data-driven online identifi-cation and control optimization approach applied to a hybrid electricpowertrain system. In: IFAC Mathematical Modelling 7 (2012), pp.153–158
[Mur08] Murphey, Y.L.: Intelligent vehicle power management: An overview.Springer-Verlag Berlin Heidelberg, 2008
[MWS15] Moulik, B. ; Wang, J. ; Soffker, D.: Optimized powermanagementfor human driver-HEV using online identification of velocity patterns.In: In Proceedings of the IEEE Vehicle Power and Propulsion Confer-ence (VPPC), Montreal, Canada (2015)
[NGK10] Na, W. ; Gou, B. ; Kim, T.: Analysis and control of a bidirectionalDC/DC converter for an ultracapacitor in a fuel cell generation system.In: Journal of Electrical Engineering: Theory and Application 1 (2010),pp. 72–78
[OAK97] Oei, D. ; Adams, J.A. ; Kinnelly, A.A.: Direct-hydrogen-fueledproton-exchange-membrane fuel cell system for transportation appli-cations. In: Ford Motor Co., Dearborn, MI, United States No.DOE/CE/50389–503 (1997)
[OIQ05] Ordonez, M. ; Iqbal, M. T. ; Quaicoe, J. E.: Development of a fuelcell simulator based on an experimentally derived model. In: In Pro-ceedings of the IEEE Canadian Conference on Electrical and ComputerEngineering, Saskatoon, Canada (2005), Mai
100 BIBLIOGRAPHY
[OWMS13] Ozbek, M. ; Wang, S. ; Marx, M. ; Soffker, D.: Modeling andcontrol of a PEM fuel cell system: a practical study based on experi-mental defined component behavior. In: Journal of Process Control 23(2013), pp. 282–293
[PABP05] Parker-Allotey, N.A. ; Bryant, A.T. ; Palmer, P.R.: The appli-cation of fuel cell emulation in the design of an electric vehicle power-train. In: In Proceedings of the Power Electronics Specialists Confer-ence, Recife (2005)
[PBMG06] Perez, L.V. ; Bossio, G.R. ; Moitre, D. ; Garcia, G.O.: Op-timization of power management in an hybrid electric vehicle usingdynamic programming. In: Mathematics and Computers in Simulation73 (2006), pp. 244–254
[PCM10] Park, J. ; Chen, Z. ; Murphey, Y.L.: Intelligent vehicle power man-agement through neural learning. In: In Proceedings of the Interna-tional Joint Conference on Neural Networks, Barcelona, Spain (2010)
[PDG+02] Paganelli, G. ; Delprat, S. ; Guerra, T.M. ; Rimaux, J. ; Santin,J.J.: Equivalent consumption minimization strategy for parallel hybridpowertrains. In: In Proceedings of the 55th IEEE Vehicular TechnologyConference (VTS), Birmingham, USA (2002), Mai
[PDRL07] Paladini, V. ; Donateo, T. ; Risi, A. ; Laforgia, D.: Super-capacitors fuel-cell hybrid electric vehicle optimization and controlstrategy development. In: Energy Conversion and Management 48(2007), pp. 3001–3008
[PIGV01] Piccolo, A. ; Ippolito, L. ; Gal, V.Z. ; Vaccaro, A.: Optimisationof energy flow management in hybrid electric vehicles via genetic algo-rithms. In: In Proceedings of the IEEE International Conference onAdvanced Intelligent Mechatronics (IEEUASME), Como, Italy (2001)
[PL00] Park, Y.I. ; Lee, J.: Multi-mode driving control of a parallel hy-brid electric vehicle using driving pattern recognition. In: Journal ofDynamic Systems, Measurement, and Control 124 (2000), pp. 141–149
[PRS05] Pagerit, S. ; Rousseau, A. ; Sharer, P.: Global optimization toreal time control of HEV power flow: Example of a fuel cell hybridvehicle. In: In Proceedings of the 20th International Electric VehicleSymposium (EVS20), Long Beach, USA (2005)
[Rau15] Rauhut, T.: Power-Management und Optimierung eines Multi-Quelle-Hybrid-Antriebes fur Echtzeitanwendungen. In: Master Thesis (June2015)
BIBLIOGRAPHY 101
[RBBP11] Riffonneau, Y. ; Bacha, S. ; Barruel, F. ; Ploix, S.: Optimalpower flow management for grid connected PV systems with batteries.In: IEEE Transactions on Sustainable Energy 2 (2011), pp. 309–320
[RC08] Rao, S.Y. ; Chandorkar, M.: Electrical load emulation using powerelectronic converters. In: In Proceedings of the TENCON 2008-2008IEEE Region 10 Conference, Hyderabad (2008)
[REC12] Rahimi-Eichi, H. ; Chow, M. Y.: Adaptive parameter identificationand state-of-charge estimation of lithium-ion batteries. In: In Pro-ceedings of IECON 2012-38th Annual Conference on IEEE IndustrialElectronics Society, Montreal, Canada (2012)
[RGRG03] Rajagopalan, A. ; Gregory, W. ; Rizzoni, G. ; Guezennec, Y.:Development of fuzzy logic and neural network control and advancedemissions modeling for parallel hybrid vehicles. In: National RenewableEnergy Laboratory: Cole-Boulevard (2003)
[Sal07] Salmasi, F.R.: Control strategies for hybrid electric vehicles: evolu-tion, classification, comparison, and future trends. In: IEEE Transac-tions on Vehicular Technology 56 (2007), pp. 2393–2404
[SHMS15] Sun, C. ; Hu, X. ; Moura, S.J. ; Sun, F.: Velocity predictors forpredictive energy management in hybrid electric vehicles. In: IEEETransactions on Control Systems Technology 23 (2015), pp. 1197–1204
[SOS+11] Serrao, L. ; Onori, S. ; Sciarretta, A. ; Guezennec, Y. ; Riz-
zoni, G.: Optimal energy management of hybrid electric vehicles in-cluding battery aging. In: In Proceedings of the American ControlConference (ACC), San Francisco, CA (2011)
[SRA11] Sorrentino, M. ; Rizzo, G. ; Arsie, I.: Analysis of a rule-based con-trol strategy for on-board energy management of series hybrid vehicles.In: Control Engineering Practice 19 (2011), pp. 1433–1441
[SSD+14] Sciarretta, A. ; Serrao, L. ; Dewangan, P.C. ; Tona, P. ;Bergshoeff, E.N.D. ; Bordons, C. ; Charmpa, L. ; Elbert, Ph.; Eriksson, L. ; Hofman, T. ; Hubacher, M. ; Isenegger, P. ;Lacandia, F. ; Laveau, A. ; Li, H. ; Marcos, D. ; Nuesch, T. ;Onori, S. ; Pisu, P. ; Rios, J. ; Silvas, E. ; Sivertsson, M. ; Tribi-
oli, L. ; Hoeven, A.-J. van d. ; Wu, M.: A control benchmark onthe energy management of a plug-in hybrid electric vehicle. In: ControlEngineering Practice 29 (2014), pp. 287–298
[SWS+13] Soffker, D. ; Wang, J. ; Schiffer, S. ; Marx, M. ; Fu, X.: Knowyour options - Interfacing consequences and forecasted performance
102 BIBLIOGRAPHY
analysis: A concept for the novel type of information system KYO-ICPA. In: In Proceedings of the IFAC/IFIP/IFORS/IEA Symposiumon Analysis, Design, and Evaluation of Human-Machine Systems, LasVegas, USA (2013)
[SYD+04] Shinji, I. ; Yokoi, Y. ; Doki, S. ; Okuma, S. ; Naitou, T. ; Miki, N.:Novel energy management system for hybrid electric vehicles utilizingcar navigation over a commuting route. In: IEEE Intelligent VehiclesSymposium 3 (2004), pp. 161–166
[TDH+04] Thacker, B.H. ; Doebling, S.W. ; Hemez, F.M. ; Anderson, M.C.; Pepin, J.E. ; Rodriguez, E.A.: Concepts of model verification andvalidation. In: Los Alamos National Lab, Los Alamos, NM, UnitedStates No. LA-14167 (2004)
[TGGL14] Torres, J.L. ; Gonzalez, R. ; Gimenez, A. ; Lopez, J.: Energymanagement strategy for plug-in hybrid electric vehicles, a comparativestudy. In: Applied Energy 114 (2014), pp. 816–824
[UA07] Uzunoglu, M. ; Alam, M. S.: Dynamic modeling, design and sim-ulation of a PEM fuel cell/ultra-capacitor hybrid system for vehicularapplications. In: Energy Conversion and Management 48 (2007), pp.1544–1553
[VCP16] Veneri, O. ; Capasso, C. ; Patalano, S.: Experimental study on theperformance of a ZEBRA battery based propulsion system for urbancommercial vehicles. In: Applied Energy No. ISSN 0306-2619 (2016)
[VIPn+09] Valera, J.J. ; Iglesias, I. ; Pena, A. ; Martin, A. ; Sanchez, J.:Integrated modeling approach for highly electrified HEV. Virtual designand simulation methodology for advanced powertrain prototyping. In:In Proceedings of International Battery, Hybrid and Fuel Cell ElectricVehicle Symposium (EVS 24), Stavanger, Norway (2009), Mai
[Wik15] Wikipedia: Wikipedia the free encyclopedia. In:https://en.wikipedia.org/wiki/ (last visited: 10.11.2015)
[WL11] Wang, R. ; Lukic, S.M.: Review of driving conditions prediction anddriving style recognition based control algorithms for hybrid electricvehicles. In: In Proceedings of the IEEE Vehicle Power and PropulsionConference (VPPC), Chicago, IL (2011)
[WMS15] Wang, J. ; Moulik, B. ; Soffker, D.: Towards interactive driver as-sistance system to realize a safe and an efficient driving. In: In Proceed-ings of the IEEE Vehicle Power and Propulsion Conference (VPPC),Montreal, Canada (2015)
BIBLIOGRAPHY 103
[WY06a] Wang, A. ; Yang, W.: Design of energy management strategy in hy-brid vehicles by evolutionary fuzzy system part i: fuzzy logic controllerdevelopment. In: The Sixth World Congress on Intelligent Control andAutomation (WCICA) 2 (2006), pp. 8324–8328
[WY06b] Wang, A. ; Yang, W.: Design of energy management strategy inhybrid vehicles by evolutionary fuzzy system part ii: tuning fuzzy con-troller by genetic algorithms. In: The Sixth World Congress on Intelli-gent Control and Automation (WCICA) 2 (2006), pp. 8329–8333
[ZCMM09] Zhang, B. ; Chen, Z. ; Mi, C. ; Murphey, Y.L.: Multi-objectiveparameter optimization of a series hybrid electric vehicle using evolu-tionary algorithms. In: In Proceedings of the IEEE Vehicle Power andPropulsion Conference (VPPC), Dearborn, MI (2009)
104 BIBLIOGRAPHY
The thesis is based on the results and development steps presented in the followingprevious publications:
[MS16a] Moulik, B.; Soffker, D.: Online power management with embeddedoffline-optimized parameters for three-source hybrid powertrain with ex-perimental application. In: Energies - Open Access Energy Research,Engineering and Policy Journal, (2016), submitted
[MS16b] Moulik, B.; Soffker, D.: Adapted power management for unknown drivepatterns: Development of a new concept from systematic analysis ofexisting approaches. In: IEEE Transactions on Vehicular Technology,(2016), submitted
[MS15a] Moulik, B.; Soffker, D.: Online Powermanagement with Embedded Op-timization for a Multi-source Hybrid with Dynamic Power Sharing be-tween Components. In: Proceedings of the ASME Dynamic Systems andControl (DSC) Conference, Ohio, USA, (2015), pp. V003T41A001
[MS15b] Moulik, B.; Soffker, D.: Optimal rule-based powermanagement for online,real-time applications with multiple sources and objectives: A review.In: Energies - Open Access Energy Research, Engineering and PolicyJournal, 8 (2015), pp. 9049-9063
[MWS15] Moulik, B.; Wang, J.; Soffker, D.: Optimized powermanagement for hu-man driver-HEV using online identification of velocity patterns. In: Pro-ceedings of the IEEE Vehicle Power and Propulsion Conference (VPPC),Montreal, Canada, (2015), pp. 1-5
[WMS15] Wang, J.; Moulik, B.; Soffker, D.: Towards interactive driver assistancesystem to realize a safe and an efficient driving. In: Proceedings ofthe IEEE Vehicle Power and Propulsion Conference (VPPC), Montreal,Canada, (2015), pp. 1-6
BIBLIOGRAPHY 105
The thesis is based on the results and development steps presented in the followingprevious publications:
[BMS15] Beganovic, N.; Moulik, B.; Soffker, D.: Li-O battery aging process: Asmart review with respect to the integration of aging into system’s powermanagement. In: Proceedings of the ASME Dynamic Systems and Con-trol (DSC) Conference, Ohio, USA, (2015), pp. V001T13A004
[MS14] Moulik, B.; Soffker, D.: Combined voltage-current control of DC/DCconverters for power management of a multi-power source hybrid withHIL tests. In: Proceedings of the ASME Dynamic Systems and Control(DSC) Conference,San Antonio, Texas, (2014), pp. V002T36A003
[MKS13] Moulik, B.; Karbaschian M.A.; Soffker, D.: Size and Parameter Adjust-ment of a Hybrid Hydraulic Powertrain Using a Global Multi-ObjectiveOptimization Algorithm. In: IEEE Vehicle Power and Propulsion Con-ference (VPPC), Beijing, China, (2013), pp. 1-6
[MS15b] Karbaschian, M.A.; Marx, M.; Moulik, B.; Soffker, D.: MultiobjectiveNSGA II-based Control Optimization of Hydraulic and Electric HybridPropulsion Systems with Respect to their Dynamic Behavior in Time Do-main. In: Proceedings of 14nd Antriebstechnisches Kolloquium (ATK),Aachen, Germany, (2013), pp. 641-657
[MS15b] Liu, Y.; Marx, M.; Moulik, B.; Soffker, D.: Experiment-based simulationand optimization of wind powertrain systems based on electric powerflow emulation. In: Proceedings of the first Conference for Wind PowerDrives, Aachen, (2013)

106 BIBLIOGRAPHY
In the context of the research projects at the Chair of Dynamics and Control, thefollowing student theses have been supervised by Bedatri Moulik and Univ.-Prof.Dr.-Ing. Dirk Soffker. Development steps and results of the research projects andthe student theses are related to each other and hence are also part of this thesis.
[Rau15] Rauhut, T., Power-Management und Optimierung eines Multi- Quelle-Hybrid-Antriebes fur Echtzeitanwendungen, Master Thesis, June 2015