Embed Size (px)
DESCRIPTION
- PowerPoint PPT Presentation
Citation preview
POTENTIAL APPLICATIONS OF DYSAMS IN INDONESIA:
REGIONAL PERSPECTIVE
Prepared by:Sumedi Andono Mulyo, Ph.D
Head of Division on Regional Social Economic Analysis
Ministry of National Development Planning/ National Development Planning Agency (Bappenas)
Seminar on Lesson and Tools for Economic Recovery and
Employment Creation from Indonesia
Coordinating Ministry for Economy and ILO
Jakarta, 30 November 2010
CURRENT ISSUES
2
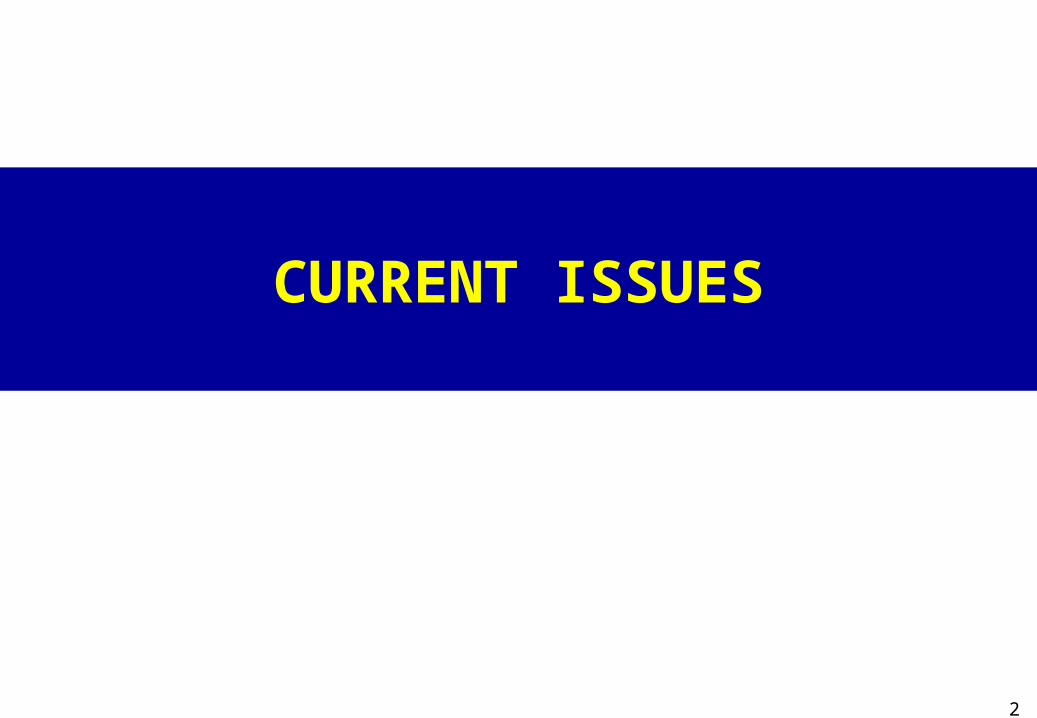
• Quadrant I: pro-growth & pro-poor– Maintaining economic performance
(Sumut, Jambi, Kalteng, Sulsel, Sulbar)
• Quadrant II: low growth, but pro-poor– Increasing productivity and value
added (Aceh, Riau, Sumsel, Bengkulu, Babel, Jateng, Jatim, Bali, NTT, Kalbar, Kalsel, Kaltim)
• Quadrant III: low growth & less pro-poor– Increasing productivity and value
added mainly labor intensive activities to involve poor people (Lampung, DIY, NTB, Maluku, Maluku Utara)
• Quadrant IV: pro-growth, but less pro-poor– Promoting small-scale and medium
enterprises, and labor intensive industries (Sumbar, Kepri, Banten, DKI, Jabar, Sulut, Gorontalo, Sulteng, Sultra, Papua Barat, Papua)
ECONOMIC GROWTH VS POVERTY REDUCTION
Note: Y Axis= Poverty reduction on average 2005-2009 X Axis= Growth of GRDP on average 2005-2009
Sources: Calculated from BPS 3

• Quadrant I: pro-growth & pro-job– Maintaining economic performance
(Papua, Kepri, Sulbar, Sultra, Sulsel, Gorontalo, Papua Barat, Sumbar, dan Sumut)
• Quadrant II: low growth, but pro-job– Increasing productivity and value added
(Riau, Jatim, Kalbar, Bali, Jabar)
• Quadrant III: low growth, less pro-job– Accelerating local economic
development to improve productivity and create more jobs (Lampung, Babel, Bengkulu, Kaltim, Aceh, Sumsel, Jateng, Kalsel, DIY, Maluku, Sultra, NTT dan NTB)
• Quadrant IV: pro-growth, but less pro-job– Improving the quality of growth by
creating more jobs (DKI Jakarta, Sulut, Sulteng, Banten, Malut, Jambi)
ECONOMIC GROWTH VS UNEMPLOYMENT REDUCTION
4
Note: Y Axis= Unemployment reduction on average 2005-2009 X Axis= Growth of GRDP on average 2005-2009
Sources: Calculated from BPS

REGIONDEKON + TP FUND BALANCED
(PERIMBANGAN) FUND
FOREIGN DIRECT INVESTMENT
AVERAGE 2005-2009
(Rp.Million)
SHARE
(%)
AVERAGE 2005-2009
(Rp.Million)
SHARE
(%)
AVERAGE 2005-2008(US$
Million)
SHARE
(%)
SUMATERA 37.213 15,65 62.138 27,65 1.133 11,29 JAWA-BALI 157.630 66,31 78.519 34,94 8.516 84,91 KALIMANTAN 11.721 4,93 30.487 13,57 283 2,82 SULAWESI 15.950 6,71 23.811 10,60 76 0,76 NUSA TENGGARA 5.995 2,52 9.965 4,43 8 0,08 MALUKU 4.278 1,80 5.889 2,62 7 0,07 PAPUA 4.942 2,08 13.890 6,18 5 0,05 TOTAL 237.729 100,00 224.698 100,00 10.030 100,00
INTERREGIONAL RESOURCES ALLOCATION
Source: Calculated from Ministry of Finance, Bank Indonesia, BPS and BKPM
REGIONDOMESTIC
INVESTMENTBANKING CREDIT BANKING CREDIT
FOR SMALE-SCALE AND MEDIUM
BUSINESS
AVERAGE 2005-2008(Rp.
Billion)
SHARE(%)
AVERAGE 2007-2009(Rp.
Billion)
SHARE(%)
AVERAGE 2007-2009(Rp.
Billion)
SHARE(%)
SUMATERA 8.400 31,52 193.749 15,44 117.393 18,79 JAWA-BALI 14.729 55,26 913.352 72,78 408.768 65,43 KALIMANTAN 1.916 7,19 67.483 5,38 33.704 5,40 SULAWESI 1.402 5,26 56.483 4,50 43.281 6,93 NUSA TENGGARA 21 0,08 12.436 0,99 11.971 1,92 MALUKU 0,3 0,00 4.006 0,32 3.523 0,56 PAPUA 185 0,70 7.442 0,59 6.068 0,97 TOTAL 26.654 100 1.254.951 100 624.708 100,00
Distribution of Balanced Fund (%):1. Jawa-Bali and Sumatera: 62,592. Kalimantan: 13,573. Sulawesi: 10,604. Maluku and Nusa Tenggara: 9,305. Papua: 6,18
Distribution of Balanced Fund (%):1. Jawa-Bali and Sumatera: 62,592. Kalimantan: 13,573. Sulawesi: 10,604. Maluku and Nusa Tenggara: 9,305. Papua: 6,18
Distribution of Banking Credit (%):1. Jawa-Bali and Sumatera: 88,222. Kalimantan: 5,183. Sulawesi: 4,504. Maluku and Nusa Tenggara: 1,215. Papua: 0,59
Distribution of Banking Credit (%):1. Jawa-Bali and Sumatera: 88,222. Kalimantan: 5,183. Sulawesi: 4,504. Maluku and Nusa Tenggara: 1,215. Papua: 0,59
Distribution of Dekon+TP Fund (%):1. Jawa-Bali and Sumatera: 81,692. Kalimantan: 4,933. Sulawesi: 6,714. Maluku and Nusa Tenggara: 4,325. Papua: 2,08
Distribution of Dekon+TP Fund (%):1. Jawa-Bali and Sumatera: 81,692. Kalimantan: 4,933. Sulawesi: 6,714. Maluku and Nusa Tenggara: 4,325. Papua: 2,08
Distribution of FDI (%):1. Jawa-Bali and Sumatera: 86,782. Kalimantan: 7,193. Sulawesi: 5,264. Maluku and Nusa Tenggara: 0,085. Papua: 0,70
Distribution of FDI (%):1. Jawa-Bali and Sumatera: 86,782. Kalimantan: 7,193. Sulawesi: 5,264. Maluku and Nusa Tenggara: 0,085. Papua: 0,70
5
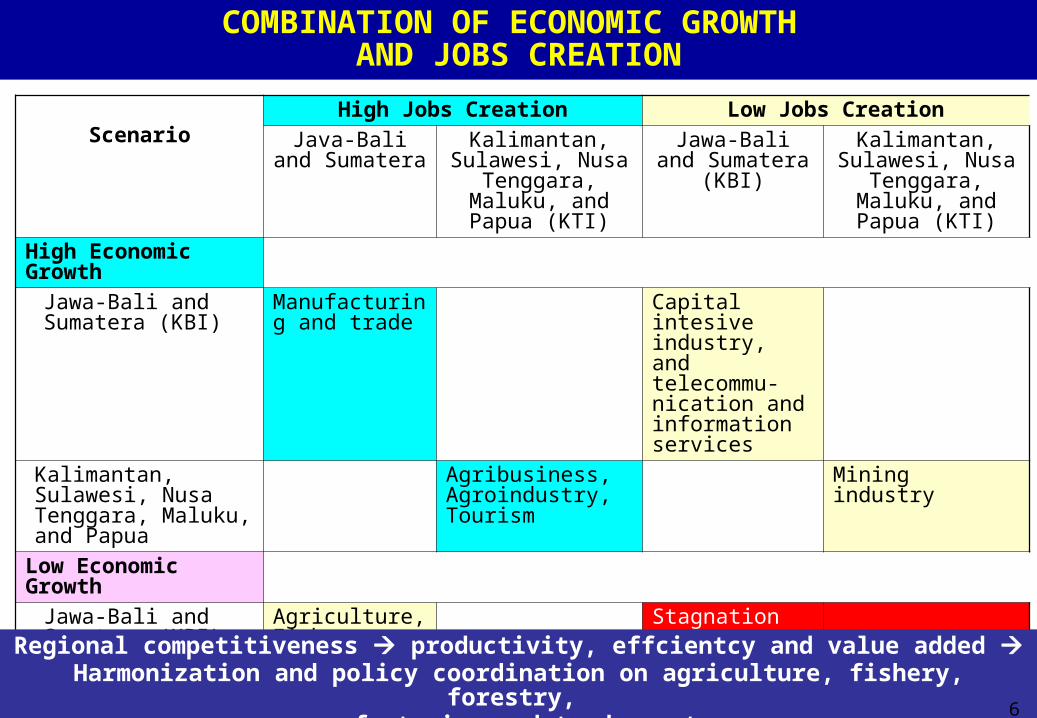
COMBINATION OF ECONOMIC GROWTH AND JOBS CREATION
ScenarioHigh Jobs Creation Low Jobs Creation
Java-Bali and Sumatera
Kalimantan, Sulawesi, Nusa
Tenggara, Maluku, and Papua (KTI)
Jawa-Bali and Sumatera
(KBI)
Kalimantan, Sulawesi, Nusa
Tenggara, Maluku, and Papua (KTI)
High Economic Growth
Jawa-Bali and Sumatera (KBI)
Manufacturing and trade
Capital intesive industry, and telecommu-nication and information services
Kalimantan, Sulawesi, Nusa Tenggara, Maluku, and Papua
Agribusiness,Agroindustry, Tourism
Mining industry
Low Economic Growth
Jawa-Bali and Sumatera (KBI)
Agriculture, Fishery, Tourism
Stagnation
Kalimantan, Sulawesi, Nusa Tenggara, Maluku, and Papua
Fishery, Agriculture
StagnationRegional competitiveness productivity, effcientcy and value added Harmonization and policy coordination on agriculture, fishery, forestry,
manufacturing and trade sectors
Regional competitiveness productivity, effcientcy and value added Harmonization and policy coordination on agriculture, fishery, forestry,
manufacturing and trade sectors 6

WHAT WE ARE DOING
7

REGIONAL DEVELOPMENT PERSPECTIVE
Interregional Coordination and
Cooperation
Monitoring and Evaluation
Data Base and Information System
Best Practices
Information
Regional Development Strategy and
Scenario
Monitoring RPJMN
2010-2014
Targeting and Monitoring for
Annual Plan(RKP)
Investments: Government, Private and Banking
Policies, Programs and Activities with Performance Indicators
Disaggregate Analysis of the
Impacts of National Policy on
Regions
Interregional Linkage Model
8
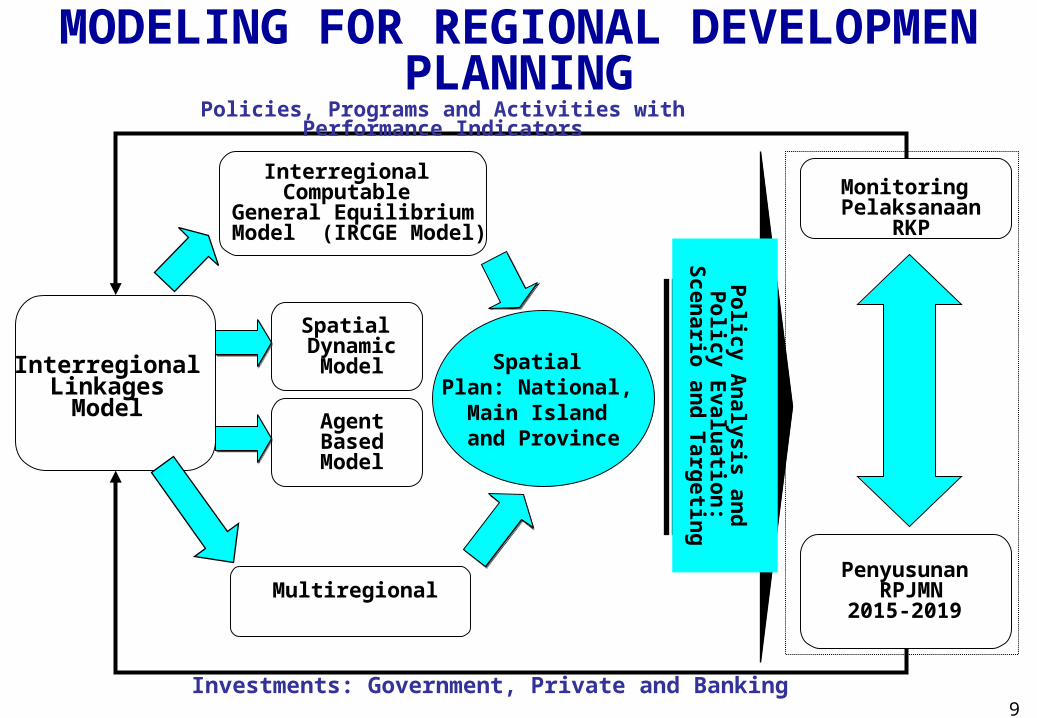
Interregional Computable
General Equilibrium Model (IRCGE Model)
MultiregionalEconometric Model
Penyusunan RPJMN
2015-2019
Penyusunan dan Monitoring Pelaksanaan
RKP
Interregional Linkages
Model
Polic
y A
naly
sis
an
d P
olic
y
Evalu
atio
n: S
cen
ario
an
d
Targ
etin
gSpatial
Plan: National, Main Island and Province
Policies, Programs and Activities with Performance Indicators
Investments: Government, Private and Banking
MODELING FOR REGIONAL DEVELOPMEN PLANNING
9
AgentBasedModel
Spatial Dynamic
Model
10
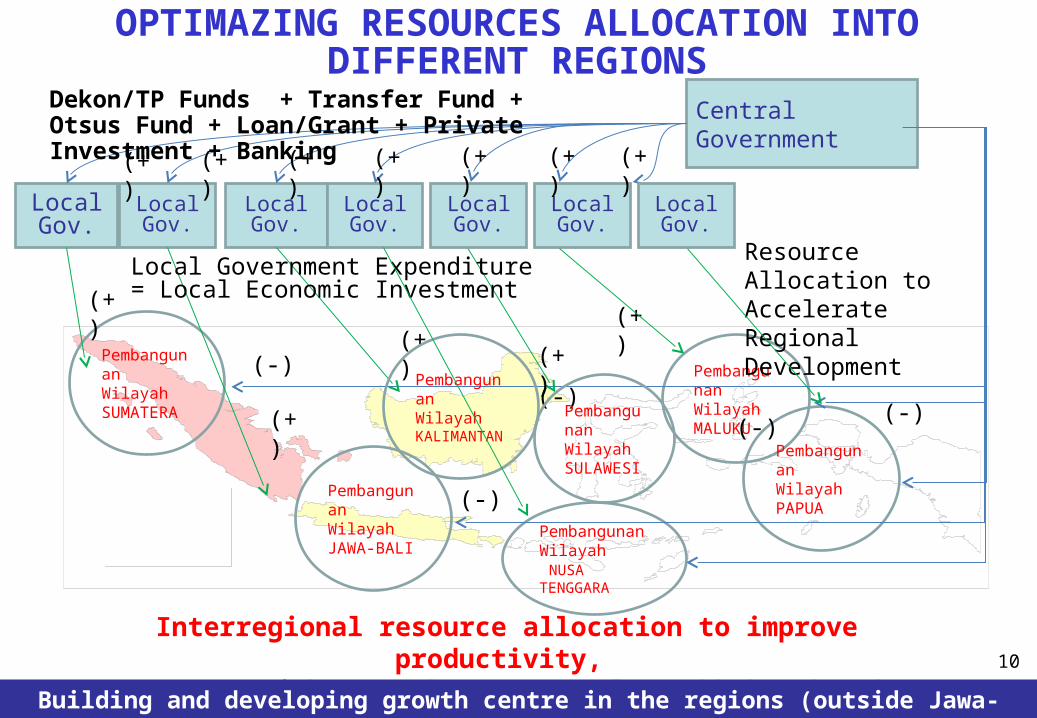
OPTIMAZING RESOURCES ALLOCATION INTO DIFFERENT REGIONS
54797.00 (minimum)
245594.00
398937.00 (median)
639154.00
1339115.00 (maximum)
Pembangunan Wilayah SUMATERA
Pembangunan Wilayah JAWA-BALI
Pembangunan Wilayah NUSA TENGGARA
Pembangunan WilayahMALUKU
Pembangunan WilayahPAPUA
Central Government
Local Gov.
Local Gov.
Local Gov.
Local Gov.
Local Gov.
(+)
Dekon/TP Funds + Transfer Fund + Otsus Fund + Loan/Grant + Private Investment + Banking
(-)
(+) (+) (+) (+)
(-)
(-)
(-)(-)
Resource Allocation to Accelerate Regional Development (+)
(+)
(+)(+)
(+)
Local Government Expenditure = Local Economic Investment
Interregional resource allocation to improve productivity, create more jobs, produce more value added and reduce poverty
10
Pembangunan Wilayah KALIMANTAN
Pembangunan WilayahSULAWESI
Local Gov.
Local Gov.
(+)(+)
Building and developing growth centre in the regions (outside Jawa-Bali)Building and developing growth centre in the regions (outside Jawa-Bali)

REGIONSDEKON + TP FUND BALANCE FUND FOREIGN DIRECT
INVESTMENTDOMESTIC
INVESTMENTBANKING CREDIT BANKING CREADIT FOR
SMALL-SCALE AND MEDIUM INDUSTRIES
AVERAGE 2005-2009
(Rp. Million)
SHARE(%)
AVERAGE 2005-2009
(Rp. Million)
SHARE(%)
AVERAGE 2005-2008
(US Million)
SHARE(%)
AVERAGE 2005-2008(Rp. Billion)
SHARE(%)
AVERAGE 2007-2009(Rp. Billion)
SHARE(%)
AVERAGE 2007-2009(Rp. Billion)
SHARE(%)
SUMATERA 37.213 15,65 62.138 27,65 1.133 11,29 8.400 31,52 193.749 15,44 117.393 18,79
JAWA-BALI 157.630 66,31 78.519 34,94 8.516 84,91 14.729 55,26 913.352 72,78 408.768 65,43
KALIMANTAN 11.721 4,93 30.487 13,57 283 2,82 1.916 7,19 67.483 5,38 33.704 5,40
SULAWESI 15.950 6,71 23.811 10,60 76 0,76 1.402 5,26 56.483 4,50 43.281 6,93
NUSA TENGGARA 5.995 2,52 9.965 4,43 8 0,08 21 0,08 12.436 0,99 11.971 1,92
MALUKU 4.278 1,80 5.889 2,62 7 0,07 0,3 0,00 4.006 0,32 3.523 0,56
PAPUA 4.942 2,08 13.890 6,18 5 0,05 185 0,70 7.442 0,59 6.068 0,97
TOTAL 237.729 100,00 224.698 100,00 10.030 100,00 26.654 100 1.254.951 100 624.708 100,00
DISTRIBUTION OF RESOURCES AMONG REGIONS
Source: Calculated from Ministry of Finance, Bank Indonesia, BPS and BKPM
1. Resources allocation during 2005-2009 has concentrated in Jawa-Bali.2. Need reorientation of national resources allocation (non-market intervention) to
accelerate regional development in Papua, Maluku, Nusa Tenggara, Kalimantan dan Sulawesi, and Sumatera such as:(1) “Location switching” on government investment from Jawa-Bali to Papua, Maluku,
Nusa Tenggara, Kalimantan dan Sulawesi, and Sumatera.(2) “Strengthening Public-Private Partnership” for Jawa-Bali.(3) “Promoting Regional Banking” in Papua, Maluku, Nusa Tenggara, Kalimantan,
Sulawesi, and Sumatera.11
WHAT WE CAN UTILIZE DYNAMIC SAM (DYSAMS)
12

13
MODEL STRENGTHS WEAKNESSESDeterministic Approach
1. Input-Output Table (National or Interregional)
• Inter-sectoral analysis
• Forward and backward linkages
• Only commodities flows, but not covering income flows
• Unlimited supply assumption
2. SAM (National or Interregional)
• Commodities• Income flows among
different institution
• Unlimited supply assumption
3. CGE (Single Region and Multiregion)
• Integrated sectoral and regional analysis
• Post fact analysis
Stochastic Approach
1. Multiregional Econometric
• Interregional linkages
• Projection
• Statistical and non-statistical error
Mixed Approach
1. Spatial Dynamic • Introducing space • Complex and need huge data
2. Agent Based • Involving individual behavior into analysis
• Complicated
VARIOUS TOOLS FOR MODELINGVARIOUS TOOLS FOR MODELING
14
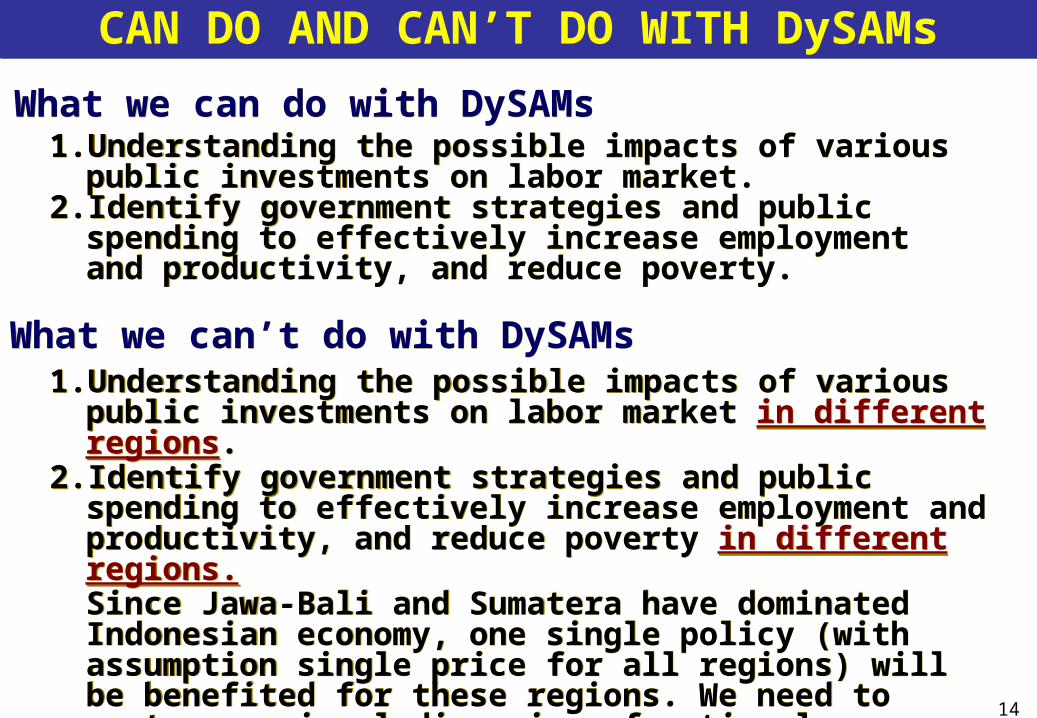
What we can do with DySAMsWhat we can do with DySAMs
What we can’t do with DySAMsWhat we can’t do with DySAMs
1.Understanding the possible impacts of various public investments on labor market.
2.Identify government strategies and public spending to effectively increase employment and productivity, and reduce poverty.
1.Understanding the possible impacts of various public investments on labor market.
2.Identify government strategies and public spending to effectively increase employment and productivity, and reduce poverty.
1.Understanding the possible impacts of various public investments on labor market in different regions.
2.Identify government strategies and public spending to effectively increase employment and productivity, and reduce poverty in different regions.Since Jawa-Bali and Sumatera have dominated Indonesian economy, one single policy (with assumption single price for all regions) will be benefited for these regions. We need to capture regional dimension of national policies. Therefore, we need more information and more interregional analysis.
CAN DO AND CAN’T DO WITH DySAMsCAN DO AND CAN’T DO WITH DySAMs

WHAT NEXT
15

16
1. Continuing partnership and collaboration between GOI and international organizations (ILO, WB, JICA, CIDA, ADB, SIDA, KOICA, etc), and between Kemenko, Bappenas, Minsitry of Finance, Bank Indonesia, BPS, other line ministries, local governments, universities and research institutes.
2. Strengthening policy dialogues and policy forum on modeling and policy formulation.
3. Building the capacity of local governments in doing policy analysis, and preparing development scenarios and strategies.
4. Improving data and information system including efforts to build, update and publish Interregional Input-Output (IRIO) Table, Interregional Social Accounting Matrix (IRSAM) and Interregional Computable General Equilibrium Model IRCGE).
AGENDAAGENDA

THANK YOU.
17
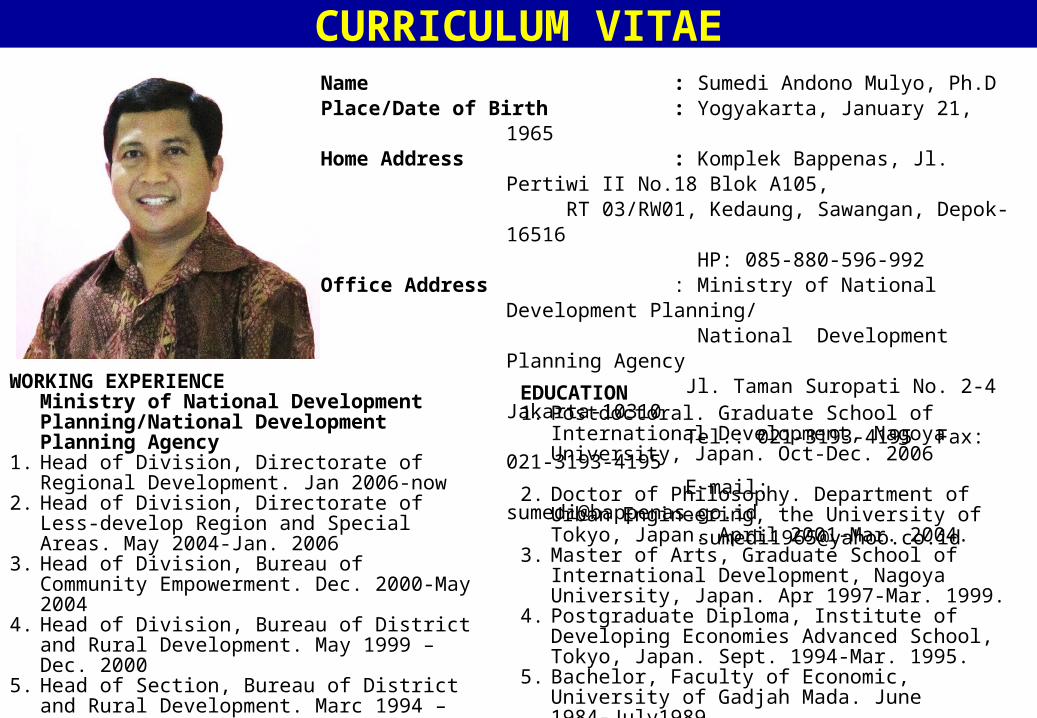
CURRICULUM VITAEName : Sumedi Andono Mulyo, Ph.DPlace/Date of Birth : Yogyakarta, January 21, 1965Home Address : Komplek Bappenas, Jl. Pertiwi II
No.18 Blok A105, RT 03/RW01, Kedaung, Sawangan, Depok-
16516 HP: 085-880-596-992
Office Address : Ministry of National Development Planning/
National Development Planning Agency
Jl. Taman Suropati No. 2-4 Jakarta-10310
Tel.: 021-3193-4195 Fax: 021-3193-4195 E-mail: [email protected] [email protected]
EDUCATION1. Postdoctoral. Graduate School of International
Development, Nagoya University, Japan. Oct-Dec. 2006
2. Doctor of Philosophy. Department of Urban Engineering, the University of Tokyo, Japan. April 2001-Mar. 2004.
3. Master of Arts, Graduate School of International Development, Nagoya University, Japan. Apr 1997-Mar. 1999.
4. Postgraduate Diploma, Institute of Developing Economies Advanced School, Tokyo, Japan. Sept. 1994‑Mar. 1995.
5. Bachelor, Faculty of Economic, University of Gadjah Mada. June 1984‑July1989.
WORKING EXPERIENCEMinistry of National Development Planning/National Development Planning Agency
1. Head of Division, Directorate of Regional Development. Jan 2006-now
2. Head of Division, Directorate of Less-develop Region and Special Areas. May 2004-Jan. 2006
3. Head of Division, Bureau of Community Empowerment. Dec. 2000-May 2004
4. Head of Division, Bureau of District and Rural Development. May 1999 –Dec. 2000
5. Head of Section, Bureau of District and Rural Development. Marc 1994 –Jan. 1997
6. Planner, Bureau of Economic and Statistical Analysis, 1991‑March1994