Embed Size (px)
Citation preview
Current Accident Analysis and
AEB Evaluation Method for
Pedestrians in JapanJuly 1st, 2014
National Traffic Safety and Environment Laboratory
Kenichi Ando
Final AsPeCSS Workshop
Outline
� Pedestrian accident in Japan
� Regulation and JNCAP (passive)
� Pedestrian accident analysis
� Evaluation method of AEB
2
Traffic Accident in Japan
0
200.000
400.000
600.000
800.000
1.000.000
1.200.000
1.400.000
0
2.000
4.000
6.000
8.000
10.000
12.000
14.000
16.000
18.000
1990 1995 2000 2005 2010 2015 2020
Acc
ide
nts
an
d In
jure
dA
ccid
en
ts a
nd
In
jure
dA
ccid
en
ts a
nd
In
jure
dA
ccid
en
ts a
nd
In
jure
d
Fa
taliti
es
Fa
taliti
es
Fa
taliti
es
Fa
taliti
es
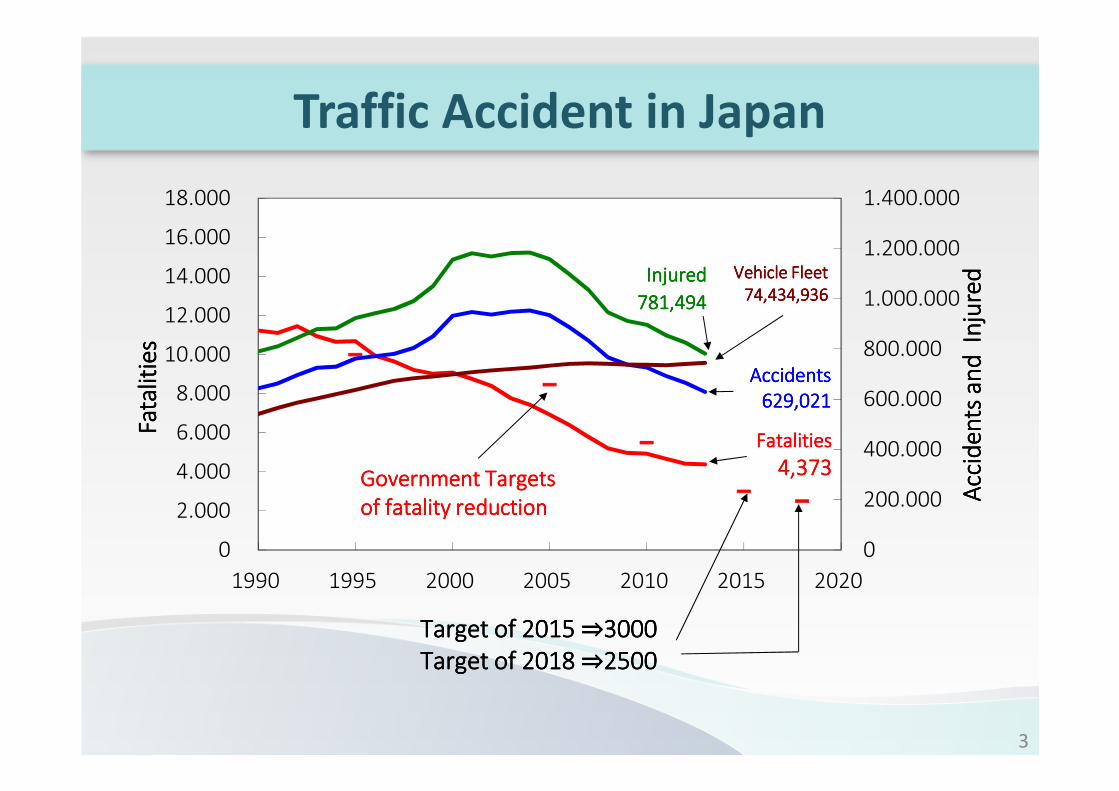
Target Target Target Target of 2015 of 2015 of 2015 of 2015 ⇒⇒⇒⇒3000300030003000
TargetTargetTargetTarget of 2018of 2018of 2018of 2018⇒⇒⇒⇒2500250025002500
FatalitiesFatalitiesFatalitiesFatalities
4,3734,3734,3734,373
AccidentsAccidentsAccidentsAccidents
629,021629,021629,021629,021
Government Government Government Government TargetTargetTargetTargetssss
of of of of fatality reductionfatality reductionfatality reductionfatality reduction
InjuredInjuredInjuredInjured
781,494781,494781,494781,494
Vehicle FleetVehicle FleetVehicle FleetVehicle Fleet
74,434,93674,434,93674,434,93674,434,936
3
Traffic Accident in Japan
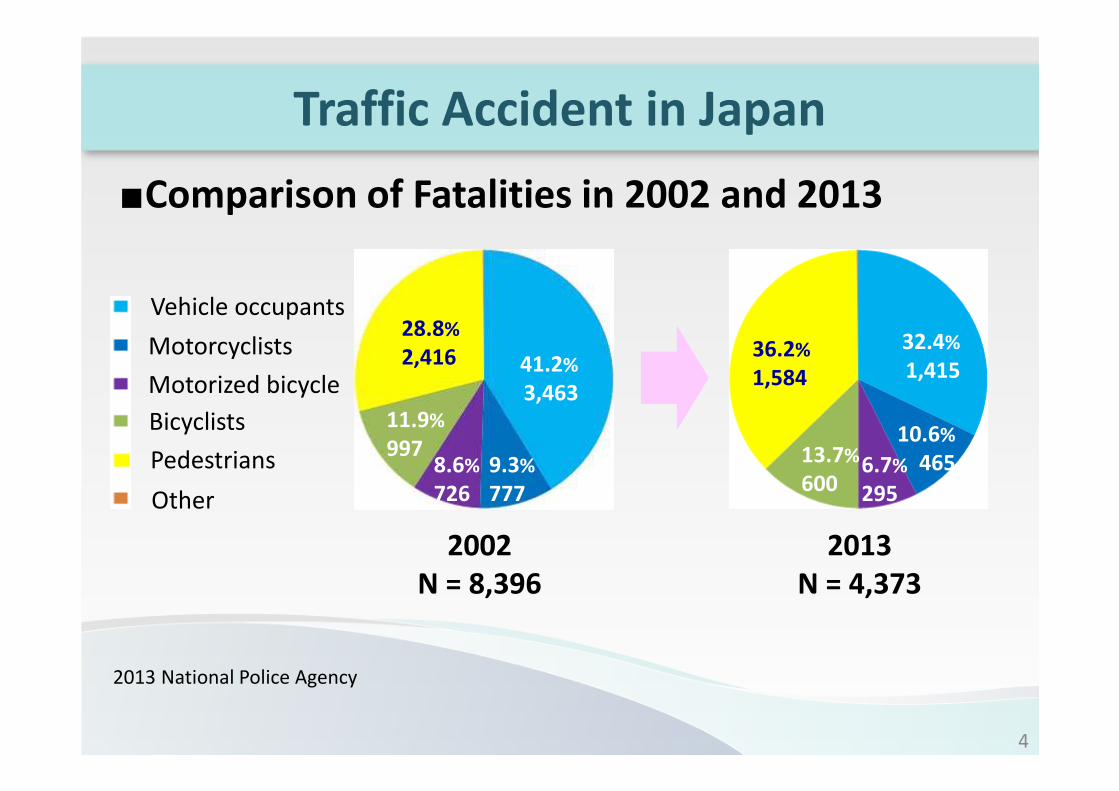
2002
N = 8,396
2013
N = 4,373
41.2%
3,463
9.3%
777
8.6%
726
11.9%
997
28.8%
2,41632.4%
1,415
6.7%
295
13.7%
600
10.6%
465
36.2%
1,584
2013 National Police Agency
Vehicle occupants
Motorcyclists
Motorized bicycle
Bicyclists
Pedestrians
Other
■Comparison of Fatalities in 2002 and 2013
4
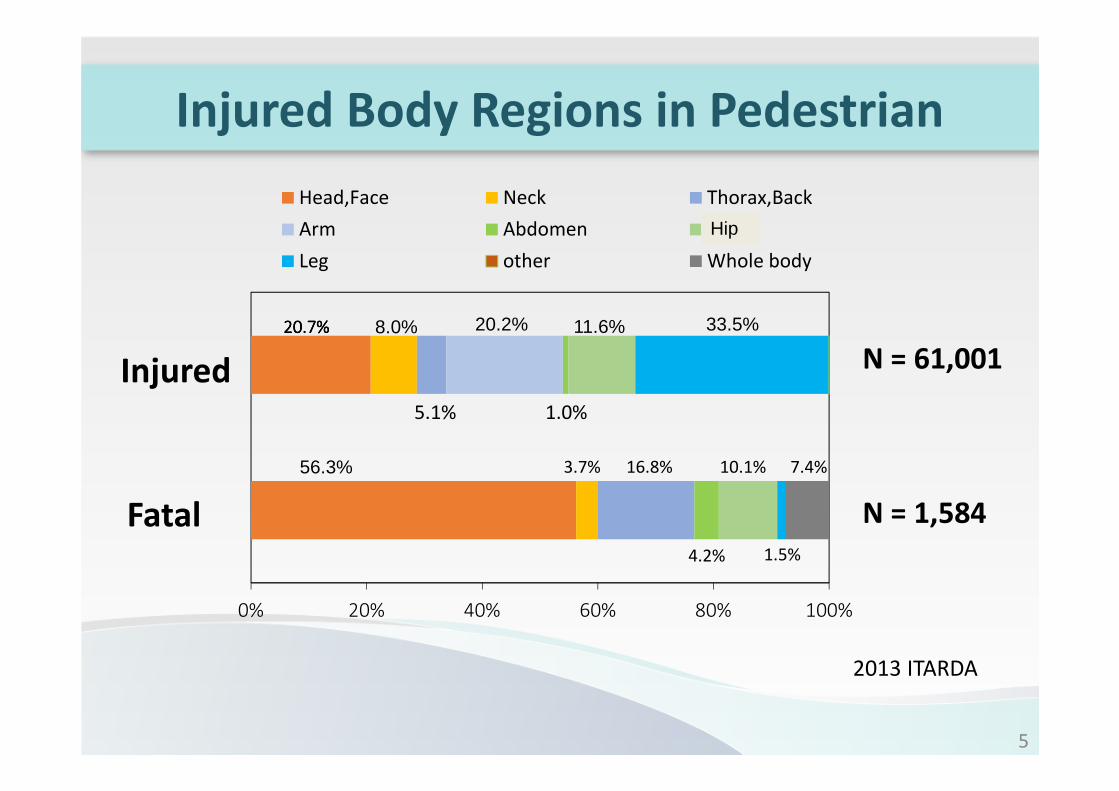
2013 ITARDA
N = 61,001
N = 1,584
Injured
Fatal
0% 20% 40% 60% 80% 100%
Head,Face Neck Thorax,Back
Arm Abdomen Pelvis
Leg other Whole body
8.0%
5.1%
20.2%
1.0%
11.6% 33.5%
56.3% 3.7% 16.8%
4.2%
10.1%
1.5%
7.4%
20.7%20.7%20.7%20.7%
Injured Body Regions in Pedestrian
5
Hip
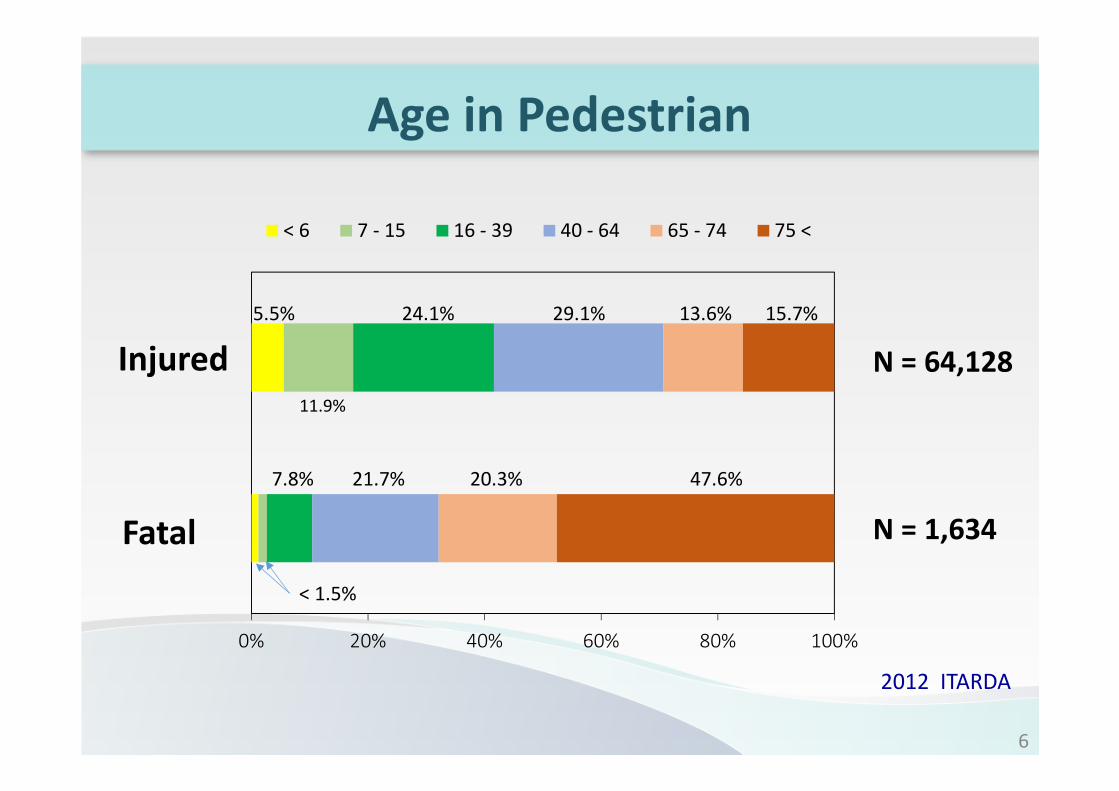
2012 ITARDA
Fatal
N = 64,128
N = 1,634
0% 20% 40% 60% 80% 100%
< 6 7 - 15 16 - 39 40 - 64 65 - 74 75 <
5.5%
11.9%
24.1% 29.1% 13.6% 15.7%
47.6%20.3%21.7%7.8%
< 1.5%
Age in Pedestrian
Injured
6
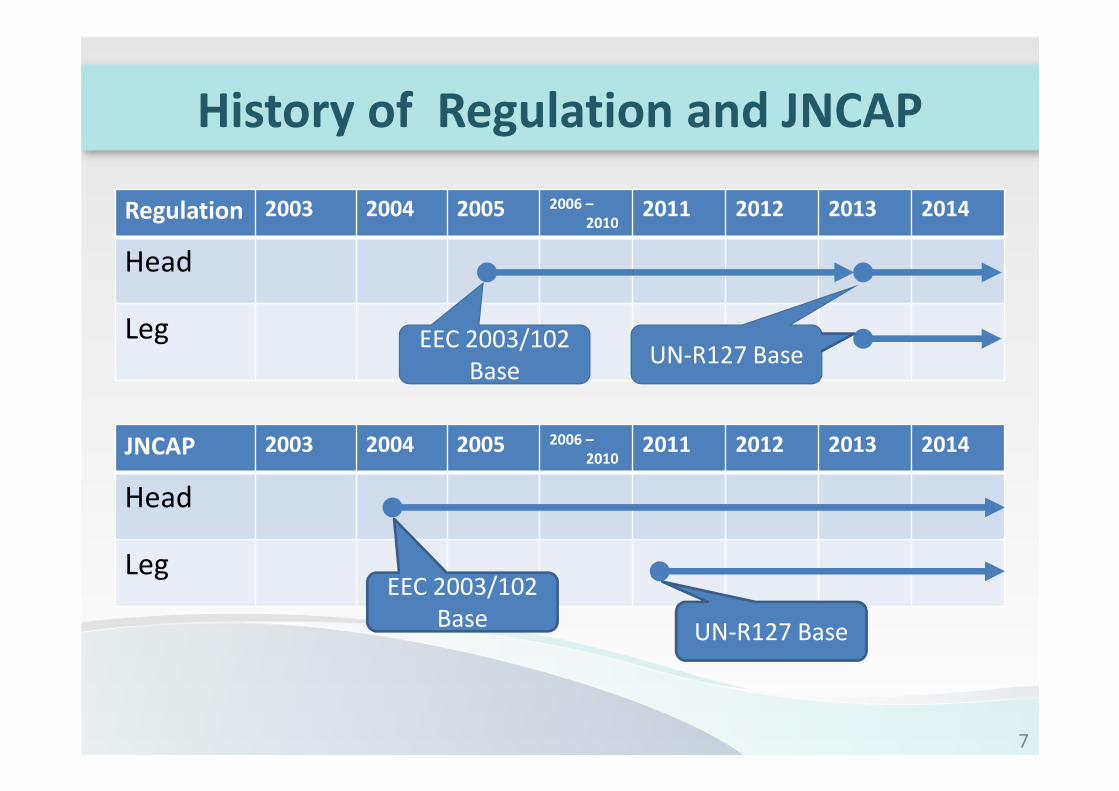
History of Regulation and JNCAP
Regulation 2003 2004 2005 2006 –
20102011 2012 2013 2014
Head
Leg
JNCAP 2003 2004 2005 2006 –
20102011 2012 2013 2014
Head
Leg
EEC 2003/102
BaseUN-R127 Base
EEC 2003/102
BaseUN-R127 Base
7
31 1
10
44
2 1 1 1
5
13
6 11
8 7
3 4 4
1
1
64
6 6
77 7
9 8
1 1
13
12 1
3 3
0
2
4
6
8
10
12
14
16
18
20
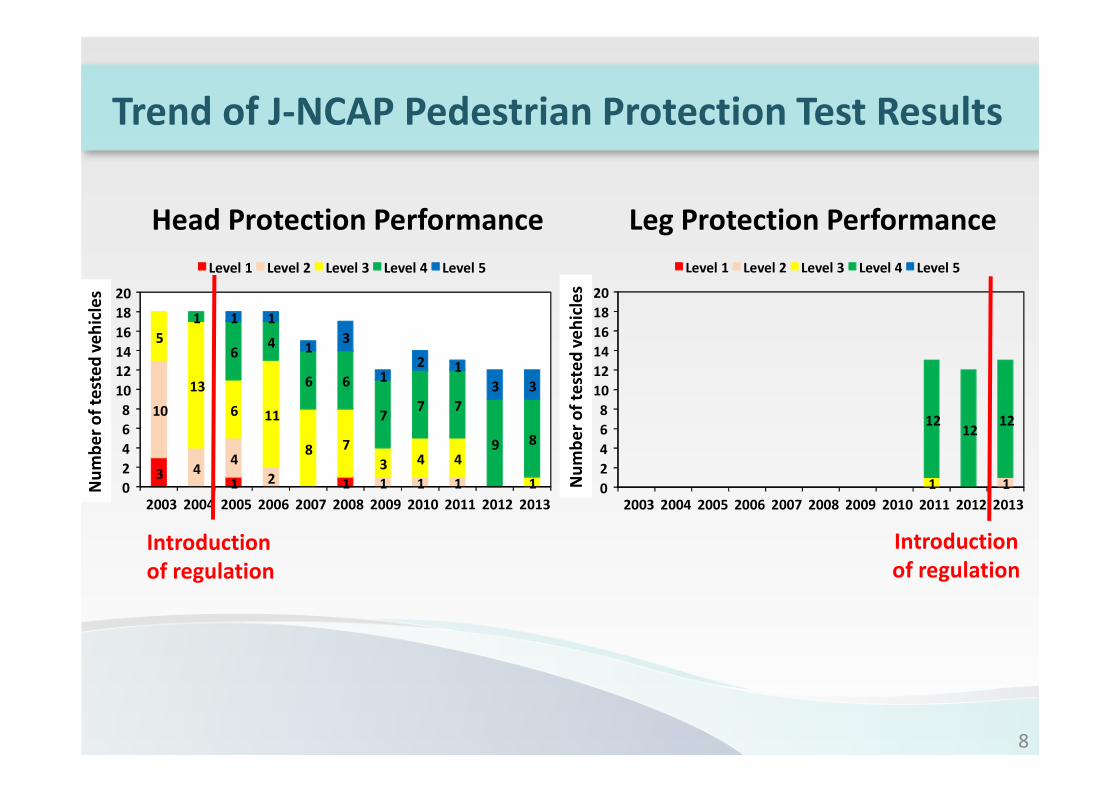
2003 2004 2005 2006 2007 2008 2009 2010 2011 2012 2013
Level 1 Level 2 Level 3 Level 4 Level 5
台数
台数
台数台数
11
1212
12
0
2
4
6
8
10
12
14
16
18
20
2003 2004 2005 2006 2007 2008 2009 2010 2011 2012 2013
Level 1 Level 2 Level 3 Level 4 Level 5
台数
台数
台数台数
Head Protection Performance Leg Protection Performance
Introduction
of regulation
Trend of J-NCAP Pedestrian Protection Test Results
Introduction
of regulation
Nu
mb
er
of
test
ed
ve
hic
les
Nu
mb
er
of
test
ed
ve
hic
les
8
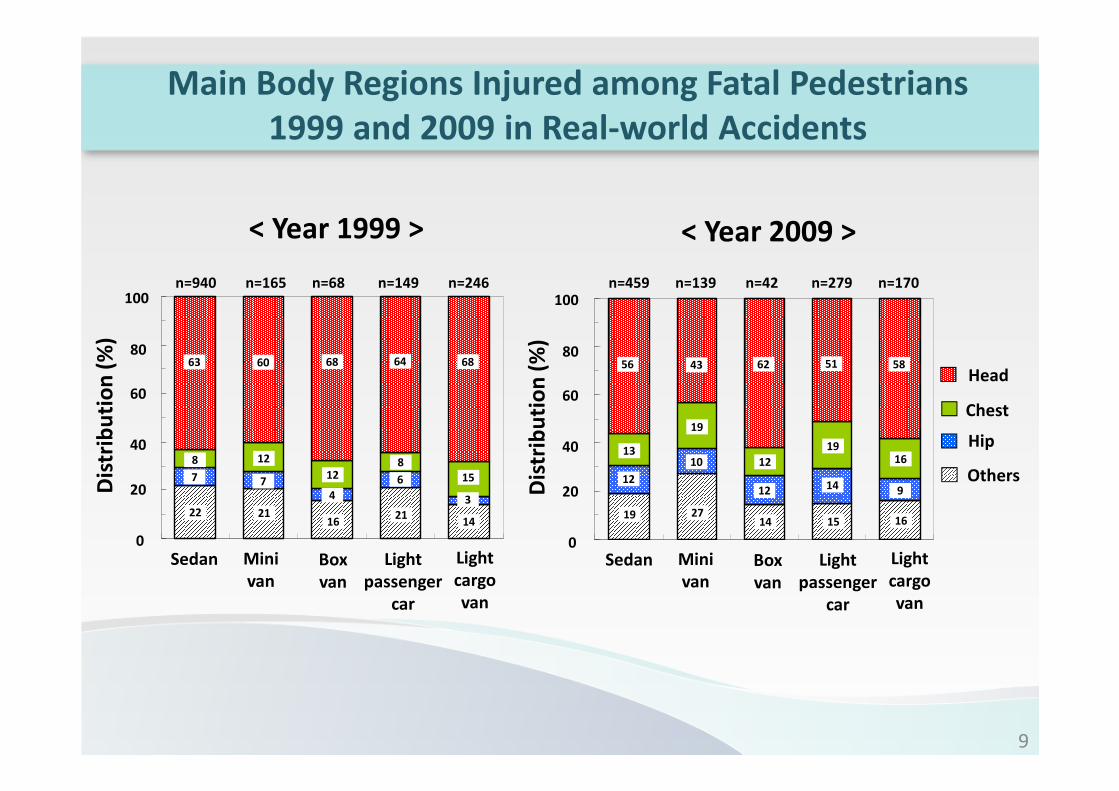
Main Body Regions Injured among Fatal Pedestrians
1999 and 2009 in Real-world Accidents
60
40
20
0
Sedan Light
passenger
car
Mini
van
Box
van
Light
cargo
van
Dis
trib
uti
on
(%
)
Head
80
100
< Year 1999 >
63
8
7
22
n=940 n=165 n=68 n=149 n=246
60
12
7
21
68
12
4
16
64
8
6
21
68
15
3
14
60
40
20
0 D
istr
ibu
tio
n (
%)
80
100
< Year 2009 >
56
13
12
19
n=459 n=139 n=42 n=279 n=170
43
19
10
27
62
12
12
14
51
19
14
15
58
16
9
16
Sedan Light
passenger
car
Mini
van
Box
van
Light
cargo
van
Chest
Hip
Others
9
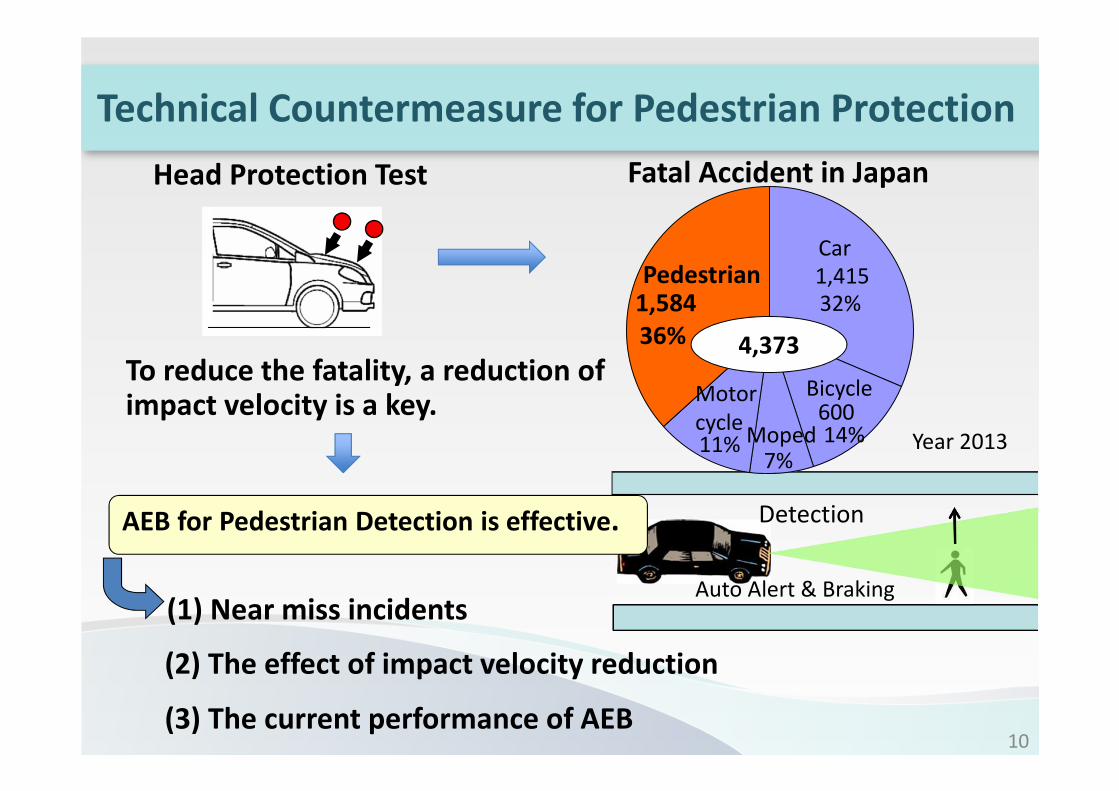
To reduce the fatality, a reduction of impact velocity is a key.
Head Protection Test
Detection
Auto Alert & Braking(1) Near miss incidents
AEB for Pedestrian Detection is effective.
4,373
Pedestrian1,584
36%
Motor
cycle11% Moped
7%
Bicycle60014%
32%
Car
1,415
Fatal Accident in Japan
Year 2013
(2) The effect of impact velocity reduction
(3) The current performance of AEB
Technical Countermeasure for Pedestrian Protection
10
Analysis of Near-miss Incidents Data
11

• NTSEL: 163 car-to-pedestrian near-miss incident data were
analyzed in the present study.
Near-miss Incident Data from J-SAE
Possibly recorded for 15 seconds
Sudden brake
10 seconds 5 seconds
cameraRecorder installed
When a taxi driver brakes with high
deceleration, the information are
recorded for 15 seconds.
• Data: Driving recorders are installed in taxis
2005 to 2009: 38,000 incidents as Near-miss data
105 taxis in Tokyo
20 taxis in Shizuoka
• Forward motion picture
• Acceleration
• Brake signal
• Car traveling velocity
12
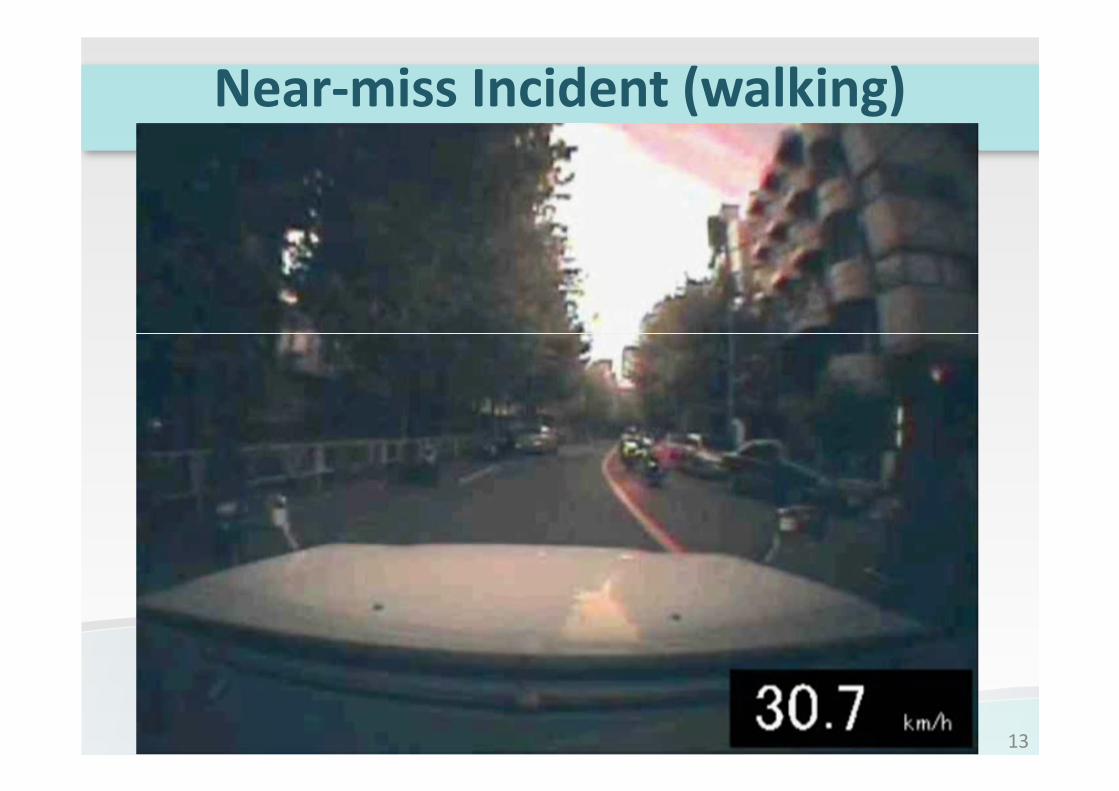
Near-miss Incident (walking)
13
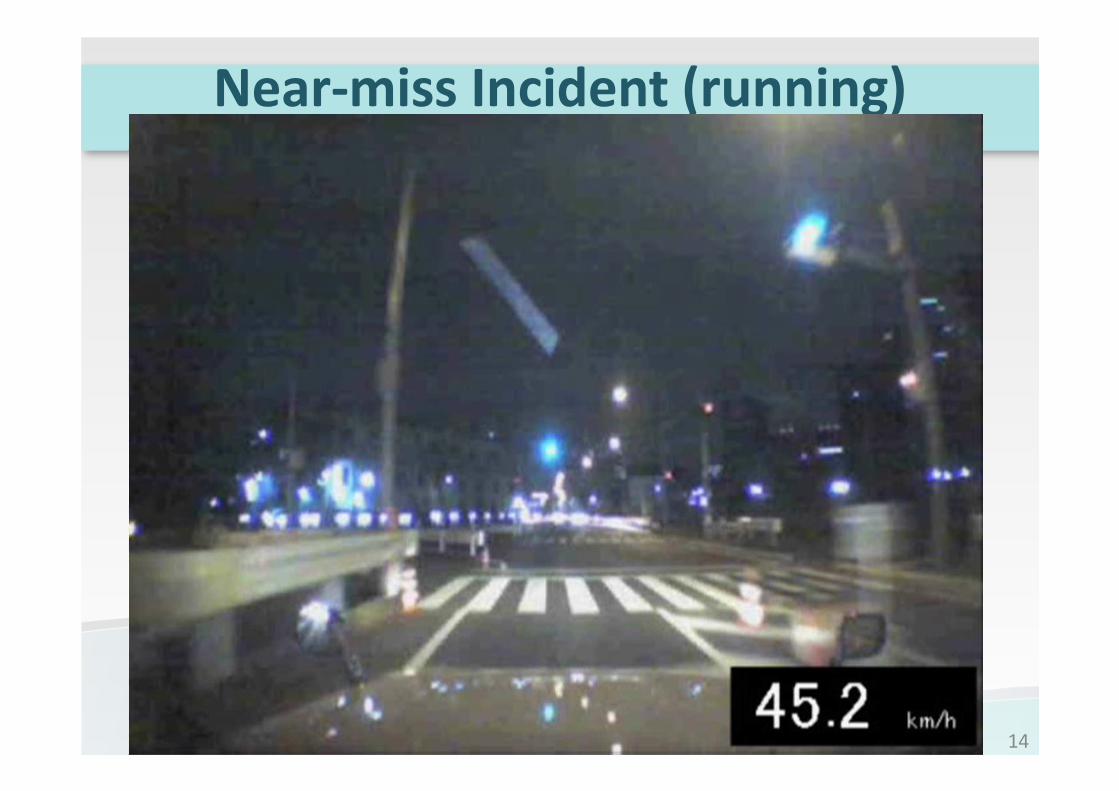
14
Near-miss Incident (running)
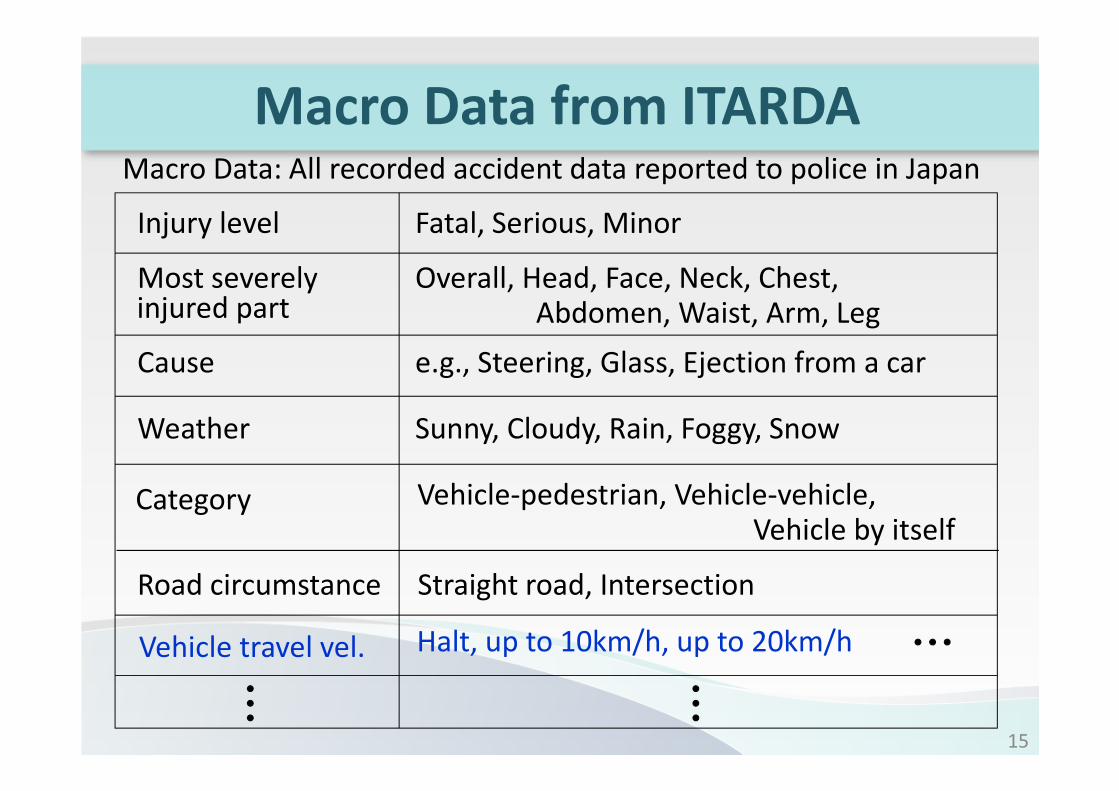
Macro Data from ITARDA
Injury level
Macro Data: All recorded accident data reported to police in Japan
Fatal, Serious, Minor
Weather Sunny, Cloudy, Rain, Foggy, Snow
Category Vehicle-pedestrian, Vehicle-vehicle,
Halt, up to 10km/h, up to 20km/h
Most severely Overall, Head, Face, Neck, Chest,
Cause e.g., Steering, Glass, Ejection from a car
injured part Abdomen, Waist, Arm, Leg
Vehicle by itself
Vehicle travel vel.
Road circumstance Straight road, Intersection
15
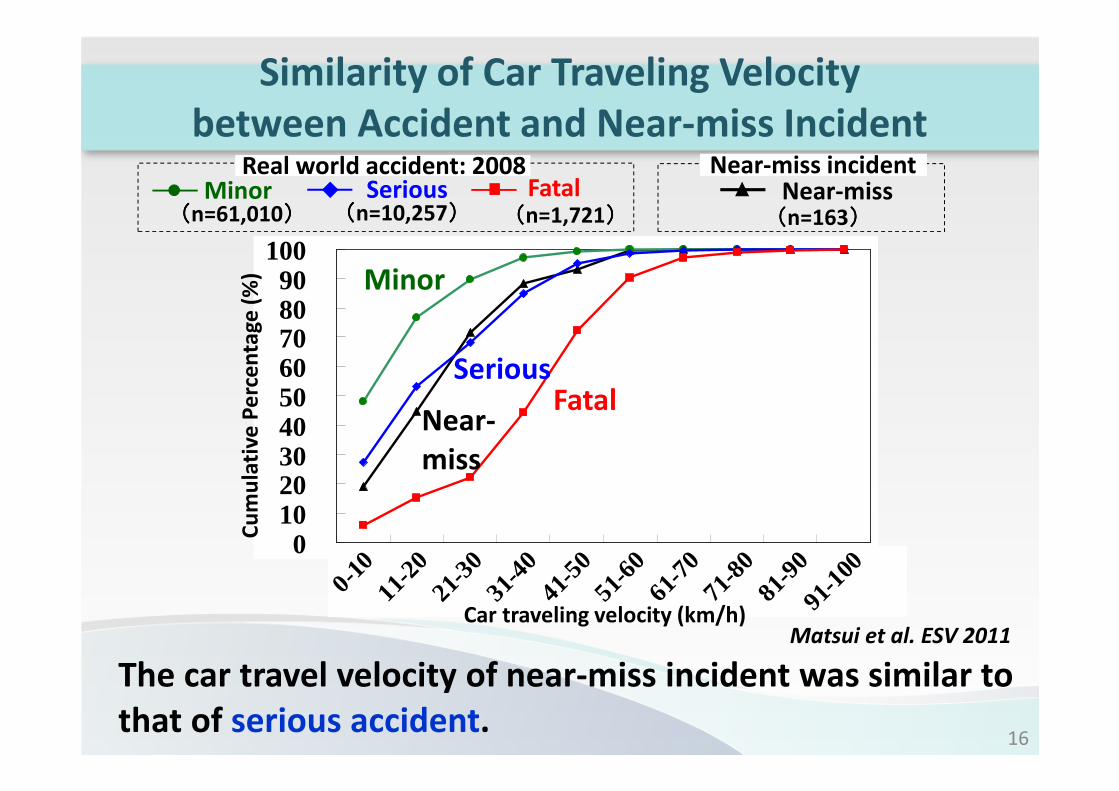
Fatal SeriousMinor
0102030405060708090
100
0-10
11-2
021
-30
31-4
041
-50
51-6
061
-70
71-8
081
-90
91-1
00C
um
ula
tiv
e P
erc
en
tag
e (
%)
((((n=1,721))))((((n=10,257))))((((n=61,010))))Near-miss((((n=163))))
Real world accident: 2008 Near-miss incident
FatalSerious
Minor
Near-
miss
The car travel velocity of near-miss incident was similar to
that of serious accident.
Car traveling velocity (km/h)Matsui et al. ESV 2011
Similarity of Car Traveling Velocity
between Accident and Near-miss Incident
16
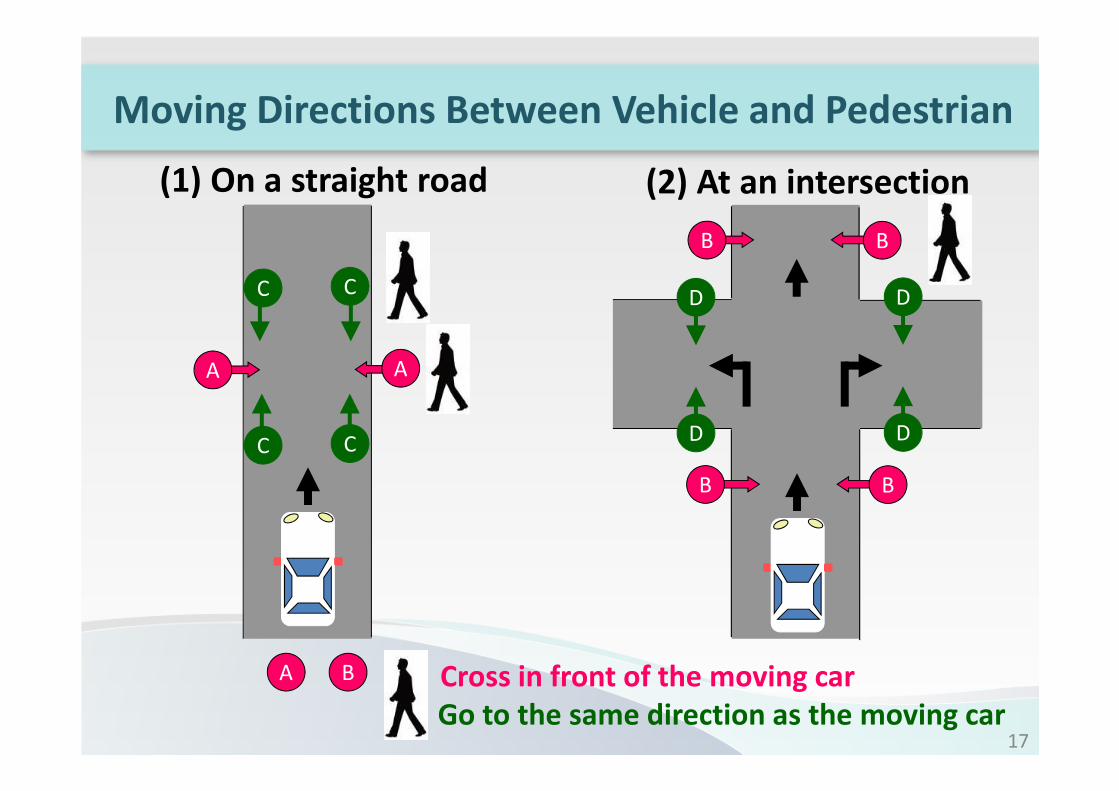
17
Moving Directions Between Vehicle and Pedestrian
C
C
C
C
D
D
D
D
B
B Cross in front of the moving carA
Go to the same direction as the moving car
A A
B
B B
(1) On a straight road (2) At an intersection
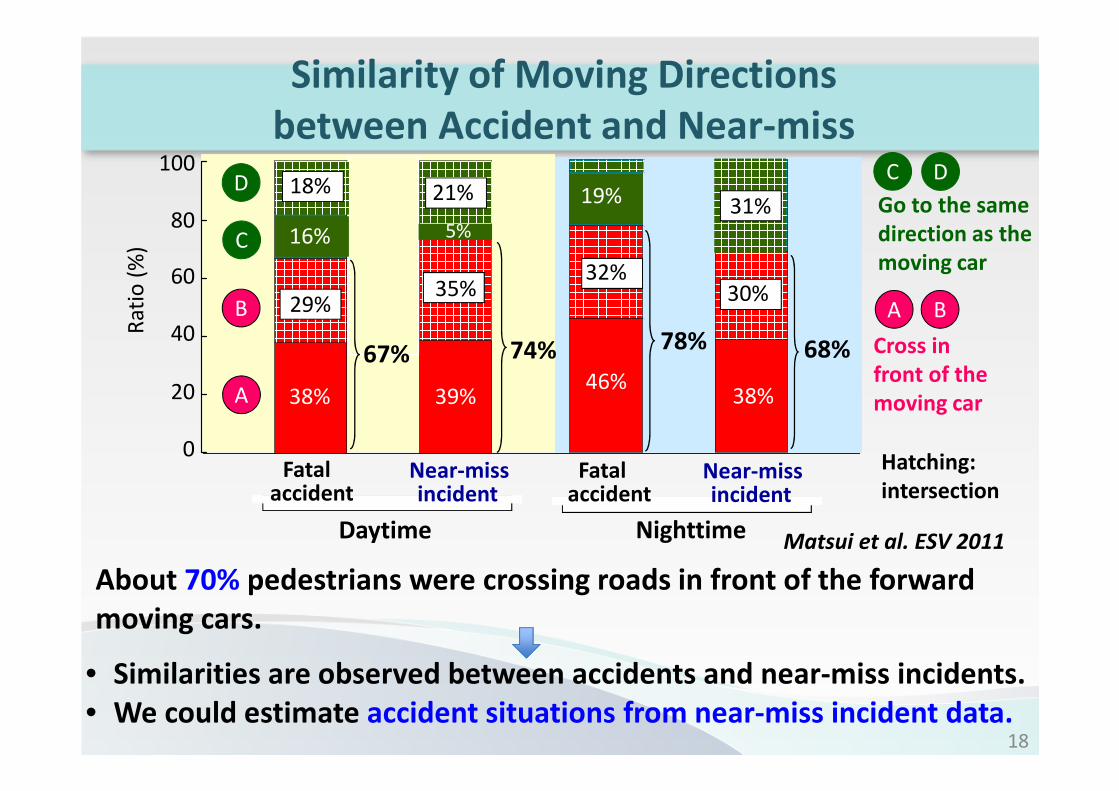
18
Fatal Near-miss Fatal Near-miss
Daytime Nighttime
100
80
60
40
20
0
accident incident accident incident
Similarity of Moving Directions
between Accident and Near-missR
ati
o (
%)
A
B
C
D
38% 39%46%
38%
29%35%
32%30%
67% 74% 78% 68%
• Similarities are observed between accidents and near-miss incidents.
• We could estimate accident situations from near-miss incident data.
About 70% pedestrians were crossing roads in front of the forward
moving cars.
Cross in
front of the
moving car
Go to the same
direction as the
moving car
B
D
A
C
Matsui et al. ESV 2011
Hatching:
intersection
21%18%
16% 5%
19% 31%
19
Classification of Near-miss
Incidents
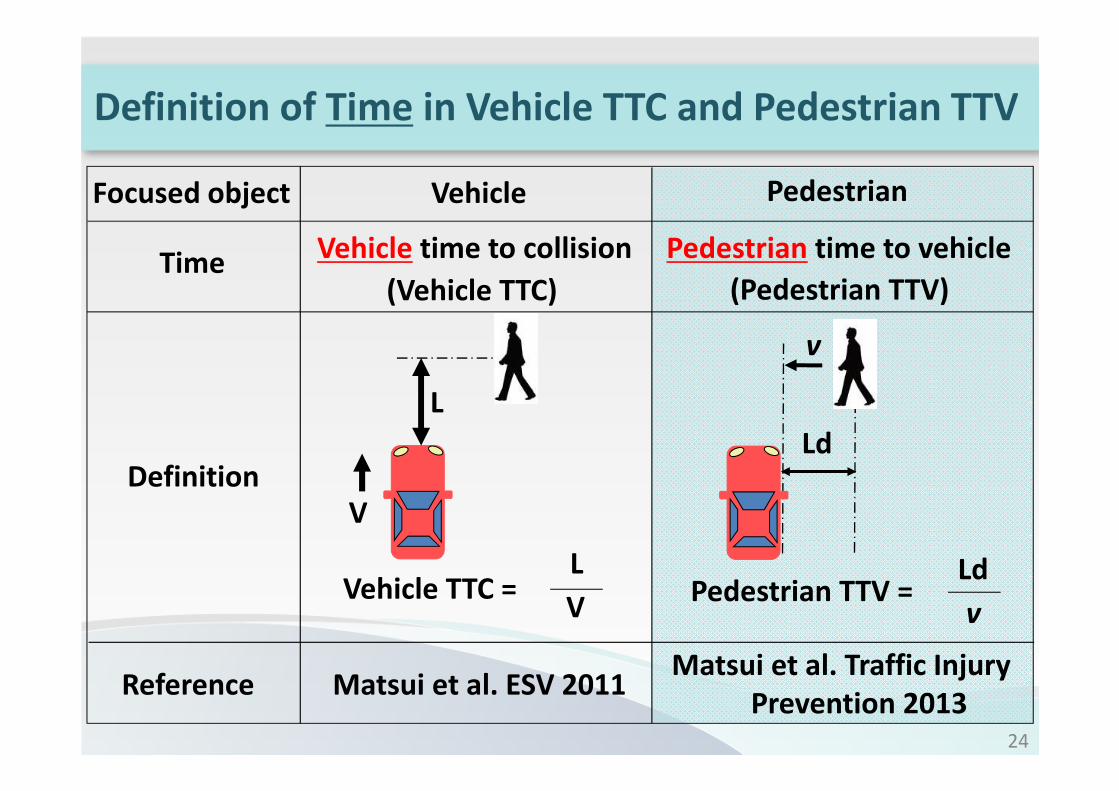
V
v
L
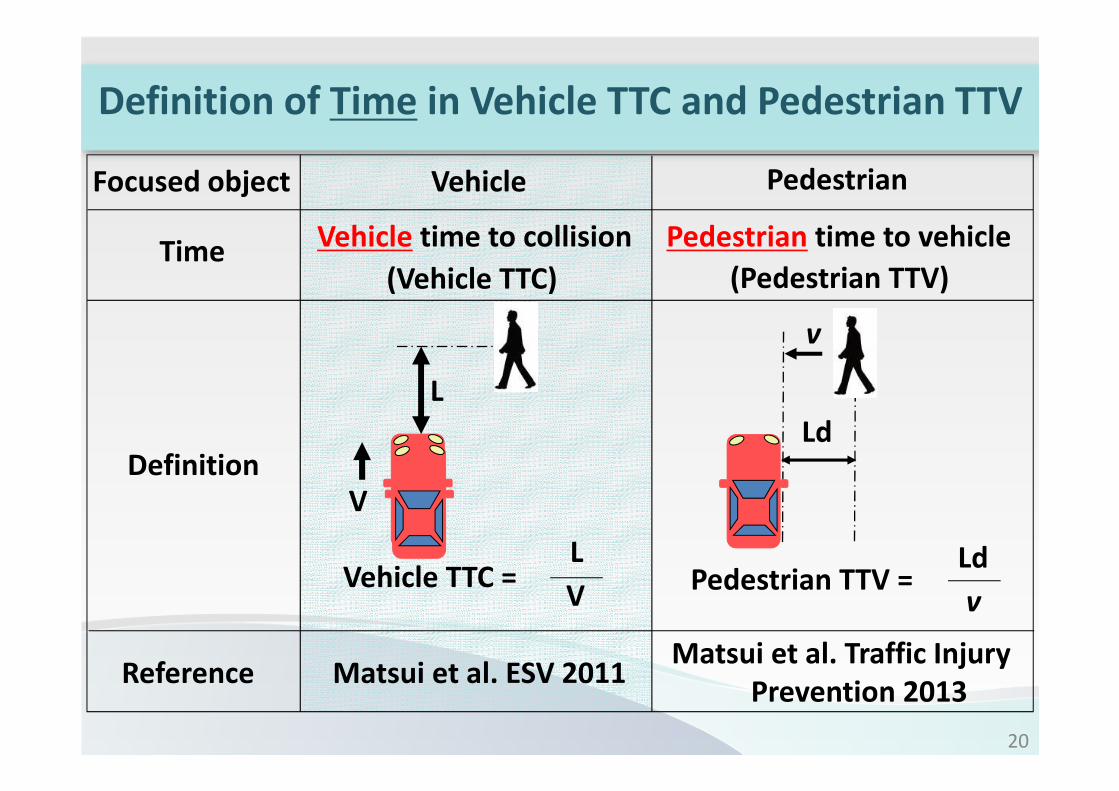
L Vehicle TTC =
V
LdPedestrian TTV =
v
Ld
Vehicle time to collision
(Vehicle TTC)
Pedestrian time to vehicle
(Pedestrian TTV)
Matsui et al. Traffic Injury
Prevention 2013Matsui et al. ESV 2011
Focused object
Time
Definition
Vehicle Pedestrian
Reference
Definition of Time in Vehicle TTC and Pedestrian TTV
20
21
LL
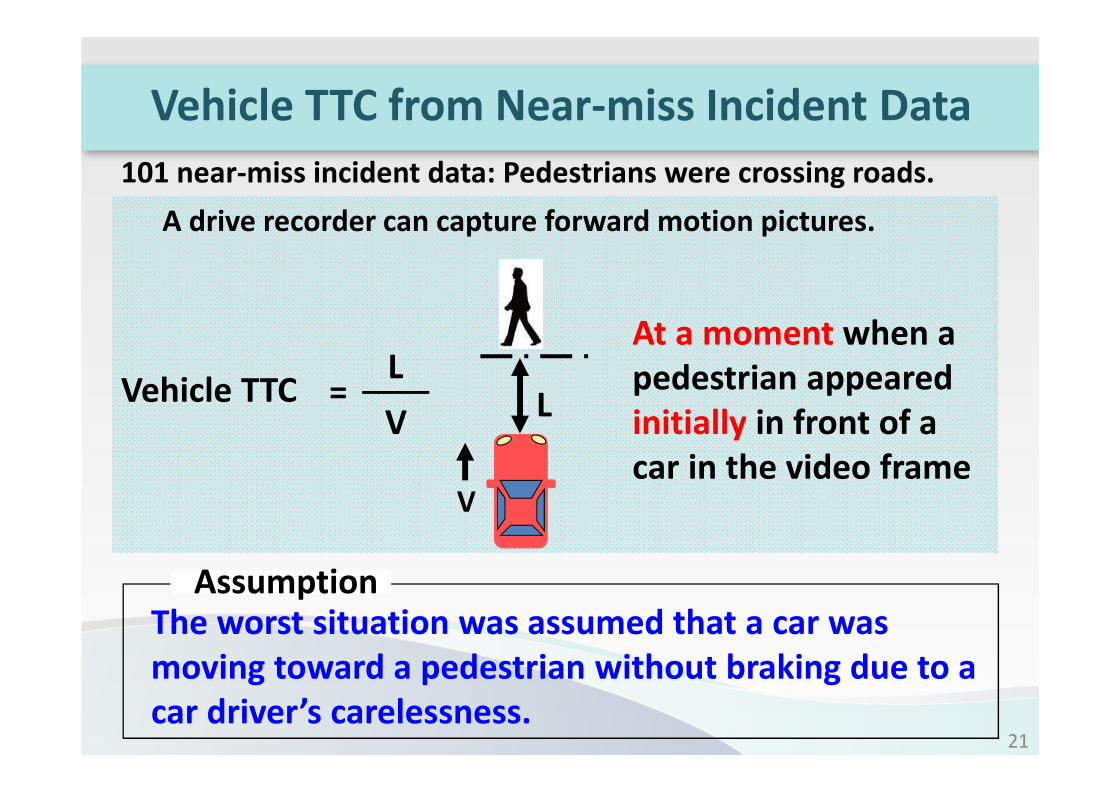
Vehicle TTCV
The worst situation was assumed that a car was
moving toward a pedestrian without braking due to a
car driver’s carelessness.
At a moment when a
pedestrian appeared
initially in front of a
car in the video frame
A drive recorder can capture forward motion pictures.
Assumption
V
=
101 near-miss incident data: Pedestrians were crossing roads.
Vehicle TTC from Near-miss Incident Data
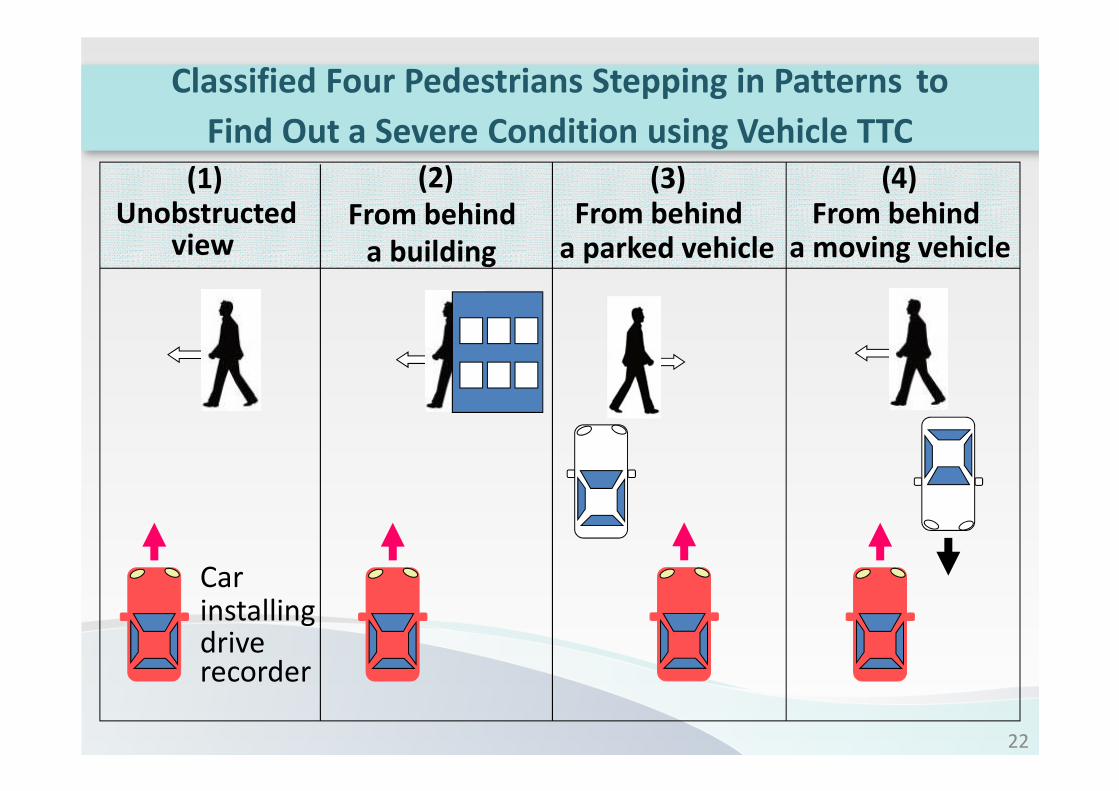
Unobstructed From behind From behinda moving vehiclea building a parked vehicle
From behind
recorder
installingCar
drive
(1) (2) (3) (4)
view
Classified Four Pedestrians Stepping in Patterns to
Find Out a Severe Condition using Vehicle TTC
22
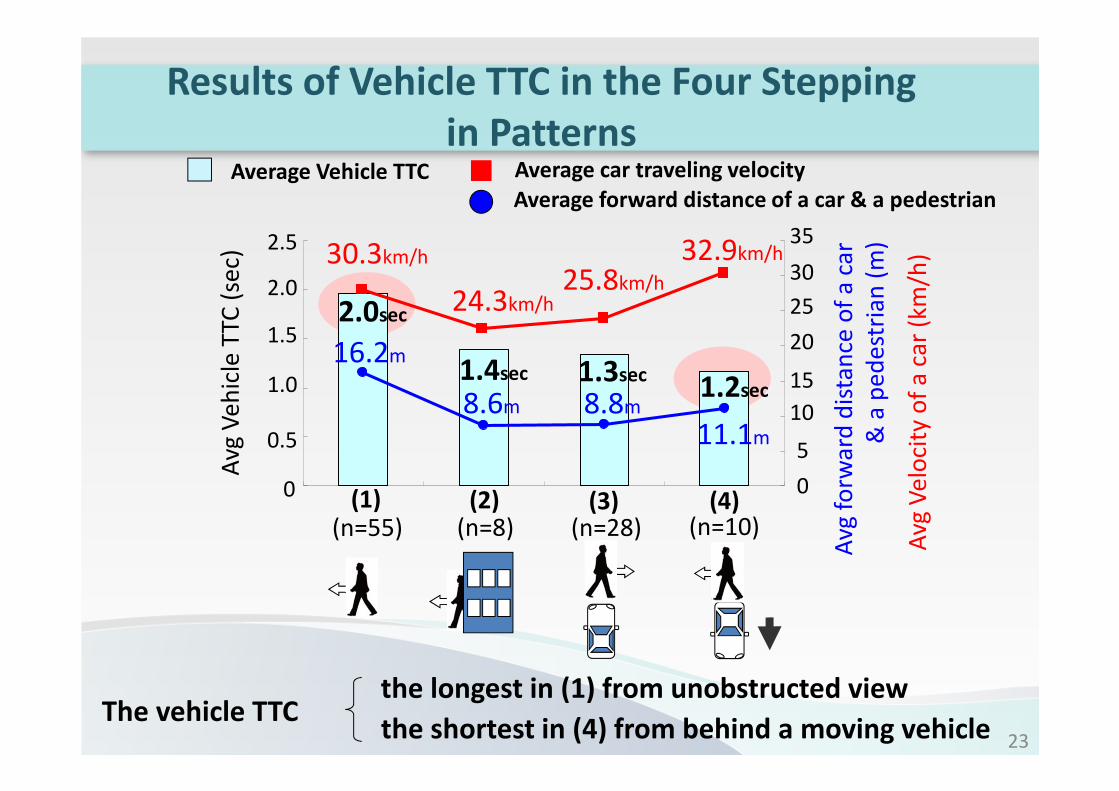
(n=55) (n=8) (n=10)
Avg
Ve
hic
le T
TC
(se
c)
Avg
forw
ard
dis
tan
ce o
f a
ca
r
Avg
Ve
loci
ty o
f a
ca
r (k
m/h
)
16.2m
8.6m 8.8m
11.1m
30.3km/h
24.3km/h25.8km/h
32.9km/h
2.0sec
1.4sec 1.3sec1.2sec
(n=28)
35
30
25
20
15
10
5
0
2.5
2.0
1.5
1.0
0.5
0 (1) (2) (3) (4)
& a
pe
de
stri
an
(m
)
Average Vehicle TTC
Average forward distance of a car & a pedestrian
Average car traveling velocity
the longest in (1) from unobstructed view
the shortest in (4) from behind a moving vehicle The vehicle TTC
Results of Vehicle TTC in the Four Stepping
in Patterns
23
V
v
L
L Vehicle TTC =
V
LdPedestrian TTV =
v
Ld
Vehicle time to collision
(Vehicle TTC)
Pedestrian time to vehicle
(Pedestrian TTV)
Focused object
Time
Definition
Vehicle Pedestrian
Matsui et al. Traffic Injury
Prevention 2013Matsui et al. ESV 2011Reference
Definition of Time in Vehicle TTC and Pedestrian TTV
24
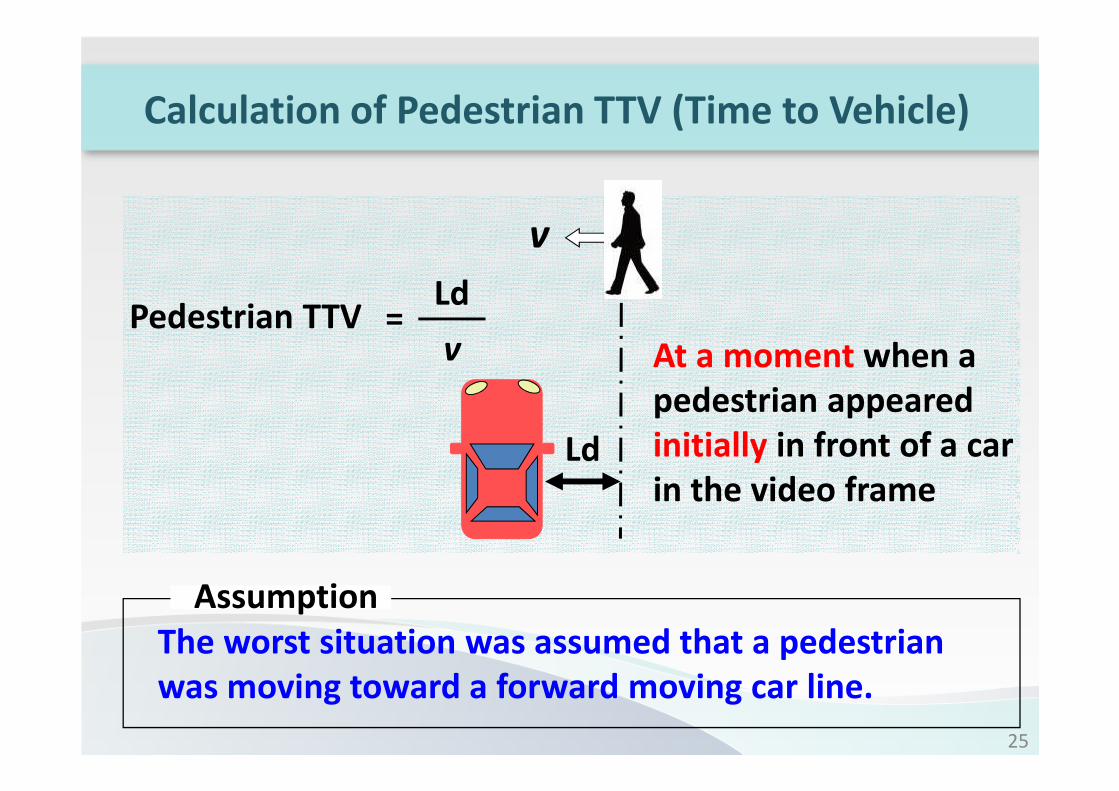
The worst situation was assumed that a pedestrian
was moving toward a forward moving car line.
At a moment when a
pedestrian appeared
initially in front of a car
in the video frame
Assumption
Ld
v
Ld Pedestrian TTV
v=
Calculation of Pedestrian TTV (Time to Vehicle)
25
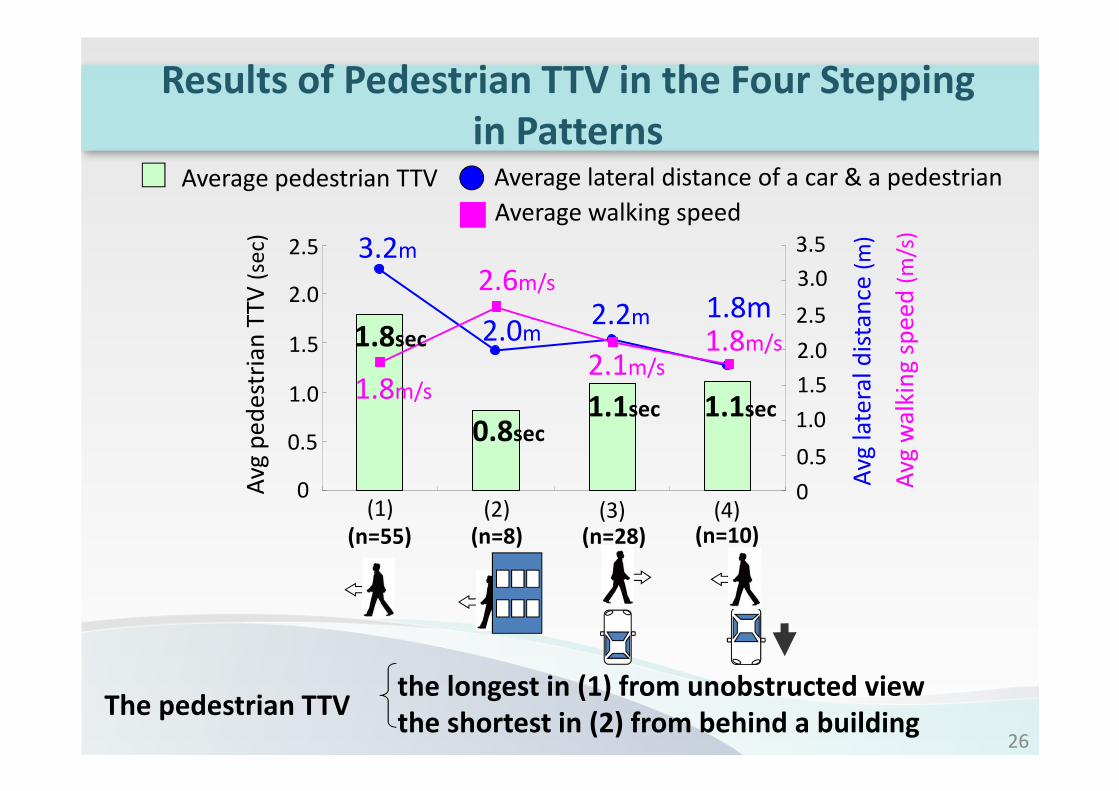
Results of Pedestrian TTV in the Four Stepping
in Patterns
Unobstructed view From behind a From behind a parkedFrom behind a moving
Avg
pe
de
stri
an
TT
V (
sec)
Avg
late
ral
dis
tan
ce (
m)
Avg
wa
lkin
g s
pe
ed
(m
/s)
1.8sec
1.1sec 1.1sec0.8sec
3.2m
2.2m 1.8m2.0m
1.8m/s2.1m/s
1.8m/s
2.6m/s
Average pedestrian TTV Average lateral distance of a car & a pedestrian
2.5
2.0
1.5
1.0
0.5
0
2.5
2.0
1.5
1.0
0.5
0
3.0
3.5
(1) (2) (3) (4)
Average walking speed
the longest in (1) from unobstructed view
the shortest in (2) from behind a building The pedestrian TTV
(n=55) (n=8) (n=10)(n=28)
26
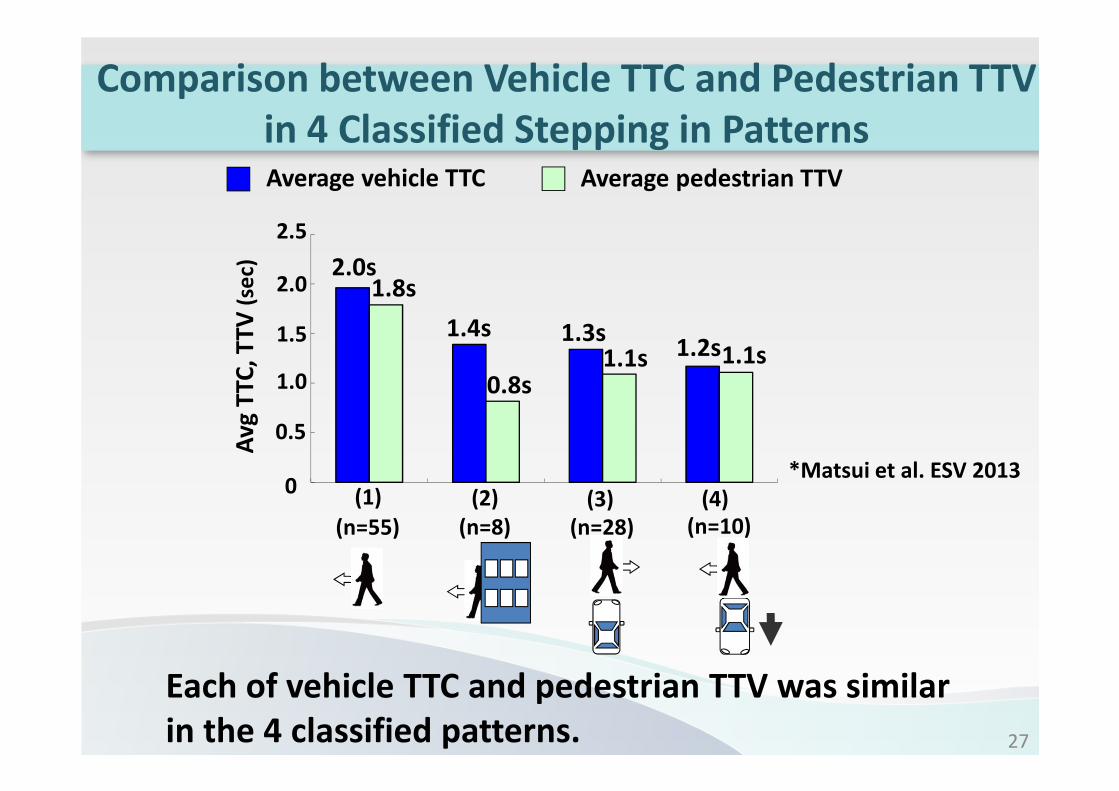
2.0s
1.3s1.2s
1.4s
Average vehicle TTC Average pedestrian TTV
1.8s
0.8s1.1s 1.1s
Av
gT
TC
, T
TV
(se
c)2.5
2.0
1.5
1.0
0.5
0*Matsui et al. ESV 2013
(1) (2) (3) (4)
Each of vehicle TTC and pedestrian TTV was similar
in the 4 classified patterns.
(n=55) (n=8) (n=10)(n=28)
Comparison between Vehicle TTC and Pedestrian TTV
in 4 Classified Stepping in Patterns
27
Pedestrian Injuries and
Collision Speeds
28
29
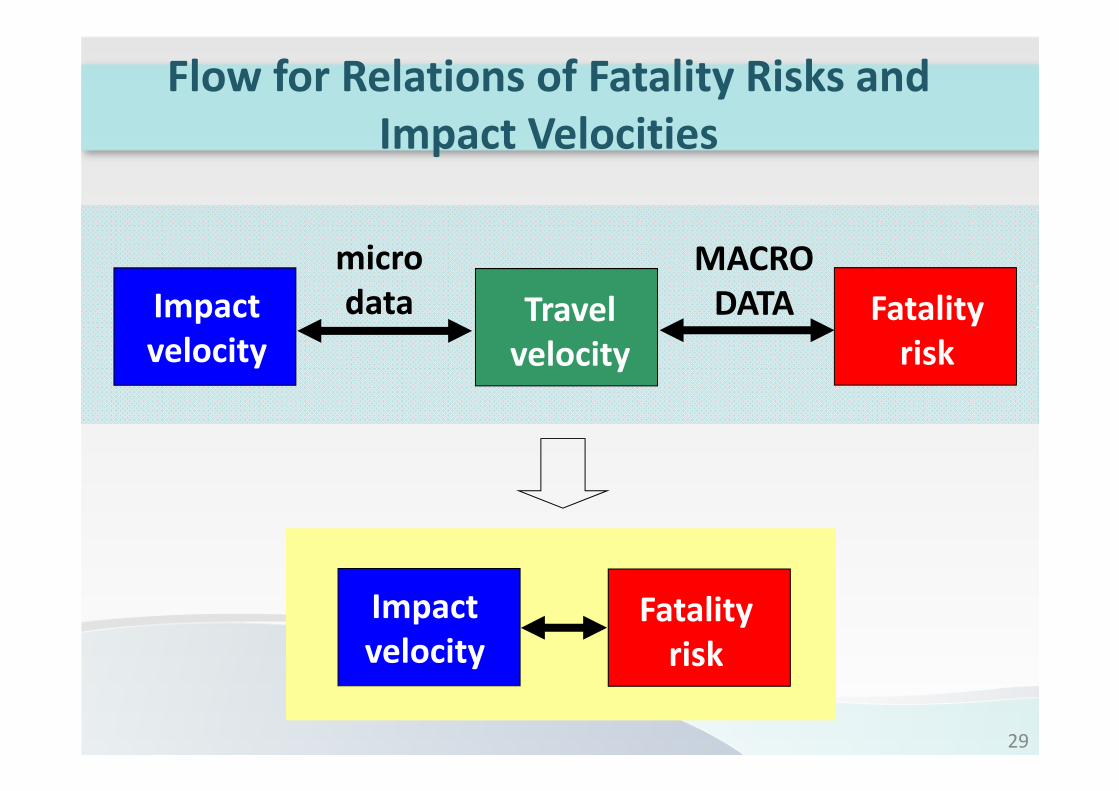
Flow for Relations of Fatality Risks and
Impact Velocities
Fatality
risk
Travel
velocity
MACRO
DATA
micro
dataImpact
velocity
Fatality
risk
Impact
velocity
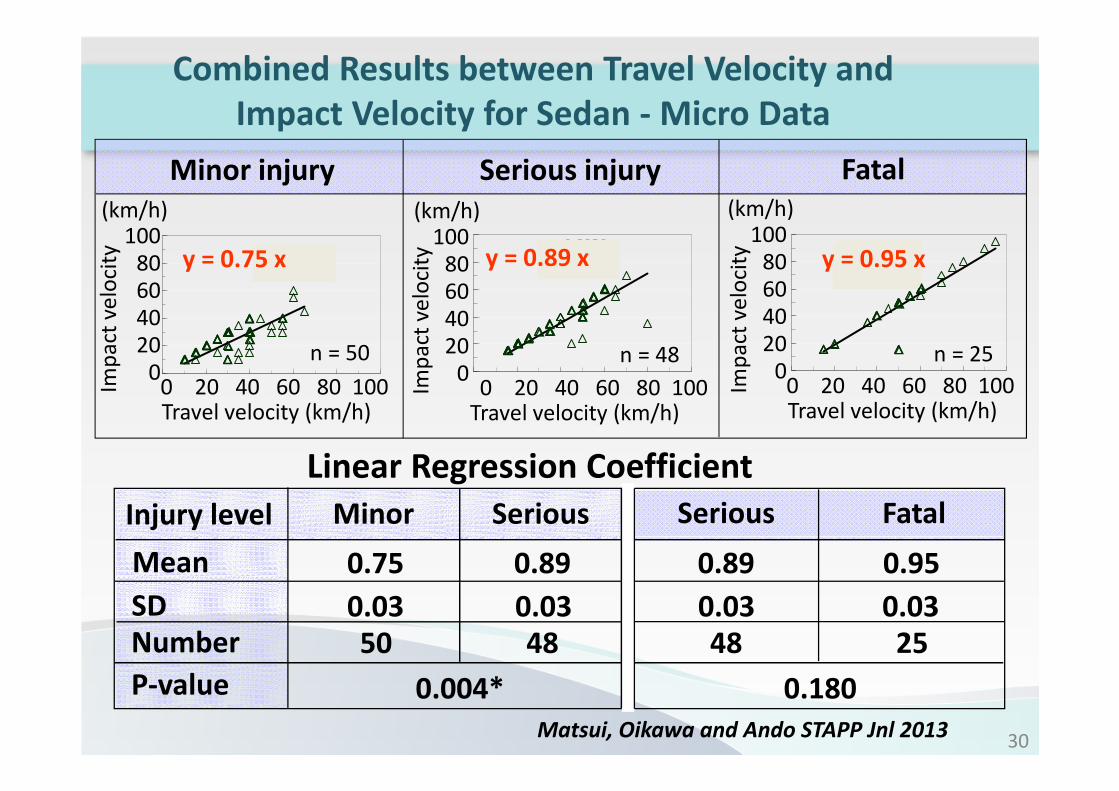
Matsui, Oikawa and Ando STAPP Jnl 2013
y = 0.9484x
R2 = 0.8189
y = 0.8929x
R2 = 0.7255y = 0.7496x
R2 = 0.6312
Minor injury Serious injury Fatal
n = 50 n = 48 n = 25
y = 0.75 x y = 0.89 x y = 0.95 x
Travel velocity (km/h)
100
80
60
40
20
0
Imp
act
ve
loci
ty
0 20 40 60 80 100
Linear Regression Coefficient
Mean
SD
P-value
0.03
0.004*
0.03 0.03 0.03
0.75 0.89 0.89 0.95
Minor Serious FatalSerious
0.180
(km/h)
Travel velocity (km/h)
100
80
60
40
20
0
Imp
act
ve
loci
ty
0 20 40 60 80 100
(km/h)
Travel velocity (km/h)
100
80
60
40
20
0
Imp
act
ve
loci
ty
0 20 40 60 80 100
(km/h)
Number 50 48 48 25
Injury level
Combined Results between Travel Velocity and
Impact Velocity for Sedan - Micro Data
30
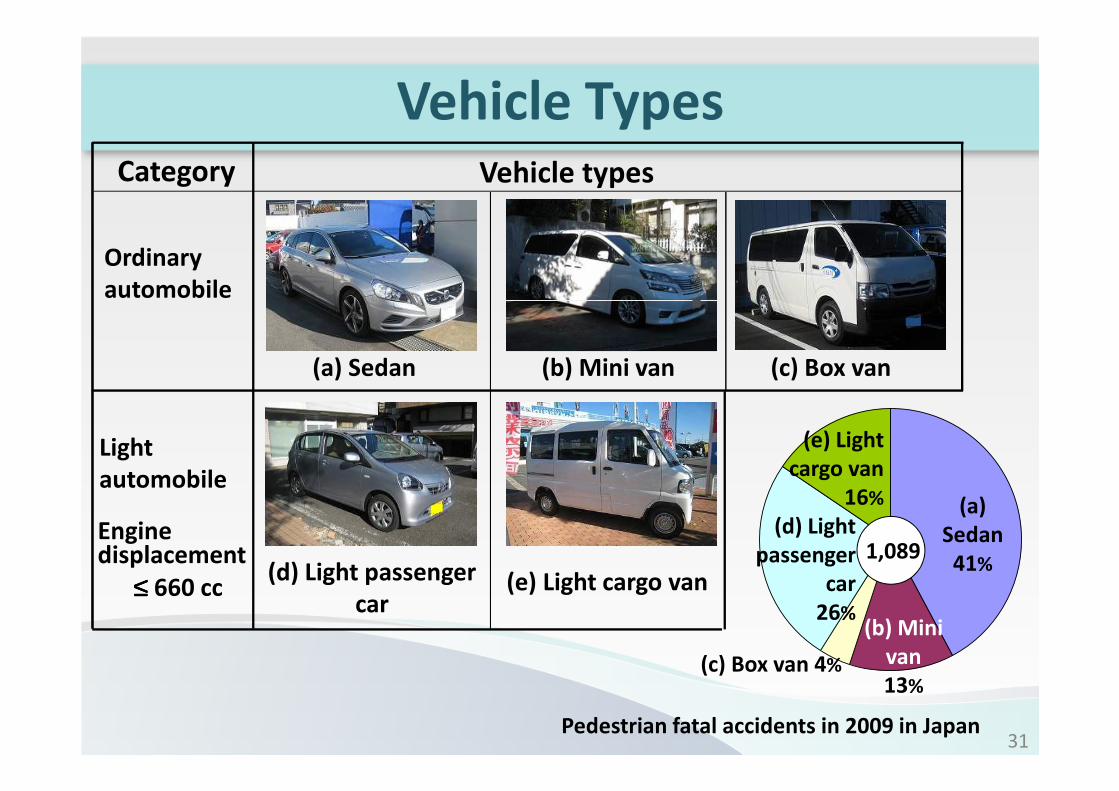
(d) Light
passenger
car
26%
(c) Box van 4%
(e) Light
cargo van
16% (a)
Sedan
41%
(b) Mini
van
13%
1,089
Pedestrian fatal accidents in 2009 in Japan
(a) Sedan (b) Mini van (c) Box van
(d) Light passenger
car
Ordinary
automobile
Light
automobile
(e) Light cargo van
Engine displacement
≤≤≤≤ 660 cc
Category Vehicle types
Vehicle Types
31
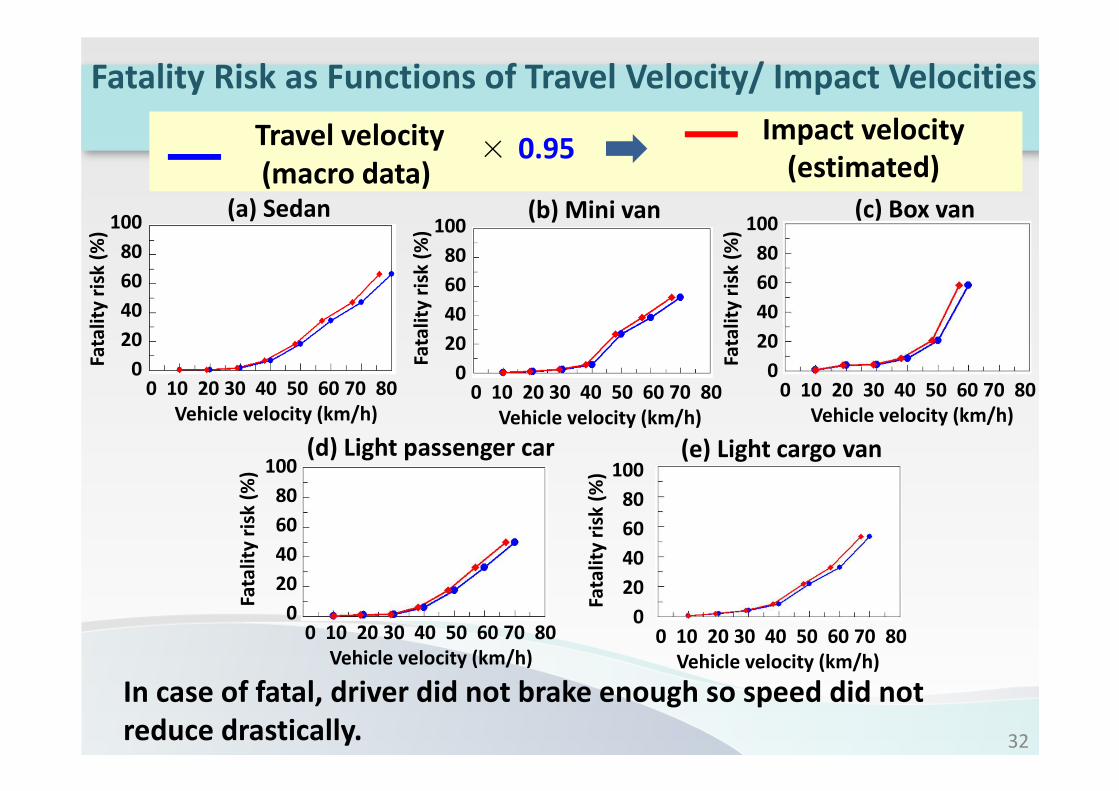
Impact velocity
(estimated)
0 10 20 30 40 50 60 70 80
Vehicle velocity (km/h)
100
80
60
40
20
0Fata
lity
ris
k (
%)
(a) Sedan (b) Mini van (c) Box van
(d) Light passenger car (e) Light cargo van
0 10 20 30 40 50 60 70 80
Vehicle velocity (km/h)
100
80
60
40
20
00 10 20 30 40 50 60 70 80
Vehicle velocity (km/h)
100
80
60
40
20
0
0 10 20 30 40 50 60 70 80
Vehicle velocity (km/h)
100
80
60
40
20
00 10 20 30 40 50 60 70 80
Vehicle velocity (km/h)
100
80
60
40
20
0
Fata
lity
ris
k (
%)
Fata
lity
ris
k (
%)
Fata
lity
ris
k (
%)
Fata
lity
ris
k (
%)
Travel velocity
(macro data) 0.95
In case of fatal, driver did not brake enough so speed did not
reduce drastically.
Fatality Risk as Functions of Travel Velocity/ Impact Velocities
32
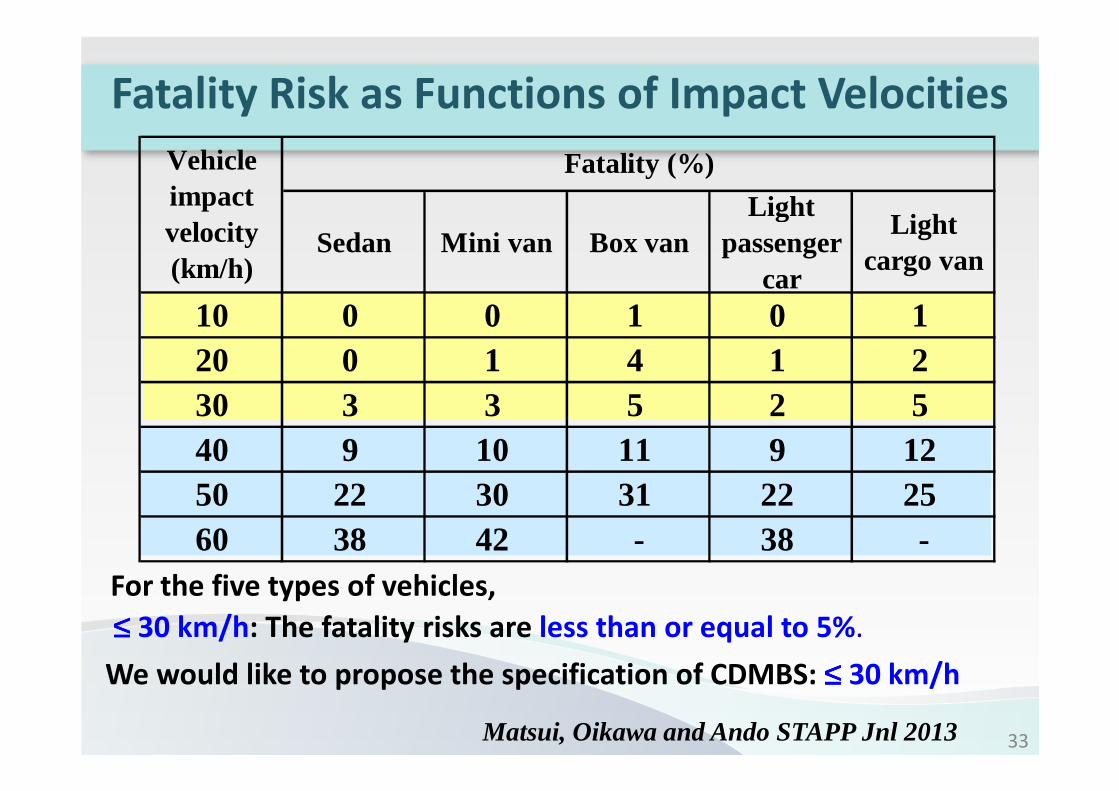
Matsui, Oikawa and Ando STAPP Jnl 2013 33
≤≤≤≤ 30 km/h: The fatality risks are less than or equal to 5%.
For the five types of vehicles,
We would like to propose the specification of CDMBS: ≤≤≤≤ 30 km/h
Fatality Risk as Functions of Impact Velocities
Sedan Mini van Box vanLight
passengercar
Lightcargo van
10 0 0 1 0 120 0 1 4 1 230 3 3 5 2 540 9 10 11 9 1250 22 30 31 22 2560 38 42 - 38 -
Vehicleimpactvelocity(km/h)
Fatality (%)
Performance of AEB for
Pedestrian Protection
34
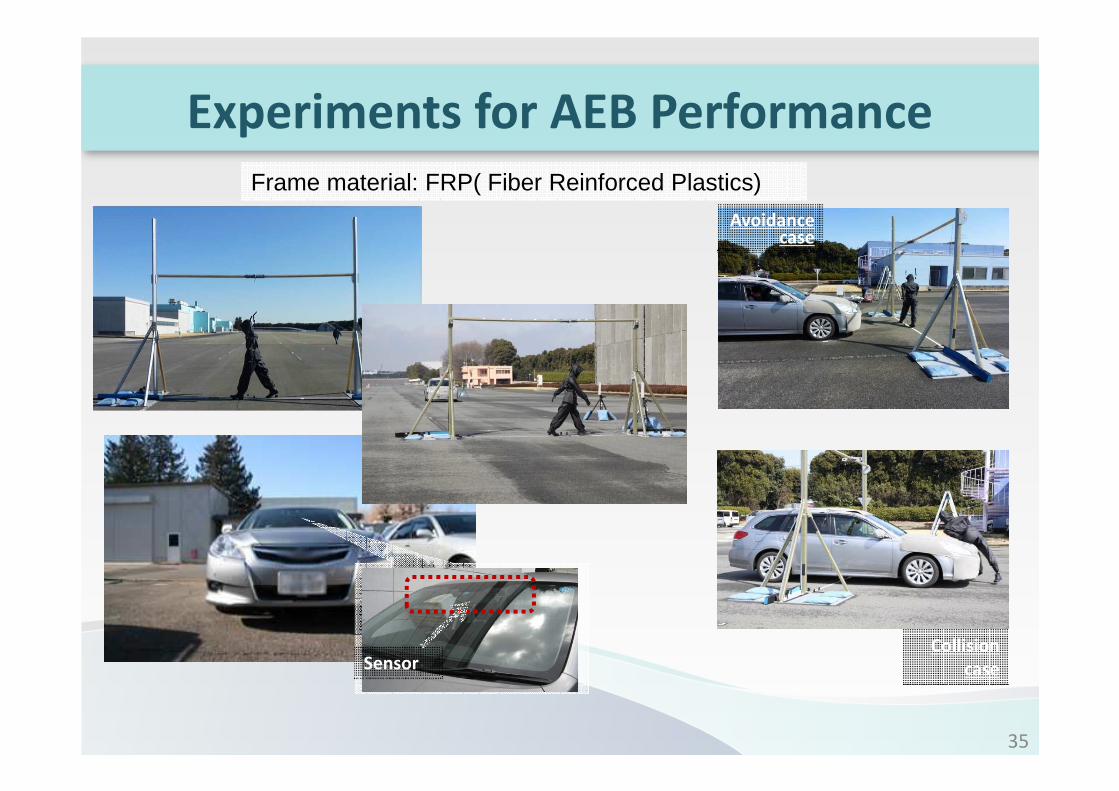
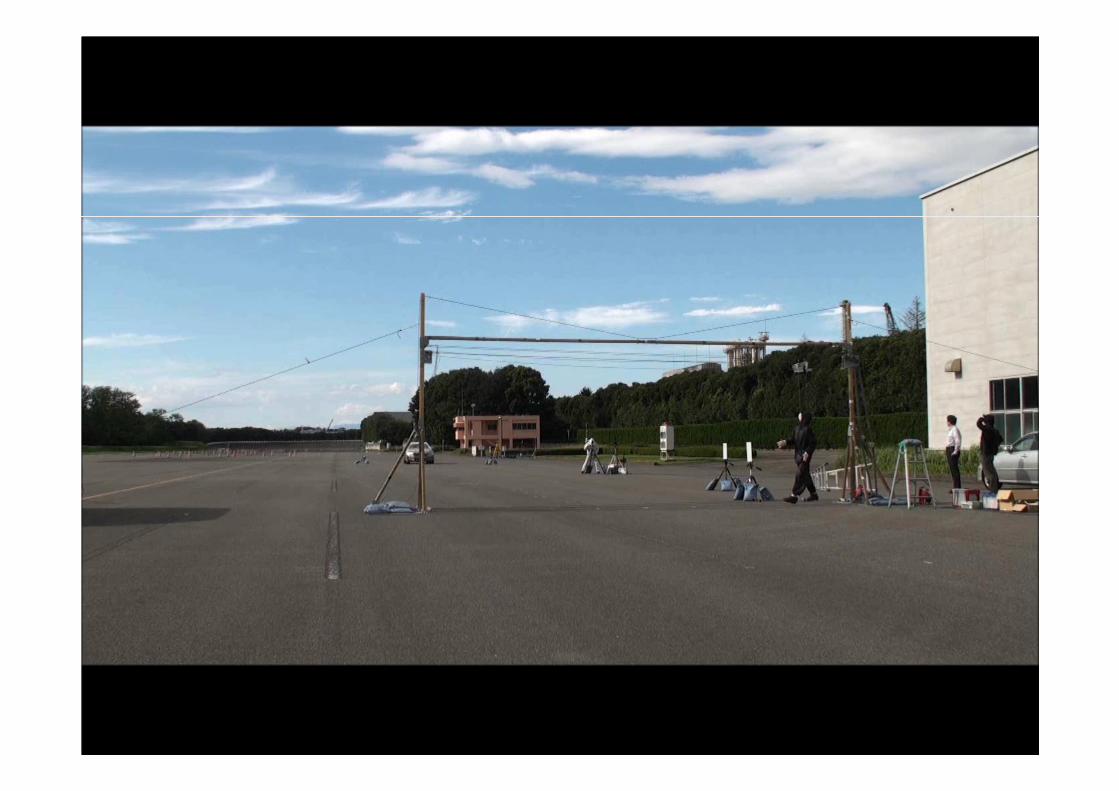
Experiments for AEB Performance
Collision
case
Avoidancecase
Sensor
Frame material: FRP( Fiber Reinforced Plastics)
35
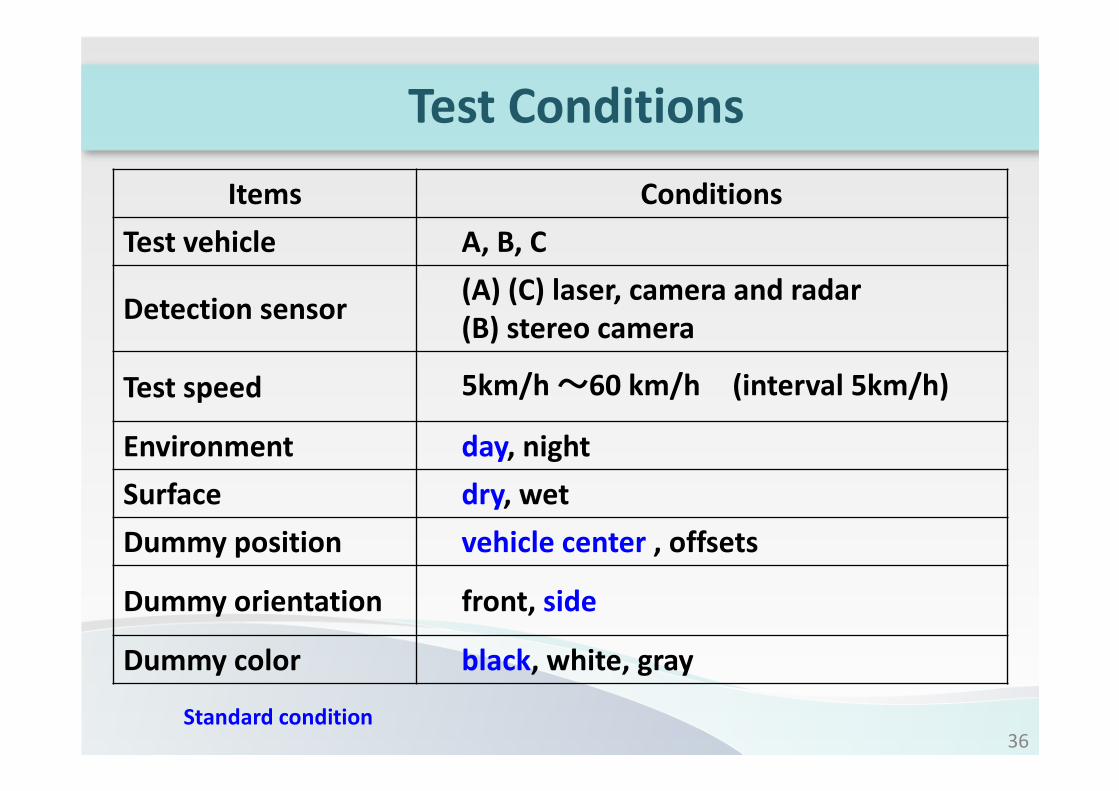
Test Conditions
Items Conditions
Test vehicle A, B, C
Detection sensor(A) (C) laser, camera and radar
(B) stereo camera
Test speed 5km/h 〜60 km/h (interval 5km/h)
Environment day, night
Surface dry, wet
Dummy position vehicle center , offsets
Dummy orientation front, side
Dummy color black, white, gray
Standard condition36
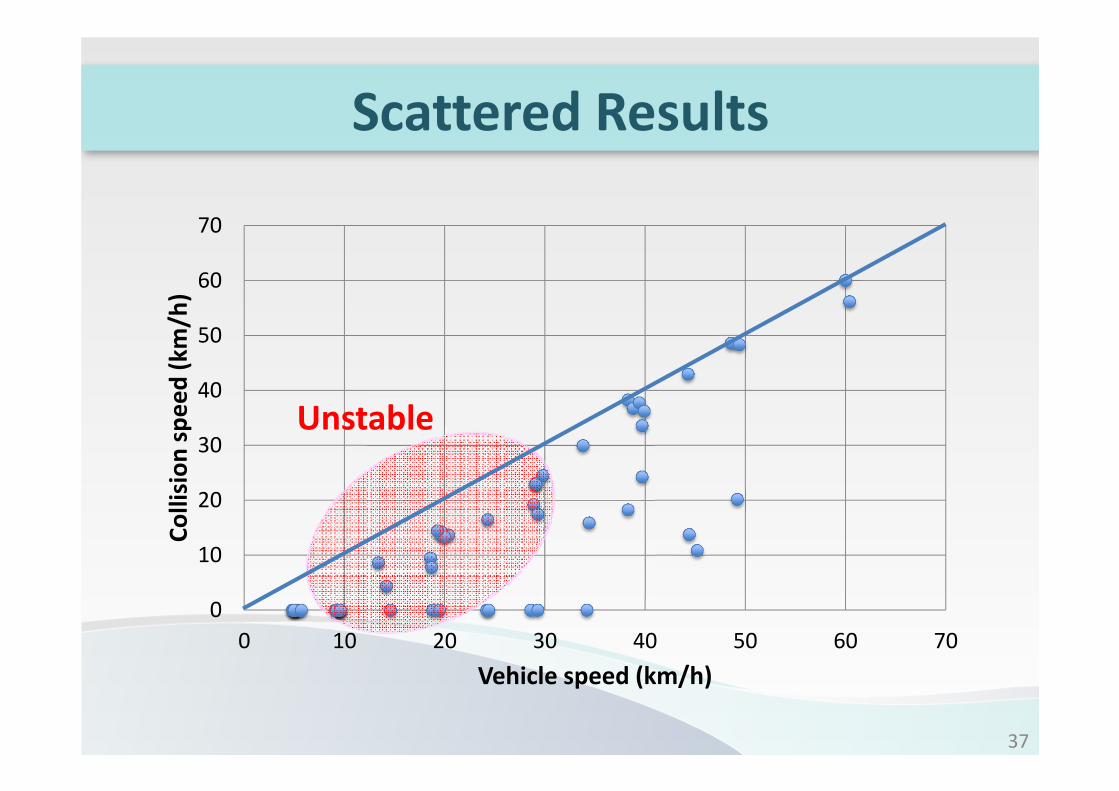
Scattered Results
0
10
20
30
40
50
60
70
0 10 20 30 40 50 60 70
Co
llis
ion
sp
ee
d (
km
/h)
Vehicle speed (km/h)
Unstable
37
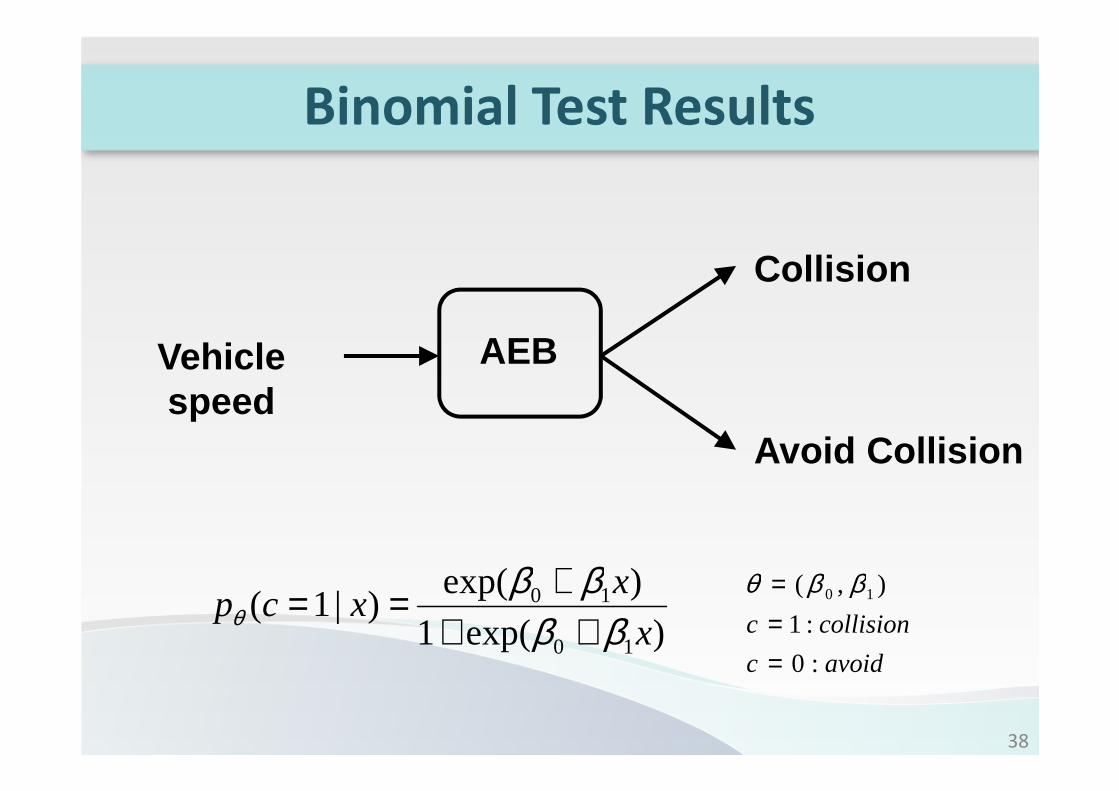
38
Collision
Avoid Collision
AEBVehicle speed
Binomial Test Results
)exp(1
)exp()|1(
10
10
x
xxcp
ββββ
θ +++==
avoidc
collisionc
:0
:1
),( 10
=== ββθ
39
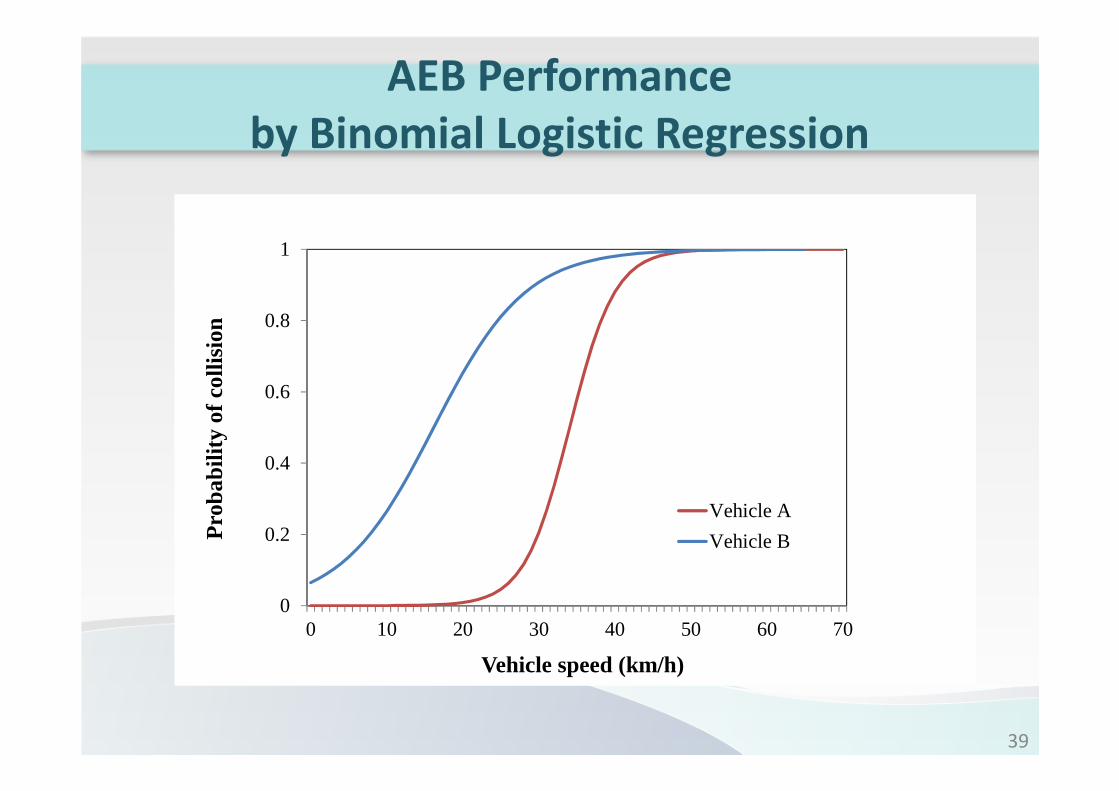
AEB Performance
by Binomial Logistic Regression
0
0.2
0.4
0.6
0.8
1
0 10 20 30 40 50 60 70
Pro
babi
lity
of c
ollis
ion
Vehicle speed (km/h)
Vehicle A
Vehicle B
40
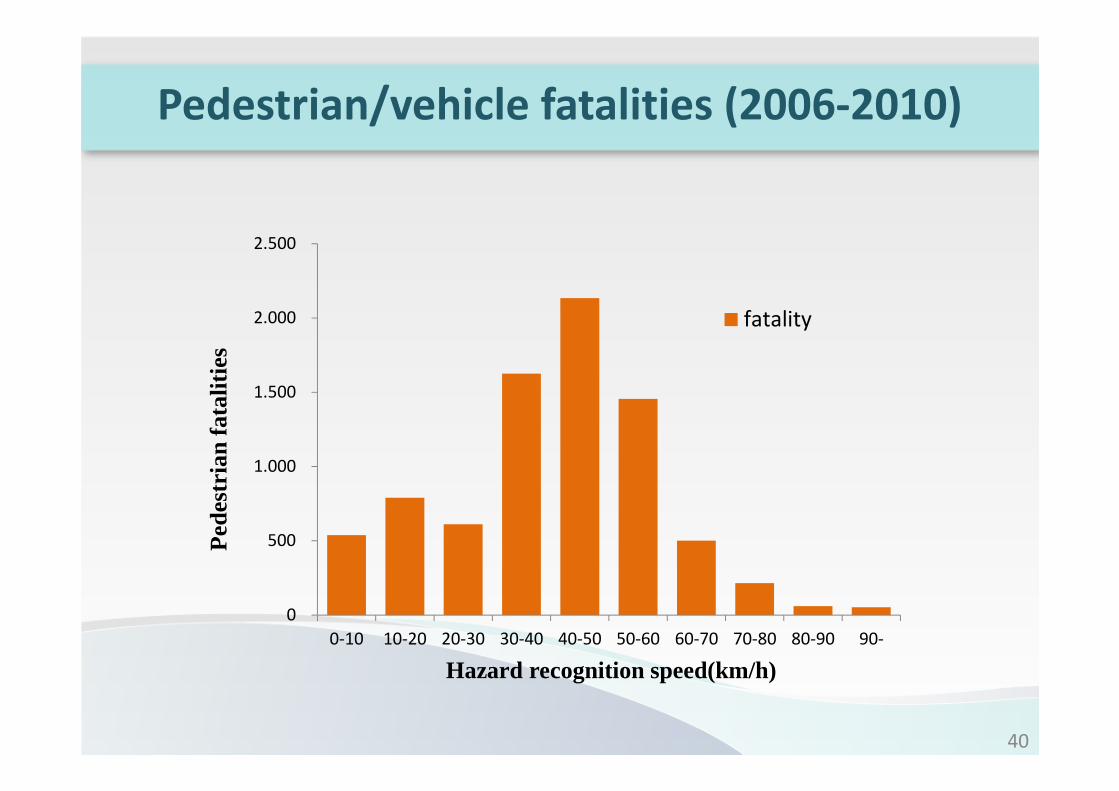
Pedestrian/vehicle fatalities (2006-2010)
0
500
1.000
1.500
2.000
2.500
0-10 10-20 20-30 30-40 40-50 50-60 60-70 70-80 80-90 90-
Ped
estr
ian
fata
litie
s
Hazard recognition speed(km/h)
fatality
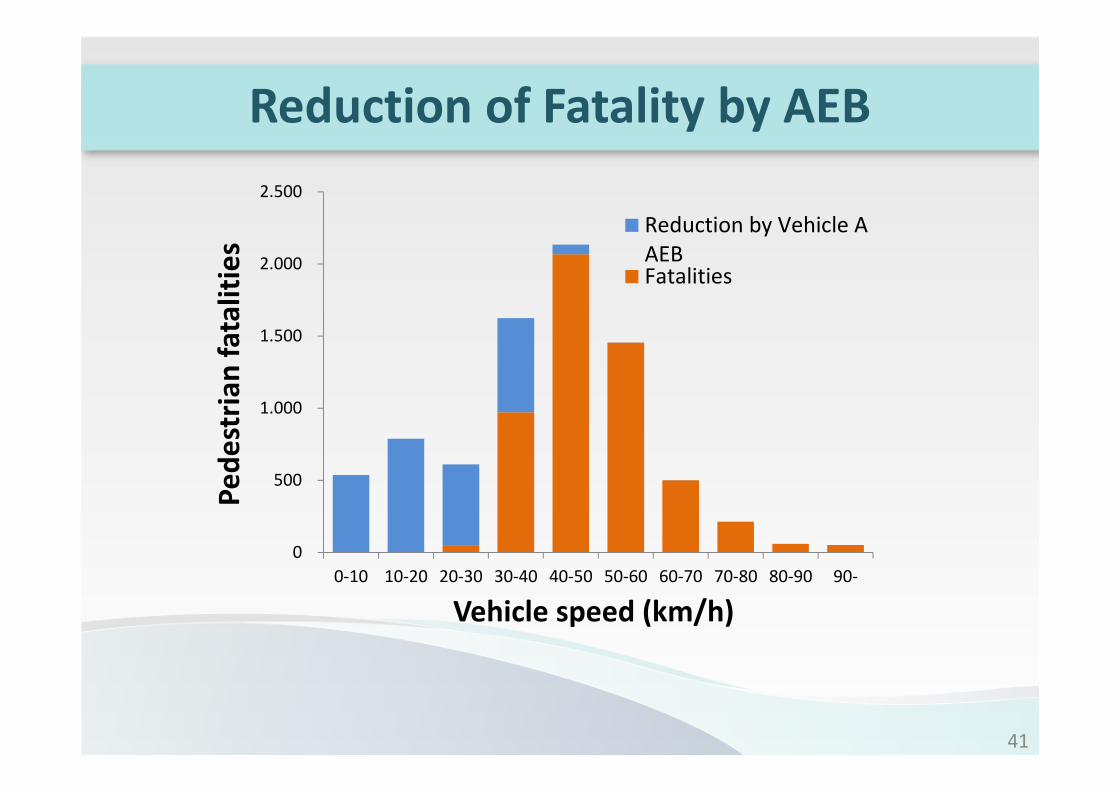
Reduction of Fatality by AEB
0
500
1.000
1.500
2.000
2.500
0-10 10-20 20-30 30-40 40-50 50-60 60-70 70-80 80-90 90-
Pe
de
stri
an
fa
tali
tie
s
Vehicle speed (km/h)
Reduction by Vehicle A
AEBFatalities
41
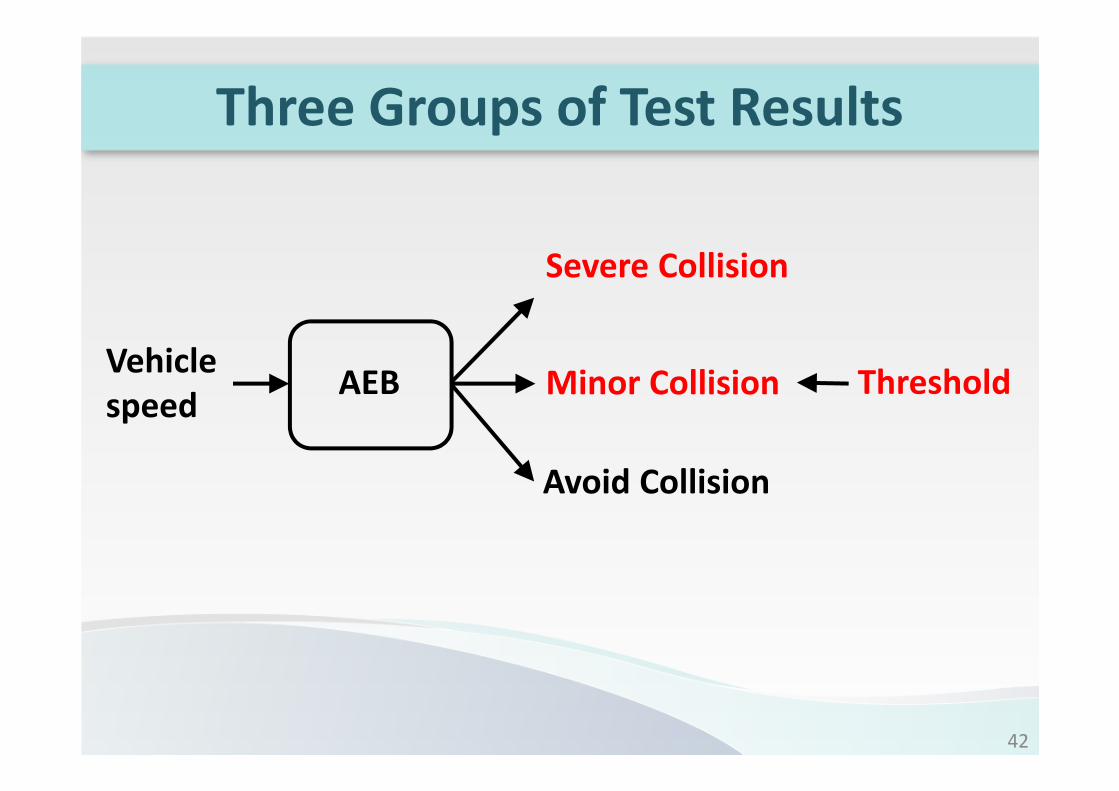
Three Groups of Test Results
Severe Collision
Minor Collision Threshold
Avoid Collision
AEBVehicle
speed
42
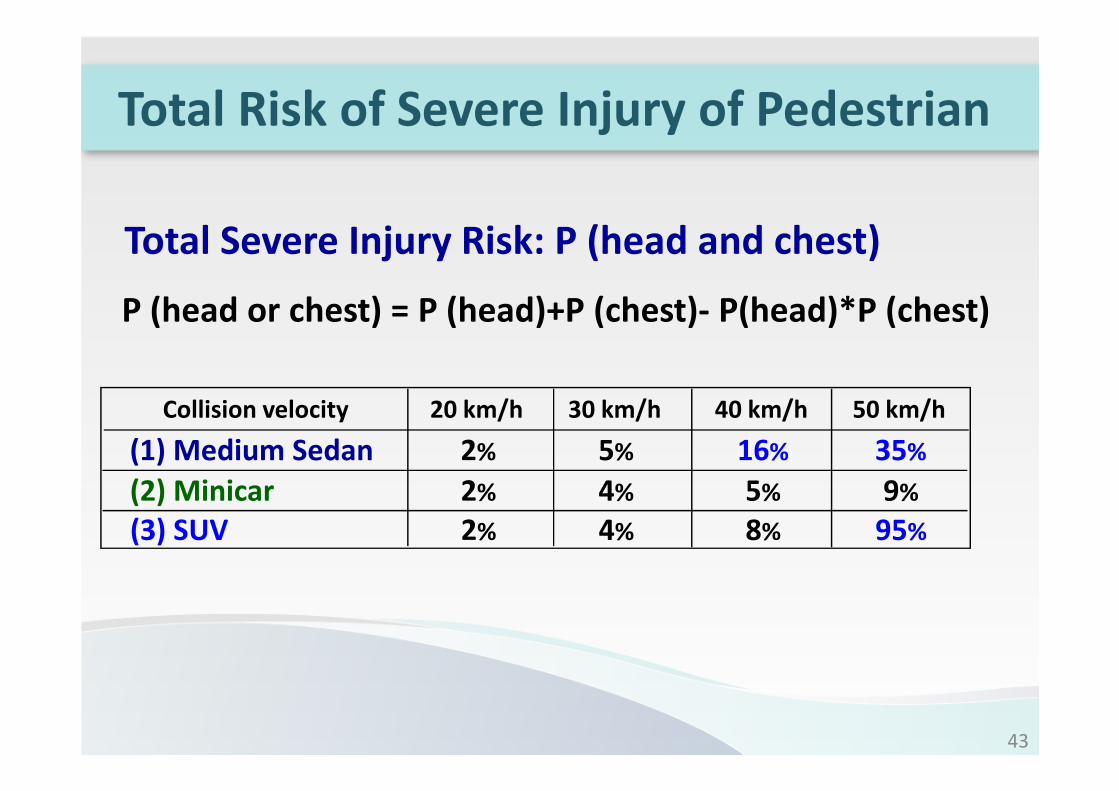
Total Risk of Severe Injury of Pedestrian
Total Severe Injury Risk: P (head and chest)
P (head or chest) = P (head)+P (chest)- P(head)*P (chest)
Collision velocity 20 km/h 30 km/h 40 km/h 50 km/h
(1) Medium Sedan 2% 5% 16% 35%
(2) Minicar 2% 4% 5% 9%
(3) SUV 2% 4% 8% 95%
43
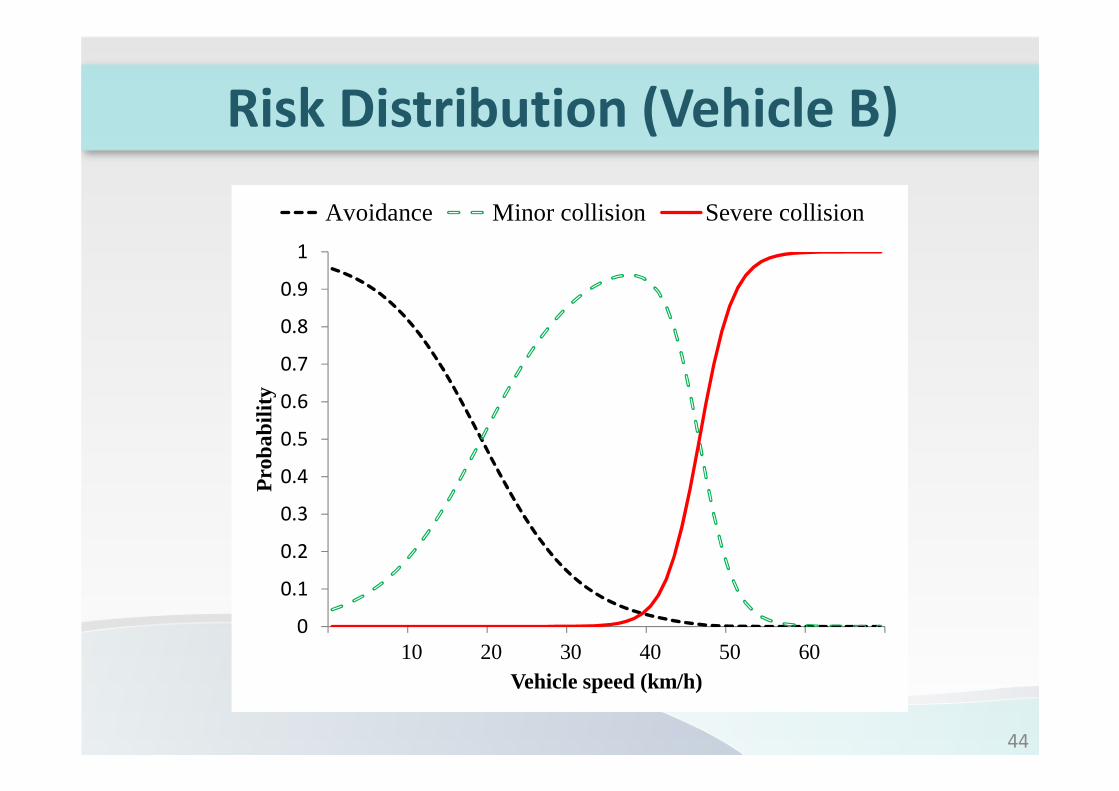
Risk Distribution (Vehicle B)
0
0.1
0.2
0.3
0.4
0.5
0.6
0.7
0.8
0.9
1
10 20 30 40 50 60
Pro
babi
lity
Vehicle speed (km/h)
Avoidance Minor collision Severe collision
44
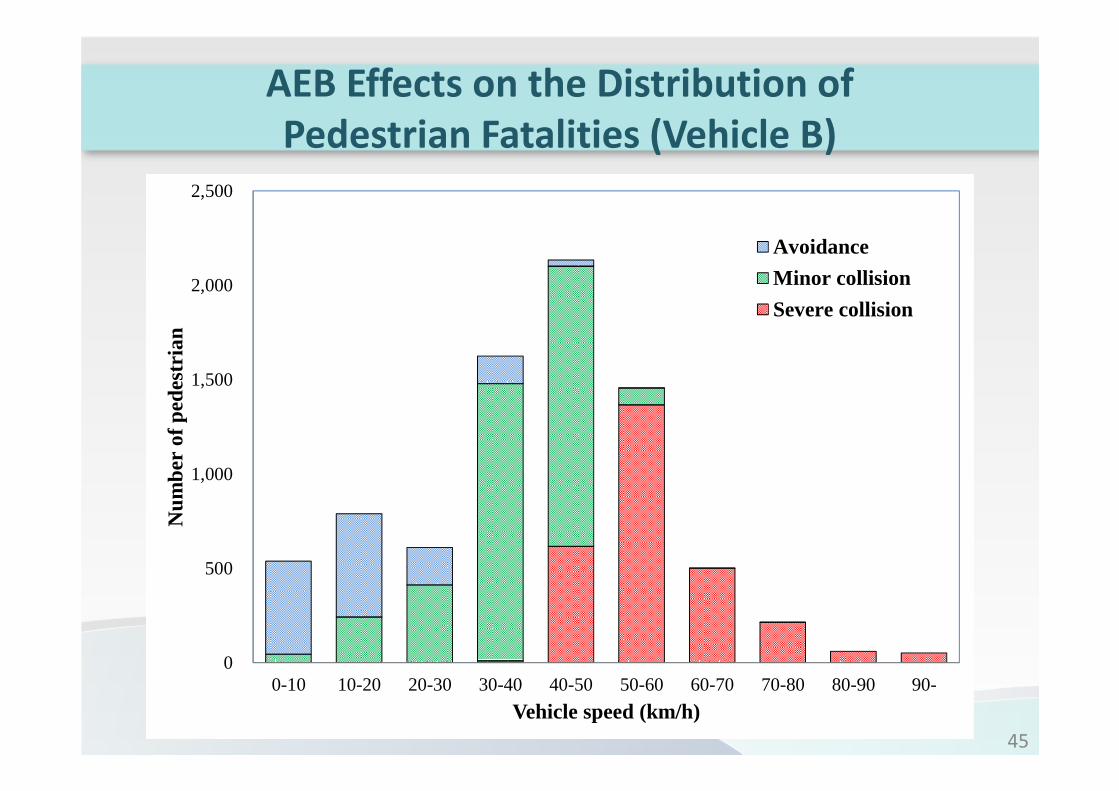
AEB Effects on the Distribution of
Pedestrian Fatalities (Vehicle B)
0
500
1,000
1,500
2,000
2,500
0-10 10-20 20-30 30-40 40-50 50-60 60-70 70-80 80-90 90-
Num
ber
of p
edes
tria
n
Vehicle speed (km/h)
Avoidance
Minor collision
Severe collision
45
46

47
Thank you
48
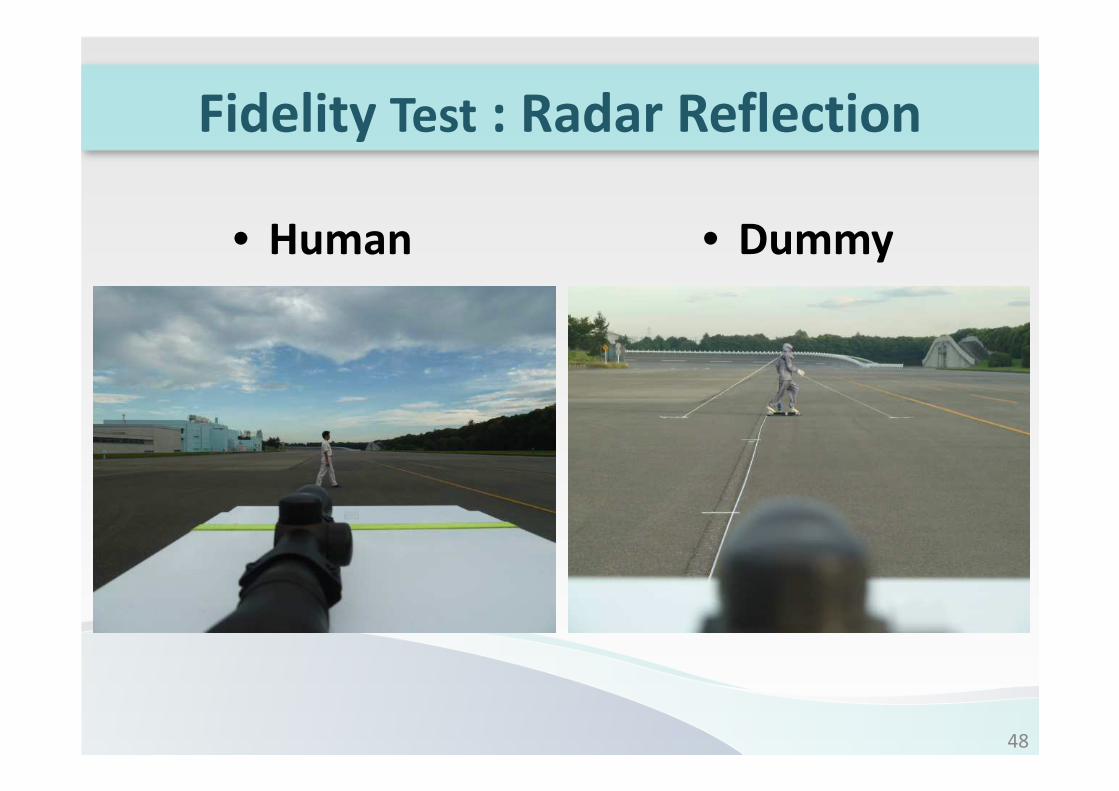
Fidelity Test : Radar Reflection
• Human • Dummy
49
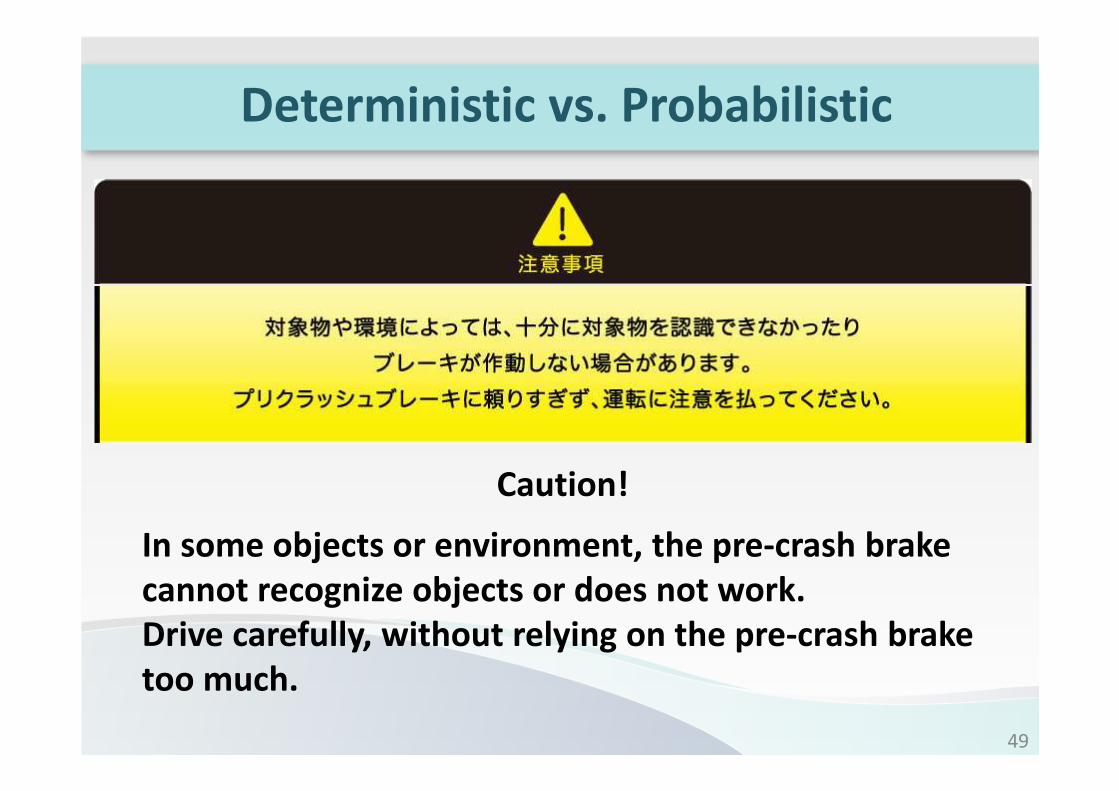
Deterministic vs. Probabilistic
Caution!
In some objects or environment, the pre-crash brake
cannot recognize objects or does not work.
Drive carefully, without relying on the pre-crash brake
too much.