Embed Size (px)
Citation preview
KNORR 199 4 Cruise Report Page 1
Cruise Report for Knorr 199 4 (October 15 November 4, 2010)
The U.S. GEOTRACES Atlantic Shipboard Team1
January 18, 2011
Prelude:
This cruise constitutes the first survey section as part of the U.S. participation in an internationalprogram named GEOTRACES. The first challenge in organizing the cruise was the fact that requests fromparticipating groups were made for a total of 46 scientific berths on a ship that could house only 32.During the pre cruise planning meeting at Old Dominion University (ODU) in March, 2010, discussionfocused around how we would accomplish cruise objectives within this berthing limitation. A plan wasdeveloped that included a core group of �“shared super technicians�” whose responsibilities includedstaging for and sampling of the trace metal clean GO FLO carousel, helping with the pumping casts, anddeploying/retrieving and sampling the Niskin rosette. Sampling for properties such as stable isotopes,dissolved inorganic carbon, radiocarbon, etc. would be accomplished by designated cruise participantsin addition to their own programmatic responsibilities. It was also agreed that standard hydrographicanalyses (salinity, dissolved oxygen, and micromolar nutrients) would be carried out by the Ocean DataFacility (ODF) group, along with CTD data reduction and archiving, as well as primary data managementoperations. We felt that this latter function was extremely important for a GEOTRACES cruise from theviewpoint of metadata assembly and data submission requirements to BCO DMO and ultimately to theGEOTRACES data assembly center at BODC. At the ODU planning meeting, sampling protocols and askeleton cast plan were constructed, both of which were further refined in subsequent months as thescope and scale of sampling requirements became clearer.
Prior to the KNORR�’s departure from Woods Hole in late August, the Dynacon winch and A Frame forthe GEOTRACES trace metal clean carousel were mounted on the ship. In addition, the chemicalreagents required for the cruise were secured in the chemistry van on the 02 level. Some samplingequipment and supplies were also stored in the scientific hold. A leased freezer van was mounted on the02 level, and a bulwark was fabricated and installed on the forward side of the van to protect themachinery from salt spray and waves. The base for the NASA optical tower was installed on the flyingbridge. Finally, a large number of compressed gas cylinders (nearly 60) were mounted and secured onracks both on the 01 level and in the aft hangar. We are grateful to Eric Benway and the Port Office fortheir assistance in arranging these modifications.
Cruise Narrative and Preliminary Observations2:
1 The U.S. GEOTRACES Atlantic Shipboard Team:W. J. Jenkins, E.A. Boyle and G. A. Cutter (Co chief Scientists), A.Aguilar Islas, S. Becker, K. Bowman, K. Buck, G. Carrasco Rebaza, J. Chaves Cedeno, J. Fitzsimmons, C. Hayes, E.Gorman, M. Hatta, J. Jacquot, R. Laird, C. Lamborg, C. Measures, P. Morris, P. Morton, A. Noble, D. Ohnemus, S.Owens, K. Pahnke, R. Palomares III, S. Rauschenberg, M. Johnson, R. Shelley, G. Smith, B. Sohst, O. Wurl, L. Zimmer,A. Zafereo, Kuanbo Zhou
2 Please note that the results presented here are both preliminary and proprietary to the individual investigators.
KNORR 199 4 Cruise Report Page 2
Cruise mobilization commenced on October 11 in the port of Lisbon. On the first day, six laboratory vanswere loaded onto the ship, 4 on the main deck and 2 on the 01 level. Space on the ship was at apremium. A major challenge for managing deck space was the large number (48) of pallet boxesrequired for gear and sample storage. This challenge was met in part by compromising on the number ofpallet boxes actually stored on board: 4 were shipped back to WHOI while the remainder was deployedon the 02 and 01 levels as well as the main deck. We are grateful to the ship�’s crew (and in particular thechief mate) for their patience, assistance, and advice during this trying process. Additional space wasgained by having equipment crates and unused equipment and boxes shipped back to Woods Hole inshipping containers. In addition, 5 NEMO floats were placed on deck for deployment during the cruise.
Over the course of 4 days, a team of scientists consisting of the actual cruise participants along with 5other scientists and Eric Benway worked hard loading gear on board, securing equipment, setting up thelaboratory vans (including connecting electric, water, and compressed air supplies), and assembling thetrace metal clean areas (bubbles) using plastic sheeting and HEPA filters. Liquid nitrogen tanks weretopped up. Gas tank regulators were installed and tubing connected to equipment. The CTD rosetteswere assembled and connected to the conducting wires, and various sampling and sample processingsystems were set up. Because the very first station was just a few hours steaming from the dock, weheld our first cruise science meeting on the dock the afternoon before departure.
There was a last minute personnel change. Given the number of individuals involved in the cruise, therewas finite probability that illness might prevent someone from sailing. As a backup plan, a member ofthe pumping group (Kuanbo Zhou) was �“sailing standby�” in that he had flown to Lisbon in case thishappened. It was fortunate that he did because although the observer did show up, a member of theODF group fell ill with influenza and could not sail with us (the captain was concerned about contagion).This meant that the pumping group benefited from having the additional participant, but the ODF groupsuffered from sailing short handed. Despite this disadvantage, the ODF group performed admirably well,for which we are grateful.
The first station occurred within a few hours after departing Lisbon, and was a designated super station,so that we had our hands full right off the bat. Prior to reaching station, the GEOTRACES carousel (GTC)was lowered to about 50 m depth in �“blue water�” for rinsing. When we reached the station additionaltest casts were deployed, alternating between the GTC and the ODF rosette (the 12 bottle 30 liter Niskinrosette) to insure mechanical integrity and to clean the bottles. A set of test samples were taken for theGTC which included both the main set of GO FLO bottles and the backup (�“B Team�”) set. These sampleswere measured on board for Zn to diagnose for contamination. Some problems were identified andresolved. Additional �“soak time�” was used as a cleaning strategy for all the �“A team�” GO FLO bottles.
KNORR 199 4 Cruise Report Page 3
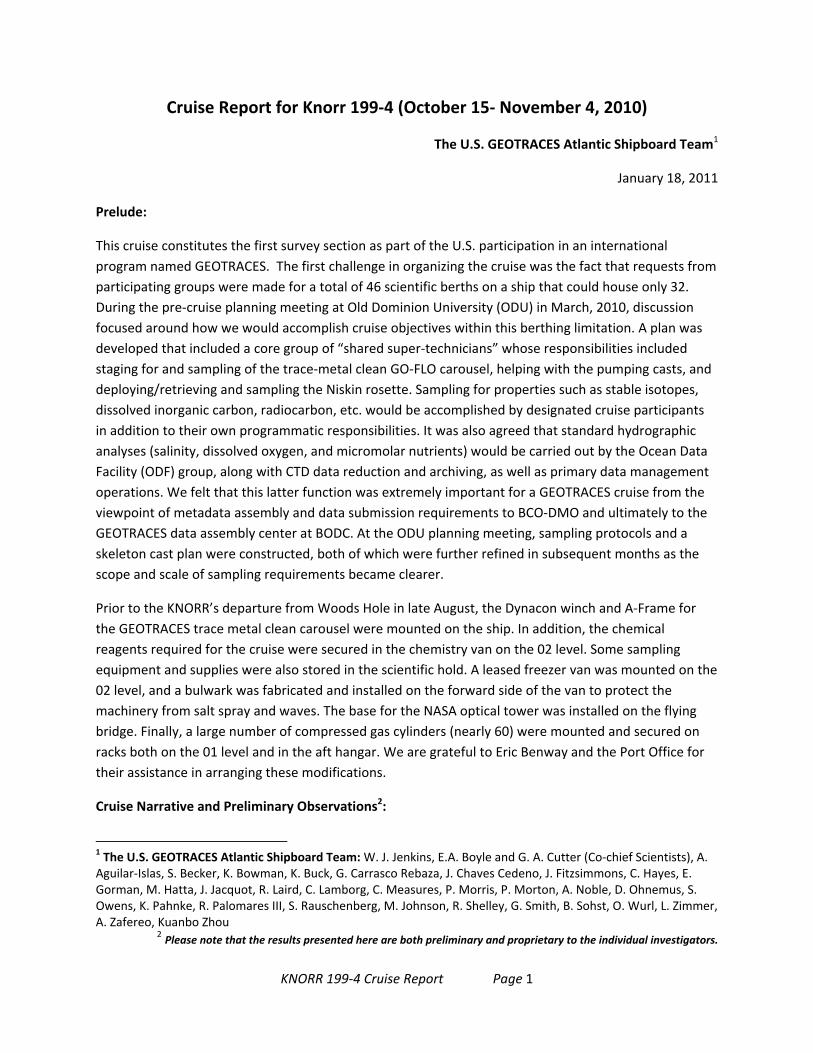
One of the key objectives for the first station was to sample the pronounced intermediate depth salinitymaximum associated with the Mediterranean Outflow Waters (MOW) that are known to be flowingnorthward along the Iberian Peninsula at about the 1000 m isobath. The MOW at this station wasmanifested in a broad salinity maximum between 500 and 2000 m depths. This is exemplified in the leftpanel of Figure 1, which is a cumulative T S plot for all of the Niskin CTD casts for the cruise. The multipleintermediate depth salinity maxima (at least 4 significant extrema) may be attributed to tidalfluctuations in mixing along the eastern boundary slope. The maximum salinity observed over this depthrange exceeded 36.5, indicating a remarkably strong presence of MOW at this site. Indeed, the broadrange of depths showing excess salinity suggested an opportunity to sample the trace metal content ofa particularly important end member. Preliminary ship board results obtained by the Measures Hatta(U.H.) group show the expected high Al values (approaching 50 nmol l 1) associated with the core of theMOW (see right panel in Figure 1).
In addition to performing what we refer to as �“full station�” sampling, which consists of 2 GTC and 3Niskin CTD casts, we did 3 extra Niskin casts for �“super station�” sampling. This was aimed at obtainingextra water for properties not normally sampled on the full and demi stations. For each full or superstation, we also performed two pumping casts (one shallow and one deep) where McLane pumps wereclamped on Vectran wire as a serial cast. On the deep pumping casts, 30 liter Niskin bottles wereclamped above each pump and were tripped at the middle of the 4 hour pumping interval. As a standardprotocol, we sampled each GO FLO and each Niskin bottle (including the pump cast Niskins) for salinityand nutrients as a diagnostic of bottle integrity (whether the bottle leaked, or pre /post tripped). Inaddition, the Niskin bottles were sampled for dissolved oxygen, again as a bottle integrity check, and
Figure 1: Left: a composite T-S plot of all Niskin CTD casts during the GEOTRACES cruise. Superimposed on the traces is the potential density anomaly in kg m-3 referenced to 1000 dbars, and right: A composite T vs. Al plot of the Measures & Hatta preliminary shipboard data for all stations. Note the intermediate depth Al maximum for the first two stations associated with MOW.
KNORR 199 4 Cruise Report Page 4
also for calibration checks on the CTD oxygen sensor. In addition, the Niskin rosette was equipped with anephelometer and an altimeter to enable close bottom approaches. This allowed us to sample full depthprofiles to within 10 15 m of the bottom.
There was one alarming incident during station 1. An over heated resistance coil in an apparatus burstinto flame in the analytical lab. It was quickly extinguished, but not before the lab was filled with acridsmoke and a general fire alarm was triggered on the ship. This served as an object lesson in the dangersof fire at sea, while the ship�’s crew demonstrated efficiency and cool heads while dealing with theemergency. Although the fire itself caused little damage (aside from the need to clean up after the fireextinguisher), the subsequent power shut down to the lab had a significant consequence: on repowering the ODF data server computer died. We managed, thanks to hard work and creativeprogramming by Mary Johnson, our ODF data manager, to set up the data server and web site on herlaptop.
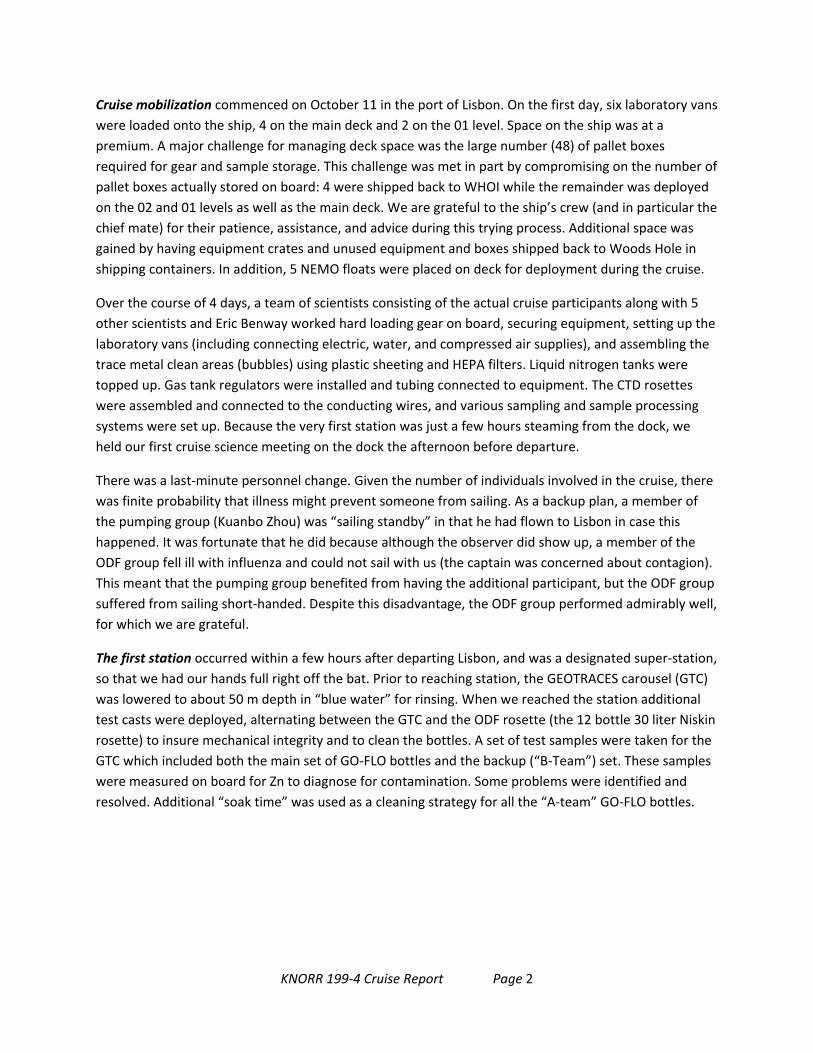
After spending more than two days testing and sampling at this first site, we continued our southwestward transect with alternating �“demi�” and full stations (see Figure 2). A demi station typicallyinvolved single shallow GTC and Niskin cast (the one exception to this was station 4, where we onlycompleted a Niskin cast so that the GTC sampling team could catch up). The T S diagram in Figure 1 alsoshows the progressive attenuation of the MOW salinity maximum as we moved away from theEuropean coast, as would be expected from our knowledge of the large scale distribution of salinity atmid depths in the North Atlantic.
Station 5 found us at thebeginning of our 22°Wmeridional section, wherewe turned due southward,alternating full and demistations. Station 7, a fullstation, coincided with therecently sampled GermanGEOTRACES occupation(Meteor Cruise M81/1,GEOTRACES section A11 byMartin Frank and others).We attempted to replicatemost of the depths sampledduring the German cruise to allow maximum opportunity for inter comparison. Unfortunately, stringentlimitations in water availability (heavy subscription by participating U.S. analysts) prevented us takingany �“library samples�” for distribution to non U.S. laboratories. Following this station we continued on toStation 8, a demi station.
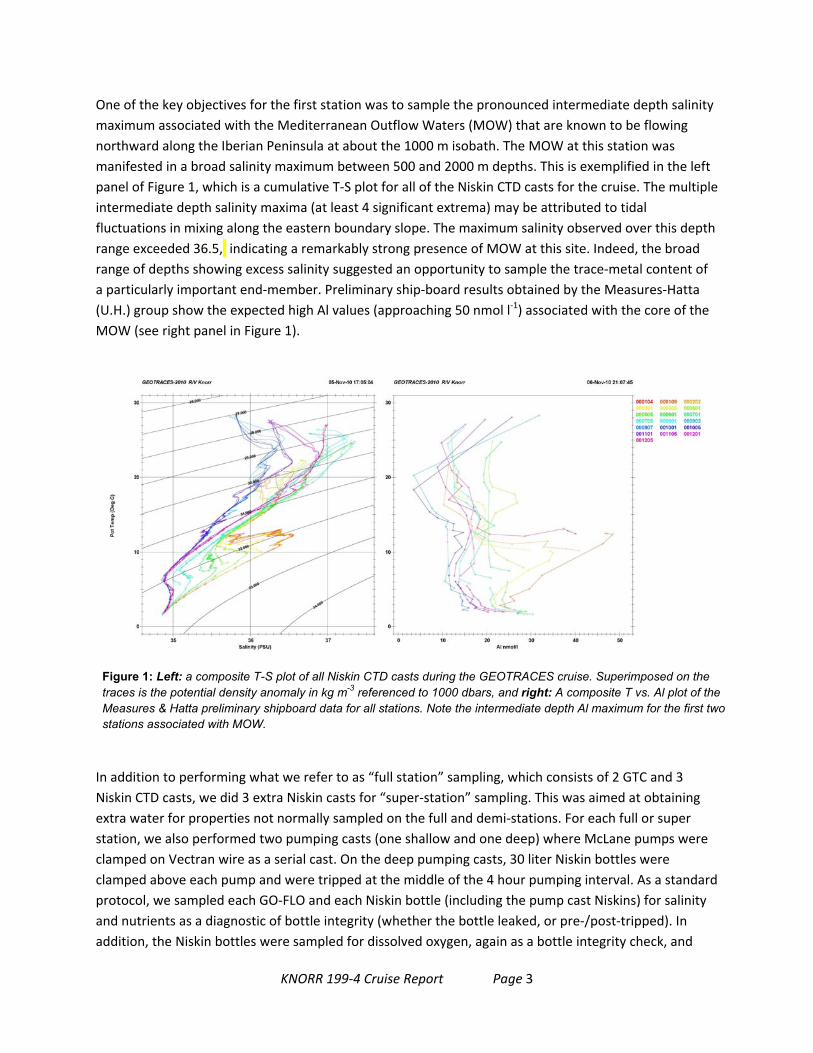
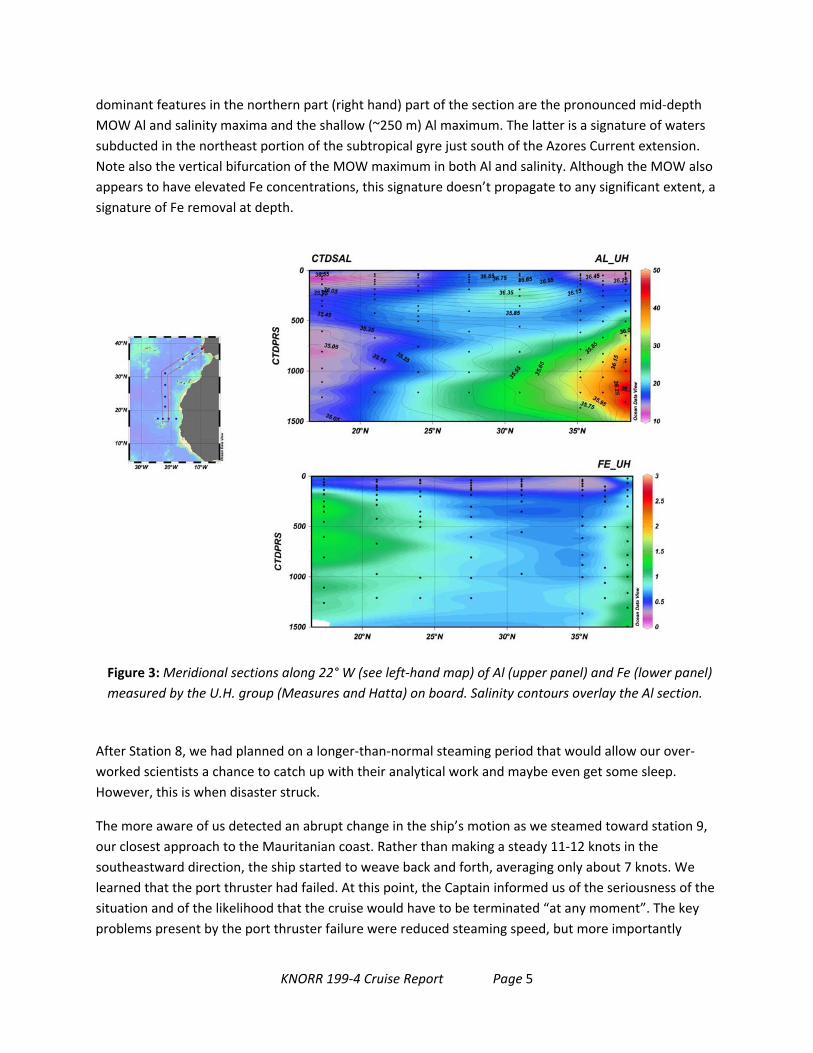
Figure 3 shows a meridional section of shipboard measurements dissolved Al and Fe by the U. Hawaiigroup (Measures and Hatta). The Al section (upper panel) has salinity contours overlaid. The two
Figure 2: Our planned (numbered symbols) and actual (red line) cruise track.
KNORR 199 4 Cruise Report Page 5
dominant features in the northern part (right hand) part of the section are the pronounced mid depthMOW Al and salinity maxima and the shallow (~250 m) Al maximum. The latter is a signature of waterssubducted in the northeast portion of the subtropical gyre just south of the Azores Current extension.Note also the vertical bifurcation of the MOWmaximum in both Al and salinity. Although the MOW alsoappears to have elevated Fe concentrations, this signature doesn�’t propagate to any significant extent, asignature of Fe removal at depth.
After Station 8, we had planned on a longer than normal steaming period that would allow our overworked scientists a chance to catch up with their analytical work and maybe even get some sleep.However, this is when disaster struck.
The more aware of us detected an abrupt change in the ship�’s motion as we steamed toward station 9,our closest approach to the Mauritanian coast. Rather than making a steady 11 12 knots in thesoutheastward direction, the ship started to weave back and forth, averaging only about 7 knots. Welearned that the port thruster had failed. At this point, the Captain informed us of the seriousness of thesituation and of the likelihood that the cruise would have to be terminated �“at any moment�”. The keyproblems present by the port thruster failure were reduced steaming speed, but more importantly
Figure 3:Meridional sections along 22° W (see left hand map) of Al (upper panel) and Fe (lower panel)measured by the U.H. group (Measures and Hatta) on board. Salinity contours overlay the Al section.
KNORR 199 4 Cruise Report Page 6
compromised station keeping ability. How well the ship could maintain position and minimize wire anglein any significant seas was in question. At this point we were faced with a critical decision: with thedistinct possibility of the cruise being aborted at any time, what steps could we take that wouldmaximize the amount of science accomplished? After some discussion, we decided to abort the easternmost station (situated in 500 m of water off Mauritania) to steam to the closer superstation. Althoughthis would compromise the objectives of some groups (in particular the radium people), we felt that ifwe could just get the superstation done, we would have accomplished a major objective and providedsamples for the broadest community of scientists. This, combined with the reduced steaming requiredgoing to the nearer station, seemed to be the best choice at the time.
It turned out that the weather gods were on our side, and the captain and crew became quite adept atmanaging the less than agile propulsion system. Consequently after a positive experience at the firststation in the section, we were given the green light to try for another. Things worked so well that thecaptain agreed to a limited, but in our eyes very important objective of finishing the MauritaniaTENATSO section prior to pulling into port in the Cape Verde Islands. This raised our spirits immensely,and we are grateful to the captain and crew for going out on a limb for us.
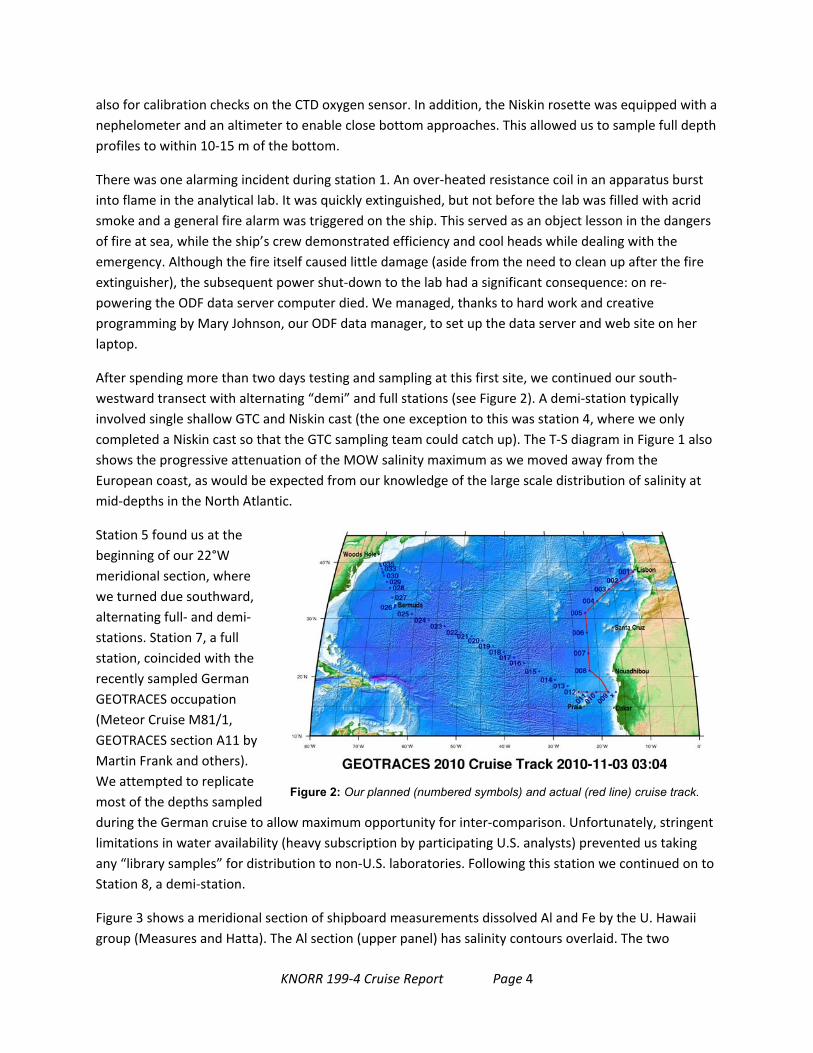
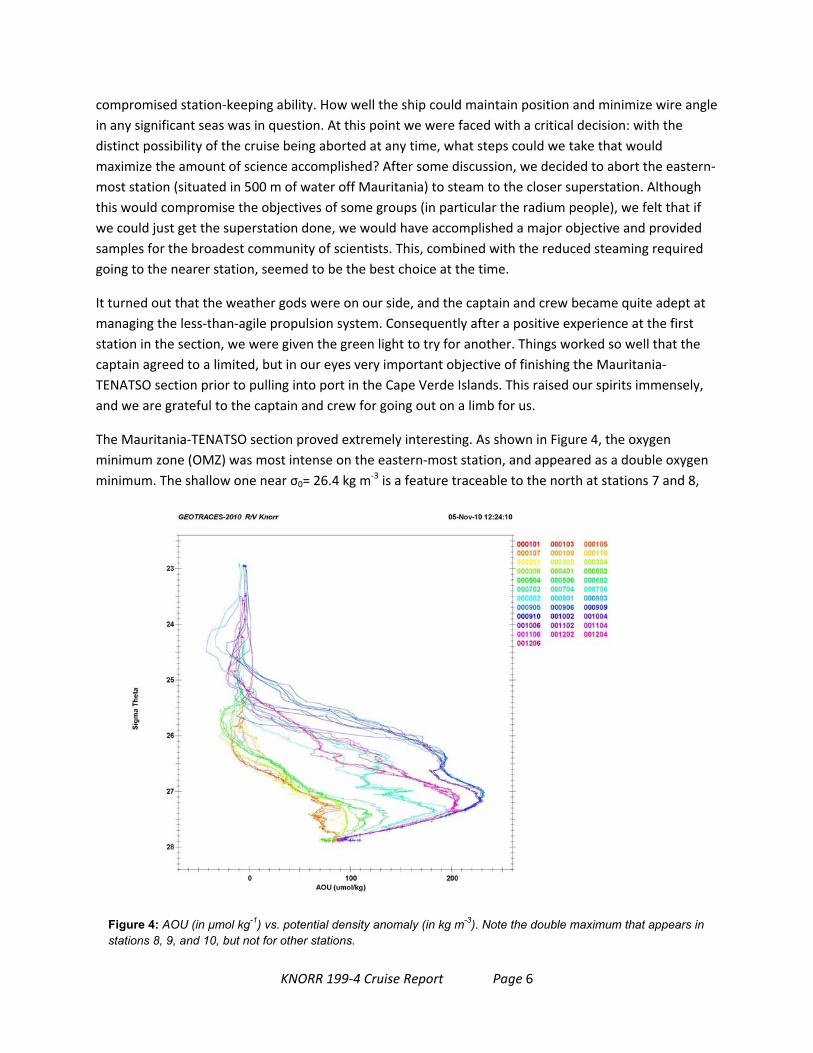
The Mauritania TENATSO section proved extremely interesting. As shown in Figure 4, the oxygenminimum zone (OMZ) was most intense on the eastern most station, and appeared as a double oxygenminimum. The shallow one near 0= 26.4 kg m 3 is a feature traceable to the north at stations 7 and 8,
Figure 4: AOU (in µmol kg-1) vs. potential density anomaly (in kg m-3). Note the double maximum that appears in stations 8, 9, and 10, but not for other stations.
KNORR 199 4 Cruise Report Page 7
but not directly to the west in stations 10 12 suggestive of a northward flowing eastern boundarycurrent at these depths. The shipboard Al, Fe, and Mn analyses made by Measures and Hatta (see Figure3 again) reveal an interesting feature: the oxygen minimum is characterized by high Fe, low Al at thesouthernmost station, but with no significant Mn signature (not shown). This is a signature of the highproductivity waters associated with the upwelling zone: the Fe is remineralized (and hence associatedwith high AOU/low oxygen) while the low Al suggests dilution of its aeolian signature by highproduction. The low Mn indicates very little contribution to the oxygen minimum from sedimentaryremobilization.
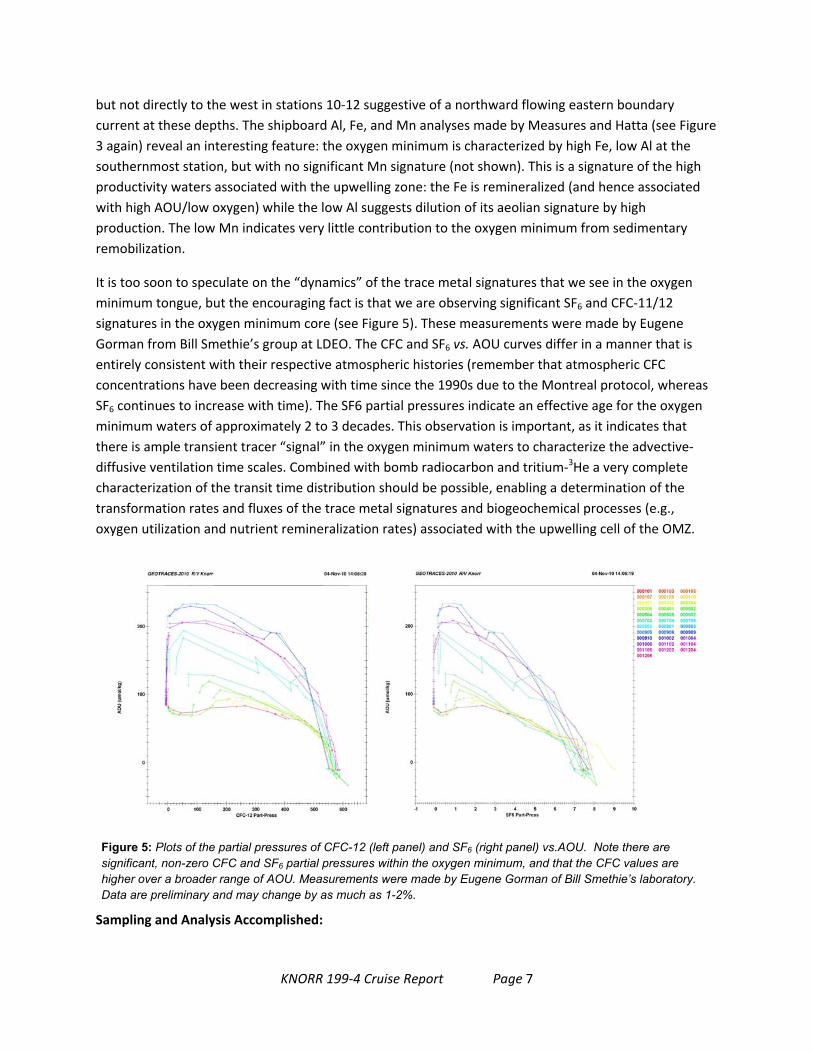
It is too soon to speculate on the �“dynamics�” of the trace metal signatures that we see in the oxygenminimum tongue, but the encouraging fact is that we are observing significant SF6 and CFC 11/12signatures in the oxygen minimum core (see Figure 5). These measurements were made by EugeneGorman from Bill Smethie�’s group at LDEO. The CFC and SF6 vs. AOU curves differ in a manner that isentirely consistent with their respective atmospheric histories (remember that atmospheric CFCconcentrations have been decreasing with time since the 1990s due to the Montreal protocol, whereasSF6 continues to increase with time). The SF6 partial pressures indicate an effective age for the oxygenminimum waters of approximately 2 to 3 decades. This observation is important, as it indicates thatthere is ample transient tracer �“signal�” in the oxygen minimum waters to characterize the advectivediffusive ventilation time scales. Combined with bomb radiocarbon and tritium 3He a very completecharacterization of the transit time distribution should be possible, enabling a determination of thetransformation rates and fluxes of the trace metal signatures and biogeochemical processes (e.g.,oxygen utilization and nutrient remineralization rates) associated with the upwelling cell of the OMZ.
Sampling and Analysis Accomplished:
Figure 5: Plots of the partial pressures of CFC-12 (left panel) and SF6 (right panel) vs.AOU. Note there are significant, non-zero CFC and SF6 partial pressures within the oxygen minimum, and that the CFC values are higher over a broader range of AOU. Measurements were made by Eugene Gorman of Bill Smethie’s laboratory. Data are preliminary and may change by as much as 1-2%.
KNORR 199 4 Cruise Report Page 8
Not counting test casts for mechanical evaluation and rinsing of bottles, a total of 19 casts were madewith the GEOTRACES carousel, and 34 ODF Niskin rosette casts were completed. For the former system,456 salinity and nutrient measurements were made for evaluation of bottle integrity, calibration checkon the CTD, and generation of property profiles. For the latter casts, 408 oxygen, nutrient and salinitysamples were drawn and analyzed for similar reasons. In addition, approximately 60 nutrient, salinityand oxygen samples were drawn from the deep pump cast Niskin bottles. Having this data nearly realtime after the analyses were completed was a real boon to the chief scientist, as it provided rapidassessment of sampling quality and strategies.
Reports on sampling activities and individual groups participating in the cruise.
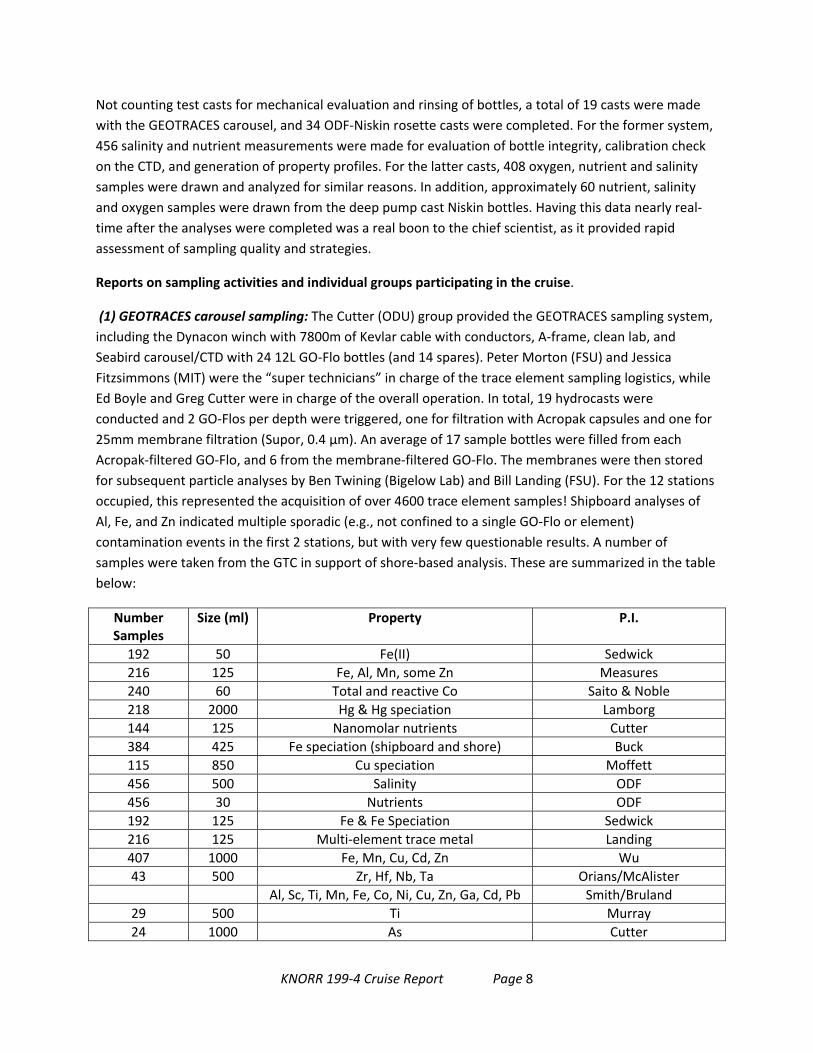
(1) GEOTRACES carousel sampling: The Cutter (ODU) group provided the GEOTRACES sampling system,including the Dynacon winch with 7800m of Kevlar cable with conductors, A frame, clean lab, andSeabird carousel/CTD with 24 12L GO Flo bottles (and 14 spares). Peter Morton (FSU) and JessicaFitzsimmons (MIT) were the �“super technicians�” in charge of the trace element sampling logistics, whileEd Boyle and Greg Cutter were in charge of the overall operation. In total, 19 hydrocasts wereconducted and 2 GO Flos per depth were triggered, one for filtration with Acropak capsules and one for25mmmembrane filtration (Supor, 0.4 m). An average of 17 sample bottles were filled from eachAcropak filtered GO Flo, and 6 from the membrane filtered GO Flo. The membranes were then storedfor subsequent particle analyses by Ben Twining (Bigelow Lab) and Bill Landing (FSU). For the 12 stationsoccupied, this represented the acquisition of over 4600 trace element samples! Shipboard analyses ofAl, Fe, and Zn indicated multiple sporadic (e.g., not confined to a single GO Flo or element)contamination events in the first 2 stations, but with very few questionable results. A number ofsamples were taken from the GTC in support of shore based analysis. These are summarized in the tablebelow:
NumberSamples
Size (ml) Property P.I.
192 50 Fe(II) Sedwick216 125 Fe, Al, Mn, some Zn Measures240 60 Total and reactive Co Saito & Noble218 2000 Hg & Hg speciation Lamborg144 125 Nanomolar nutrients Cutter384 425 Fe speciation (shipboard and shore) Buck115 850 Cu speciation Moffett456 500 Salinity ODF456 30 Nutrients ODF192 125 Fe & Fe Speciation Sedwick216 125 Multi element trace metal Landing407 1000 Fe, Mn, Cu, Cd, Zn Wu43 500 Zr, Hf, Nb, Ta Orians/McAlister
Al, Sc, Ti, Mn, Fe, Co, Ni, Cu, Zn, Ga, Cd, Pb Smith/Bruland29 500 Ti Murray24 1000 As Cutter
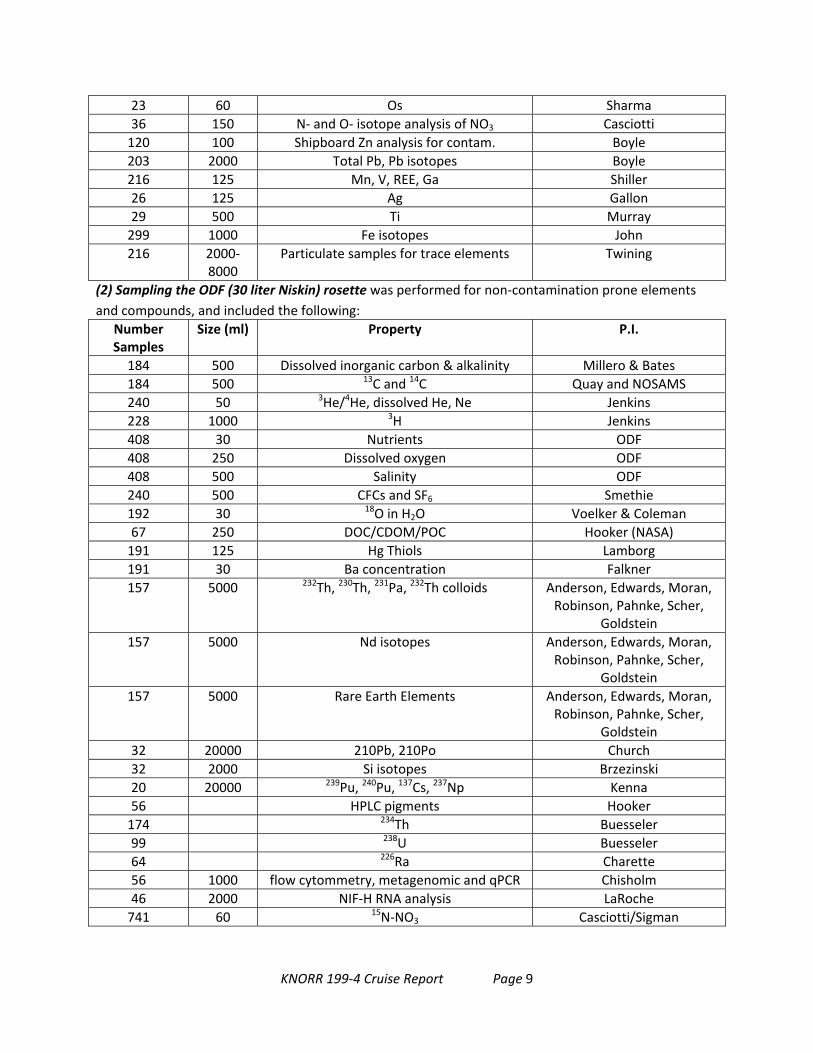
KNORR 199 4 Cruise Report Page 9
23 60 Os Sharma36 150 N and O isotope analysis of NO3 Casciotti120 100 Shipboard Zn analysis for contam. Boyle203 2000 Total Pb, Pb isotopes Boyle216 125 Mn, V, REE, Ga Shiller26 125 Ag Gallon29 500 Ti Murray299 1000 Fe isotopes John216 2000
8000Particulate samples for trace elements Twining
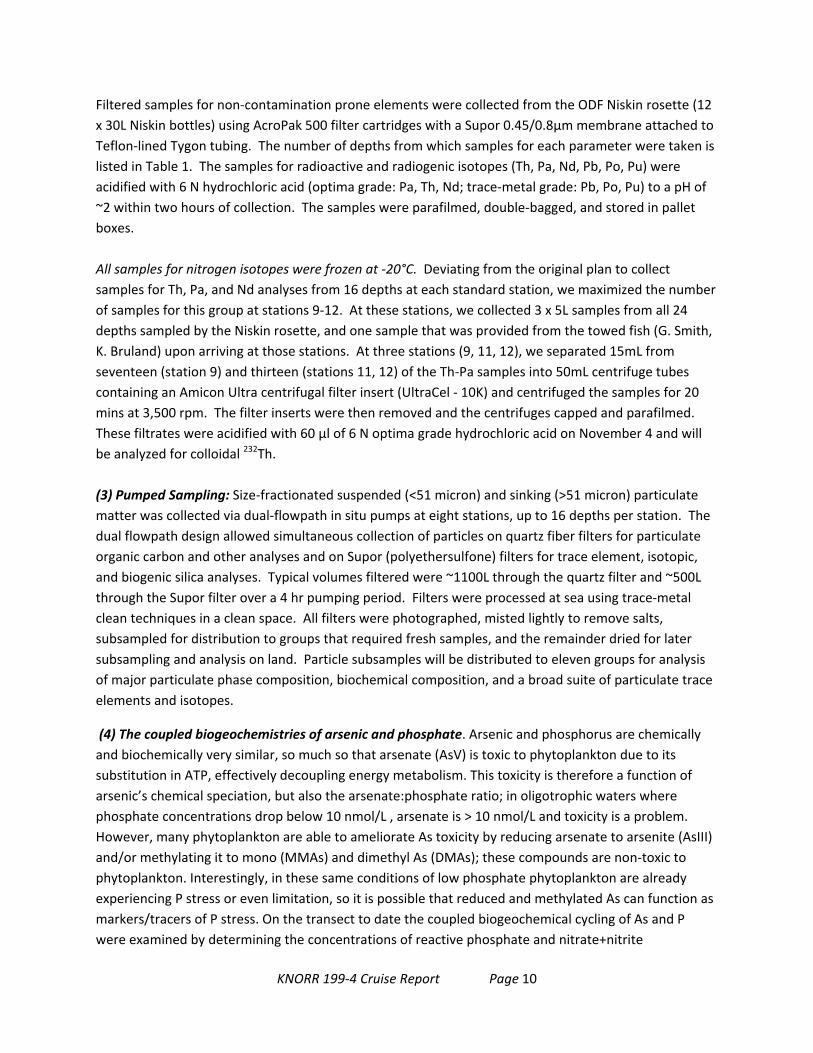
(2) Sampling the ODF (30 liter Niskin) rosette was performed for non contamination prone elementsand compounds, and included the following:
NumberSamples
Size (ml) Property P.I.
184 500 Dissolved inorganic carbon & alkalinity Millero & Bates184 500 13C and 14C Quay and NOSAMS240 50 3He/4He, dissolved He, Ne Jenkins228 1000 3H Jenkins408 30 Nutrients ODF408 250 Dissolved oxygen ODF408 500 Salinity ODF240 500 CFCs and SF6 Smethie192 30 18O in H2O Voelker & Coleman67 250 DOC/CDOM/POC Hooker (NASA)191 125 Hg Thiols Lamborg191 30 Ba concentration Falkner157 5000 232Th, 230Th, 231Pa, 232Th colloids Anderson, Edwards, Moran,
Robinson, Pahnke, Scher,Goldstein
157 5000 Nd isotopes Anderson, Edwards, Moran,Robinson, Pahnke, Scher,
Goldstein157 5000 Rare Earth Elements Anderson, Edwards, Moran,
Robinson, Pahnke, Scher,Goldstein
32 20000 210Pb, 210Po Church32 2000 Si isotopes Brzezinski20 20000 239Pu, 240Pu, 137Cs, 237Np Kenna56 HPLC pigments Hooker174 234Th Buesseler99 238U Buesseler64 226Ra Charette56 1000 flow cytommetry, metagenomic and qPCR Chisholm46 2000 NIF H RNA analysis LaRoche741 60 15N NO3 Casciotti/Sigman
KNORR 199 4 Cruise Report Page 10
Filtered samples for non contamination prone elements were collected from the ODF Niskin rosette (12x 30L Niskin bottles) using AcroPak 500 filter cartridges with a Supor 0.45/0.8 m membrane attached toTeflon lined Tygon tubing. The number of depths from which samples for each parameter were taken islisted in Table 1. The samples for radioactive and radiogenic isotopes (Th, Pa, Nd, Pb, Po, Pu) wereacidified with 6 N hydrochloric acid (optima grade: Pa, Th, Nd; trace metal grade: Pb, Po, Pu) to a pH of~2 within two hours of collection. The samples were parafilmed, double bagged, and stored in palletboxes.
All samples for nitrogen isotopes were frozen at 20°C. Deviating from the original plan to collectsamples for Th, Pa, and Nd analyses from 16 depths at each standard station, we maximized the numberof samples for this group at stations 9 12. At these stations, we collected 3 x 5L samples from all 24depths sampled by the Niskin rosette, and one sample that was provided from the towed fish (G. Smith,K. Bruland) upon arriving at those stations. At three stations (9, 11, 12), we separated 15mL fromseventeen (station 9) and thirteen (stations 11, 12) of the Th Pa samples into 50mL centrifuge tubescontaining an Amicon Ultra centrifugal filter insert (UltraCel 10K) and centrifuged the samples for 20mins at 3,500 rpm. The filter inserts were then removed and the centrifuges capped and parafilmed.These filtrates were acidified with 60 µl of 6 N optima grade hydrochloric acid on November 4 and willbe analyzed for colloidal 232Th.
(3) Pumped Sampling: Size fractionated suspended (<51 micron) and sinking (>51 micron) particulatematter was collected via dual flowpath in situ pumps at eight stations, up to 16 depths per station. Thedual flowpath design allowed simultaneous collection of particles on quartz fiber filters for particulateorganic carbon and other analyses and on Supor (polyethersulfone) filters for trace element, isotopic,and biogenic silica analyses. Typical volumes filtered were ~1100L through the quartz filter and ~500Lthrough the Supor filter over a 4 hr pumping period. Filters were processed at sea using trace metalclean techniques in a clean space. All filters were photographed, misted lightly to remove salts,subsampled for distribution to groups that required fresh samples, and the remainder dried for latersubsampling and analysis on land. Particle subsamples will be distributed to eleven groups for analysisof major particulate phase composition, biochemical composition, and a broad suite of particulate traceelements and isotopes.
(4) The coupled biogeochemistries of arsenic and phosphate. Arsenic and phosphorus are chemicallyand biochemically very similar, so much so that arsenate (AsV) is toxic to phytoplankton due to itssubstitution in ATP, effectively decoupling energy metabolism. This toxicity is therefore a function ofarsenic�’s chemical speciation, but also the arsenate:phosphate ratio; in oligotrophic waters wherephosphate concentrations drop below 10 nmol/L , arsenate is > 10 nmol/L and toxicity is a problem.However, many phytoplankton are able to ameliorate As toxicity by reducing arsenate to arsenite (AsIII)and/or methylating it to mono (MMAs) and dimethyl As (DMAs); these compounds are non toxic tophytoplankton. Interestingly, in these same conditions of low phosphate phytoplankton are alreadyexperiencing P stress or even limitation, so it is possible that reduced and methylated As can function asmarkers/tracers of P stress. On the transect to date the coupled biogeochemical cycling of As and Pwere examined by determining the concentrations of reactive phosphate and nitrate+nitrite
KNORR 199 4 Cruise Report Page 11
continuously (every 30 sec) along the cruise track from pumped and filtered�“clean tow fish�” usingcolorimetry and liquid core waveguides. Arsenic speciation (total inorganic, arsenite, MMAs, and DMAs)was also determined every 2 hours along the track, together with assays of alkaline phosphatase activityat 6 hour intervals, both from tow fish samples. By Station 12 when the main cruise was aborted, morethan 150 As determinations, >25 AP assays, and >20,000 nutrient measurements had been made.Additional measurements were made underway during the transit to the shipyard.
(5) Aerosol and Rain Sampling: Aerosol and rainfall samples were collected on the GEOTRACES NorthAtlantic section cruise (cruise KN199 4) using three high volume aerosol samplers and two automatedrain samplers. Aerosols were collected on acid cleaned Whatman 41 (cellulosic) filters (for inorganictrace elements and isotopes �– TEIs) and pre combusted quartz microfiber (QMA) filters (for organicspecies, Hg, and nitrogen compounds). One sampler was equipped with a 5 stage Sierra style slottedcascade impactor to collect size fractionated aerosols (from >7 m to <0.49 m). With collaboration fromresearchers around the world, the 24 hour integrated aerosol samples, and event based rain samples,will be analyzed for a large suite of TEIs. All aerosol samples will be analyzed for ultra pure watersoluble, seawater soluble, and total (residual) TEIs. The rain samples will be analyzed, both filtered andunfiltered, to quantify the soluble and particulate TEI concentrations. Air mass back trajectories for allsampling days have been modeled using the NOAA HYSPLIT program. The seawater and ultra high purity(UHP) water aerosol solubility samples will be analyzed at Florida State University for Mn, Fe, Co, Ni, Cu,Zn, Cd, and Pb using a shore based, off line column extraction method prior to determination by highresolution magnetic sector ICPMS using isotope dilution.
In total, 14 aerosol filter deployments/collections were made, resulting in: 14 x 24 Whatman 41 filters (frozen for storage) 14 x 5 impactor filter stages + backing filters (frozen for storage) 14 x QMA filters (frozen for storage) 1 full set of aerosol sampler blanks (frozen for storage)
Seawater and UHP water leaches were conducted at sea using aerosol laden Whatman 41 filters,resulting in:
41 x 100 mL seawater leaches; 85 mL acidified to 0.024 M HCl; 15 mL frozen 41 x 100 mL UHP water leaches; 85 mL acidified to 0.024 M HCl; 15 mL frozen
Two rain events were sampled, resulting in: 2 x 100 mL filtered (0.4 µm), acidified 1 x 100 mL + 1 x 25 mL unfiltered, acidified 1 x 10 mL + 1 x 15 mL unfiltered, frozen
In an effort to constrain the empirical estimate of the solubility of aerosol derived iron in seawater, anew approach was tested onboard. This protocol slowly leaches aerosols with larger volumes (15 L) offiltered surface seawater, and compares concentrations of iron from leached and unleached filters.Instantaneous leaches with filtered surface seawater (200 ml) and with Milli Q water (200 ml) were alsoperformed, and leacheates were collected for the analysis of size fractionated iron (<0.02 m, and <0.4m), redox speciation and organic speciation of iron. Organic speciation analysis was carried out on
board by Kristen Buck (BIOS) as part of a collaborative study.
KNORR 199 4 Cruise Report Page 12
In total six slow leaches (each in triplicate) were carried out on board with freshly collected aerosols(European, maritime and N. African origin) and freshly collected filtered surface seawater. Surfaceseawater was obtained from the University of California Santa Cruz surface sampler (GEOFish). Inaddition a slow leach (in triplicate) was performed on aerosols obtain from an Alaskan forest fire, andanother on Arizona dust reference material. Filtered surface seawater freshly collected on board wasalso used to leach these last two aerosol types. Instantaneous leaches with seawater (in duplicate) andMilli Q water were carried out on replicate filters of aerosols used in the slow leaches. The seawaterused in the instantaneous leaches was the same as used in the slow leaches. Filters not leached onboardwere frozen and will be taken back to the lab for subsequent leaching and/or analysis.
(6) Fe speciation: A total of ~125 samples (stations 1, 3, 5, 7, 9) were analyzed shipboard for dissolved Fespeciation (organic complexation) following the Competitive Ligand Exchange Adsorptive CathodicStripping Voltammetry (CLE ACSV) method of Buck et al. (2007). Replicates of all samples analyzed havebeen stored frozen for a comparison of stored (frozen, 20º C) versus fresh results. These frozen samplesmay also be analyzed for dissolved Cu speciation (CLE ACSV method: Buck and Bruland 2005, Buck et al.2010) in the laboratory at BIOS in the spring. An additional 75 samples (stations 10 12) were collectedand stored frozen for analysis back in the lab. Preliminary results indicate that the Fe binding ligands atstation 1 were saturated with dissolved Fe at all depths (possibly due to Fe contamination), whilestations 5 and 7 presented the largest excesses of Fe binding ligands in the water column, particularlyaround the chlorophyll max and near the bottom boundary layer. Stations 3 and 9, on the other hand,appeared to have very small, if any, excesses in Fe binding ligands.
In collaboration with Dr. Ana Aguilar Islas (University of Alaska, Fairbanks), 6 sets of seawater leaches ofcollected aerosols, and their associated seawater blanks, were also analyzed shipboard for dissolved Fespeciation. There were distinct differences in the amount of Fe leached from these aerosols, likelyreflecting Fe binding ligand concentrations in the surface seawater used for the leach and aerosolsource. Final Fe speciation data (ligand concentrations and conditional stability constants) from stationprofiles and aerosol leaches will be worked up when dissolved Fe totals are finalized.
(7) Mercury: The Lamborg and Hammerschmidt groups were funded to receive samples from thevarious sampling systems, conduct on board determinations of 4 dissolved Hg species and also preservesamples for analysis back on shore (dissolved and particulate thiols and particulate Hg species). Themercury group sent two participants on the US GEOTRACES North Atlantic cruise, including KatlinBowman, a Master�’s Student at Wright State University and PI Lamborg fromWHOI. This was fieldworkcontributing to Ms. Bowman�’s thesis research, and analysis of the preserved thiol samples will compriseWHOI PhD student Tristan Kading�’s generals project. The mercury group occupied a UNOLS fleet 20�’ vanoutfitted with ceiling HEPA units. This space was shared with Bettina Sohst from Pete Sedwick�’s (ODU)lab. The space worked well and suited their needs. In the future, a clean van may not be necessary ifthey could include equipment to make the space adequately clean. Inside, Bowman and Lamborgoperated two Hg species analysis systems, one for mono and dimethylmercury and the other for totaland elemental Hg. As the cruise was prematurely halted due to thruster failure, they were not able to
KNORR 199 4 Cruise Report Page 13
complete our primary goal of measuring Hg species across the entire North Atlantic basin. They did,however, measure Hg species in the stations we were able to occupy, and which amounted to greaterthan 200 determinations the four Hg species each. In addition, about 150 samples for thiols andparticulate species were received from the regular rosette and in situ pumps. This dataset, while lessthan hoped for, is still substantial in size and will be an important contribution to basin scale studies ofHg. The particulate samples will be analyzed for total and monomethylmercury at Wright State, whilethe thiols will be determined at WHOI. Findings thus far include:
Dissolved total Hg in most, if not all the profiles, showed �“hybrid type�” profiles, includingsubstantial surface depletions, a subsurface maximum in concentration co incident with minimain dissolved oxygen and relatively uniform concentrations in deep water (>1000m depth).
Dissolved elemental Hg showed a similar profile as total Hg, and comprised a large percentagesof the total�…approaching 100% in the mixed layer. This species is known to be photochemicallygenerated from Hg(II), and therefore this finding was to be expected. It�’s also the Hg speciesthat participates in sea to air gas exchange, and along with particle scavenging contributes tothe shallow water depletions of total Hg.
Dimethylmercury, a somewhat exotic species generally only seen in measurable concentrationsin the deep ocean, was notably absent from all profiles. This certainly is not true for other partsof the North Atlantic, including the Mid Atlantic Bight (Hammerschmidt and colleagues,unpublished) and the Sargasso Sea (Lamborg and colleagues, unpublished). Where in the basinand at what rates dimethylmercury reappears in the water column would have been a majorpiece of new information had the rest of the zonal section been completed. However, thesimple observation that the eastern and western �“end members�” of the basin look quitedifferent is an important result and challenges what we thought we knew about Hgbiogeochemistry in the ocean.
Finally, monomethylmercury, the species that bioaccumulates in fish and people was prevalentin all profiles and easily observed using the method for determination developed by Ms.Bowman and PI Hammerschmidt. Intriguingly, many of the profiles showed evidence for morethan one maxima in the subsurface, usually associated with oxygen anomalies arising from bothvertical and horizontal transport of organic carbon and apparent oxygen utilization. These data,when eventually combined with the tracer (e.g., SF6 and CFCs), ancillary data (e.g., chlorophyll,particles, oxygen) and other metals (e.g., Co) will help determine the source of this importantspecies, and processes that give rise to it.
(8) Particulate Analysis: Samples for Synchrotron X ray Fluorescence (SXRF) and ICP MS analyses werecollected at 11 stations during the GEOTRACES North Atlantic Section cruise. At each station, unfilteredwater samples (250 mL) were taken for SXRF samples from the GEOTRACES GO Flo rosette from thesurface mixed layer and the deep chlorophyll maximum layer. Cells were preservation with 0.25% tracemetal clean buffered glutaraldehyde and centrifuged onto C/formvar coated Au and Al TEM grids. Usingan inverted Leica microscope, transmitted light (differential interference contrast) and chlorophyllautofluorescence images of the cells were collected along with X,Y,Z coordinates on the grids. Eightyeight grids were prepared for analysis. Bulk particulate samples were collected at each depth sampled(24 depths per station) using the GEOTRACES GO Flo rosette. The filtration was performed directly frompressured GO Flo bottles onto membranes (25mm Supor 0.45µm polyethersulfone) which were
KNORR 199 4 Cruise Report Page 14
mounted in Swinnex polypropylene filter sandwiches. An average of 8.5L of water was filtered througheach membrane. Two hundred and sixty three samples are being stored for analysis via ICP MS. Before 5of the stations, bulk particle samples were collected from surface waters with the towed fish. Waterfrom the fish was collected in a 10 L acid washed carboy and distributed among three, 4L carboys. Thesewere pressurized with 0.2 µm filtered air to force water through replicate 25 mm Supor 0.45µmmembranes held in Swinnex polypropylene filter sandwiches. At each station, one of the three replicatefilters was oxalate soaked then rinsed with chelexed NaCl, the other two filters remained untreated.These replicate filters will be used to compare methods for isolating trace elements in biogenicparticulate matter at a later date.
(9) Copper Speciation: To measure Cu speciation, Jeremy Jacquot used an electrochemical methodcalled competitive ligand exchange adsorptive cathodic stripping voltammetry (CLE ACSV), which allowsone to determine the concentration of organic ligands binding free Cu (Cu2+) and their binding strength.In order to calculate [Cu2+], Jacquot will need to find [CuT] by using isotope dilution with an inductivelycoupled plasma mass spectrometry (ICP MS) system at USC. In total, he obtained 140 1 liter filteredsamples from the GEOTRACES rosette (125 ml for the totals analysis with ICP MS and 875 ml for thespeciation work) and 56 1 liter samples for the Chisholm filtration work. Because he didn't have any timeto analyze his speciation data, he can't draw any particular conclusions though it does seem as though[Cu2+] was elevated in the mixed surface layer at stations 9, 10 and 11�—those most affected by inputsfrom dust.
(10) Al, Fe, and Mn onboard measurements: Sampling for dissolved Al, Fe, and Mn was accomplishedusing 12 L GO FLO bottles on the GEOTRACES 24 place rosette. The University of Hawaii group(Measures and Hatta) performed shipboard determinations on subsamples of water taken from thesebottles collected using an Acropak filter by the subsampling team. Dissolved trace elements weredetermined on samples drawn at each of the 11 stations where the GEOTRACES rosette was deployed.Note that at one �“Demi station�” the GEOTRACES rosette was not deployed. Additionally, surfacesamples were also collected arriving on or departing from station from the UCSC towed fish. In addition,a limited number of samples was collected between stations by this means. In total trace elementdeterminations were made on 249 discrete samples. Data generated onboard were submitted to theshipboard data assembly system and each parameter on each subsample was assigned a quality flag.Dissolved Al, Fe and Mn were determined on these water samples using Flow Injection Analysis.Precisions of each method were established by replicate determination of the same sample at thebeginning of a day�’s run the values were typically: approximately 2% for Al at 10nM; 2% for Fe at 1 nM,and ~ 4% for Mn at 1 nM. In addition to the shipboard determinations 1L samples were collected forshore based ICPMS determinations of dissolved and dissolvable Fe, Mn, Zn and Cd, by isotope dilutionby co PI J. Wu, (University of Miami). These samples were acidified on board, within a few hours ofcollection. Ultrafiltration of 25 samples was also performed at station 5 for subsequent shore baseddetermination of the colloidal fraction at the University of Miami.
(11) Cobalt Analysis: The Saito/Noble group collected samples from all GTC casts, and all arriving onstation Towfish samples, totaling 239 samples. All of these were analyzed shipboard for total dissolvedcobalt after a UV oxidation step using adsorptive cathodic stripping. In addition to total dissolved
KNORR 199 4 Cruise Report Page 15
cobalt, all samples were analyzed shipboard for labile cobalt after an equilibration period with theelectroactive ligand, dimethylglyoxime, using adsorptive cathodic stripping voltammetry. A duplicate setof samples were taken for all depths at stations 9, 10, 11, and 12 and preserved in heat sealed poucheswith oxygen absorbers to test this as a preservation method for samples taken within oxygen minimumzones. These samples will be analyzed at a later date and will be compared to shipboard analyses.
(12) Radium Isotopes: To measure the quartet of radium isotopes (224Ra, 223Ra, 228Ra and 226Ra) toquantify horizontal and vertical transport of dissolved trace elements and isotopes (TEIs), as well asshorter lived thorium isotopes: 234Th and 228Th, used to quantify particle scavenging, vertical fluxes andremineralization rates of bioactive and/or particle reactive TEIs. At each major station a 16 point in situpump profile was carried out. Eight pumps were deployed for an upper water column shallow pumpcast and then turned around to be deployed again for a deep pump cast. The pumps used were heavilymodified McLane in situ pumps, which were outfitted to accommodate 2 * 142 mm filter headscontaining different filter types (see cruise report by Dan Ohnemus). After water had passed throughthe dual filter heads the streams were joined passed through a MnO2 impregnated cartridge filter forscavenging dissolved radium and thorium isotopes. The pumps were programmed to pump for 4 hoursand typically pumped a total of 1500 1700 l of seawater. Three flow meters at various points along thepump plumbing allowed accurate determination of water filtered. The pumps were hung on a 3/8�”plastic coated Vectran line. The dissolved radium and thorium isotopes were scavenged onto MnO2
impregnated Cuno cellulose cartridge filter. The cartridge was fitted to the exhaust flow of the modifiedMcLane in situ large volume pump. Each pump typically passed 1500 1700 l of pre filtered seawaterthrough the MnO2 cartridge filter over a 4 h pump time. 16 depths were sampled over 2 pump casts: ashallow and a deep, at 8 stations. After recovering the cartridges from the pumps, they were rinsedwith radium free fresh water to remove salt and then dried to dampness before measurement of theshort lived radium isotopes on board the ship. 224Ra (t1/2 = 3.7 d) and 223Ra (t1/2 = 11.4 d) were measuredon the Radium delayed coincidence counter (RaDeCC) system and were typically measured <24 h aftersample collection. After 3 weeks (6 * t1/2 of 224Ra) the background activity of 224Ra was measured againto determine the supported activity of 224Ra from its parent isotope 228Th, thus allowing themeasurement of 228Th. This second round of counting is currently being carried out by Kuanbo Zhou asthe Knorr transits back the US. Some previous work by Matt Charette and Kanchan Maiti on theGEOTRACES intercalibration cruise has shown that MnO2 cartridges do not scavenge radium at 100%efficiency. Therefore, to determine the extraction efficiency of the Cuno cartridge filter a discreteseawater sample was taken in parallel with every pump depth sampled for direct calibrationdeterminations of 226Ra and 234Th. For shallow pump casts these samples were taken from the 30 lNiskin rosette on a separate niskin cast and for deep pump casts a 30 l Niskin bottle was hung next toeach pump and triggered with a messenger. For 226Ra, 20 25 l of seawater was passed over a column ofMnO2 impregnated acrylic fiber, which is known to remove radium at 100% efficiency. These sampleswere bagged and will be analyzed for 226Ra through it daughter, 222Rn back in the lab. For details of 234Thdetermination refer to the 234Th cruise report by Stephanie Owens. Stephanie was responsible fortaking both the 226Ra and the 234Th samples, and she is processing the 234Th samples. 226Ra samples willbe processed by Paul Morris. In total 122 MnO2 cartridge samples were taken out of a planned 380.
KNORR 199 4 Cruise Report Page 16
A limited number of underway samples for surface radium measurements were collected from a highvolume deck pump. 260 l of filtered seawater was rapidly collected into barrels and then subsequentlypassed through MnO2 acrylic fiber for determination of all 4 radium isotopes. The underway samplingwas particularly focused in collecting samples for short lived radium isotopes (224Ra and 223Ra) during theclose pass to the Mauritanian coast. Unfortunately, while under way to the shallow water demi stationclosest to shore the ship suffered failure of the port thruster and the ship was diverted to the deepwater super station further off shore. A smaller set of underway samples were collected while in transitto the super station. These samples were processed in a similar manner to the MnO2 cartridges forshort lived radium isotopes while on board ship.
(13) 234Th and 228Th: At each regular and super station, samples for total 234Th were collected byStephanie Owens and Kuanbo Zhou from a 30L shallow Niskin cast and Niskin bottles attached to thewire during deep pump casts. All sample processing and preliminary sample analysis by beta countingwas completed on board, a requirement because of the short half life of 234Th (24.1 days). At regularand super stations, ~20 point profiles were collected with 16 of those depths matching the in situ pumpdepths while the additional depths were used to obtain higher resolution through the euphotic zone. Inaddition, a surface sample was collected using a pump located on the port side of the ship. At demistations, 13 point profiles were collected from the shallow Niskin cast and the surface pump. In all 209samples were collected for total 234Th. Initial data analysis suggests a decrease in POC export fromcoastal waters off of Lisbon to the open ocean followed by an increase in export during the Mauritanianleg of the trip that concluded at the TENATSO site. Samples for particulate 234Th were collected from theshallow pump cast and counted on board the ship. Back on shore these samples will be analyzed fortheir organic carbon content in order to determine 234Th/POC ratios. This ratio can be used to estimatethe POC export flux based on the 234Th flux determined by the total 234Th measurements as describedabove. Samples for 228Th were also collected from the pump casts. These particulate samples will beprocessed back onshore and be analyzed in conjunction with Mn cartridges also deployed during thepump casts. The combined measurement of 234Th and 228Th will be used to obtain insight into particledynamics taking place in the water column.
(14) Biogeotraces Sampling: Jacquot also collected filters from each station for the Chisolm group thatwill be used to conduct flow cytommetry, metagenomic and qPCR analyses. Boyle collected samples forLaRoche and performed reduced pressure filtration. These samples were kept frozen at 70°C andtransferred to the research station at Cape Verde Islands for shipment back to Kiel.
(15) CFC and SF6 Sampling: was done on deep and shallow Niskin casts at each regular and superstation (for a total of 24 depths per station) and the Niskin cast at all demi stations (12 depths perstation). Samples were analyzed on board and the data reported to the ODF data manager and madeavailable to cruise participants. A total of 240 samples were taken and analyzed.
(16) Tritium and helium sampling: Tritium and 3He sampling were done on all regular, super , anddemi stations. A total of 240 3He and 228 tritium samples were taken. The 3He samples were taken in
KNORR 199 4 Cruise Report Page 17
crimped copper tubing and the tritium samples were stored in pre cleaned, argon filled 1 liter flint glassbottles.
(17) Compilation of samples taken and associated metadata: was accomplished during the cruise byassembling all CTD cast information, cast sheets, and event logs and entering them into a database. AnODF staff member was responsible for this task and for quality checking and merging the relevantinformation. As a consequence, we have a complete record of all samples taken on the cruise, and theirrelationship to critical metadata parameters (time, location, etc). Bottle data have been compared tothe sensor records in order to check instrument calibration and to establish bottle integrity againstpre/post tripping and leakage. The hydrographic data (temperature, salinity, oxygen, nutrients) havebeen quality controlled and merged into a relational database for use by cruise participants. This datawas available in near real time to cruise participants. For example, CTD data was usually available forplotting within an hour or two of the cast, and the discrete hydrographic measurements (oxygen,nutrients, and salinity) were available within a day or two of the station.
(18) NASA Sampling: During the 2010 Geotraces Atlantic cruise NASA�’s Calibration and Validation Officestaff performed 31 bio optical casts for the measurement of apparent optical properties (AOPs) in theupper ocean at 9 of the 12 stations occupied during the cruise. The AOP work was conducted to supportcalibration and validation activities for the current suite of NASA ocean color satellite missions (SeaWiFSand MODIS) with opportunistic application to international missions (e.g., MERIS and OCM 2). The AOPmeasurements included in water instruments (Submersible Biospherical Optical Profiling System,SuBOPS; Biospherical Instruments, Inc.) to determine spectral water leaving radiances that are essentialto remote sensing applications. The AOP in water system had a solar reference, which was mounted ona telescoping mast to ensure unobstructed viewing of the sky�—when the mast was extended, the solarreference was the highest structure on the Knorr. In addition to the bio optical data, at each of thestations where AOP measurements were conducted, near surface water was collected for: the analysesof phytoplankton pigments using state of the art HPLC techniques, light absorption by particulates (Ap),particulate organic carbon (POC), gravimetric determination of suspended particulate matter (SPM),dissolved organic carbon (DOC), and absorption by colored dissolved organic matter (aCDOM). Theseparameters are valuable for development and further refinement of algorithms for the determination ofphytoplankton pigments and other novel data products (e.g. DOC, POC) from remote sensing platformsIn collaboration with WHOI�’s Ra/Th group, samples for pigments analyses were collected at all 12stations from a shallow Niskin cast at four depths (at surface and at, and above and below, the chl amaximum). These data will enhance the interpretation of POC export estimations derived using the U/Thapproach. In addition, samples for DOC/aCDOM were collected at 13 selected depths from shallow anddeep Niskin casts at all 12 stations. These data will contribute to databases that support studies thatemploy CDOM as a tracer of global biogeochemical cycles and meridional overturning circulation.NASA�’s participation in the recent GEOTRACES campaign allowed the collection of valuable data for thesupport of ocean color remote sensing activities, while collaborating with other branches of the oceanscience community. Given the difficulties associated with obtaining in situ measurements from remote areas of the ocean, the data currently used to develop and validate bio-optical algorithms are limited in their geographical range and their dynamic representation of bio-optical conditions. During the
KNORR 199 4 Cruise Report Page 18
GEOTRACES campaign we were able to collect bio optical, pigment, and biogeochemical data duringatmospheric conditions that, with current algorithms, prevent the extraction of remotely sensedquantities. Dust blowing off the Saharan desert was evident on true color images from the NASAMODIS Aqua Satellite, and on surfaces on board the R/V Knorr, during the cruise. This valuable data set,for example, will allow the development of new atmospheric correction approaches for the retrieval ofocean color products.
(19) Underway (towed fish) Sampling: As part of the U. S. GEOTRACES North Atlantic project Dr. KenBruland�’s research group was funded to deploy our surface tow fish (the GeoFish) for the collection of0.5 liter samples to provide high resolution data along surface transects between and upon arrival at thevertical stations for assaying a suite of contamination prone trace metals (Al, Sc, Ti, Mn, Fe, Co, Ni, Cu,Zn, Ga, Cd, and Pb) in the dissolved (<0.2µm filtered) and unfiltered, weak acid dissolvable (at pH 1.7),phases in surface sea water. We are also funded to obtain 0.5L samples from each depth of theGEOTRACES rosette vertical profiles as part of a library for future studies and to assay the superstationprofile samples for this suite of trace metals to complement the vertical GEOTRACES profile dataobtained by others. Geoffrey Smith is participating on the cruise and responsible for maintaining andoperating the GeoFish for the collection of our surface samples during transit between stations andproviding bottles for the vertical profile samples to the GEOTRACES sampling team and performingonboard acidification of these samples and those collected for Kristin Orians�’ group and Mukul Sharmafor long term preservation. Geoffrey also has been periodically collecting a subset of filtered surfacesamples between stations for Bill Landing, Alan Shiller and Chris Measures and unfiltered samples forBenjamin Twinning, Julie La Roche and Penny Chisholm prior to arrival on station. In addition to thesesamples, Geoffrey has supplied large volumes of 0.2µm filtered surface water for Ana Aguilar Islas andBill Landing�’s, and Phoebe Lam�’s groups for aerosol and particulate leaching experiments respectively.During the U.S. GEOTRACES North Atlantic cruise from Lisbon, Portugal to the Cape Verde Islands, Oct.15 to Nov. 3, Geoffrey has performed eighty eight GeoFish sampling events and collected the followingsamples:
149 surface sea water samples designated with only GeoFish ID #�’s which include 64 each 0.2µm filtered 0.5L trace metal samples and 50ml ODF nutrients, and twenty one 125ml unfilteredpH 1.7 dissolvable trace metals samples .
88 samples collected during transects between stations designated with GEOTRACES sample #�’sfor the samples described above and additional 125ml samples for each of W. Landing, A. Shiller,C. Measures, 50ml ODF nutrients, 125ml ODU nanomolar nuts., and 250ml ODF salinities.
Over 140 samples collected at three Demi stations including arriving fish samples for thosedescribed as above with GEOTRACES designated sample numbers and additional samples forother researchers obtaining samples from the GEOTRACES rosette.
Over 324 samples collected at three regular stations including arriving fish samples for thosedescribed as above with GEOTRACES designated sample numbers and additional samples forother researchers obtaining samples from the GEOTRACES rosette. Several departing fishsamples for dissolved and dissolvable trace metals along with samples for W. Landing, A. Shillerand C. Measures were collected in addition at two of the regular stations
KNORR 199 4 Cruise Report Page 19
Over 112 samples collected at the two super stations including arriving fish samples for thosedescribed as above with GEOTRACES designated sample numbers and additional samples forother researchers obtaining samples from the GEOTRACES rosette.
Data Dissemination and Communication
All CTD, hydrographic, and metadata have been assembled and organized by the ODF data operator.These data will be posted on a publicly available website, but under password protection until it isfinalized and submitted to BCO DMO.
Lessons Learned
This was the first U.S. GEOTRACES survey cruise, and as such, although it was terminated early due toengine problems, it represents an opportunity to learn from experience. The biggest challenge was thecomplexity and scale of the seagoing operations, and the limits on the number of science personnel thatcould participate. Certainly the berthing limitation was a major challenge as all groups were operatingshort handed. While we all agree that there could be improvements, the fundamental conclusion is thatwe were close to an optimally working system. Having said this, we would point out that everyoneaboard worked very hard, and cooperated fully in making this cruise the success that it was.
(1) Overall coordination: the four �“overboard�” groups, name the GTC/trace metal samplers, theODF/Niskin samplers, the pumping group, and the bio optical (NASA) sampling coordinated welltogether. Cast ordering was planned to minimize time on station when something wasn�’t in the water,and little time was lost between individual casts. Prior to arriving on station, a cast plan was publishedvia email as a spreadsheet with an assigned schedule so that the groups, along with the bridge and deckcrew were aware of the timing and order of events. These plans were posted in the main lab as well.One thing that could be done better in the future is the use of the white board to notify science crewwhen a cast was due up, and to post wake up schedules. This would supplement the �“on line�” schedulefor those without ready access to email. The ODF web site proved useful during steaming periods as itprovided an ETA for the next station. It would be helpful if it could be augmented to incorporatestation/cast progress while on station as well.
(2) Having a critical station (station 1 was a super station) so soon after leaving the dock wasproblematic. It would have been better to schedule an extra day to allow for rinsing and testing of theGTC GO FLO bottles for contamination checking. Preloading of the GO FLOs with uncontaminatedseawater a day or two prior to departing from the dock might help.
(3) The �“super tech�” idea was a good one, but it became clear that the two technicians assignedto staging the GO FLO casts were severely overtaxed. Having two extra technicians to handle theseoperations would permit watch standing and avoid overloading when stations become back to back,and with the work associated with the extra sampling associated with the super stations. In addition,having a larger, dedicated area for staging of sample bottles would be helpful.
KNORR 199 4 Cruise Report Page 20
(4) Like the GTC sampling team, the pumping team was also stressed and could have benefitedfrom 2 additional members. For example, the deep pumping cast involved several hours of intensivedeck work during deployment and retrieval, and having an additional team member would have reducedthe risk of fatigue related errors and enabled some �“shift work�”.
KNORR 199 4 Cruise Report Page 21
Final Note: Despite the early termination of the cruise, we can safely regard this effort as a success.There were a lot of moving parts in the GEOTRACES machinery, and things worked remarkably well. Allthis was down to a group of motivated, hard working, and cooperative scientists that worked togetherwell. It should also be said that the ship�’s crew were extraordinarily helpful and went out of their way tomake this a safe and productive cruise. We are grateful to Captain Adam Seamans for his efforts andhospitality.