Embed Size (px)
Citation preview
CROSS BORDER M&A INDEXQ1 2016

CONTENTS
SPOTLIGHT: CARVE-OUTSDisposals — those involving the separation of highly integrated businesses or business activities spread across multiple jurisdictions — are complex and difficult. The team needs to package the business and present it to bidders in a way that allows the price to be maximized. They also need to be able to implement the sale and the separation with certainty and on time. This requires planning with advisors experienced in best practice for carve-outs.
REGIONAL FOCUS: LATIN AMERICAInbound deal values for Q1 up 70% from Q1 2015.
THE GLOBAL PICTURECross-border M&A made up 53% of all deal value in Q1 2016, up from 39% in 2015 and 43% in 2014.
Chinese and Canadian buyers pushed cross-border deal values to a new first- quarter record of US$324bn.
North American acquirers made 148 deals in the EU, totaling US$47.1bn. Deals between Latin American buyers and EU targets reached a record US$8.9bn.
SECTOR FOCUS: INSURANCECross-border M&A in the insurance sector surged to US$83bn in 2015.
CROSS-BORDER M&A INDEX Q1 2016Following a record final quarter in 2015, cross-border deal activity got off to a slow start this year as the slowdown in China, slump in oil prices, threat of Brexit and volatility in the equity markets led investors to be more cautious.
As a result, Baker & McKenzie’s Cross-Border M&A Index, which tracks quarterly deal activity using a baseline score of 100, dropped to 213 from its peak of 358 last quarter.
However, it was still seven points higher than the same period last year, with buyers announcing 1,202 cross-border deals worth US$324bn, a 10% drop in volume but 14% rise in value compared to Q1 2015.
About Mergermarket
Mergermarket is an independent mergers and acquisitions (M&A) intelligence service, with an unrivalled network of dedicated M&A journalists based in 62 locations across the Americas, Europe, Asia Pacific, the Middle East and Africa. Unlike any other service of its kind, Mergermarket specialises in providing forward-looking origination and deal flow opportunities, integrated with a comprehensive deals database – resulting in real revenues for clients.
Visit mergermarket.com.
1 CROSS-BORDER M&A INDEX
M&A Index reveals slow start to 2016 but promising deal values
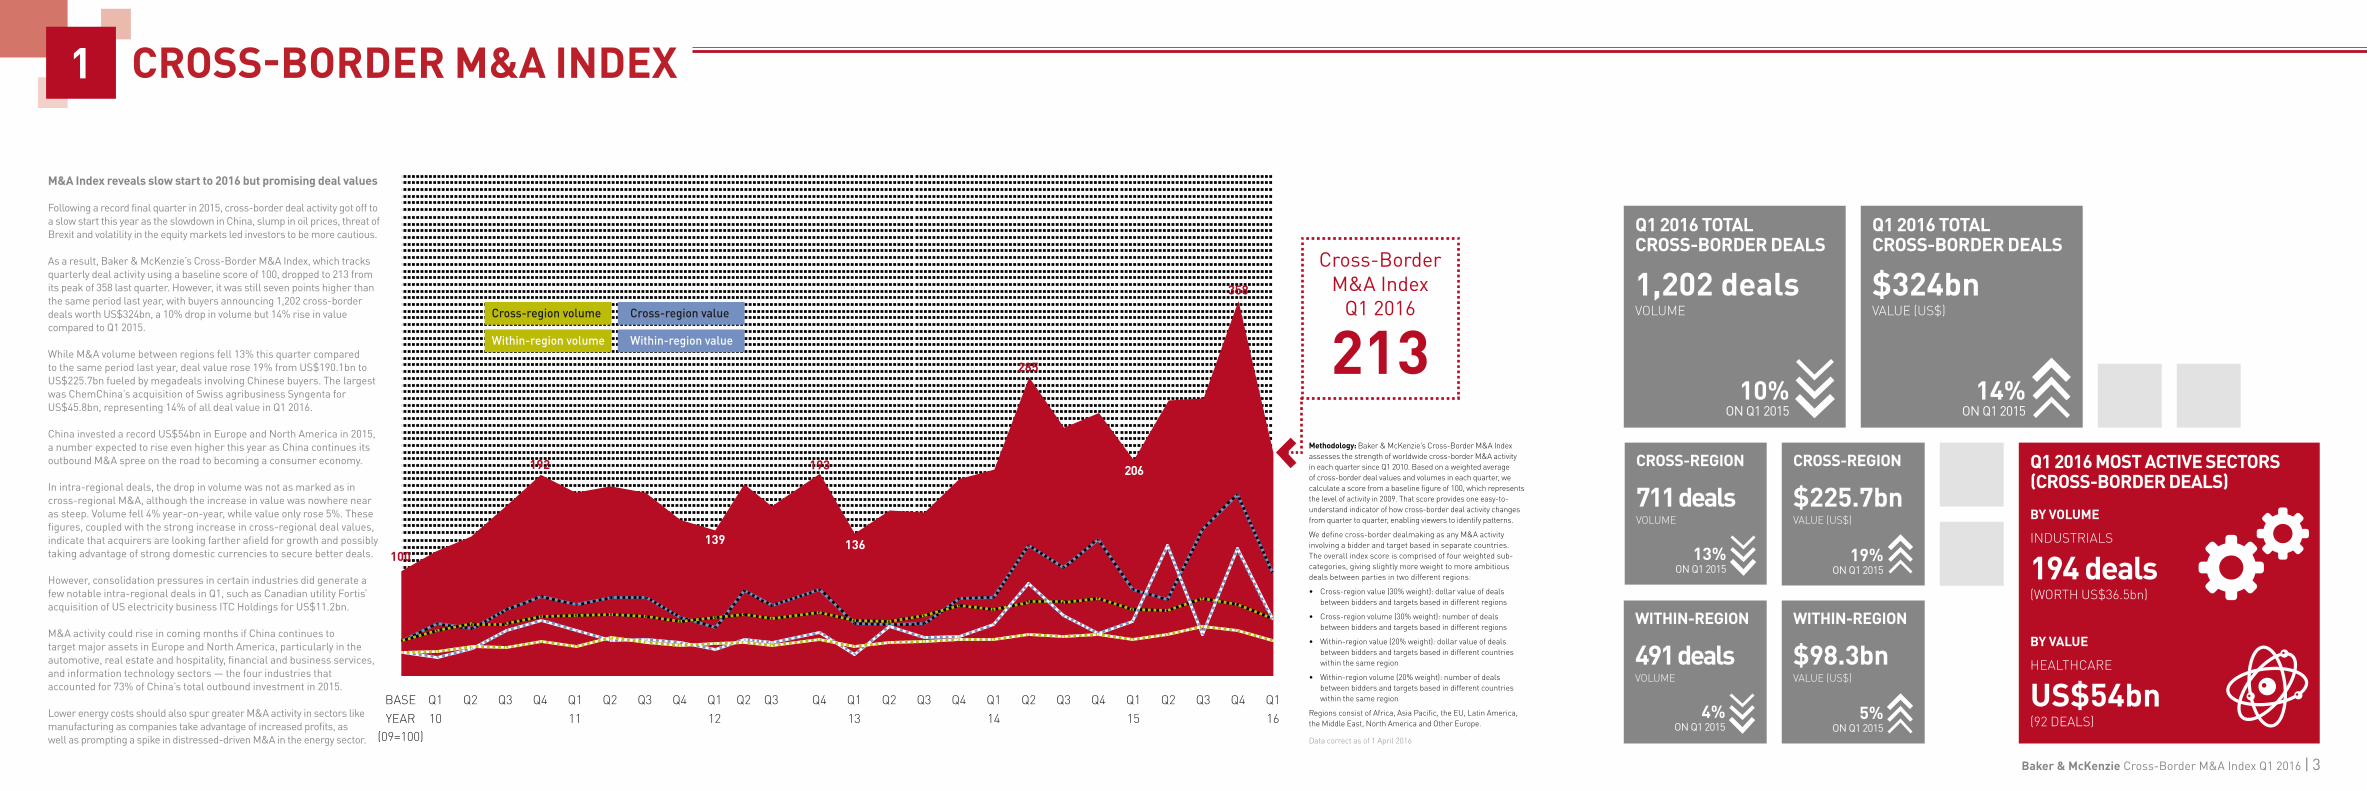
Following a record final quarter in 2015, cross-border deal activity got off to a slow start this year as the slowdown in China, slump in oil prices, threat of Brexit and volatility in the equity markets led investors to be more cautious.
As a result, Baker & McKenzie’s Cross-Border M&A Index, which tracks quarterly deal activity using a baseline score of 100, dropped to 213 from its peak of 358 last quarter. However, it was still seven points higher than the same period last year, with buyers announcing 1,202 cross-border deals worth US$324bn, a 10% drop in volume but 14% rise in value compared to Q1 2015.
While M&A volume between regions fell 13% this quarter compared to the same period last year, deal value rose 19% from US$190.1bn to US$225.7bn fueled by megadeals involving Chinese buyers. The largest was ChemChina’s acquisition of Swiss agribusiness Syngenta for US$45.8bn, representing 14% of all deal value in Q1 2016.
China invested a record US$54bn in Europe and North America in 2015, a number expected to rise even higher this year as China continues its outbound M&A spree on the road to becoming a consumer economy.
In intra-regional deals, the drop in volume was not as marked as in cross-regional M&A, although the increase in value was nowhere near as steep. Volume fell 4% year-on-year, while value only rose 5%. These figures, coupled with the strong increase in cross-regional deal values, indicate that acquirers are looking farther afield for growth and possibly taking advantage of strong domestic currencies to secure better deals.
However, consolidation pressures in certain industries did generate a few notable intra-regional deals in Q1, such as Canadian utility Fortis’ acquisition of US electricity business ITC Holdings for US$11.2bn.
M&A activity could rise in coming months if China continues to target major assets in Europe and North America, particularly in the automotive, real estate and hospitality, financial and business services, and information technology sectors — the four industries that accounted for 73% of China’s total outbound investment in 2015.
Lower energy costs should also spur greater M&A activity in sectors like manufacturing as companies take advantage of increased profits, as well as prompting a spike in distressed-driven M&A in the energy sector.
Q115
Q116
Q2 Q3 Q4Q4Q3Q2Q114
Q4Q3Q2Q113
Q4Q3Q2Q112
Q4Q3Q2Q111
Q4Q3Q2Q110YEAR
BASE
(09=100)
Cross-region volume
Within-region volume Within-region value
Cross-region value
100139
192 193
136
285
358
206
Cross-Border M&A Index
Q1 2016
213Methodology: Baker & McKenzie’s Cross-Border M&A Index assesses the strength of worldwide cross-border M&A activity in each quarter since Q1 2010. Based on a weighted average of cross-border deal values and volumes in each quarter, we calculate a score from a baseline figure of 100, which represents the level of activity in 2009. That score provides one easy-to-understand indicator of how cross-border deal activity changes from quarter to quarter, enabling viewers to identify patterns.
We define cross-border dealmaking as any M&A activity involving a bidder and target based in separate countries. The overall index score is comprised of four weighted sub-categories, giving slightly more weight to more ambitious deals between parties in two different regions:
• Cross-region value (30% weight): dollar value of deals between bidders and targets based in different regions
• Cross-region volume (30% weight): number of deals between bidders and targets based in different regions
• Within-region value (20% weight): dollar value of deals between bidders and targets based in different countries within the same region
• Within-region volume (20% weight): number of deals between bidders and targets based in different countries within the same region
Regions consist of Africa, Asia Pacific, the EU, Latin America, the Middle East, North America and Other Europe.
Data correct as of 1 April 2016
Q1 2016 MOST ACTIVE SECTORS (CROSS-BORDER DEALS)
BY VOLUME
INDUSTRIALS
194 deals(WORTH US$36.5bn)
BY VALUE
HEALTHCARE
US$54bn(92 DEALS)
Q1 2016 TOTAL CROSS-BORDER DEALS
$324bnVALUE (US$)
CROSS-REGION
$225.7bnVALUE (US$)
WITHIN-REGION
$98.3bnVALUE (US$)
Q1 2016 TOTAL CROSS-BORDER DEALS
1,202 dealsVOLUME
CROSS-REGION
711 dealsVOLUME
WITHIN-REGION
491 dealsVOLUME
14%ON Q1 2015
19%ON Q1 2015
5%ON Q1 2015
10%ON Q1 2015
13%ON Q1 2015
4%ON Q1 2015
Baker & McKenzie Cross-Border M&A Index Q1 2016 | 3
2 THE GLOBAL PICTURE
HEADLINES
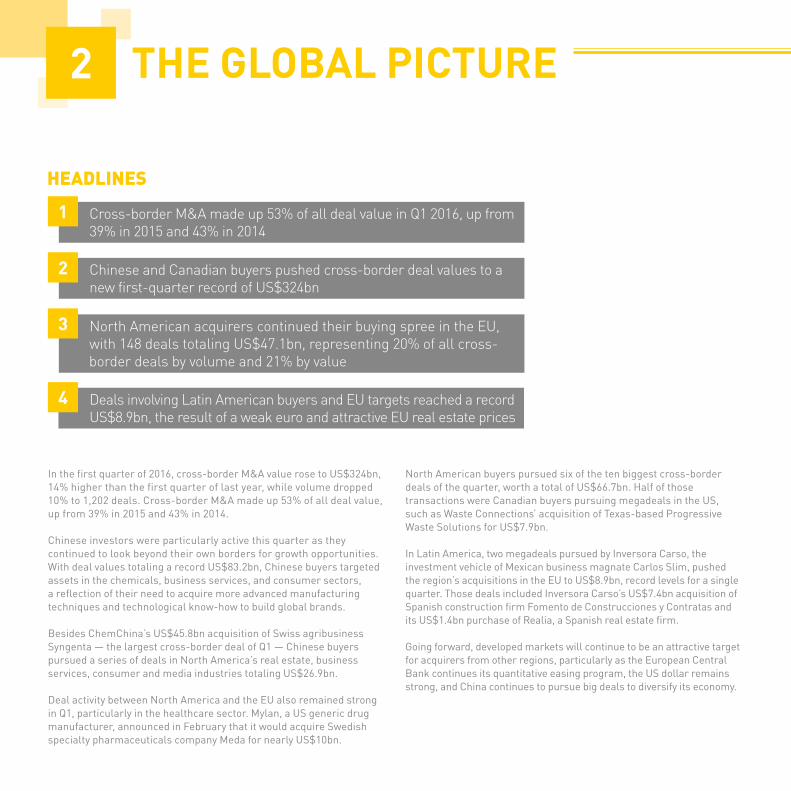
Cross-border M&A made up 53% of all deal value in Q1 2016, up from 39% in 2015 and 43% in 2014
1
Chinese and Canadian buyers pushed cross-border deal values to a new first-quarter record of US$324bn
2
North American acquirers continued their buying spree in the EU, with 148 deals totaling US$47.1bn, representing 20% of all cross-border deals by volume and 21% by value
3
Deals involving Latin American buyers and EU targets reached a record US$8.9bn, the result of a weak euro and attractive EU real estate prices
4
In the first quarter of 2016, cross-border M&A value rose to US$324bn, 14% higher than the first quarter of last year, while volume dropped 10% to 1,202 deals. Cross-border M&A made up 53% of all deal value, up from 39% in 2015 and 43% in 2014.
Chinese investors were particularly active this quarter as they continued to look beyond their own borders for growth opportunities. With deal values totaling a record US$83.2bn, Chinese buyers targeted assets in the chemicals, business services, and consumer sectors, a reflection of their need to acquire more advanced manufacturing techniques and technological know-how to build global brands.
Besides ChemChina’s US$45.8bn acquisition of Swiss agribusiness Syngenta — the largest cross-border deal of Q1 — Chinese buyers pursued a series of deals in North America’s real estate, business services, consumer and media industries totaling US$26.9bn.
Deal activity between North America and the EU also remained strong in Q1, particularly in the healthcare sector. Mylan, a US generic drug manufacturer, announced in February that it would acquire Swedish specialty pharmaceuticals company Meda for nearly US$10bn.
North American buyers pursued six of the ten biggest cross-border deals of the quarter, worth a total of US$66.7bn. Half of those transactions were Canadian buyers pursuing megadeals in the US, such as Waste Connections’ acquisition of Texas-based Progressive Waste Solutions for US$7.9bn.
In Latin America, two megadeals pursued by Inversora Carso, the investment vehicle of Mexican business magnate Carlos Slim, pushed the region’s acquisitions in the EU to US$8.9bn, record levels for a single quarter. Those deals included Inversora Carso’s US$7.4bn acquisition of Spanish construction firm Fomento de Construcciones y Contratas and its US$1.4bn purchase of Realia, a Spanish real estate firm.
Going forward, developed markets will continue to be an attractive target for acquirers from other regions, particularly as the European Central Bank continues its quantitative easing program, the US dollar remains strong, and China continues to pursue big deals to diversify its economy.

OUT
OUT
OUT
OUT
OUT
OUT
OUT
IN
IN
IN
IN
IN
IN
IN
Africa
Asia-Pacific
EU
Latin America
Middle East
North America
Other Europe
1 10 50 100
Volume
Value(US$bn)
2.527
12
157
196
5
25
245
71
97
264
59
16181
67
16.1
66.4
8.1
2.577.9
52.2
1.1
91.0
51.6
8.9
1.2
66.9
5.1
GLOBAL CROSS-REGIONAL DEAL FLOW Q1 2016 (BY VALUE)
Baker & McKenzie Cross-Border M&A Index Q1 2016 | 5

3
to 24 deals worth US$9.4bn in Q1 2015. Despite the slow start, there is still cause for optimism.
“Insurance companies tend to look at things with a longer time focus than other companies because they’re used to matching assets and liabilities over 50-year periods,” says Craig Roeder, an M&A Partner in Baker & McKenzie’s Chicago office. “It may be a sector that continues to be active despite what the broader market is doing.”
Outbound JapanAfter focusing on acquisitions primarily in Asia Pacific for the past five years, Japanese insurers recently turned their attention to bigger targets in the US, UK and Australia. Even though the growth rates in these developed markets are relatively low, they are still attractive to Japanese insurers facing negative population growth and below zero interest rates at home. The result was three megadeals involving US targets in 2015, amounting to US$16.2bn. By comparison, Japanese buyers pursued just one US megadeal worth US$5.7bn in 2014.
SECTOR FOCUS:INSURANCE
INSURANCE CROSS-BORDER M&A 2009 - 2016
HEADLINES
Cross-border M&A in the insurance sector surged to US$83bn in 2015, more than three times the total deal value in 2014
1
The surge was fueled by four megadeals valued at more than US$5bn each, compared to just one deal that size in 2014
2
Japan and Switzerland were the most active buyers in 2015 by value, accounting for US$22.5bn and US$31.4bn in deals respectively, while the US was the most active buyer by volume with 16 deals
3
M&A activity in the insurance sector slowed in Q1 2016 to 14 deals worth US$1.2bn, compared to 24 deals valued at US$9.4bn during Q1 2015. But deal activity may pick up
4
0
20
40
60
80
100
120
Q1 20162015201420132012201120102009
Volu
me
Value US$bn
Volume Value US$bn
0
20
40
60
80
100
Last year was a banner year for cross-border M&A in the insurance sector, fueled by megadeals targeting the US and high levels of deal activity in Asia Pacific. Despite a slight decline in the number of transactions, total deal value surged to US$83bn in 2015, more than triple the US$25.8bn in deals announced in 2014.
Outbound activity was strongest from Asia Pacific and Europe, led by Japanese insurers pursuing seven deals worth US$22.5bn, including three megadeals targeting US assets. Swiss investors announced four deals worth US$31.4bn, the bulk of that value coming from ACE’s acquisition of US-based Chubb for US$28.3bn — the largest insurance deal ever.
As a result, more than half the value of global M&A activity in the sector last year came from deals targeting the US, totaling US$47.9bn.
After a blockbuster year, M&A activity among insurers slowed in the first quarter of 2016, with only 14 deals worth US$1.2bn, compared
Data source: Mergermarket/Willis Towers Watson
SECTOR FOCUS:INSURANCE
JAPAN OUTBOUND INSURANCE M&A 2009 - 2015
0
2
4
6
8
10
2015201420132012201120102009
Volu
me
Value US$bn
Volume Value US$bn
0
5
10
15
20
25
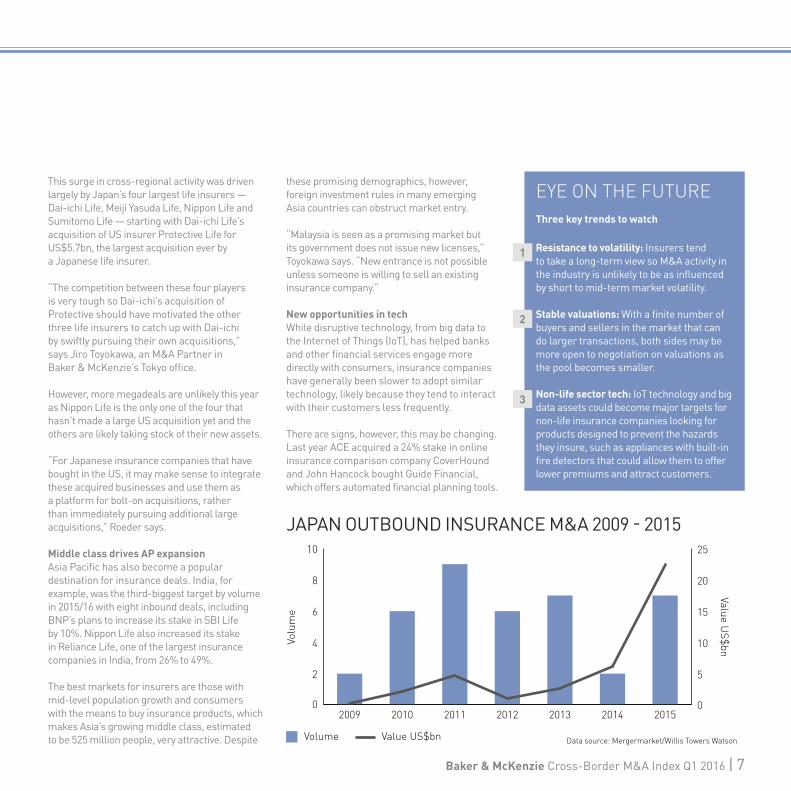
EYE ON THE FUTUREThree key trends to watch
Resistance to volatility: Insurers tend to take a long-term view so M&A activity in the industry is unlikely to be as influenced by short to mid-term market volatility.
Stable valuations: With a finite number of buyers and sellers in the market that can do larger transactions, both sides may be more open to negotiation on valuations as the pool becomes smaller.
Non-life sector tech: IoT technology and big data assets could become major targets for non-life insurance companies looking for products designed to prevent the hazards they insure, such as appliances with built-in fire detectors that could allow them to offer lower premiums and attract customers.
This surge in cross-regional activity was driven largely by Japan’s four largest life insurers — Dai-ichi Life, Meiji Yasuda Life, Nippon Life and Sumitomo Life — starting with Dai-ichi Life’s acquisition of US insurer Protective Life for US$5.7bn, the largest acquisition ever by a Japanese life insurer.
“The competition between these four players is very tough so Dai-ichi’s acquisition of Protective should have motivated the other three life insurers to catch up with Dai-ichi by swiftly pursuing their own acquisitions,” says Jiro Toyokawa, an M&A Partner in Baker & McKenzie’s Tokyo office.
However, more megadeals are unlikely this year as Nippon Life is the only one of the four that hasn’t made a large US acquisition yet and the others are likely taking stock of their new assets.
“For Japanese insurance companies that have bought in the US, it may make sense to integrate these acquired businesses and use them as a platform for bolt-on acquisitions, rather than immediately pursuing additional large acquisitions,” Roeder says.
Middle class drives AP expansion Asia Pacific has also become a popular destination for insurance deals. India, for example, was the third-biggest target by volume in 2015/16 with eight inbound deals, including BNP’s plans to increase its stake in SBI Life by 10%. Nippon Life also increased its stake in Reliance Life, one of the largest insurance companies in India, from 26% to 49%.
The best markets for insurers are those with mid-level population growth and consumers with the means to buy insurance products, which makes Asia’s growing middle class, estimated to be 525 million people, very attractive. Despite
these promising demographics, however, foreign investment rules in many emerging Asia countries can obstruct market entry.
“Malaysia is seen as a promising market but its government does not issue new licenses,” Toyokawa says. “New entrance is not possible unless someone is willing to sell an existing insurance company.”
New opportunities in techWhile disruptive technology, from big data to the Internet of Things (IoT), has helped banks and other financial services engage more directly with consumers, insurance companies have generally been slower to adopt similar technology, likely because they tend to interact with their customers less frequently.
There are signs, however, this may be changing. Last year ACE acquired a 24% stake in online insurance comparison company CoverHound and John Hancock bought Guide Financial, which offers automated financial planning tools.
Data source: Mergermarket/Willis Towers Watson
1
2
3
Baker & McKenzie Cross-Border M&A Index Q1 2016 | 7
4 REGIONAL FOCUS:LATIN AMERICA
HEADLINES
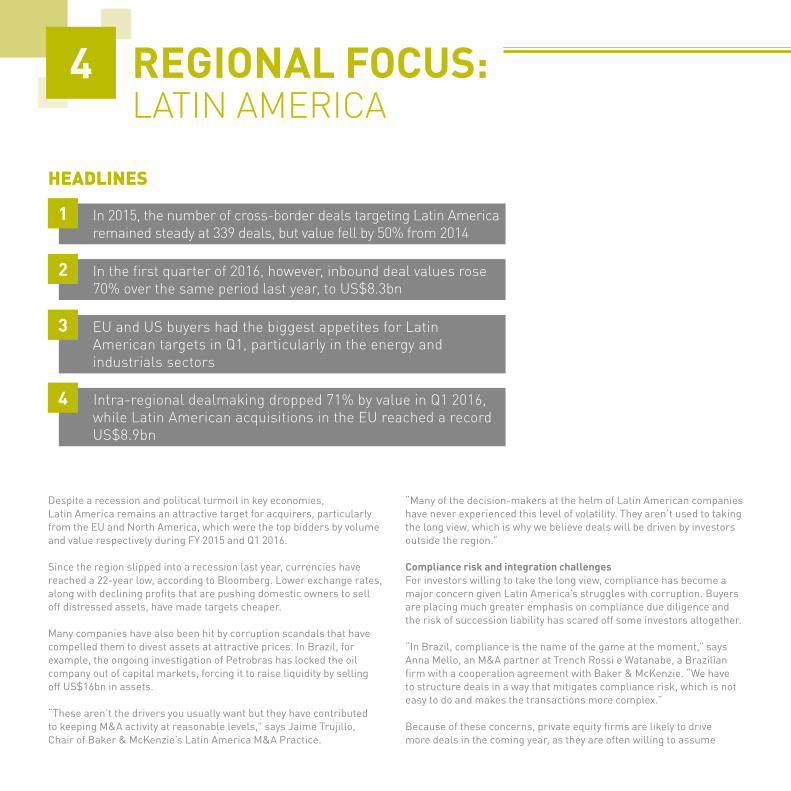
In 2015, the number of cross-border deals targeting Latin America remained steady at 339 deals, but value fell by 50% from 2014
1
In the first quarter of 2016, however, inbound deal values rose 70% over the same period last year, to US$8.3bn
2
EU and US buyers had the biggest appetites for Latin American targets in Q1, particularly in the energy and industrials sectors
3
Intra-regional dealmaking dropped 71% by value in Q1 2016, while Latin American acquisitions in the EU reached a record US$8.9bn
4
Despite a recession and political turmoil in key economies, Latin America remains an attractive target for acquirers, particularly from the EU and North America, which were the top bidders by volume and value respectively during FY 2015 and Q1 2016.
Since the region slipped into a recession last year, currencies have reached a 22-year low, according to Bloomberg. Lower exchange rates, along with declining profits that are pushing domestic owners to sell off distressed assets, have made targets cheaper.
Many companies have also been hit by corruption scandals that have compelled them to divest assets at attractive prices. In Brazil, for example, the ongoing investigation of Petrobras has locked the oil company out of capital markets, forcing it to raise liquidity by selling off US$16bn in assets.
“These aren’t the drivers you usually want but they have contributed to keeping M&A activity at reasonable levels,” says Jaime Trujillo, Chair of Baker & McKenzie’s Latin America M&A Practice.
“Many of the decision-makers at the helm of Latin American companies have never experienced this level of volatility. They aren’t used to taking the long view, which is why we believe deals will be driven by investors outside the region.”
Compliance risk and integration challengesFor investors willing to take the long view, compliance has become a major concern given Latin America’s struggles with corruption. Buyers are placing much greater emphasis on compliance due diligence and the risk of succession liability has scared off some investors altogether.
“In Brazil, compliance is the name of the game at the moment,” says Anna Mello, an M&A partner at Trench Rossi e Watanabe, a Brazilian firm with a cooperation agreement with Baker & McKenzie. “We have to structure deals in a way that mitigates compliance risk, which is not easy to do and makes the transactions more complex.”
Because of these concerns, private equity firms are likely to drive more deals in the coming year, as they are often willing to assume

more risk than other acquirers. Many are also accustomed to making investments under less-than-ideal circumstances.
“We view private equity as a countercyclical factor in Latin America because they are serial dealmakers, with finite investment periods, who are obligated to do deals one way or the other,” Trujillo says.
Despite the opportunities for outside investors, intra-regional M&A activity totaled just 60 deals worth US$7.1bn during 2015/16 — less than half of the 136 deals worth US$11.5bn pursued by EU buyers and 132 deals worth US$23.8bn from North America.
Part of the slow intra-regional deal flow is the result of more Brazilian companies sticking closer to home and consolidating with competitors to weather the economic and political crisis. Another factor is the way the countries interact.
“Latin America is one of the least integrated regions in the world economically,” Trujillo says. “One of the things most of us have in common is our language but then the biggest jurisdiction speaks another language.”
Middle class motivatorsAlthough inbound investment in Latin America dropped 50% in 2015, deal values in the first quarter of this year rose to US$8.3bn, up 70% from Q1 2015. A major draw for foreign investors is Latin America’s fast growing middle class, the result of the commodities boom prior to the recent slump.
The World Bank estimates that close to half of Latin America’s population will qualify as middle class by 2030, a shift that is already changing the focus of M&A activity.
2015 – 2016 CROSS-BORDER M&A WITH LATIN AMERICA TARGET (BY BIDDER/TARGET REGION)
EU 67 (5.84)
15 (0.72)
13 (1.95)
18 (2.76)
14 (0.22)
3 (0.04)
6 (0.01)
136 (11.54)
North America 66 (11.94)
12 (1.31)
22 (4.26)
8 (1.06)
13 (5.19)
10 (0.03)
1 132 (23.79)
Latin America 8 (1.86)
18 (1.03)
3 (0.40)
6 (1.57)
10 (0.18)
6 (1.66)
9 (0.40)
60 (7.11)
Asia-Pacific 30 (4.86)
6 (0.34)
7 (0.73)
6 (0.22)
2 (0.01)
1 52 (6.16)
Other Europe 12 (0.50)
2 2 2 (0.42)
1 19 (0.92)
Middle East 2 (0.19)
1 1 (2.30)
1 5 (2.49)
Total185 (25.19)
54 (3.40)
48 (9.65)
40 (6.03)
39 (5.59)
21 (1.74)
17 (0.41)
404 (52.01)
7050305 1020 15
Brazil
Other L
atin A
merica
Mexico
Chile
Colombia
Peru
Argen
tina
Total
Bid
der
Regi
on
Target Region
Volume (Value US$bn)
Volume
Baker & McKenzie Cross-Border M&A Index Q1 2016 | 9
EYE ON THE FUTURE
Three key trends to watch
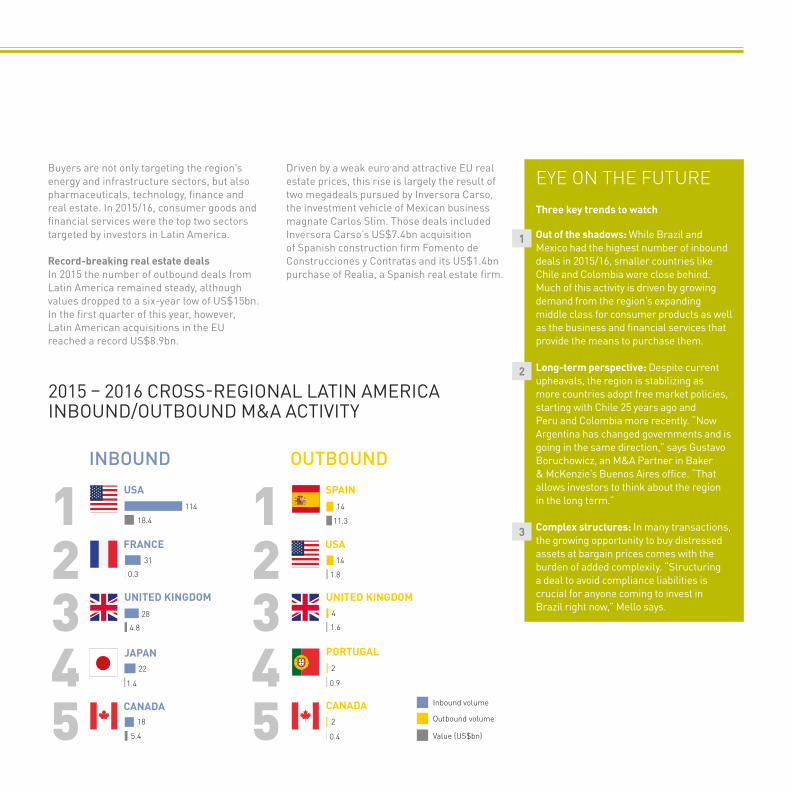
Out of the shadows: While Brazil and Mexico had the highest number of inbound deals in 2015/16, smaller countries like Chile and Colombia were close behind. Much of this activity is driven by growing demand from the region’s expanding middle class for consumer products as well as the business and financial services that provide the means to purchase them.
Long-term perspective: Despite current upheavals, the region is stabilizing as more countries adopt free market policies, starting with Chile 25 years ago and Peru and Colombia more recently. “Now Argentina has changed governments and is going in the same direction,” says Gustavo Boruchowicz, an M&A Partner in Baker & McKenzie’s Buenos Aires office. “That allows investors to think about the region in the long term.”
Complex structures: In many transactions, the growing opportunity to buy distressed assets at bargain prices comes with the burden of added complexity. “Structuring a deal to avoid compliance liabilities is crucial for anyone coming to invest in Brazil right now,” Mello says.
Buyers are not only targeting the region’s energy and infrastructure sectors, but also pharmaceuticals, technology, finance and real estate. In 2015/16, consumer goods and financial services were the top two sectors targeted by investors in Latin America.
Record-breaking real estate dealsIn 2015 the number of outbound deals from Latin America remained steady, although values dropped to a six-year low of US$15bn. In the first quarter of this year, however, Latin American acquisitions in the EU reached a record US$8.9bn.
2015 – 2016 CROSS-REGIONAL LATIN AMERICA INBOUND/OUTBOUND M&A ACTIVITY
USA
FRANCE
UNITED KINGDOM
JAPAN
SPAIN
USA
UNITED KINGDOM
PORTUGAL
INBOUND OUTBOUND
14
11.3
114
18.4
2
0.9
2
0.4
4
1.6
14
1.8
31
0.3
28
4.8
22
1.4
Inbound volume
Outbound volume
Value (US$bn)
CANADA CANADA18
5.4
12345
12345
Value US$bn
Driven by a weak euro and attractive EU real estate prices, this rise is largely the result of two megadeals pursued by Inversora Carso, the investment vehicle of Mexican business magnate Carlos Slim. Those deals included Inversora Carso’s US$7.4bn acquisition of Spanish construction firm Fomento de Construcciones y Contratas and its US$1.4bn purchase of Realia, a Spanish real estate firm.
1
2
3
12
34
5
6
7
Disposals — those involving the separation of highly integrated businesses or business activities spread across multiple jurisdictions — are complex and difficult to achieve. The team needs to package the business and present it to bidders in a way that allows the price to be maximized. They also need to be able to implement the sale and the separation with certainty and on time, thereby avoiding unexpected problems. This requires a careful and holistic approach to planning with advisors experienced in best practice for carve-outs.
There are well developed carve-out techniques that can be deployed to break the complexities down into an efficient and manageable process. Using these techniques will enable you to obtain best value on the sale while also delivering deal certainty on a rapid timetable and holding on to the value in the retained business.
In highly integrated companies, it is often the case that the target business is largely dependent on the retained business (or vice versa), whether for products, R&D, testing, administrative services or shared locations. An essential part of the sales process is identifying and addressing these needs at an early stage and building them into the process.
These are the key features of a sales process applying best practice carve-out techniques:
Understanding the needs of different types of buyers as regards stand-alone functionality of the target business versus integration of the target business into the buyer’s group.
Understanding the stakeholders in the carve-out and the dependencies of the process on their collaboration: suppliers and customers, landlords, licensors and R&D partners, local management and employees, works councils, unions and regulators.
Deciding which parts of the carve-out will be implemented prior to the sale transaction and which parts will be implemented during the transaction, potentially in dialogue with the buyer.
Preparing an accessible plan for the separation and sale. This will: set out the transfers required on a function by function and country
Maximizing value in complex disposals
5 SPOTLIGHT:CARVE-OUTS
How carve-out techniques can help you deliver the best deal, by Peter Strivens (M&A Partner, Baker & McKenzie, London) and Dr. Florian Kaestle (M&A Partner, Baker & McKenzie, Frankfurt)
by country basis; be clear and comprehensive to inspire confidence in buyers; include sufficient detail to allow buyers to quantify the risks and bid a full price; retain sufficient flexibility to accommodate buyers with differing needs; and create certainty the deal can be delivered on time.
The plan should address the deal dynamics and needs of potential buyers, efficient tax structures for the seller and buyers, the headcount spread of the target business, real estate requirements, employee benefits, consultations and transfer techniques for employees, IP allocation and consent requirements regarding authorities and third parties. It should also address the separation of financing arrangements, in particular cash pooling, and the cash extraction steps that may be required to deliver a debt free/cash free target.
The plan should be used both to facilitate the buyer’s due diligence and to feed into precisely targeted deal documentation. This common understanding will allow rapid and effective negotiation of deal documents. It will minimize the risk for buyers and allow a competitive sale process to maximize value. This will allow the deal documentation to be negotiated with precision about allocation of costs and risks. It will enable the buyer to avoid value leakage at the end of the deal. It will also minimize the risk of an extended pre-closing period and allow the seller to negotiate with certainty the arrangements for closing.
Using the plan as a template for the closing process coupled with an effective use of project management techniques will allow the transaction to be closed in the minimum period of time.
Setting up the separation plan requires the right balance of central management and local buy-in. Too much centralization can be as damaging as too much independence of the local function owners. A sophisticated communication process that makes the local function owners co-owners of the project is key.
This approach will minimize the risk of discovering new issues and problems in the course of implementation, which are a frequent cause of delay and value leakage. A well managed implementation process will be flexible and allow commercial solutions to be properly vetted while minimizing delays to the project timeline.
Baker & McKenzie Cross-Border M&A Index Q1 2016 | 11
Baker & McKenzie is the No. 1 cross-border M&A firm. Over the last 10 years we have completed more cross-border M&A transactions than any other law firm. In addition, it is the tenth year in a row the firm has been ranked No. 1 for deals involving emerging markets. With more than 1,300 M&A lawyers in 77 offices globally, we have one of the largest and most active M&A practices in the world.
© 2016 Baker & McKenzie. All rights reserved. Baker & McKenzie International is a Swiss Verein with member law firms around the world. In accordance with the common terminology used in professional service organizations, reference to a “partner” means a person who is a partner, or equivalent, in such a law firm. Similarly, reference to an “office” means an office of any such law firm.
This may qualify as “Attorney Advertising” requiring notice in some jurisdictions. Prior results do not guarantee a similar outcome.
THE LEADING CROSS-BORDER FIRMwww.bakermckenzie.com/crossbordermaindex