Embed Size (px)
DESCRIPTION
Cross-Border Philanthropy. Hudson Institute Charities Aid Foundation. Presentation Agenda. Yulya Spantchak – Hudson Institute, Center for Global Prosperity Jane Arnott – Charities Aid Foundation - PowerPoint PPT Presentation
Citation preview
Cross-Border Philanthropy
Hudson InstituteCharities Aid Foundation
Presentation Agenda• Yulya Spantchak – Hudson Institute, Center for
Global Prosperity
• Jane Arnott – Charities Aid Foundation
• Panel – Tao Ze, China Foundation Center; Fiona Budd CAF Southern Africa, Paula Jansco Fabiani, IDIS Brazil
• Conclusion
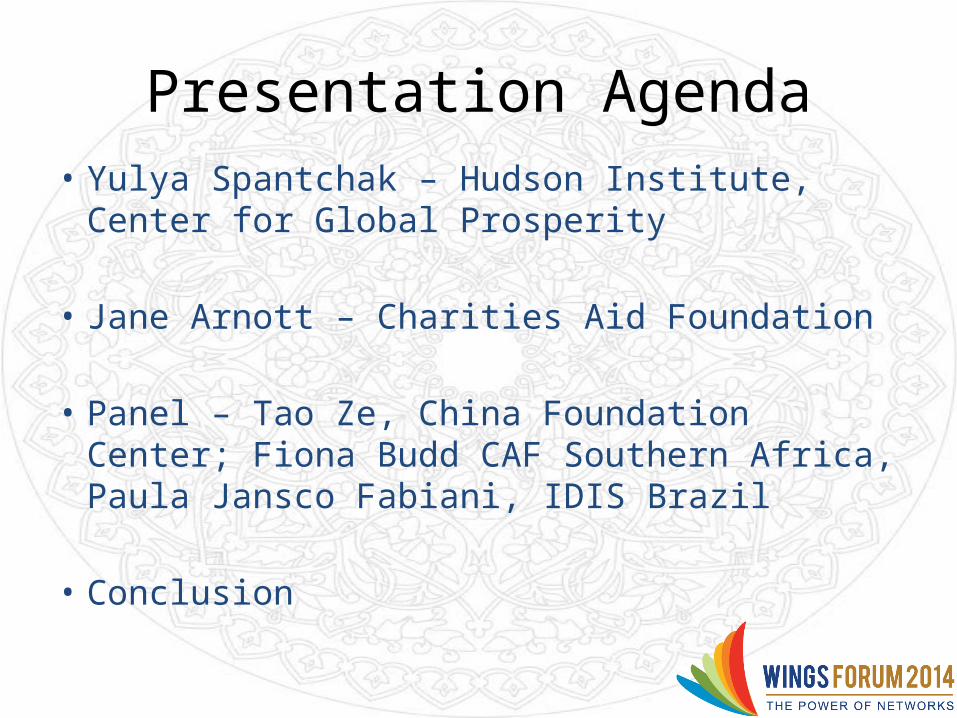
Center for Global Prosperity’s Research Focus
• Index of Global Philanthropy and Remittances
• Measures International Philanthropy to from Donor and Emerging Economies to Developing Countries
• Provides a More Complete Picture of Economic Engagement by Reporting on Investment, Remittances, Philanthropy and ODA.
• Index of Philanthropic Freedom
• Assesses the Barriers and Incentives for Philanthropy
• Includes indicators on CSO Regulation, Tax Policy, and Cross-Border Flows.
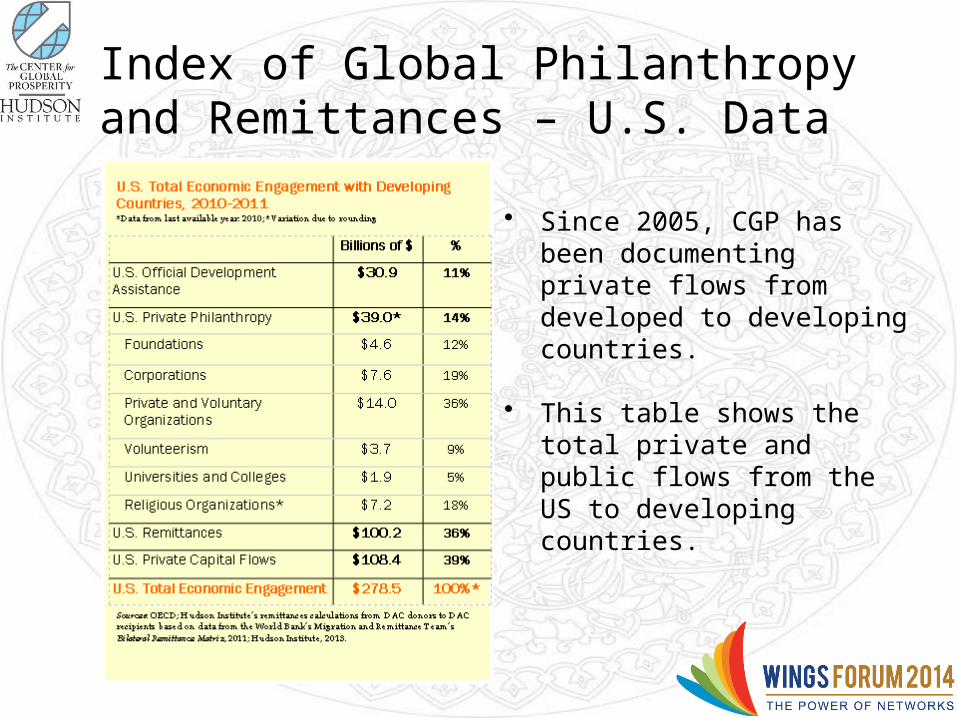
Index of Global Philanthropy and Remittances – U.S. Data
• Since 2005, CGP has been documenting private flows from developed to developing countries.
• This table shows the total private and public flows from the US to developing countries.
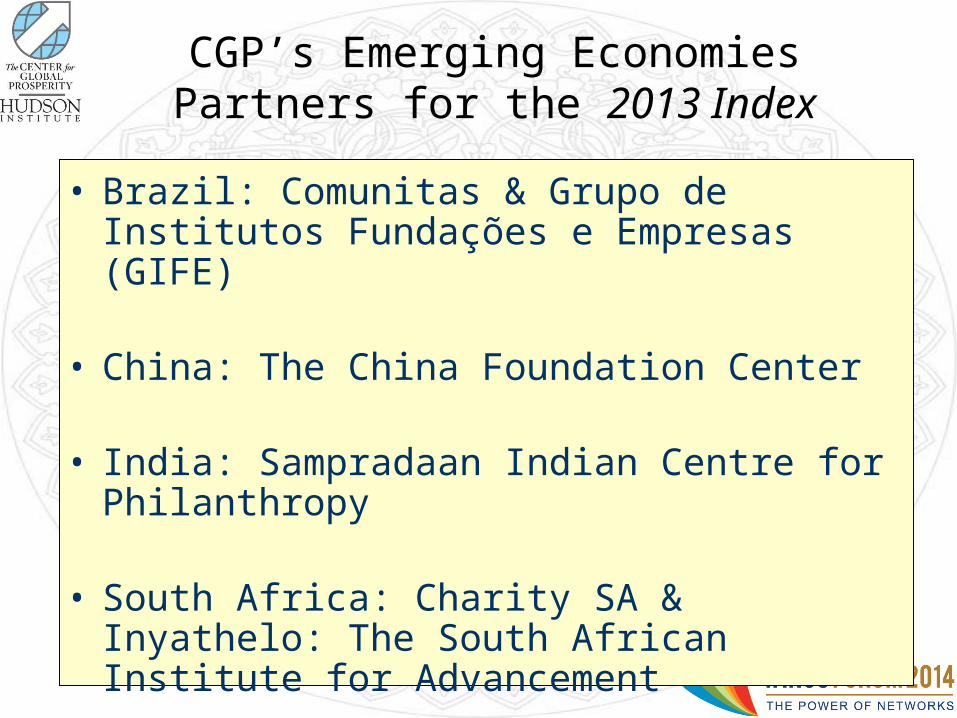
CGP’s Emerging Economies Partners for the 2013 Index
• Brazil: Comunitas & Grupo de Institutos Fundações e Empresas (GIFE)
• China: The China Foundation Center
• India: Sampradaan Indian Centre for Philanthropy
• South Africa: Charity SA & Inyathelo: The South African Institute for Advancement
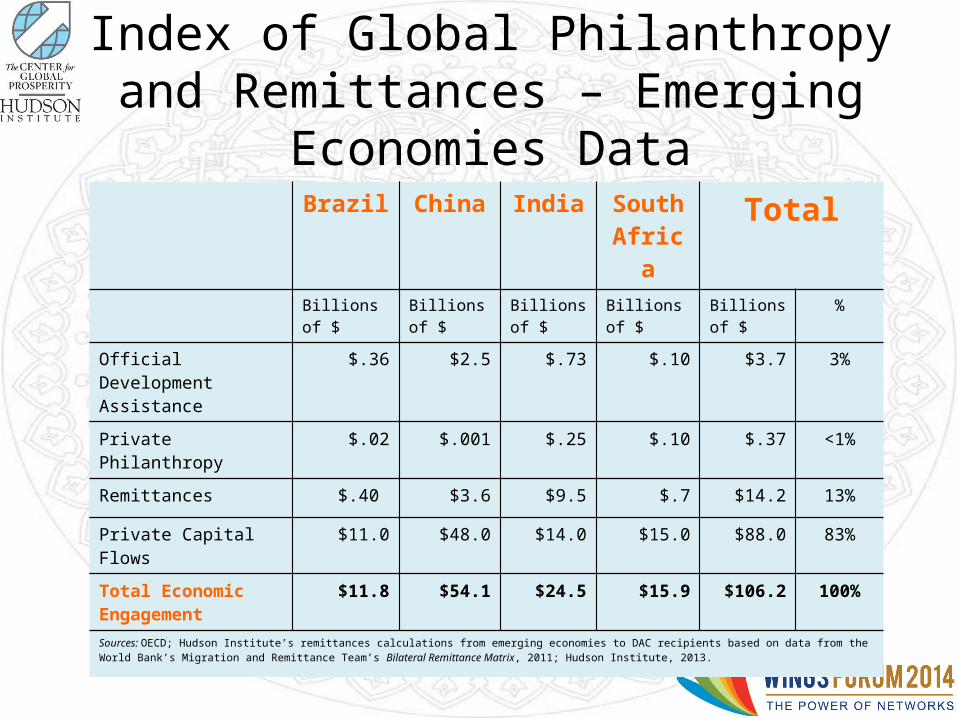
Index of Global Philanthropy and Remittances – Emerging Economies Data
Brazil China India South Africa
Total
Billions of $ Billions of $ Billions of $ Billions of $ Billions of $ %
Official Development Assistance
$.36 $2.5 $.73 $.10 $3.7 3%
Private Philanthropy $.02 $.001 $.25 $.10 $.37 <1%
Remittances $.40 $3.6 $9.5 $.7 $14.2 13%
Private Capital Flows $11.0 $48.0 $14.0 $15.0 $88.0 83%
Total Economic Engagement
$11.8 $54.1 $24.5 $15.9 $106.2 100%
Sources: OECD; Hudson Institute’s remittances calculations from emerging economies to DAC recipients based on data from the World Bank’s Migration and Remittance Team’s Bilateral Remittance Matrix, 2011; Hudson Institute, 2013.
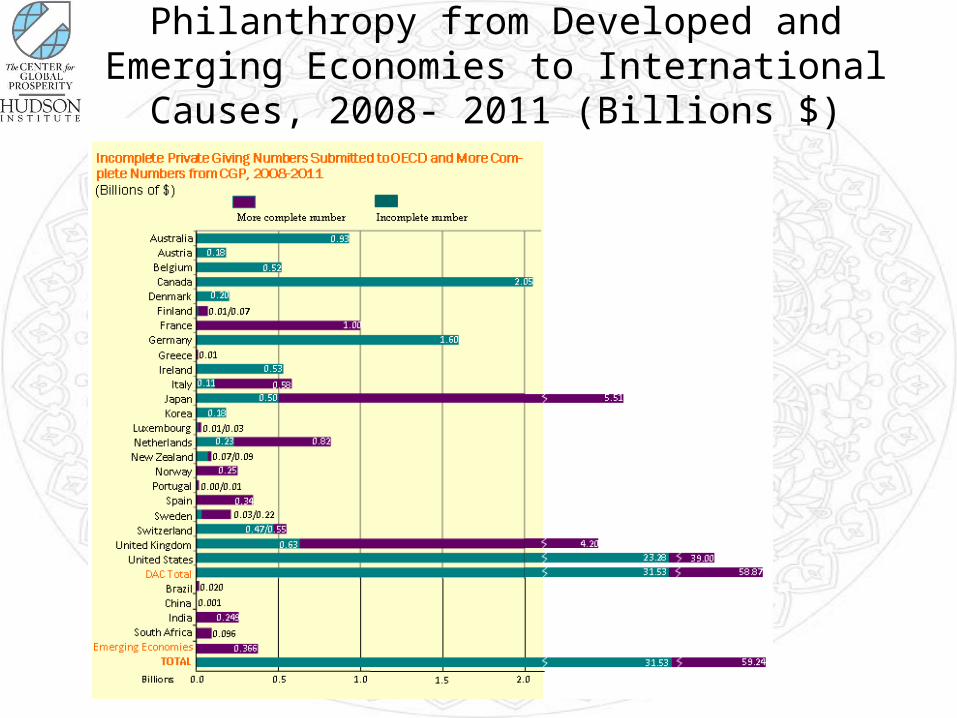
Philanthropy from Developed and Emerging Economies to International Causes, 2008- 2011 (Billions $)
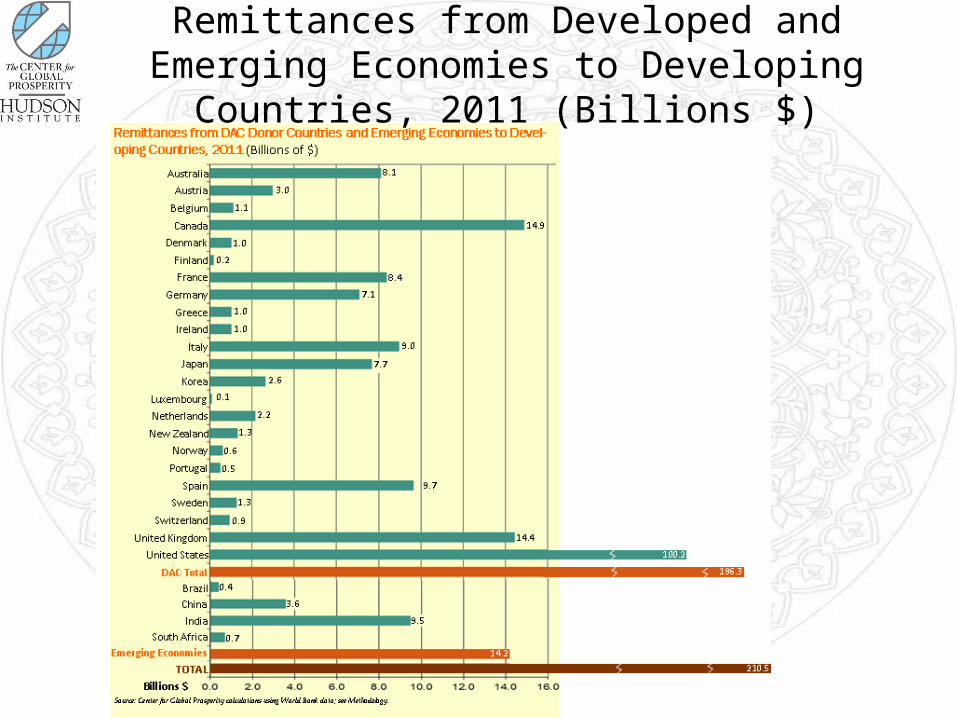
Remittances from Developed and Emerging Economies to Developing Countries, 2011 (Billions $)
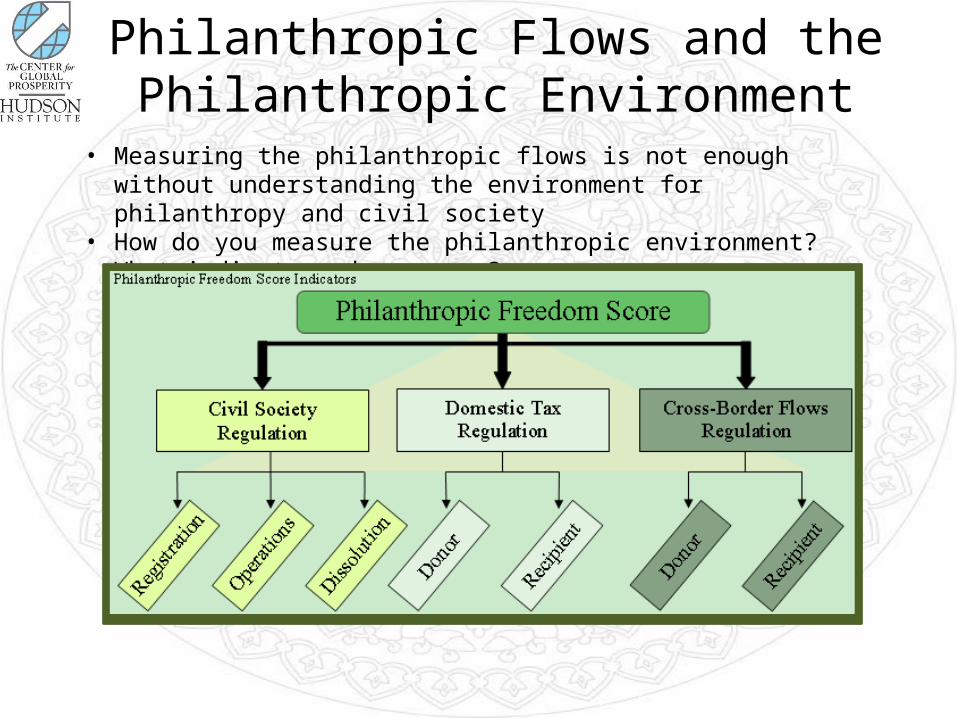
Philanthropic Flows and the Philanthropic Environment
• Measuring the philanthropic flows is not enough without understanding the environment for philanthropy and civil society
• How do you measure the philanthropic environment? What indicators do you use?
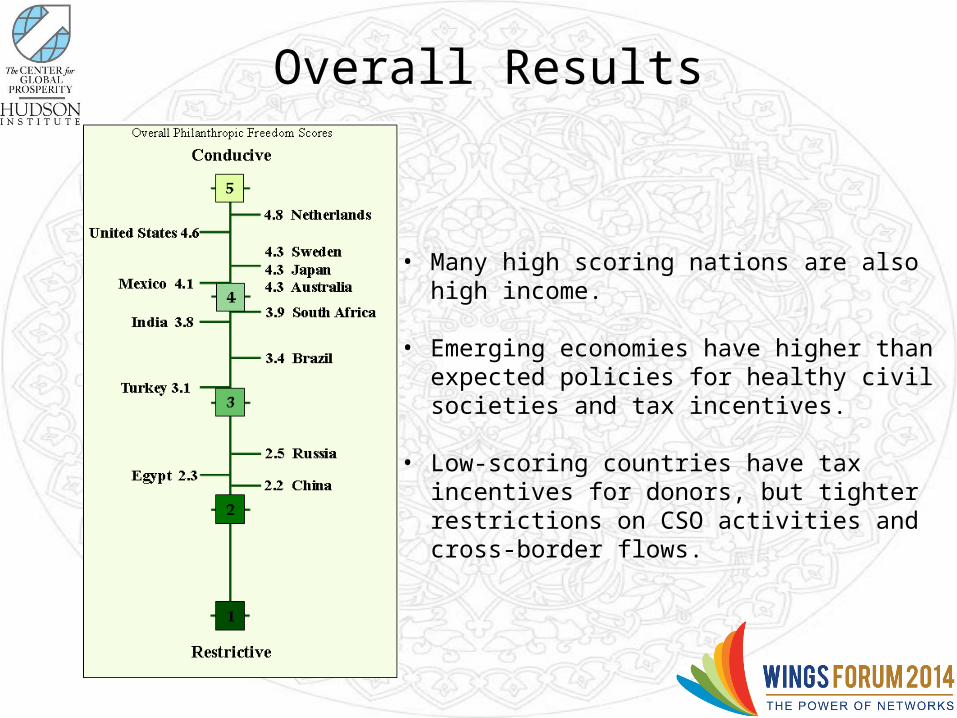
• Many high scoring nations are also high income.
• Emerging economies have higher than expected policies for healthy civil societies and tax incentives.
• Low-scoring countries have tax incentives for donors, but tighter restrictions on CSO activities and cross-border flows.
Overall Results
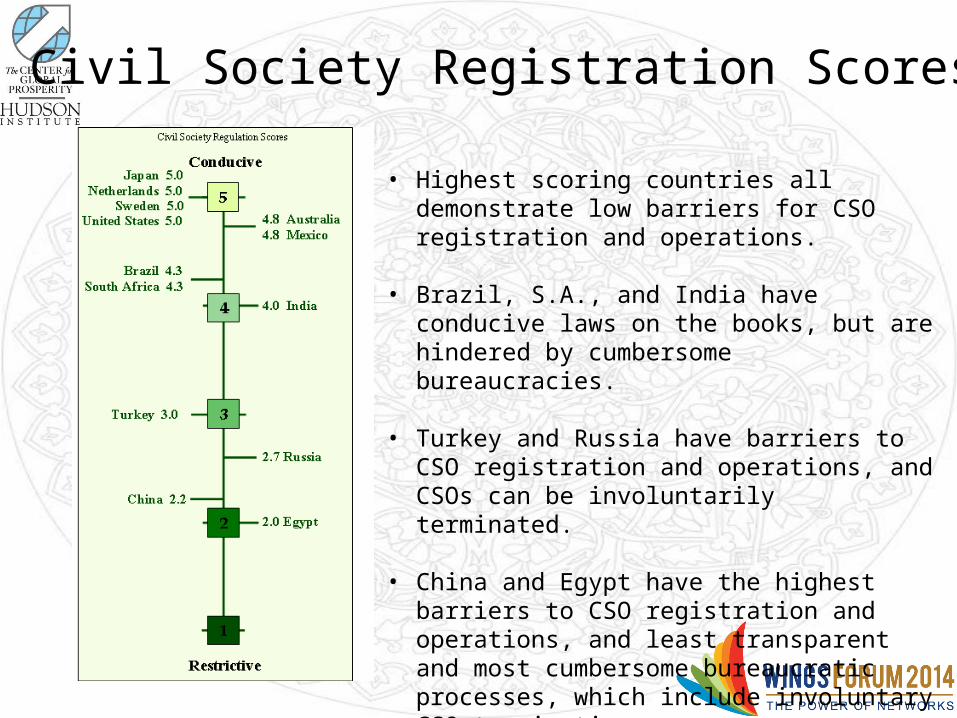
Civil Society Registration Scores
• Highest scoring countries all demonstrate low barriers for CSO registration and operations.
• Brazil, S.A., and India have conducive laws on the books, but are hindered by cumbersome bureaucracies.
• Turkey and Russia have barriers to CSO registration and operations, and CSOs can be involuntarily terminated.
• China and Egypt have the highest barriers to CSO registration and operations, and least transparent and most cumbersome bureaucratic processes, which include involuntary CSO termination.
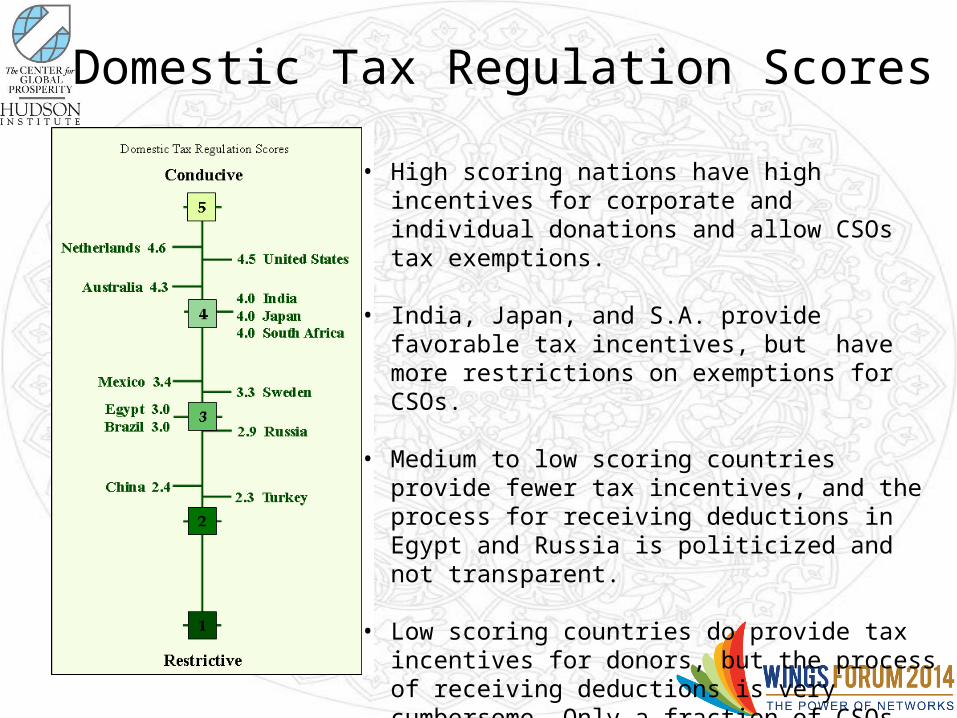
Domestic Tax Regulation Scores
• High scoring nations have high incentives for corporate and individual donations and allow CSOs tax exemptions.
• India, Japan, and S.A. provide favorable tax incentives, but have more restrictions on exemptions for CSOs.
• Medium to low scoring countries provide fewer tax incentives, and the process for receiving deductions in Egypt and Russia is politicized and not transparent.
• Low scoring countries do provide tax incentives for donors, but the process of receiving deductions is very cumbersome. Only a fraction of CSOs receive tax exemptions.
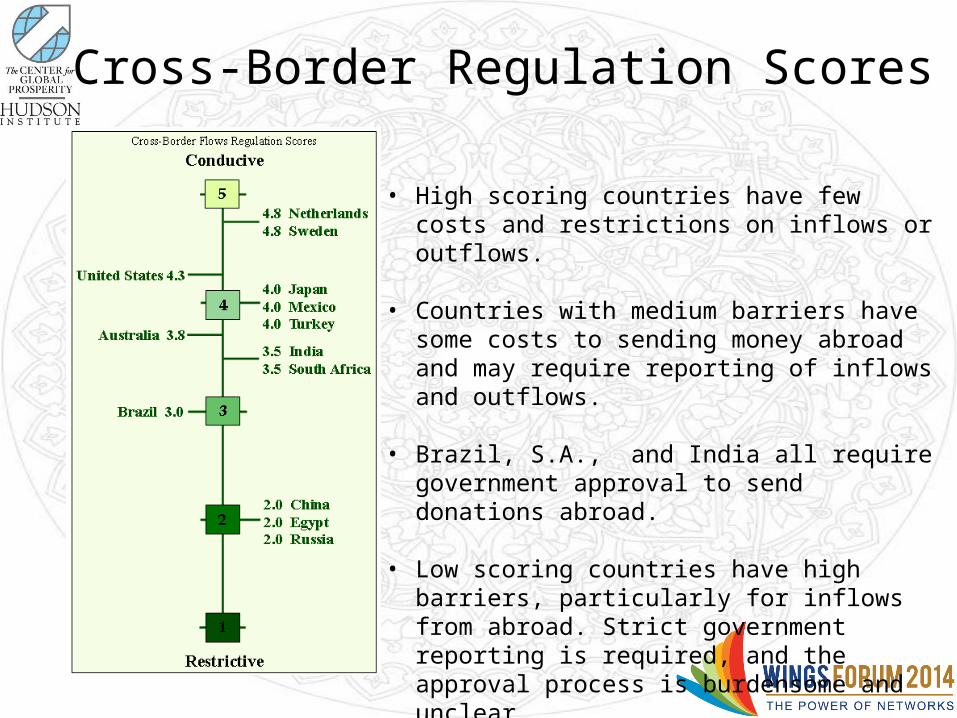
Cross-Border Regulation Scores
• High scoring countries have few costs and restrictions on inflows or outflows.
• Countries with medium barriers have some costs to sending money abroad and may require reporting of inflows and outflows.
• Brazil, S.A., and India all require government approval to send donations abroad.
• Low scoring countries have high barriers, particularly for inflows from abroad. Strict government reporting is required, and the approval process is burdensome and unclear.
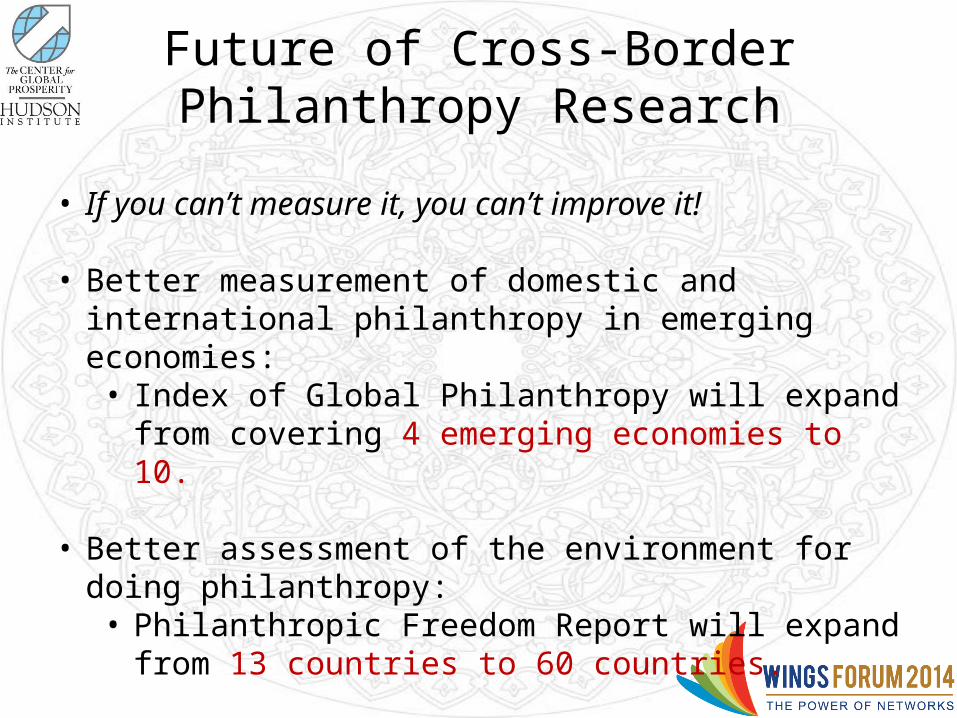
Future of Cross-Border Philanthropy Research
• If you can’t measure it, you can’t improve it!
• Better measurement of domestic and international philanthropy in emerging economies:
• Index of Global Philanthropy will expand from covering 4 emerging economies to 10.
• Better assessment of the environment for doing philanthropy:• Philanthropic Freedom Report will expand from 13 countries
to 60 countries.
Cross border philanthropy: In practiceJane Arnott, Head of the Global Alliance
Charities Aid Foundation
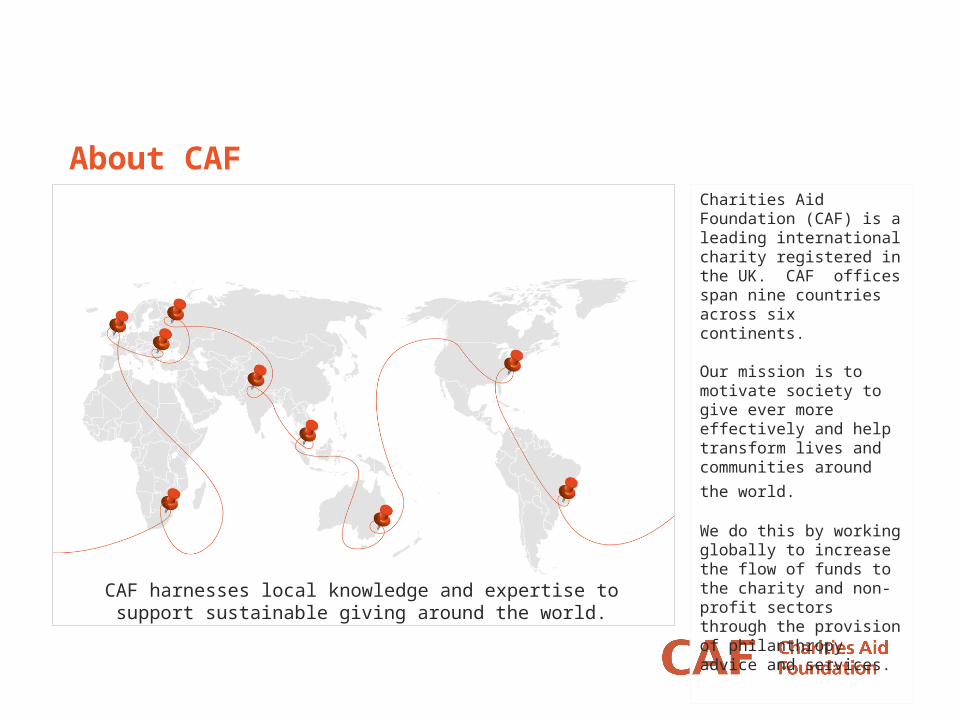
About CAFCharities Aid Foundation (CAF) is a leading international charity registered in the UK. CAF offices span nine countries across six continents.
Our mission is to motivate society to give ever more effectively and help transform lives and communities around the world.
We do this by working globally to increase the flow of funds to the charity and non-profit sectors through the provision of philanthropy advice and services.
CAF harnesses local knowledge and expertise to support sustainable giving around the world.
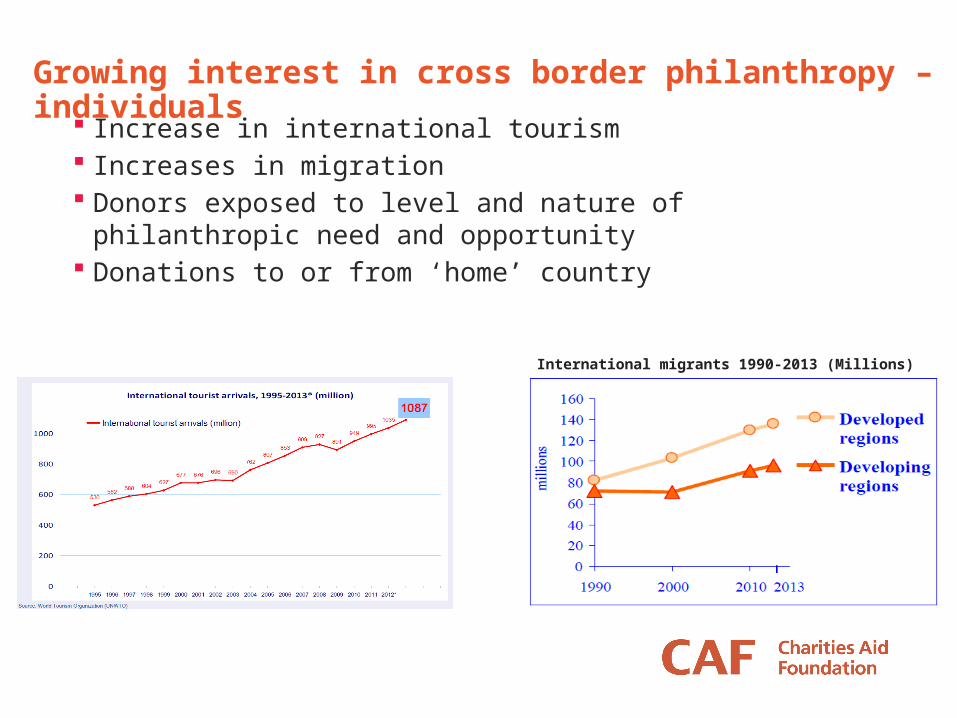
Growing interest in cross border philanthropy – individuals Increase in international tourism Increases in migration Donors exposed to level and nature of philanthropic need and
opportunity Donations to or from ‘home’ country
International migrants 1990-2013 (Millions)
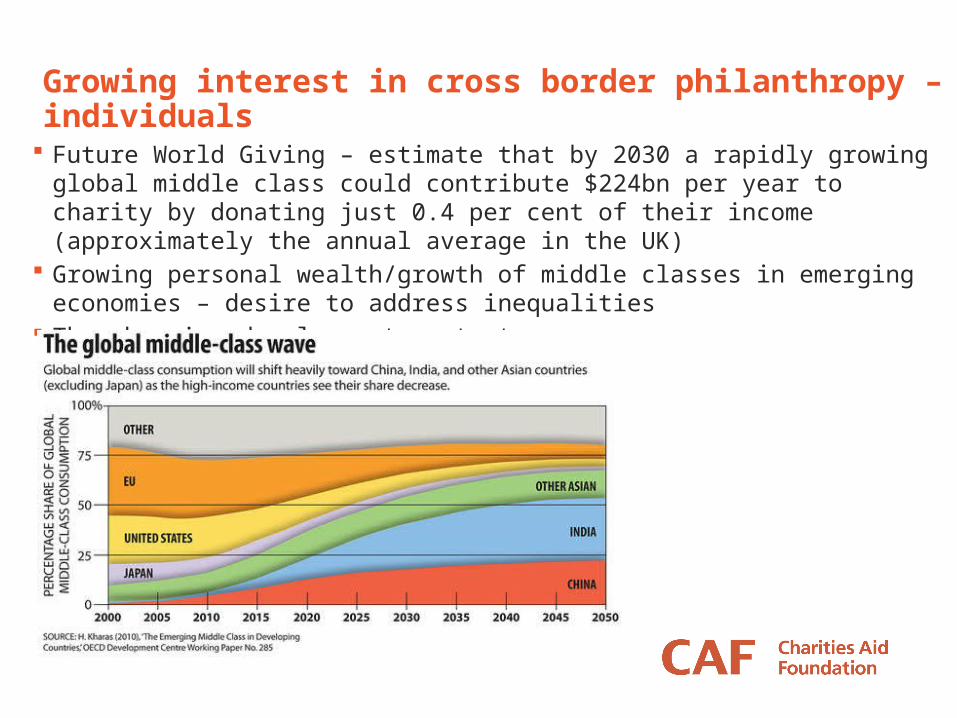
Growing interest in cross border philanthropy – individuals
Future World Giving – estimate that by 2030 a rapidly growing global middle class could contribute $224bn per year to charity by donating just 0.4 per cent of their income (approximately the annual average in the UK)
Growing personal wealth/growth of middle classes in emerging economies – desire to address inequalities
The changing development context
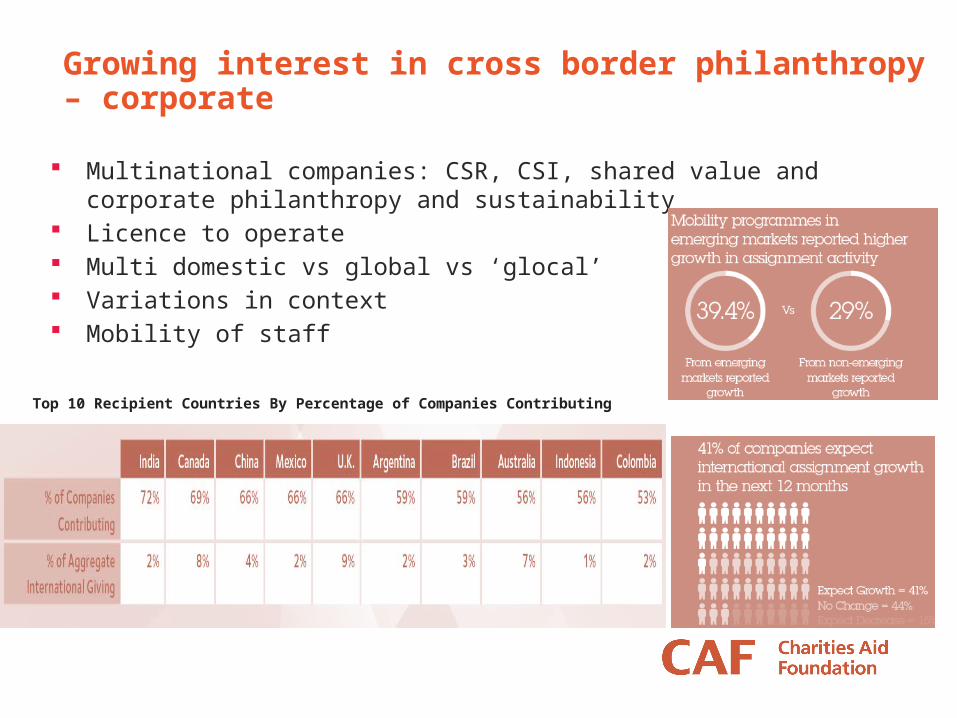
Growing interest in cross border philanthropy – corporate
Multinational companies: CSR, CSI, shared value and corporate philanthropy and sustainability
Licence to operate Multi domestic vs global vs ‘glocal’ Variations in context Mobility of staff
Top 10 Recipient Countries By Percentage of Companies Contributing
Trends in cross border philanthropy
Legislation for corporates and its influence on giving in different countries Second generation wealthy – influence of education and travel on
philanthropic approaches Entrepreneurial wealth – different models of philanthropy Web based fundraising that is ‘borderless’
Challenges to global philanthropy
Restrictions in transfer of funds across borders Brazil
Restrictions in the availability of tax benefits for cross border charitable donations India, Australia
Restrictions on receipt of foreign funds Kenya, Russia, Sudan
Still a strong desire to address domestic issues Lack of trust in institutions to spend funds effectively Emerging civil societies – lack capacity to receive donated funds
How CAF does it
Cross border donors vs cross border fundraising £85m/$141m in tax efficient trans-national donations via CAF in UK and
America in 2012-13 Transnational Giving Europe Validation for tax efficient giving AML checks on donors Engage donors across offices Friends of Funds
PANEL DISCUSSIONCross border philanthropy
Cross border philanthropy: panel
Paula Jansco Fabiani Executive DirectorIDIS (Brazil)
Fiona Budd Client Relations ManagerCAF Southern Africa
Tao Ze Director China Foundation Center