Embed Size (px)
Citation preview

Report on Study of the feasibility of investigating any potential relationship between the supply of discoloured water and gastrointestinal illness Part 1: A critical literature review Part 2: A proposed study design Clarence Tam, Craig Higgins, Andrea Mann, Wolf-Peter Schmidt and Laura C Rodrigues, from the London School of Hygiene and Tropical Medicine and C. William Keevil, from the University of Southampton Contract number DWI 70/02/169 November 2005

Contents
Critical review
Executive summary………………………………………………………………………1
Background………………………………………………………………………………3
Questions addressed by the review………………………………………………………4
Review Methods…………………….……….……..………………………………….....5
Details of included and excluded studies….…………………………………………….8
Results of the review……………………….…………………………………………….8
Discussion……………………………………………………………………………....27
Conclusions………….…………………...………….………………………………….30
Tables………………….…………………………….…………………………………..32
Acknowledgements……………………....…………..………………………………….40
Conflicts of interest…………………………………..…………………………………40
References…………………………….……………..…………………………………..40
Annexes………………………………..……………..………………………………….43
Study proposal
Background…………………………………………………………………………….52
Overview of project structure………….……………………………………………….53
Part I: Study of discolouration using routine health databases…………………...…54
Part II: Survey of the effect of new discolouration incidents. …………………..……64
Timeframe of study……………..…………………………………………………..……68
2

Ethical considerations……...……………………………………………………..……..70
Annexes………………………..…………………………………………………………71
References ……………………..……………………………………………….………..85
Acknowledgements……………..……………………………………………….……….86
3

Critical review of the literature on the association between water discolouration and acute
gastrointestinal illness in settings relevant to the United Kingdom
Executive Summary
Background It is not clear whether events resulting in a sudden obvious discolouration of the
water supply could result in an increase in the risk of gastrointestinal illness among those
exposed. The reviewers were commissioned by the Drinking Water Inspectorate to evaluate the
available evidence relevant to the potential association between drinking water discolouration at
point of use and risk of acute gastrointestinal illness. The purpose of this review is to assess the
existing evidence, to make recommendations regarding the need for a further study in England
and Wales, and to inform the design of such a study.
Questions Addressed by the Review This review sought to find evidence relevant to a UK setting
of an association between discoloured tap water and the risk of acute gastrointestinal illness and
to determine what proportion of acute gastrointestinal illness in England and Wales might be
attributable to exposure to discoloured water.
Review Methods The reviewers identified peer reviewed research from structured searches of
databases, and non-peer reviewed research from relevant websites. Studies were included in the
review if they addressed the question of the association between discolouration of a public water
supply in a setting relevant to the United Kingdom and risk of acute gastrointestinal illness.
Eligible papers were assessed independently by two reviewers in terms of appropriateness of the
study design and analysis, results, interpretation, and the overall quality of the paper.
1

Results of the Review Time-series studies investigating the effect of temporal variations in
turbidity at the treatment plant and subsequent incidence in acute gastrointestinal illness were the
only category of studies reviewed deemed sufficiently rigorous to be informative; in general these
studies provided evidence of an increase in acute gastrointestinal illness at varying lags following
days of high turbidity (range 3 to 29 days). One study investigating the effect of turbidity at point
of use was identified, but was judged to be insufficiently rigorous to be informative.
Discussion No studies were identified in this review that specifically addressed the issue of water
discolouration incidents and their effect on the risk of acute gastrointestinal illness. With the
exception of contamination with highly toxic metals, we have found no evidence that water
discolouration at point of use is associated with acute gastrointestinal illness. Only one poor-
quality study identified in this review measured water quality at point of use and this study found
no association. Most studies identified in this review investigated the effect of variations in
turbidity within normal limits at point of treatment or water treatment works final water. These
studies address a fundamentally different hypothesis and their results cannot be used to assess the
likely effect of water discolouration at point of use. In order to establish whether there is an
association between discolouration events and risk of acute gastrointestinal illness in the United
Kingdom setting, an epidemiological study specifically designed to address this question would
be needed.
Conclusions There is some evidence that increases in turbidity of final water are associated with
subsequent increases in the incidence of acute gastrointestinal illness at varying lags. Lags of
between 4 and 13 days were commonly reported. A peak in acute gastrointestinal illness at
certain lags following days of high final water turbidity was consistently found across studies.
This association is unlikely to be the result of measurement error, bias or random error and
warrants further investigation. The potential for residual confounding (due to inadequate
2
adjustment for time-varying confounding factors such as seasonal effects, temperature and
precipitation) in these studies remains unclear. Further methodological work in this area could
clarify this issue. No evidence was found as to whether turbidity levels at point of use- in the
absence of increased turbidity at the treatment plant- increase the risk of acute gastrointestinal
illness.
Background
Forty-four incidents of discoloured water affecting approximately 1.4 million people were
reported in 2003 to the Drinking Water Inspectorate of England and Wales (DWI), based on
complaints from members of the public (1). This was down from 95 such incidents reported in
1999. Most of these incidents involved concomitant increases in turbidity far above the threshold
of action of 4 Nephelometric Turbidity Units (NTU). Discolouration of tap water can be caused
by the disturbance of sediment, particularly corrosion products, within the distribution systems.
Poor control of the distribution system and ingress into the distribution system may coincide with
presence of gastrointestinal bacterial species such as Salmonella, Campylobacter, Shigella or
toxigenic strains of E. coli, or the parasites Giardia or Cryptosporidium that transiently pass
through the system.
The reviewers were commissioned by the DWI to write a study proposal investigating the
potential association between incidents of drinking water discolouration at point of use and risk
of acute gastrointestinal (GI) illness. The purpose of this review is to evaluate the existing
evidence in order to establish what is known on this topic, to make recommendations regarding
the need for a further study addressing this issue in England and Wales, and to inform the design
of the proposed study.
3

Several databases of published literature were searched using a specific search strategy; websites
of key organisations were searched for unpublished studies. Researchers and professionals in the
field of water research were contacted for information on any other studies not identified by the
reviewers. Potentially relevant studies were assessed by two independent reviewers (CT, AM).
Based on this critical appraisal, the evidence for an association between water discolouration and
risk of acute GI illness was evaluated. Findings of the review were summarised and
recommendations made as to the need for and design of the proposed study.
Questions Addressed by the Review
The central question addressed by this review was the following: is there evidence relevant to a
United Kingdom (UK) setting of an association between discoloured tap water and the risk of
acute GI illness and, if so, what proportion of acute GI illness in England and Wales could be
attributed to exposure to discoloured water? This question can be further broken down as follows:
What published peer-reviewed or non-peer-reviewed literature exists about the potential
association between water discolouration and acute GI illness?
•
•
•
What is the evidence for or against an association?
What is the quality of this evidence?
The results of the review were used to make recommendations about the need for a further study
in a UK setting, as well as to guide the design of any such study should one be deemed necessary
by the DWI.
4

Review Methods
Study selection
The review included studies that investigated the effect of exposure to some aspect of
discolouration of drinking water from a treated public water supply (i.e. not a private well) on the
risk of acute GI illness in the population(s) served by the affected supply. Studies were
considered eligible if they met the following criteria:
1. They were conducted in a setting relevant to the UK in terms of water supply
infrastructure and incidence and aetiology of acute GI illness (namely Europe, North
America, and Australia).
2. The exposure was defined as some aspect of discolouration of the water supply at any
point in the distribution system (i.e. pre-treatment, leaving the treatment works (water
treatment works final water, or WTW final water), in transit (e.g. reservoirs), or at point
of use (tap water)). This included colour (defined either qualitatively (presence or
absence) or quantitatively using colour units) and turbidity, one possible aspect of
discolouration.
3. The outcome was defined according to symptoms associated with acute GI illness.
Reports of outbreaks of acute GI illness were excluded. In general, outbreak investigations are
triggered by increases in the incidence of acute GI illness over a short time-period. Reports of
such investigations are likely to comprise highly unusual events that are, by definition, associated
with illness, but are unlikely to be representative of breaches in water quality generally. A review
5
of outbreak reports would be biased, as investigations of events that are not associated with
illness are not generally conducted.
Data sources and search strategy
A number of key papers were identified in an initial exploratory phase of the review. These
papers were read and subject headings associated with each paper obtained by entering their
citations into the Pubmed database. A preliminary search strategy based on these subject
headings was conducted in Pubmed. In discussion with the study team, the strategy was modified
slightly (Annex A). Papers identified were initially categorised by setting: those not relevant to
the UK setting (as defined by the eligibility criteria above) were excluded at this stage. Abstracts
of remaining papers were read, a shortlist of potentially relevant papers generated, and the full
texts of these articles retrieved to determine whether or not they were eligible. The same
procedure was repeated in other key databases and on websites holding non-peer reviewed
publications (grey literature) (Annex A). A list of eligible studies was generated using this
process and the reference lists of these papers checked for further potentially relevant studies.
This process was repeated until no new papers were identified. At this time, the reviewers also
contacted, via email, a list of experts in the field of drinking water quality, as well as authors of
eligible studies identified, to request information on any other published or unpublished studies
relevant to the review (Annex C). At a later date, a separate search for papers related to a known
incident of aluminium contamination was performed and one additional study identified.
Study quality assessment
Salient points of eligible studies were summarised by one reviewer (AM). Each study was then
assessed by two independent reviewers (CT, AM) according to a list of criteria defined a priori
6

(Annex B). The results of these independent assessments were compared and summarised in text
form.
Data synthesis
We classified all studies according to whether discolouration/turbidity was measured at point of
treatment or point of use (in the latter case, provided that discolouration/turbidity readings at
point of treatment were within the range considered to be acceptable in that setting). We
classified all studies according to whether discolouration/turbidity was measured at point of
treatment or point of use (in the latter case, provided that discolouration/turbidity readings at
point of treatment were within the range considered to be acceptable in that setting). Studies were
then divided into two categories, according to whether the outcome was hypothesised to have a
microbial or chemical aetiology, and subdivided according to the specific research question
addressed and the study design. A number of studies in the microbial aetiology category all
addressed a similar question using similar methodology, but were subdivided into two groups
(Groups 1 and 2) according to the type of health outcome used. A further three studies in this
category all addressed different questions and had different designs, and so were reviewed
individually (Groups 3-5). Each group of studies was assessed according to four broad categories:
appropriateness of the study design and analysis, results and interpretation- including possible
alternative explanations for the results seen- and the overall quality of the paper.
7

Details of the included and excluded studies
Figure 1. Flow-diagram of process of identifying key papers.
Total number of citations identified after initial electronic search: Pubmed 3226 ORS, 7799 NORS, Embase 748 ORS, 1980 NORS, ASFA/IAMA 6265, Sigle 13 (n=20,031)
Potentially relevant citations after screening of electronic search: Pubmed 20 ORS, 2 NORS, Embase 8 ORS, 33 NORS, ASFA/IAMA 7, Sigle 10, Grey literature 9 (n=89)
Citations excluded after reading full-text revealed they did not meet inclusion criteria (n=72)
Key papers identified (n=16)
Citations excluded: MacKenzie 1994, Stirling 2001 (outbreak investigation reports) (2)
Papers included in critical review (14)
ORS = obviously relevant setting (to UK), NORS = not obviously relevant setting
ASFA = Aquatic Science and Fisheries Abstracts 3: Aquatic Pollution and Environmental
Quality
IAMA = Industrial and Applied Microbiological Abstracts (Microbiology A)
Results of the Review
A total of 14 studies were identified. The expert responses the reviewers received led to the
identification of two peer-reviewed publications (8,9) that were subsequently included in the
review (Annex C). Of the 14 studies included in the review, 12 were papers in peer-reviewed
scientific journals (3,5,6,8-16) and two were Health Canada reports (4,7). Eleven studies
measured discolouration/turbidity at point of treatment (3, 5-14) and one of these studies looked
additionally at turbidity at the tap (13); one study assessed pre-treatment turbidity (4). Two
additional studies assessed the association between copper contamination (15) and aluminium
8
contamination (16) causing discolouration of tap water. Of studies in which
discolouration/turbidity was measured at point of treatment, all dealt with an outcome of
hypothesised microbial aetiology.
We identified three studies in European or North American settings that investigated the
association between various aspects of water discolouration (turbidity, copper and aluminium
contamination respectively) at point of use and risk of acute GI illness (13,15,16). These studies
were of poor methodological quality and did not seek to assess the population impact of
discolouration (i.e. the proportion of acute GI illness in the population that could be attributed to
this exposure). With the exception of the study that assessed pre-treatment water turbidity (4), the
remaining studies investigated the putative association between drinking water turbidity leaving
the plant and acute GI illness (3, 5-12); one of these studies assessed WTW final water and tap
water turbidity, colour, free residual chlorine and iron (13).
Nine of the 11 studies using turbidity as the exposure employed time-series methodology; six of
these studies found a positive association between increases in WTW final water turbidity and
subsequent increases in incidence of acute GI illness at similar time lags (3,5,6,8,9,10). One study
found a positive effect of increased daily raw (pre-treatment) water turbidity and daily counts of
acute GI illness at the same lags (4). These significant results were found in different age groups,
including children and the elderly.
Seven of the 14 studies used hospital admissions for acute GI illness as the outcome (3-9). Two
studies additionally used physician visits (4,7). One study also included visits to long-term care
facilities for symptoms related to acute GI illness (7), seven used visits to accident and
9

emergency (A&E) departments and two included visits to hospital outpatient departments (6,9).
In all these cases, acute GI illness was defined on the basis of those ICD-9 codes most plausibly
associated with acute GI illness. One further study used A&E visits for putative acute GI illness,
but did not define these according to ICD-9 codes (13). Other outcome definitions used were
records of sales of prescription and non-prescription medications for acute GI illness (11), self-
reported illness from diaries or telephone surveys (10,13-16), frequency of bowel movements and
medication use at nursing homes (14), clinical specimens submitted to microbiology laboratories
for confirmation of suspected acute GI illness (12), and positive reports of laboratory-confirmed
acute GI illness (14).
Microbial aetiology (Table 1)
Group 1 (3-9)
This group of studies is relevant to the UK setting - the studies were all conducted in North
American cities with similar water distribution systems and where incidence and aetiology of GI
disease are likely to be comparable to those in the UK. All of these studies investigated the effect
of temporal variations in turbidity levels at point of treatment on incidence of acute GI illness in
the population served by the treatment plants. The studies were generally of good methodological
quality and their results were similar in terms of the magnitude of the associations seen and the
lag between exposure and disease.
Appropriateness of design and analysis
These studies all used time-series-adapted multivariable regression analysis, which the reviewers
judged to be an appropriate method of analysis for the questions addressed by the studies. Two
studies also used individual risk factor analysis (binomial Generalised Linear Modelling (GLM))
10

to assess temporal differences in exposure to turbidity levels between cases of acute GI illness
and controls with respiratory illness (4,7). The results of these individual level analyses were
consistent with those of the time-series analyses.
In time-series analysis, the population studied serves as its own control at different points in time.
Factors that do not change appreciably with time are thus unlikely to influence any observed
association between the exposure and the outcome. Only factors that display temporal variation
need be considered as potential confounders. These normally include long-term trends in
exposure and outcome, seasonal patterns and shorter-term systematic (non-random) variations.
The number of such factors, in addition to the exposure and outcome, included in regression
models varied between studies. Two studies included day of the week only (6,8), one study also
included season (9), while the studies performed in Philadelphia included in the base model terms
for long-term time trends, day of the week and temperature, adding season in the earlier of the
studies (3,5). In addition to the factors controlled for in the Philadelphia studies, the Canadian
studies added terms for precipitation and public holidays (4,7).
Results
Five of seven studies found a positive association between daily finished water turbidity and
daily counts of acute GI illness, measured as either relative risk or percent increase in illness for a
given increase in turbidity at similar lags (3,5,6,8,9); an association in the same direction and of
similar magnitude was found in the study of pre-treatment, raw water turbidity (4). Four studies
found a significant association between daily WTW final water turbidity and daily counts of
acute GI illness at lags of between 4 and 13 days, (3,5,8,9). The study that assessed the
11

association between daily fluctuations in raw (pre-treatment) water turbidity and daily counts of
illness (4) recorded significant lags at between 3 and 29 days.
Heterogeneity between these studies may be explained by variation in the time between turbid
water leaving the treatment plant and reaching the consumer (a characteristic of the water
distribution system), variation in incubation periods in different settings (either due to differences
in causative pathogens or in age groups affected), differences in the average time between illness
and individuals seeking medical attention in different settings, or random variation. It should be
noted that the lags found to be significant in the studies of WTW final water turbidity are
consistent with the incubation period – the period from infection to onset of symptoms – for most
known waterborne infectious gastrointestinal pathogens (1-14 days), especially Cryptosporidium
species (19).
One study (6) tested one aggregate lag of 1-7 days, and thus could not assess the significance of
lags shorter than one week. The final study in this group (7) did not find any significant lags
among the 40 tested, which may suggest that, in this setting, WTW final water turbidity was not a
good marker of microbiological contamination and/or that the quality of water treatment was
superior.
Generally, relative risks reported were of the order of 1.2 – 3.0 (corresponding to an increased
risk of between 20% and 200% per category of turbidity) (3-9). However, there was variation
among the studies in the way in which this association was measured. Some studies examined the
increase in GI illness for a 1 NTU increase in turbidity whilst others examined the effect of an
interquartile change in turbidity levels. No studies reported a reduction in risk with increased
12

levels of turbidity, which might be expected if those exposed to obviously turbid water were less
likely to drink it. Associations were found in different age groups – all ages, children and elderly
– and among children and the elderly the association was stronger in the extremes of age.
Most of the studies did not report what proportion of acute GI illness in the population could be
attributed to the exposure investigated. The study that assessed the effect of raw (pre-treatment)
water turbidity (4) estimated that this exposure could account for 0.2-29% of daily admissions,
physician visits and children’s A&E visits for acute GI illness, depending on level of turbidity
and age; another study of WTW final turbidity (8) estimated that turbidity above 1 NTU was
associated with 37.5 excess outcomes per 100,000 persons.
Interpretation
The ecological nature of time-series studies makes their interpretation difficult. As exposure data
are not collected at individual level, the whole population is assumed to be exposed to the same
extent. In addition, the temporal nature of the relationships studied means that any observed
association might be due to coincident patterns in the seasonality of turbidity (or other time-
varying factors) and acute GI illness, unless sufficient adjustment for these is made in the
analysis. In assessing the strength of evidence for a causal association between turbidity and
acute GI illness, the following possible alternative explanations should therefore be considered:
measurement error of exposure, misclassification of exposure and/or outcome, residual
confounding, and random error. We deal with each of these in turn below.
13
Measurement error of exposure
In all these studies, the instruments used to measure turbidity were those routinely used by water
treatment plants to monitor quality as required by national guidelines. The Philadelphia studies
(3,5) on which the methodology for all these studies is based, have previously been criticised on
the basis that turbidity was found to have an effect on acute GI illness below the limit of
detection for which turbidity meters were calibrated, making the results unreliable (20). The
authors have countered this critique by arguing that readings below this level are routinely used
to demonstrate compliance with legal requirements and, further, that measurement errors in
readings below the limit of detection are random (i.e. not temporally associated with either
turbidity or acute GI illness) and would, therefore, be expected to attenuate any observed
association rather than be an alternative explanation for it (21). All studies used the mean of
several daily readings of turbidity, increasing the accuracy and precision of exposure
measurements, and all studies measured turbidity in the same units (NTU). Thus, measurement
error of the exposure is unlikely to explain the association between turbidity and acute GI illness.
Misclassification of exposure
Misclassification of exposure could lead to a spurious association if a proportion of the study
population was not actually exposed to the water supply studied (or was exposed to a different
extent), and this difference in exposure was related to the risk of acute GI illness. For example,
some individuals may have regularly consumed water from sources other than the local public
water supply. In these studies, however, such misclassification would also have to be temporally
related to both turbidity levels and GI illness. Most studies demonstrated a peak effect of
turbidity on GI illness at specific lags, and there is no reason to believe that cases with
misclassified exposure would systematically present to health services with GI illness on specific
14

lags following high turbidity days. Any potential misclassification of the exposure is thus likely
to be random and have the effect of tempering rather than inflating the association between
turbidity and GI illness.
Misclassification of outcome
In all these studies, the main outcome (hospital admission) was defined using ICD-9 codes
plausibly related to acute GI illness. This method is superior to definitions based on, for example,
patient self-report, as it is far less likely to be biased by individuals’ perception of their exposure
level. Most of these studies (4-9) also used other sources of data on GI illness with less specific
case definitions. In these cases, investigators carried out sensitivity analyses to assess the effect
of including these less specific groups of cases. In general, these did not influence the results.
Residual confounding
Confounding could occur if insufficient adjustment for a time-varying factor was carried out or if
important time-varying factors were omitted from the analysis. In particular, the degree of
adjustment for seasonal patterns in both turbidity and GI illness is crucial. Insufficient adjustment
could result in an association being observed simply because turbidity and GI illness are related
in time and share similarities in their seasonal patterns, while over-adjustment could mean that no
association is found. All analyses included some form of seasonal adjustment (usually locally-
estimated sum of squares, or loess, smoothing) and, depending on the length of the time-series
and the time-steps used, terms for long-term (year-on-year) trends and day-of-week effects. In
general, however, the description of statistical analyses was not sufficiently detailed and the
potential reproducibility of the methods based on the information provided in the papers was
deemed to be poor. Few studies presented details of model diagnostics, such as residual plots to
15

assess the appropriateness of seasonal adjustment, and it was difficult to judge whether all or part
of the observed association could be due to residual confounding. Some studies adjusted for
climatic factors potentially associated with turbidity and GI illness, namely ambient temperature
and precipitation.
Random error
The testing for associations between turbidity and GI illness over a number of time lags raises the
issue of whether some associations could have occurred by chance alone. The studies reviewed
tested between 1 and 40 lags. With a 0.05 level of precision it would be expected that, on
average, 1 in 20 lags tested would be statistically significant simply by chance, assuming the
effect of each individual lag was independent of all others. Most studies assessed the effect of
turbidity at various lags using temporal exposure response surface (TERS) plots. For studies
showing an association, these three-dimensional plots demonstrated that increases in GI illness
clustered around specific lags following days of high turbidity levels at the treatment plants. If
random error due to multiple testing were a likely explanation for the observed associations,
increases in incidence would be expected to be distributed more evenly along the surface of the
plots, with peaks also occurring following low turbidity days across all lags tested.
In summary, the associations found between daily variations in WTW final turbidity and
subsequent increases in GI illness at particular lags are unlikely to be entirely explained by
measurement error, exposure or outcome misclassification, or random error, although residual
confounding due to insufficient seasonal adjustment or failure to account for other relevant time-
varying factors could potentially explain all or part of the observed associations. However, the
consistency of the results across different settings using different levels of adjustment argues
16

against this being the case. The time lags identified between increased levels of turbidity and
subsequent increases in incidence of GI illness are consistent with the incubation periods of most
known waterborne pathogens and Cryptosporidium in particular, which due to its high resistance
to chlorine makes an association biologically plausible (19).
Group 2 (10,11)
Of these two studies, one was set in Russia (10) and is not as applicable to the UK setting, as the
water supply was considered to be unsafe by the local public health authorities and residents were
advised to always boil drinking water; the remaining study (11), set in France, may be relevant to
a rural UK setting.
Appropriateness of design and analysis
These two studies also employed time-series analysis, but differed from group 1 studies in that
their definition of the outcome was less specific - one study (10) used self-reported illness, as
recorded daily by study participants on diaries, and the other (11) used 3 and 7-day sales of
prescription and over-the-counter anti-diarrhoeal medications.
In the analysis, one study (10) controlled for seasonality, day-of-week effects, consumption of
unboiled tap water, attendance at summer houses and travel outside the study area; the other (11)
controlled for long-term trends in drug sales, as well as seasonal and day-of-week effects.
Results
The Russian study (10) found a positive association between daily WTW final water turbidity
and acute GI illness at a lag of 2 days. The French study (11) reported a 14% increase in sales of
17

anti-diarrhoeal medications per 10 NTU increase in raw (pre-treatment) water turbidity at a lag of
1 to 3 weeks; no significant association between WTW final water turbidity and sales of
medications was found.
Interpretation
The following possible alternative explanations will again be considered: measurement error of
exposure, misclassification of exposure and/or outcome, residual confounding, and random error.
Measurement error of exposure
As in group 1, these two studies measured turbidity with instruments used routinely by water
treatment plants to monitor quality as required by national guidelines, and the mean of several
daily readings of turbidity was used in the analysis. Errors in these measurements are likely to be
random and the associations found in these two studies are unlikely to be entirely explained by
measurement error of water turbidity at point of treatment.
Misclassification of exposure
Misclassification of exposure is more likely in these two studies. In one (10), visits to summer
houses, where participants would have been exposed to private water supplies, were likely to be
an important factor, but it was unclear how the investigators took this into account in the analysis.
The other study (11) was prone to exposure misclassification, since medication sales could only
be approximately linked to corresponding water supply zones. It is likely that a proportion of
medications was sold to people who were not resident within the water supply zones studied; this
could have affected the study’s ability to detect an association.
18

Misclassification of outcome
The Russian study (10) relied on participants’ self-reported illness in diaries – an ascertainment
method prone to bias, particularly if individuals are aware of the hypothesis under study.
Knowledge of the hypothesis may have made participants more likely to report symptoms of
acute GI illness if they believed they had been exposed to turbid water. In the French study (11),
sales of medications to individuals not exposed to the local water supply (up to 20% of sales
according to the investigators) would have resulted in the inclusion of putative cases of acute GI
illness who were not part of the population at risk. This could have contributed to a failure to find
an association if one did indeed exist.
Residual confounding
As with group 1, adequate control for time-varying factors is an important issue in these two
studies. Both studies controlled for long-term, seasonal and day-of-week effects. However, the
extent to which this was done and the adequacy of these adjustments was more difficult to assess
from the information presented in the reports. In the Russian study (10) information was
collected on individual-level behavioural factors thought likely to influence risk of acute GI
illness, but it was unclear how these were aggregated for inclusion in time-series analyses. In
addition, the investigators reported considerable differences in behavioural factors by age (for
example, younger participants were less likely to boil water before consumption), which was not
adjusted for in the analysis. Exposure to private water supplies during visits to summer houses is
also likely to have been an important confounder, but it was not clear whether this was
adequately addressed.
19

Random error
Both studies had low power; one study (11) included medication data from only one pharmacy
and the population studied was small. The Russian study included data from follow-up of only
100 families. The study failed to take into account the lack of independence of measures within
families, which could potentially result in a spurious association being found.
In summary, both these studies presented some evidence for an association between temporal
variations in turbidity and subsequent risk of acute GI illness. However, the studies had
considerable limitations in terms of the precision with which exposure and outcome were
ascertained, potential for bias, control of confounding factors and statistical power. We consider
the evidence provided by these two studies to be far less convincing than that provided by group
1 studies.
Group 3 (12)
This study investigated changes in incidence of acute GI illness (as assessed by the number of
stool specimens submitted for laboratory investigation of suspected GI pathogens) in a number of
communities in Australia following the introduction of improvements to the treatment of the
local public water supply. The improvements consisted of retrofitting disinfection and/or
filtration processes to existing systems.
Appropriateness of design and analysis
This study had a conventional ecological design. The introduction of improvements in water
treatment in a number of communities was assessed for its effect on the mean annual turbidity
20

and the rate of submission of faecal specimens for microbiological investigation during a 12-
month period before and after the changes to the local water supply. The rate of submission of
midstream urine samples (MSU) for laboratory investigation was used as a control to rule out the
possibility that changes in incidence were due to changes in patterns of specimen submission for
laboratory testing. This study design had several limitations. The nature of the improvements in
water treatment varied between communities and some communities had no treatment system
prior to the study. Thus, any effect on the incidence of acute GI illness is likely to have differed
by community. Turbidity values were averaged over a 12-month period and this may have
obscured correlations present only at higher turbidities, which might be transient. The study did
not take into account trends in acute GI illness in the different communities prior to the
introduction of water treatment upgrades, making any before and after comparisons of incidence
of acute GI illness difficult to interpret. Due to the non-specific nature of the outcome
(submission of faecal specimens for investigation), the study is likely to have measured relative
changes in incidence of acute GI illness rather than actual incidence. In addition, the treatment
plants studied did not serve the entire postcode from which faecal samples originated, and the
precision of exposure definition varied between communities. This means that a varying
proportion of the various populations studied would not have been expected to be affected by
changes in the water supply. The use of MSU samples is unlikely to have been a suitable control,
as the age distribution of conditions resulting in the submission of MSU samples is very different
to that of acute GI illness.
Results
No significant correlation was found between the implementation of improvements to the water
treatment and the rate of faecal specimen submission. Although in most cases, treatment upgrades
21
resulted in a decrease in mean turbidity, in some cases an overall increase in turbidity was
observed, and no correlation between change in turbidity after retrofit and change in the rate of
faecal specimen submission after retrofit was found.
Interpretation
This study addresses a different question to studies in groups 1 and 2, namely, do improvements
in treatment of the water supply, which are associated with overall changes in the mean turbidity
level, have an effect on the overall incidence of acute GI illness. Given the methodological
problems highlighted above, we did not find this study to be informative in terms of the putative
role of discolouration/turbidity on risk of acute GI illness.
Group 4 (13)
This Russian study was also set within a context in which residents were advised to boil water all
year round and so is not as directly relevant to a UK setting.
Appropriateness of design and analysis
This study employed a cross-sectional design and investigated the association between change in
colour, turbidity, free residual chlorine and iron in drinking water (from plant to point of use) and
self-reported GI illness. Families were recruited into the study from households within the city’s
water distribution zone. Participants recorded details of acute GI symptoms in a diary and
additionally provided information on a number of demographic, household, behavioural and
other relevant factors. Water quality at point of use was measured at regular intervals from
households within the distribution zone (but not necessarily those of participants). Regression
22

analyses were conducted to determine whether any associations existed between water quality
indicators and incidence of self-reported acute GI illness.
Results
No significant associations were found between turbidity or iron content and GI illness, but some
effect of decreased free chlorine on acute GI illness was observed. The effect of colour on illness
was not assessed.
Interpretation
A number of limitations were apparent in the design and implementation of this study. Firstly, no
sample size calculations were presented, making it difficult to assess whether the study had
sufficient power to detect an association between the various water quality indicators and acute
GI illness. The measurement of water quality parameters is likely to have been subject to
considerable error; water quality was measured in several sites for each study area, but only two
measurements per site separated by three weeks were taken, which is likely to have negatively
influenced the accuracy and precision of these parameters.
Misclassification of exposure is likely to have been a problem in this study as water quality
indicators were not measured frequently and were measured at sites other than participants’
homes. No details were given as to how sites for water sampling were selected, and it is unclear
how representative these sites were of the water distribution zone as a whole. The study did not
account for water consumed outside the home, which could have introduced a bias if, for
example, participants consumed water from other sources when water quality was particularly
poor.
23

The information supplied by one of the interviewers was excluded from the analysis (due to
breach of study protocols). This would have decreased the power of the study to detect an
association and could have introduced bias if participants excluded from analysis differed
systematically in important ways from the rest of the study population.
In summary, although no association between turbidity and acute GI illness was found, it is
unclear whether the study had sufficient power to actually detect an association and failure to
detect an association could have resulted from the considerable potential for bias in the study
design, most notably through misclassification of participants’ exposure.
Group 5 (14)
This study involved a telephone survey of Washington, DC residents and retrospective review of
health data following a failure of filtration in the local water supply that resulted in an increase in
turbidity levels above legal limits. The two-week period before the filtration failure was
compared with the two-week period following the failure to determine whether an increase in
incidence of acute GI illness was apparent.
Appropriateness of design and analysis
This study employed an ecological before and after design, but did not use a control area as a
comparison. For the telephone survey, participants were asked to give details of acute GI illness
and water consumption for varying lengths of recall (two weeks for the period after the filtration
failure compared with four weeks for the period before the failure). As the quality of recall varies
with time, it is likely that information for the period before the filtration failure was less accurate.
24
Results
No significant increase in incidence of acute GI illness (as measured by the telephone survey or
various health data sources) was found following the filtration failure.
Interpretation
It is likely that the study did not have sufficient power to detect a significant increase in incidence
in the period following the filtration failure, as it included a single incident taking place over a
very short time period. No attempt to exclude the possibility of random error was made (for
example, by using a control area, or making comparisons with data for previous years for the
same period). In addition, the exposed population was not precisely defined (eg. by linking
affected postal codes to data on health outcomes). This is likely to have affected the analysis of
emergency hospital visits, for which 30% of cases were not local residents and, thus, may not
actually have been exposed to the local water supply. It is unclear to what extent the results of the
telephone survey could have been biased by differential recall.
Non-microbiological (15,16) (Table 2)
These studies investigated the effect of contamination of the water supply at point of use with
copper and aluminium - which cause changes to the normal colour of water – on the risk of acute
GI illness. The studies were set in the US and UK.
Appropriateness of design and analysis
The US study was a descriptive report of an investigation into contamination of drinking water as
a result of newly-installed copper pipes. The study reported the frequency of symptoms of copper
25

poisoning in the affected households following the incident, but no comparison group was used
and no correlations between measurements of actual copper levels in tap water and acute GI
illness were investigated. The UK study was a retrospective cohort analysis following an incident
of aluminium contamination. The frequency of acute GI illness in the affected area was compared
to that in a control area served by a different treatment plant. No quantification of actual exposure
to aluminium was performed.
Results
Evidence of an association between copper contamination and acute GI illness was anecdotal, as
no analytical investigations were conducted. In the aluminium study, there were significant
differences in the proportions of people reporting an observed change in water colour, drinking
habits and illness following the contamination incident (see Table 2). The calculated relative risk
of diarrhoea was 5.1 (95% CI: 3.3-7.9).
Interpretation
Chemical poisonings due to copper and aluminium are recognised conditions. Such poisoning
through the water supply is, however, very rare and occurs under very specific conditions (such
as through inadequate installation of new pipes or accidental contamination of the water supply,
as in the above studies). Their effects are thus likely to occur in highly unusual circumstances that
may not be as relevant to the proposed study. Incidents in which water appears ‘brown’ or where
discolouration is caused by the disturbance of iron sediment in the distribution pipes are likely to
be more common forms of chemical discolouration, and the effects of these on acute GI illness
are less well established. This review did not find any studies addressing these more common
forms of chemical contamination.
26

Discussion
Principal findings of the review
In this review, we found no studies that specifically addressed the issue of water discolouration
incidents and their effect on the risk of acute GI illness. We have found no evidence that water
discolouration at point of use is associated with GI illness. Only one study (13) identified in this
review actually measured water quality at point of use and, although this study found no
association, it was deemed to be insufficiently rigorous to provide conclusive evidence. The
studies relating to copper and aluminium exposure are not typical of routine discolouration
incidents.
Most studies identified in this review investigated the effect of water turbidity at point of
treatment (either pre-treatment or WTW final water). It should be noted that causes of
discolouration or high turbidity at the treatment plant are likely to differ from causes of
discolouration/turbidity in the distribution zone and that, therefore, any potential effects on the
risk of GI illness are likely to be different. Moreover, most of these studies investigated the effect
of temporal variations in turbidity at point of treatment under normal operating conditions (that
is, where turbidity levels were within limits regarded as acceptable). However, most
discolouration incidents reported to the DWI involve increases in turbidity levels well in excess
of legal limits. Thus, results from these studies cannot be used to inform the specific question of
whether discolouration incidents result in increased risk of acute GI illness, determine the likely
magnitude of any such effect, or estimate its potential population impact.
27

In order to establish whether there is an association between discolouration incidents and risk of
acute GI illness in the UK setting, as well as determine the magnitude and population impact of
any such association, an epidemiological study specifically designed to address this question
would be needed.
Weaknesses of review
This review may be biased toward published, peer-reviewed literature, which is more
comprehensively catalogued and easier to retrieve than grey literature. The problem of
publication bias should be considered in any systematic review, as studies reporting positive
associations may be more likely to be published than those finding no association. This review
may also be biased towards papers dealing with outcomes with infectious aetiology, either
because more such studies have been performed or because the search strategy employed was
less sensitive to outcomes caused by non-infectious agents.
Meaning of review’s findings
Although this review comprised a group of studies of varying hypotheses and designs, the most
common hypothesis investigated was that of the putative association between variations in
turbidity levels within acceptable limits at point of treatment and subsequent risk of acute GI
illness. The findings of this review suggest that a causal association is likely and biologically
plausible. The potential limitations of these studies, which generally use ecological time-series
methodology, have been extensively discussed in the literature, particularly with regard to
measurement errors in turbidity levels, misclassification of exposure (because no individual level
exposure information is collected), and the possibility of finding spurious chance associations
due to the testing of multiple lags. We have discussed these concerns above and concluded that,
28

on balance, the design of group 1 studies was scientifically rigorous and that these factors are
unlikely to explain the significant associations found. In general, these studies provided
insufficient detail regarding the degree of adjustment for time-varying factors, which may be
important confounders in such time series analyses. In particular, the level of seasonal adjustment
appeared to involve a degree of subjectivity and the reproducibility of these analyses based on the
information provided in the reports was felt to be poor. Further methodological work
investigating the most appropriate methods for seasonal adjustment would help clarify this issue.
However, the general agreement between these studies, carried out in different settings, in terms
of the direction, magnitude of association and significant lags between exposure and disease
lends weight to the argument for a causal association. The lags identified were consistent with the
incubation periods of likely causal pathogens, most notably Cryptosporidium, which due to its
high chlorine resistance makes such an association biologically plausible. The time-series design
does not lend itself to a meta-analysis for obtaining a combined estimate of effect across all
studies, as it is unclear how individual studies should be weighted. A measure of population
impact (that is, the proportion of acute GI illness attributable to variations in turbidity within
normal limits) is also difficult to estimate from these studies, as they used hospitalised and
emergency cases, which are likely to represent more severe disease and constitute a minority of
all cases occurring in the community. The context of these studies was relevant to the UK
situation, suggesting that a similar association might be found in the UK setting. However,
because of the differences in organisation of healthcare and, potentially, important time-varying
factors (e.g. temperature, precipitation), the findings of these studies cannot be readily
extrapolated to inform the likely magnitude of effect and population impact in the UK. Despite
the consistency of their findings, these studies did not draw strong conclusions, nor make strong
recommendations.
29

Conclusions
Questions not answered by this review
Due to a lack of research in this area, neither the effect nor the population impact of water
discolouration at point of use on the risk of acute GI illness can be determined from the existing
literature. Although there appears to be consistent evidence of a positive association between
increases in turbidity at point of treatment and subsequent incidence of acute GI illness, turbidity
is only one of many contributing factors to discolouration. Moreover, data on water quality at
point of treatment cannot be extrapolated to the situation at point of use, as the causes of
increases in turbidity and discolouration (and, indeed, other water quality indicators) at the
treatment plant and the distribution zone are likely to be different.
Implications for the design of the proposed study
1. The proposed study will use incidents of water discolouration (rather than quantified
turbidity) as the exposure. Discolouation can have different causes and thus be
indicative of exposure to many factors (both chemical and microbiological) that may
or may not be associated with acute GI illness, the definition of exposure will be
less precise than, for example, in studies investigating only the effect of turbidity.
The study should have sufficient power to enable analyses stratified by the most
relevant components of discolouration.
2. Adequate information on possible confounding factors should be collected.
Depending on the study design, these may include age, sex, socioeconomic factors,
as well as time-varying factors such as temperature, precipitation and seasonality of
exposure and outcome if relevant.
30

3. Hospital admissions, the outcome of interest in the majority of papers in this review,
are likely to represent less common, more severe cases of acute GI illness. Data
from these cases may not necessarily be applicable to the wider spectrum of acute
GI illness. More common outcomes comprise milder disease, but are less likely to
be captured by routine sources of health data. A specific sub-study to investigate the
effect of water discolouration on milder disease may be necessary.
31

Table 1. Summary of reviewed studies which ascribed an assumed microbiological aetiology to GI illness. First author
(year) Participants Study Design Exposure Outcome Analysis Results Reviewers’ comments
Group 1 Schwartz (2000)
All residents of Philadelphia, US over 65 years of age
Ecological study; Jan 1992-Dec 1993
Mean daily WTW final water turbidity (NTU) measurements from each of three water treatment plants
Hospital admissions for ICD-9 codes plausibly related to GI illness separately for each plant service area
Poisson Generalised Additive Modelling (GAM) time-series correlating daily counts of hospital admissions with daily water turbidity (with lags)
Increase in turbidity 0.035 NTU associated with 9% (5.3-12.7) increase in admissions over 3 plants combined at lag of 9-11 days controlled for time trends, seasonal patterns and temperature; also 9.1% increase (5.2-13.3) at lag of 4-6 days for one plant; effect greater in those over 75 years (p<0.0001)
Design Unclear whether some areas served by more than one plant Not clear if all cases in exposed area were ascertained No details as to sample size/powerAnalysis Insufficiently detailed methods section No measure of impact
Aramini (2000)
Population of Greater Vancouver, Canada
Ecological study, January 1992- December 1998
Mean daily raw turbidity (NTU) for three watersheds provided by Greater Vancouver Regional District
Daily hospital admissions, physician visits, and BC Children’s Hospital A&E visits for ICD-9 codes association with gastro illness and respiratory outcomes (controls for binomial modelling)
Poisson GAM time-series correlating daily counts outcome with daily water turbidity (with lags) Also, binomial Generalised Linear Modelling (GLM) regression modelling for individual risk analysis
Strongest association between turbidity and illness at lags of 3-6, 6-9, 12-16 and 21-29 days. Relative risks between 1.2 and 2.0 for different watershed/age combinations. The authors estimated that 0.2 to 29% of the GI illness (measured in this way) in Greater Vancouver could be accounted for by raw water turbidity, depending on level of turbidity and age.
Design Less specific definition of A&E outcome, relative to other outcomes No details as to sample size/power Analysis Insufficiently detailed methods section Large number of lags tested (1-39 days)
Schwartz (1997)
All children who visited or were admitted to Children’s Hospital of Philadelphia (US)
Ecological study; 1989-1993 (ER visit data only available from July 1992 – December 1993)
Mean daily WTW final water turbidity (NTU) across three treatment plants
Hospital admissions and A&E visits for ICD-9 codes plausibly related to GI illness
Poisson GAM time-series correlating daily counts of hospital admissions/ER visits with daily water turbidity (with lags)
Interquartile increase in turbidity associated with 9.9% (2.9-17.3) increase in ER visits in children 3 years and older at lag of 4 days and 31.1% (10.8-55) in admissions at 5-6 day lag, controlled for time trends, seasonal patterns and temperature; 5.9% (0.2-12.0) increase in ER visits at lag of 10 days among children aged 2 or younger and 13.1% (3.0-24.3) for admissions after 13 lag days
Design Unclear what proportion of ill children go to this hospital No details as to sample size/power Analysis Insufficiently detailed methods section Interpretation Incomplete discussion of results differing by age No measure of impact

Table 1. Summary of reviewed studies which ascribed an assumed microbiological aetiology to GI illness.
First author (year)
Participants Study Design Exposure Outcome Analysis Results Reviewers’ comments
Group 1 Schwartz (2000)
All residents of Philadelphia, US over 65 years of age
Ecological study; Jan 1992-Dec 1993
Mean daily effluent turbidity (NTU) measurements from each of three water treatment plants
Hospital admissions for ICD-9 codes plausibly related to GI illness separately for each plant service area
Poisson Generalised Additive Modelling (GAM) time-series correlating daily counts of hospital admissions with daily water turbidity (with lags)
Increase in turbidity 0.035 NTU associated with 9% (5.3-12.7) increase in admissions over 3 plants combined at lag of 9-11 days controlled for time trends, seasonal patterns and temperature; also 9.1% increase (5.2-13.3) at lag of 4-6 days for one plant; effect greater in those over 75 years (p<0.0001)
Design Unclear whether some areas served by more than one plant Not clear if all cases in exposed area were ascertained No details as to sample size/powerAnalysis Insufficiently detailed methods section No measure of impact
Aramini (2000)
Population of Greater Vancouver, Canada
Ecological study, January 1992- December 1998
Mean daily raw turbidity (NTU) for three watersheds provided by Greater Vancouver Regional District
Daily hospital admissions, physician visits, and BC Children’s Hospital A&E visits for ICD-9 codes association with gastro illness and respiratory outcomes (controls for binomial modelling)
Poisson GAM time-series correlating daily counts outcome with daily water turbidity (with lags) Also, binomial Generalised Linear Modelling (GLM) regression modelling for individual risk analysis
Strongest association between turbidity and illness at lags of 3-6, 6-9, 12-16 and 21-29 days. Relative risks between 1.2 and 2.0 for different watershed/age combinations. The authors estimated that 0.2 to 29% of the GI illness (measured in this way) in Greater Vancouver could be accounted for by raw water turbidity, depending on level of turbidity and age.
Design Less specific definition of A&E outcome, relative to other outcomes No details as to sample size/power Analysis Insufficiently detailed methods section Large number of lags tested (1-39 days)
Schwartz (1997)
All children who visited or were admitted to Children’s Hospital of Philadelphia (US)
Ecological study; 1989-1993 (ER visit data only available from July 1992 – December 1993)
Mean daily effluent turbidity (NTU) across three treatment plants
Hospital admissions and A&E visits for ICD-9 codes plausibly related to GI illness
Poisson GAM time-series correlating daily counts of hospital admissions/ER visits with daily water turbidity (with lags)
Interquartile increase in turbidity associated with 9.9% (2.9-17.3) increase in ER visits in children 3 years and older at lag of 4 days and 31.1% (10.8-55) in admissions at 5-6 day lag, controlled for time trends, seasonal patterns and temperature; 5.9% (0.2-12.0) increase in ER visits at lag of 10 days among children aged 2 or younger and 13.1% (3.0-24.3) for admissions after 13 lag days
Design Unclear what proportion of ill children go to this hospital No details as to sample size/power Analysis Insufficiently detailed methods section Interpretation Incomplete discussion of results differing by age No measure of impact
33

Table 1 (continued) First author (year)
Participants Study Design Exposure Outcome Analysis Results Reviewers’ comments
Morris (1996)
Inhabitants of Wisconsin (US) who would seek treatment at Medical College of Wisconsin hospitals
Ecological study; January 1992-April 1993 (including outbreak at end of study period)
Daily effluent turbidity (NTU) for each of two water treatment plants in Milwaukee obtained from water dept of city
Historical records from Medical College of Wisconsin of admissions, A&E and outpatient visits for ICD-9 codes plausibly associated with GI illness
Poisson GAM time-series correlating 2-weekly counts of admissions/visits with 2-weekly water turbidity (with lags)
Including outbreak: For 0.5 NTU increase in turbidity, RR outpatient gastro event 1.53 (0.92-2.55) at Linwood and 1.36 (0.99-1.87) at Howard Ave for 0-18 years. Emergency gastro events: 2.82 (1.44-5.52) Linwood and 1.73 (1.19-2.50) Howard Ave for same agegroup. Effect was lower and non-significant for >18 years for Linwood and higher and sig. for this agegroup at Howard Ave plant. Excluding outbreak: Effect unchanged for age 0-18 for Linwood plant and all other effects were non-significant.
Design Unclear if multiple readings of turbidity taken per day Unclear whether cases matched to a treatment plant and what proportion of all cases of the outcome are treated in these hospitals The use of 3.5 day time step, instead of 1 day, suggests low power as this was likely done to increase the number of observations per time step Analysis Insufficiently detailed methods section Only one lag tested (aggregate of 1-7 days) Unclear presentation of results Conclusions not appropriate to results No measure of impact
Lim (2002) Population of Edmonton, Canada supplied by one of two treatment plants, prior to refurbishment carried out on the 10 December, 1997
Ecological study, 1993-1999
Mean daily effluent turbidity (NTU) data from one of two plants serving Edmonton (via EPCOR water services, inc.)
Daily hospital admissions, A&E, physician and long-term care visits; latter three come under physician-billing records for ICD-9 codes associated with gastro illness and respiratory outcomes (controls for binomial modelling)
Poisson GAM time-series comparing daily counts of GI illness cases with daily water turbidity (with lags) Also, binomial GLM and GAM regression modelling
No significant lags identified between finished water turbidity and gastroenteritis. Odds ratios comparing level of GI illness before and after refurbishment ranged from 0.99 to 1.22 (no confidence intervals)
Design No details as to sample size/power Analysis Large number of tested (1-39 days) Insufficiently detailed methods section Overcomplicated analysis and unclear presentation of results
34

Table 1 (continued) First author (year)
Participants Study Design Exposure Outcome Analysis Results Reviewers’ comments
Naumova (2003)
People aged 65 and older in Milwaukee county (US)
Ecological study; January 1, 1992-April 24, 1993 (pre-outbreak and outbreak)
Daily maximum effluent turbidity (NTU) at South plant
Hospital admissions and A&E visits for ICD-9 codes plausibly related to GI illness
Poisson GAM time-series comparing daily counts of hospital admissions/ER visits with maximum daily water turbidity (with lags)
1 NTU increase in turbidity associated with RR’s of GI illness within the 95% CI 1.54-4.48. Strongest association (TERS plot) at lag of 6 (primary)and 13 days (secondary spread) Turbidity over 1 NTU associated with 37.5 excess GI cases per 100,000 people
Design No details of sample size/power Analysis No information given on how account taken of seasonality/time trends Insufficiently detailed methods section Unclear presentation of results Interpretation Analysis done after known that Crypto caused outbreak – circular arguments
Morris (1998)
Inhabitants of Wisconsin (US) who would seek treatment at Medical College of Wisconsin hospitals
Ecological study: Part 1 January 1, 1992-March 13, 1993 (pre-outbreak); Part 2 March 14-May 3 1993 (outbreak)
Daily effluent turbidity (NTU) for each of two water treatment plants in Milwaukee obtained from water dept of city
Historical records from Medical College of Wisconsin of admissions, A&E and outpatient visits for ICD-9 codes plausibly associated with GI illness
Poisson GAM time-series comparing daily counts of hospital admissions/ER visits with daily water turbidity (with lags)
During outbreak: GI illness most strongly associated with turbidity (south plant) at lag of 7 days in children (correlation coefficient 0.34) and 8 days in adults (correlation coefficient 0.41) Pre-outbreak: North plant had highest turbidity and turbidity was most strongly associated with gastro illness at lag of 8 days in children (correlation coefficient 0.12) and 9 days in adults (0.09)
Design Insufficient data on the proportion of all cases in Wisconsin that are seen at a Medical College Hospital No details as to sample size/power Analysis Insufficiently detailed methods section Unclear and incomplete results No measure of effect calculated. Unclear and incomplete results Interpretation Incomplete discussion of plausibility of results. No discussion bias/confounding
35
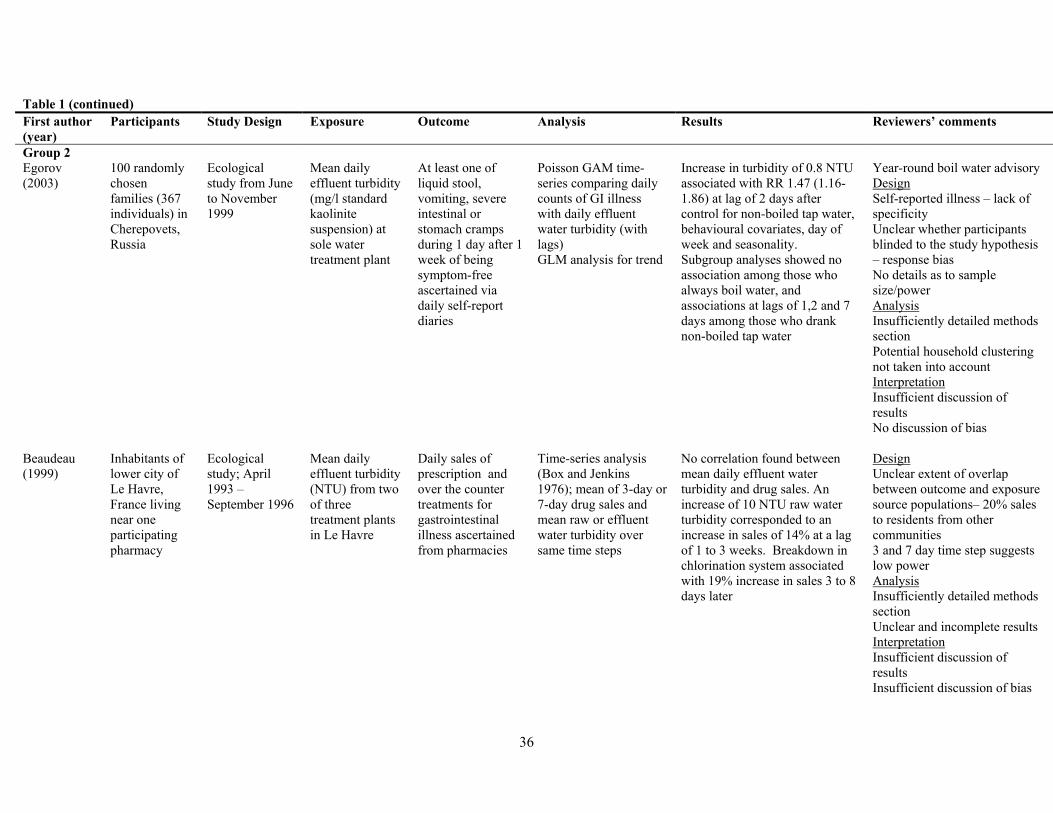
Table 1 (continued) First author (year)
Participants Study Design Exposure Outcome Analysis Results Reviewers’ comments
Group 2 Egorov (2003)
100 randomly chosen families (367 individuals) in Cherepovets, Russia
Ecological study from June to November 1999
Mean daily effluent turbidity (mg/l standard kaolinite suspension) at sole water treatment plant
At least one of liquid stool, vomiting, severe intestinal or stomach cramps during 1 day after 1 week of being symptom-free ascertained via daily self-report diaries
Poisson GAM time-series comparing daily counts of GI illness with daily effluent water turbidity (with lags) GLM analysis for trend
Increase in turbidity of 0.8 NTU associated with RR 1.47 (1.16-1.86) at lag of 2 days after control for non-boiled tap water, behavioural covariates, day of week and seasonality. Subgroup analyses showed no association among those who always boil water, and associations at lags of 1,2 and 7 days among those who drank non-boiled tap water
Year-round boil water advisory Design Self-reported illness – lack of specificity Unclear whether participants blinded to the study hypothesis – response bias No details as to sample size/power Analysis Insufficiently detailed methods section Potential household clustering not taken into account Interpretation Insufficient discussion of results No discussion of bias
Beaudeau (1999)
Inhabitants of lower city of Le Havre, France living near one participating pharmacy
Ecological study; April 1993 – September 1996
Mean daily effluent turbidity (NTU) from two of three treatment plants in Le Havre
Daily sales of prescription and over the counter treatments for gastrointestinal illness ascertained from pharmacies
Time-series analysis (Box and Jenkins 1976); mean of 3-day or 7-day drug sales and mean raw or effluent water turbidity over same time steps
No correlation found between mean daily effluent water turbidity and drug sales. An increase of 10 NTU raw water turbidity corresponded to an increase in sales of 14% at a lag of 1 to 3 weeks. Breakdown in chlorination system associated with 19% increase in sales 3 to 8 days later
Design Unclear extent of overlap between outcome and exposure source populations– 20% sales to residents from other communities 3 and 7 day time step suggests low power Analysis Insufficiently detailed methods section Unclear and incomplete results Interpretation Insufficient discussion of results Insufficient discussion of bias
36

Table 1 (continued) First author (year)
Participants Study Design Exposure Outcome Analysis Results Reviewers’ comments
Group 3 McConnell (2001)
17 communities in 2 states in Australia (Victoria, South Australia)
Ecological Before and After analysis of improved water treatment
Upgrade of water treatment system
Requests for GI-related faecal specimens and midstream urine (MSU) samples to test for urinary tract infections as control from Australian Health Insurance Commission
Change in turbidity compared with change in risk of faecal specimen using Spearman rank test for correlations
No significant correlations found.
Design Low power (only 17 communities) Imprecise measure of turbidity and GI outcome No details as to sample size/power Inappropriate control group as age distribution different Analysis No analytical techniques presented No control for confounding Incomplete presentation of results No measure of effect or impact. Interpretation Conclusions not justified by results (trends in GI before upgrade and type of upgrade not taken into account. No discussion of bias No discussion of causality
37

Table 1 (continued) First author (year)
Participants Study Design Exposure Outcome Analysis Results Reviewers’ comments
Group 4 Egorov (2002)
15 areas of Cherepovets, Russia 22 October 1998 – 31 December 1999; 50 families per area were interviewed
Cross-sectional study
Water quality parameters such as colour (unspecified units), turbidity (formazin turbidity units(FTU)) , free chlorine (mg/l) and iron (mg/l) measured at point of use and at sole water treatment plant
Self-reported diarrhoea or other GI symptoms such as vomiting or cramps lasting at least one day after at least two weeks symptom -free
Poisson GLM modelling using Generalized Estimating Equations (GEE) to account for clustering of observations from same household (give more robust standard errors) for association between water quality parameters and self-reported GI illness
Relative risk of GI illness for IQR change in turbidity 1.25 (0.93-1.68) or iron content 1.07 (0.84-1.37); exposure to colour not assessed. RR of GI illness for IQR change in free chlorine was 1.42 (1.05-1.91)
Note: primary objective was to assess association between residual chlorine levels and illness Design Unclear definition of exposure Self-reported illness – lack of specificity Unclear whether participants blinded – response bias No details as to sample size/power Analysis Insufficiently detailed methods section No analysis on colour carried out. No measure of impact calculated Interpretation Recommendations too strong given borderline results
Group 5 Anon (1994) Washington
D.C. (US) November 22 – December 26
Before and After analysis of increased effluent turbidity at DC treatment plant 7 December
Being served by treatment works that experienced episode of increased turbidity
Self-reported loose/watery stools; A&E diagnosis records; Nursing home survey of bowel movements and antidiarrheal medications; Microbiology lab survey
Calculated risk ratios for various outcomes using period before 8 December as baseline
All four surveys showed no statistically significant differences between the two periods
No discussion or interpretation.
38

Table 2. Summary of reviewed studies which did not ascribe an assumed microbiological aetiology to GI illness
First author, setting (year)
Participants Study Design Exposure Outcome Analysis Results Reviewers’ comments
Knobeloch, US (1998)
24 families in mobile home park, Wisconsin, US, 1996
Survey of health and copper levels initiated after complaints of blue water
“First draw” and “flushed” tap water copper levels (mg/l)
GI related illnesses ascertained through written questionnaire
Descriptive. 58% respondents reported “new” illness, i.e. after copper pipes fitted. Mean “first draw” copper level 1.2 mg/l; three samples exceeded federal action level. Mean “flushed” copper level 1.9; six samples exceeded action level.
Design Small study (38 respondents) No analysis of correlation between water copper levels and illness. No info on number of illnesses reported before copper pipes fitted
Rowland, UK (1990)
Residents and visitors in North Cornwall, UK around time of aluminium contamination of treatment works (6 July, 1988)
Retrospective cohort study including unexposed control area
Living in area served by Lowermoor treatment plant.
Self-reported symptoms (e.g. diarrhoea) in July and August 1988 (after contamination)
Descriptive and univariable analysis of association between living in exposed area and different types of self-reported symptoms
49.4% respondents in exposed area changed drinking habits around time of incident vs. 2.4% in control area 63% in exposed area noticed change in water, 51% of whom said colour changed; this was significantly higher than proportion of those in the control area who reported a colour change (p<0.001) Relative risk of any symptom 4.2 (95% CI 3.3-5.4) in exposed compared to control area Relative risk of diarrhoea 5.1 (3.3-7.9) Non-significant relative risks when was restricted to those with symptoms (Relative proportional morbidity) Insufficient numbers for dose-response analysis with amount of water drunk
Design Self-reported illness – lack of specificity Unclear whether participants blinded – response bias Analysis No measure of impact calculated Significant confounding and bias in results likely.
39

Acknowledgements
The reviewers would like to thank the following people for responding to requests for
information: Eugene Cloete, Lorna Fewtrell, Jamie Bartram, Arie Havelaar, Julian Dennis,
Marty Allen, Donald Reid, Mark LeChevallier and Andrey Egorov. The reviewers would also
like to thank Karen Stark for clerical assistance. Finally, the reviewers would like to thank
Tony Lloyd and the Drinking Water Inspectorate of England and Wales for putting out the
call for proposals, and accepting the application of this group.
Conflicts of interest
None declared.
References
1. Drinking Water 2003: A report by the Chief Inspector, Drinking Water Inspectorate 2003. http://www.dwi.gov.uk/pubs/annrep03/contents.shtm. Date last accessed Nov 2004.
2. Gorton M. Automatic river monitoring: turbidity. http://www.environment-
agency.gov.uk/science/monitoring/ 173130/?version=1&lang=_e#turbidity. Date last
accessed 7/9/04.
3. Schwartz J, Levin R ,Goldstein R. Drinking water turbidity and gastrointestinal illness
in the elderly of Philadelphia. J Epidemiol Community Health 2000:54:45-51.
4. Aramini J, Wilson J, Allen B, Holt J, Sears W, McLean M, Copes R. Drinking Water
Quality and Health Care Utilization for Gastrointestinal Illness in Greater Vancouver.
Health Canada, 2000.
5. Schwartz J, Levin R, Hodge K. Drinking water turbidity and paediatric hospital use
for gastrointestinal illness in Philadelphia. Epidemiology 1997:8:615-20.
6. Morris RD, Naumova EN, Levin R, Munasinghe RL. Temporal variation in drinking
water turbidity and diagnosed gastroenteritis in Milwaukee. Am J Public Health
1996:86:237-9.
40

7. Lim G, Aramini J, Fleury M, Ibarra R, Meyers R. Investigating the relationship
between drinking water and gastroenteritis in Edmonton: 1993-1998. Health Canada,
2002.
8. Naumova EN, Egorov AI, Morris RD, Griffiths JK. The Elderly and Waterborne
Cryptosporidium Infection: Gastroenteritis Hospitalizations before and during the
1993 Milwaukee Outbreak. Emerg Infect Dis 2003:9:418-25.
9. Morris RD, Naumova EN, Griffiths JK. Did Milwaukee Experience Waterborne
Cryptosporidiosis before the Large Documented Outbreak in 1993? Epidemiology
1998:9:264-70.
10. Egorov AI, Naumova EN, Tereschenko AA, Kislitsin VA, Ford TE. Daily variations
in effluent water turbidity and diarrhoeal illness in a Russian city. Int J Environ
Health Res 2003:13:81-94.
11. Beaudeau P, Payment P, Bourderont D, Mansotte F , Boudhabay O, Laubiès B,
Verdière J. A time series study of anti-diarrhoeal drug sales and tap-water quality. Int
J Environ Health Res 1999:9:293-312.
12. McConnell S, Horrocks M, Sinclair MI, Fairley CK. Changes in the incidence of
gastroenteritis and the implementation of public water treatment. Int J Environ Health
Res 2001:11:299-303.
13. Egorov A, Ford T, Tereschenko A, Drizhd N, Segedevich I, Fourman V.
Deterioration of drinking water quality in the distribution system and gastrointestinal
morbidity in a Russian city. Int J Environ Health Res 2002:12:221-233.
14. From the Centers for Disease Control and Prevention. Assessment of inadequately
filtered public drinking water--Washington, D.C., December 1993. JAMA
1994:272:1401-2.
41

15. Knobeloch L, Schubert C, Hayes J, Clark J, Fitzgerald C, Fraundorff A.
Gastrointestinal upsets and new copper plumbing--is there a connection? WMJ
1998:97:49-53.
16. Rowland A, Grainger R, Stanwell Smith R, Hicks N, Hughes A. Water Contamination
in North Cornwall: A Retrospective Cohort Study into the Acute and Short-term
effects of the Aluminium Sulphate Incident in July 1988. J R Soc Health
1990:110:166-72.
17. MacKenzie WR, Hoxie NJ, Proctor ME, Gradus MS, Blair KA, Peterson DE,
Kazmierczak JJ, Addiss DG, Fox KR, Rose JB ,et al. A massive outbreak in
Milwaukee of cryptosporidium infection transmitted through the public water supply.
N Engl J Med 1994:331:161-7.
18. Stirling R, Aramini J, Ellis A, Lim G, Meyers R, Fleury M, Werker D. North
Battleford, Saskatchewan, Spring 2001: Waterborne cryptosporidiosis outbreak.
Health Canada. http://www.health.gov.sk.ca/mc_dp_health_can_epi_report_NB.pdf
Date last accessed 23/09/04
18. National Centre for Infectious Diseases. Infectious Disease Information.
http://www.cdc.gov/ncidod/diseases/index.htm#c. Date last accessed 18/10/04.
19. EPA Review Finds Philadelphia Turbidity Study Seriously Flawed. Health Stream
Article 1998;9. http://www.waterquality.crc.org.au/hsarch/HS9b.htm - size 12.1
20. EPA Review Finds Philadelphia Turbidity Study Seriously Flawed. Health Stream
Article 1998;9. http://www.waterquality.crc.org.au/hsarch/HS9b.htm. Date last
accessed 23/10/04.
42
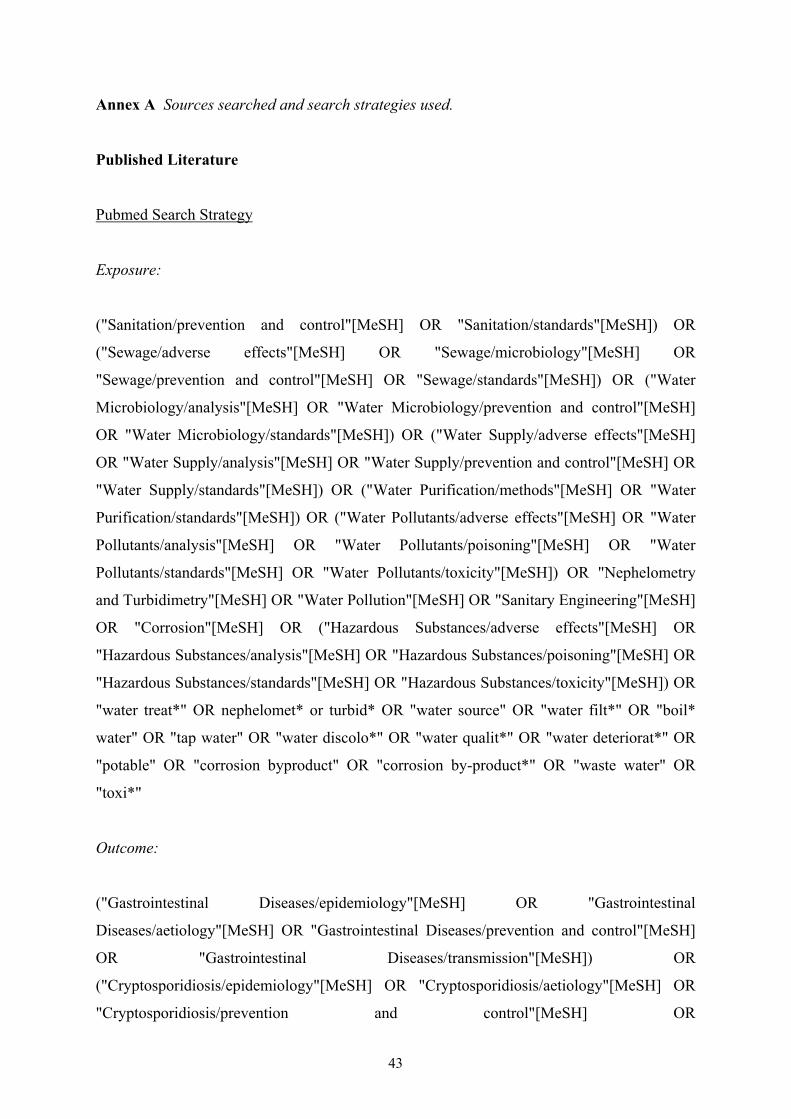
Annex A Sources searched and search strategies used.
Published Literature
Pubmed Search Strategy
Exposure:
("Sanitation/prevention and control"[MeSH] OR "Sanitation/standards"[MeSH]) OR
("Sewage/adverse effects"[MeSH] OR "Sewage/microbiology"[MeSH] OR
"Sewage/prevention and control"[MeSH] OR "Sewage/standards"[MeSH]) OR ("Water
Microbiology/analysis"[MeSH] OR "Water Microbiology/prevention and control"[MeSH]
OR "Water Microbiology/standards"[MeSH]) OR ("Water Supply/adverse effects"[MeSH]
OR "Water Supply/analysis"[MeSH] OR "Water Supply/prevention and control"[MeSH] OR
"Water Supply/standards"[MeSH]) OR ("Water Purification/methods"[MeSH] OR "Water
Purification/standards"[MeSH]) OR ("Water Pollutants/adverse effects"[MeSH] OR "Water
Pollutants/analysis"[MeSH] OR "Water Pollutants/poisoning"[MeSH] OR "Water
Pollutants/standards"[MeSH] OR "Water Pollutants/toxicity"[MeSH]) OR "Nephelometry
and Turbidimetry"[MeSH] OR "Water Pollution"[MeSH] OR "Sanitary Engineering"[MeSH]
OR "Corrosion"[MeSH] OR ("Hazardous Substances/adverse effects"[MeSH] OR
"Hazardous Substances/analysis"[MeSH] OR "Hazardous Substances/poisoning"[MeSH] OR
"Hazardous Substances/standards"[MeSH] OR "Hazardous Substances/toxicity"[MeSH]) OR
"water treat*" OR nephelomet* or turbid* OR "water source" OR "water filt*" OR "boil*
water" OR "tap water" OR "water discolo*" OR "water qualit*" OR "water deteriorat*" OR
"potable" OR "corrosion byproduct" OR "corrosion by-product*" OR "waste water" OR
"toxi*"
Outcome:
("Gastrointestinal Diseases/epidemiology"[MeSH] OR "Gastrointestinal
Diseases/aetiology"[MeSH] OR "Gastrointestinal Diseases/prevention and control"[MeSH]
OR "Gastrointestinal Diseases/transmission"[MeSH]) OR
("Cryptosporidiosis/epidemiology"[MeSH] OR "Cryptosporidiosis/aetiology"[MeSH] OR
"Cryptosporidiosis/prevention and control"[MeSH] OR
43

"Cryptosporidiosis/transmission"[MeSH]) OR "Cryptosporidium"[MeSH] OR
("Giardiasis/epidemiology"[MeSH] OR "Giardiasis/aetiology"[MeSH] OR
"Giardiasis/prevention and control"[MeSH] OR "Giardiasis/transmission"[MeSH]) OR
"Giardia"[MeSH] OR ("Bacterial Infections/epidemiology"[MeSH] OR "Bacterial
Infections/aetiology"[MeSH] OR "Bacterial Infections/prevention and control"[MeSH] OR
"Bacterial Infections/transmission"[MeSH]) OR ("Virus Diseases/epidemiology"[MeSH] OR
"Virus Diseases/aetiology"[MeSH] OR "Virus Diseases/prevention and control"[MeSH] OR
"Virus Diseases/transmission"[MeSH]) OR ("Poisoning/chemically induced"[MeSH] OR
"Poisoning/epidemiology"[MeSH] OR "Poisoning/aetiology"[MeSH] OR
"Poisoning/prevention and control"[MeSH]) OR diarr* OR stomach OR vomit* OR
waterborne OR "water-borne" OR "water borne"
Limit:
Human
Restrict to developed countries only:
"Canada"[MeSH] OR "United States"[MeSH] OR "Japan"[MeSH] OR "Europe"[MeSH] OR
"Australasia"[MeSH]
Exclude studies stating developing, or middle-income, country (only) setting:
"Asia"[MeSH] OR "Siberia"[MeSH] OR "Georgia (Republic)"[MeSH] OR "South
America"[MeSH] OR "Central America"[MeSH] OR "Africa"[MeSH] OR "Mexico"[MeSH]
Embase Search Strategy
Exposure:
exp SEWAGE TREATMENT/ OR exp SEWAGE/ OR exp Microbiology/ OR exp Water
Supply/ OR exp Water Management/ OR exp Water Pollutant/ OR exp NEPHELOMETRY/
OR exp Water Pollution/ OR exp CORROSION/ OR water treat$ OR nephelomet$ OR
44

turbid$ OR water source$ OR water filt$ OR boil$ water OR tap water OR water discolo$
OR water qualit$ OR water deteriorat$ OR potable OR corrosion by-product OR waste water
Outcome:
exp Gastrointestinal Disease/et, pc, ep [Aetiology, Prevention, Epidemiology] OR exp
CRYPTOSPORIDIOSIS/et, pc, ep [Aetiology, Prevention, Epidemiology] OR exp
CRYPTOSPORIDIUM/ or exp CRYPTOSPORIDIUM PARVUM/ OR exp
GIARDIASIS/ep, et, pc [Epidemiology, Aetiology, Prevention] OR exp GIARDIA/ or exp
GIARDIA LAMBLIA/ OR exp Virus Infection/et, pc, ep [Aetiology, Prevention,
Epidemiology] OR exp BACTERIAL INFECTION/et, pc, ep [Aetiology, Prevention,
Epidemiology] OR exp Intoxication/et, pc, ep [Aetiology, Prevention, Epidemiology] OR
diarr$ OR stomach$ OR vomit$ OR waterborne OR water-borne OR water borne
Limit
Human
Restrict to developed countries only:
exp CANADA/ OR united states. OR exp United States/ OR exp JAPAN/ OR Japan OR
Europe OR exp EUROPE/ OR exp "AUSTRALIA AND NEW ZEALAND"/ OR exp
AUSTRALIA/ OR Australia OR new Zealand. OR exp New Zealand/
Exclude studies stating developing, or middle-income, country (only) setting:
Asia OR exp ASIA/ OR exp SOUTH ASIA/ OR Asia OR exp ASIA/ OR exp SOUTHEAST
ASIA/ OR south America OR exp South America/ OR central America OR exp Central
America/ OR exp AFRICA/ OR Africa OR Mexico OR exp MEXICO/
Aquatic Science and Fisheries Abstracts 3: Aquatic Pollution and Environmental Quality and
Industrial and Applied Microbiological Abstracts (Microbiology A) combined search strategy
45

discolo* or turbid* or waterqualit* or drink*AND Gastrointestinal or diarr* (all free text
terms)
Unpublished Literature
System for Information on Grey Literature in Europe (SIGLE) search strategy
discolo* or water quality or turbid* or drink* AND enteritis or gastrointestinal or diarr* or
gastroenteritis or enteric
No structured search strategy was used for the following sources:
Water Intelligence Online : (2001-2004 Reports and Conferences from International Water
Association (IWA) and its Water Environment Research Foundation (WERF) and the
American Water Works Association (Awwa))
Health Canada
Theses.com (UK/Ireland)
Theses Canada
46

Annex B Form used to critically assess the papers included in the review.
Water discolouration and GI illness
Aspects to consider in reviewing papers
Paper ID #:
First Author:
Design Issues
1. Relevance to UK setting
2. Exposure definition:
a. Clear definition of exposure (discolouration/turbidity)
b. Appropriate definition of exposure
3. Outcome definition:
a. Clear definition of outcome (GI)
b. Appropriate definition of outcome
4. Study population:
a. Clearly defined exposed (to discoloured water) population
b. Appropriately chosen exposed population, eg. corresponds to population from
which cases arise
47

c. Appropriate ascertainment of exposure
d. Clearly defined catchment population for outcome (GI)
e. Appropriate ascertainment of GI
f. Identical coverage of exposed and outcome population
5. Appropriate sample size/power (no. of people affected, analysis units, over time)
Where relevant to study design (e.g. exposed versus non-exposed areas, outbreak analysis):
6. Selection method of study (discolouration) population following event
7. Use of control area/group
8. Selection method of control area/group
9. Appropriateness of control/area group
10. Pre-event measurements of discolouration/turbidity (exposure baseline)
11. Pre-event measurements of GI (outcome baseline)
12. Extent of blinding (where appropriate) of subjects/investigators to study hypothesis
48

Analytical Issues
1. Appropriate statistical analyses
2. Account taken of delay between exposure and outcome (eg. incubation period or lags
for time-series)
3. Account taken of seasonality/time trends
4. Account taken of other confounders (for time-series only time-varying factors)
5. Account taken of autocorrelation (eg. appropriate degree of smoothing, residual
analysis)
6. Multiple testing
7. Account taken of baseline characteristics (eg. per-discolouration levels)
8. If relevant, appropriateness of dose-response analyses
9. Clear presentation of results
10. Crude analyses (eg. unadjusted/univariate)
49

11. Multivariate analyses (including interactions)
12. Details of missing data
13. Appropriate measure of effect/impact calculated
14. Appropriate confidence intervals/p-values
Interpretation
1. Conclusions justified by results
2. Consideration of bias/confounding
3. Evaluation of causality (eg. Bradford-Hill “criteria”, effect magnitude, temporality,
biological plausibility, dose-response etc.)
50
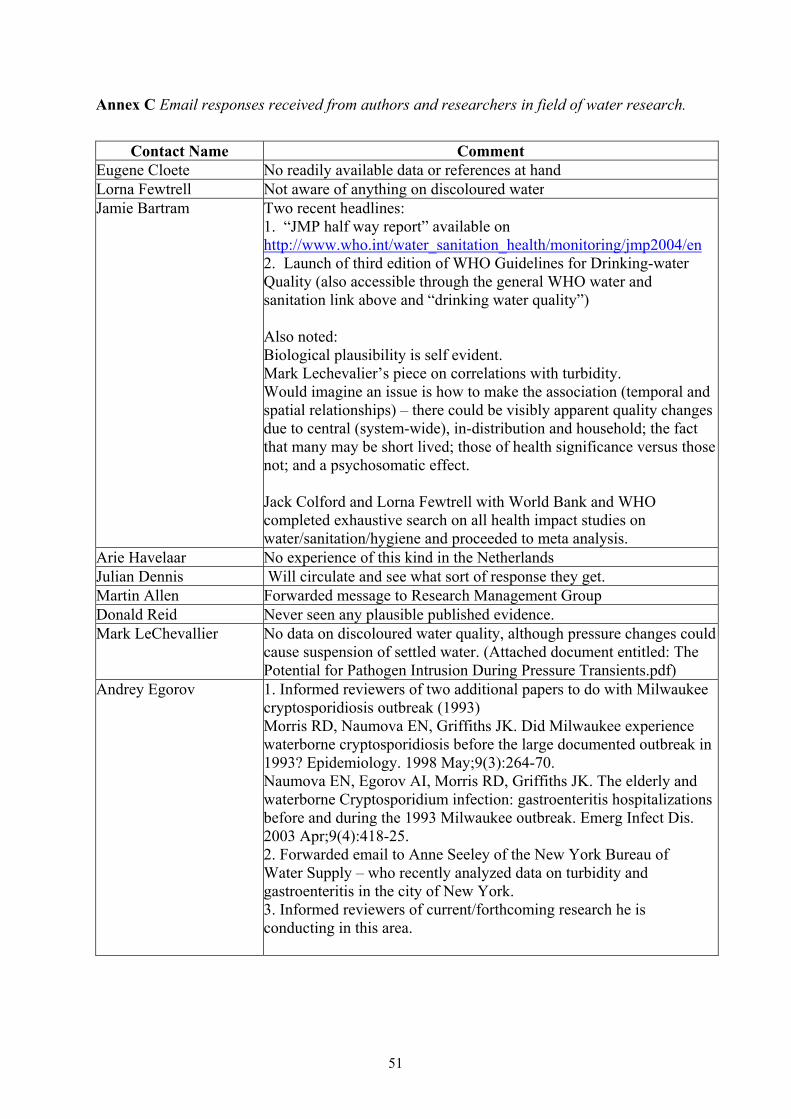
Annex C Email responses received from authors and researchers in field of water research.
Contact Name Comment
Eugene Cloete No readily available data or references at hand Lorna Fewtrell Not aware of anything on discoloured water Jamie Bartram Two recent headlines:
1. “JMP half way report” available on http://www.who.int/water_sanitation_health/monitoring/jmp2004/en 2. Launch of third edition of WHO Guidelines for Drinking-water Quality (also accessible through the general WHO water and sanitation link above and “drinking water quality”) Also noted: Biological plausibility is self evident. Mark Lechevalier’s piece on correlations with turbidity. Would imagine an issue is how to make the association (temporal and spatial relationships) – there could be visibly apparent quality changes due to central (system-wide), in-distribution and household; the fact that many may be short lived; those of health significance versus those not; and a psychosomatic effect. Jack Colford and Lorna Fewtrell with World Bank and WHO completed exhaustive search on all health impact studies on water/sanitation/hygiene and proceeded to meta analysis.
Arie Havelaar No experience of this kind in the Netherlands Julian Dennis Will circulate and see what sort of response they get. Martin Allen Forwarded message to Research Management Group Donald Reid Never seen any plausible published evidence. Mark LeChevallier No data on discoloured water quality, although pressure changes could
cause suspension of settled water. (Attached document entitled: The Potential for Pathogen Intrusion During Pressure Transients.pdf)
Andrey Egorov 1. Informed reviewers of two additional papers to do with Milwaukee cryptosporidiosis outbreak (1993) Morris RD, Naumova EN, Griffiths JK. Did Milwaukee experience waterborne cryptosporidiosis before the large documented outbreak in 1993? Epidemiology. 1998 May;9(3):264-70. Naumova EN, Egorov AI, Morris RD, Griffiths JK. The elderly and waterborne Cryptosporidium infection: gastroenteritis hospitalizations before and during the 1993 Milwaukee outbreak. Emerg Infect Dis. 2003 Apr;9(4):418-25. 2. Forwarded email to Anne Seeley of the New York Bureau of Water Supply – who recently analyzed data on turbidity and gastroenteritis in the city of New York. 3. Informed reviewers of current/forthcoming research he is conducting in this area.
51

Proposal for a study investigating any potential relationship between the supply of discoloured water and gastrointestinal illness
Background
There has been some speculation regarding whether drinking water that meets legal requirements for
quality can cause acute gastrointestinal illness (GI illness). A body of research exists addressing this
issue, mainly investigating the effect of variations in turbidity at point of treatment and the use of
filters at point of use on the incidence of GI illness. There has also been public health interest in
whether events resulting in sudden obvious discolouration of the water supply could result in an
increase in the incidence of GI illness among those exposed; the review phase of this study failed to
find any studies that specifically addressed this issue. Discolouration of tap water can be caused by
inadequately treated water entering the distribution system, but is more often associated with the
disturbance of sediment, particularly corrosion products, within the distribution systems. The
possibility of poor control within the distribution system may coincide with presence and survival of
gastrointestinal pathogens such as Salmonella, Campylobacter, Cryptosporidium, Giardia or
toxigenic strains of E. coli and Shigella that transiently pass through the system and are not detected
during routine monitoring of grab samples.
There were 44 discolouration events in England and Wales during 2003 that were notified to the DWI
and classified as ‘incidents’, affecting approximately 1.4 million consumers’ (1). A similar number of
events were notified to DWI but classified as ‘non-incidents’ (for definition of incidents and non-
incidents see ‘Definition of Exposure’ section below). Thus, water discolouration is a relatively
common occurrence: even a small relative increase in the risk of GI illness may be of considerable
public health importance. No studies have been conducted to investigate specifically whether events
of water discolouration cause an increase in GI illness. There have been studies on the variation of
parameters of water quality (such as turbidity), but these studies mostly measured parameters at the
treatment plants and rarely in the distribution zone. The effect on GI illness of changes in turbidity or
discolouration occurring after the water has left a plant has not been studied rigorously before. The
52

vast majority of discolouration events in England and Wales (E&W) occur in the supply zones rather
than at the treatment plants (personal communication, Annex 5). In order to address the question of
whether water discolouration events cause increases in the incidence of GI illness, an epidemiological
study is needed. We propose here a study to investigate the effect of water discolouration events
(notified to the Drinking Water Inspectorate (DWI) and irrespective of whether they are subsequently
classified as incidents or non-incidents) on the incidence of acute GI illness in the affected
populations.
Overview of project structure
The study will consist of two separate components. The first component will be a study of water
discolouration events (incidents and non-incidents) and their effect on the incidence of acute GI illness
as assessed by routinely collected health data. This analysis will be performed using historical data
from past discolouration events. Consideration was given to whether this part of the study would need
to be extended to include future events if, after examination of reports of all past events, it was
apparent that existing data are not of sufficient quality for analysis, or that the number of past events
with good quality information is too small to provide sufficient statistical power. However, following
examination of a number of incident and non-incident reports and discussions with six water
companies, it was concluded that the data held on historical events would be of sufficient quality to
address the primary aims of the study. The proposed retrospective study also includes an analyses of
events of depressurization, for which the data availability and quality are similar to events of
discolouration.
In the second study component, a series of telephone surveys is proposed in areas affected by new
water discolouration events and appropriately selected unaffected areas. The difference in incidence of
reported acute GI illness between affected and unaffected communities will then be estimated.
Because the telephone surveys will be conducted soon after the event, it will be possible to assess
awareness of the event and consequent behavioural changes in water consumption.
53

Part I: Study of discolouration events using routine health databases
Aims and objectives
The main aims of the study are to determine (1) whether events of water discolouration lead to an
increase in the incidence of acute GI illness in the affected population, and (2) whether specific
features of events (for example chemistry, turbidity) and of affected water supply networks influence
the risk of acute GI illness following an event.
Primary study objectives
1. To determine whether events of water discolouration in a water supply zone lead to an increase in
the incidence of acute GI illness in the affected population.
2. To determine whether events of water depressurisation in a water supply zone lead to an increase
in the incidence of acute GI illness in the affected population.
3. To determine if any characteristic of water discolouration (e.g. cloudy vs. brown discolouration,
presence of iron/manganese/aluminium, turbidity level) or characteristics (e.g. age of the system,
material of pipes, type of soil, renewal efforts, rural/urban/metropolitan setting, social deprivation)
of the water supply zone affected by an event influence any subsequent risk of acute GI illness.
4. To determine whether any characteristics of the water supply zone affected by a depressurisation
event influence any subsequent risk of acute GI illness.
5. To determine the extent to which events of discolouration are associated with depressurisation of
the water supply, and if possible, examine the separate and combined effects of these on the risk of
GI illness
6. To estimate the proportion of acute GI illness in England and Wales, as reported by routine health
data sources, that is attributable to water discolouration and depressurisation events, i.e. the
population attributable fraction (PAF).
54
Secondary study objectives
7. To assess whether there is a characteristic delay (lag) between exposure to discoloured (or
depressurised) water and any subsequent peak in the incidence of GI illness, which might point to
specific aetiologies.
8. To explore whether the effect of a water discolouration and/or depressurisation event on acute GI
illness is more pronounced in certain age groups, in particular children and the elderly.
Study design and methods
The study aims will be investigated using a retrospective cohort drawn from the population of England
and Wales during the years 1999 to 2003. The cohort will comprise residents of households in areas
affected by water discolouration (and depressurisation) events (all events notified to the DWI,
irrespective of whether DWI classify them as incidents or non-incidents) during this time period. The
incidence of acute GI illness in these areas in the two weeks following an event will be compared with
that in appropriately selected unaffected (control) areas over the same time period. In addition, the
change in incidence of acute GI illness at various time points following an event will be estimated in
order to identify characteristic lag times between exposure and illness.
Choice of outcome
Episodes of acute GI illness will be ascertained from two different sources: hospital admissions and
calls to the NHS Direct Telephone Service. Data on hospital admissions will be obtained from the
Hospital Episode Statistics (HES) Database (England) and the Patient Episode Database Wales
(PEDW). Data on calls to NHS Direct will be obtained from the NHS Direct database. These data
sources were selected because they both provide widespread geographic coverage, geographic location
at seven-digit postcode level, and precise timing. The two databases capture different aspects of GI
illness - calls to NHS Direct are likely to include the most common, milder episodes, whereas
hospitalisations are likely to result from more severe disease. We outline the characteristics of these
data sources below.
55
HES/PEDW
HES records details of all admissions to National Health Service (NHS) hospitals in England and
Wales according to the ICD-10 code of an illness or symptom/sign. Its Welsh equivalent is PEDW.
Information available on admissions includes patient age and gender, postcode of residence, primary
diagnosis, date of admission, and length of hospitalisation. For the purposes of the study, the following
ICD-10 codes will be considered, as they are the most likely to capture acute GI illness: A00-A09.9
(diarrhoea of infectious or presumed infectious origin); K52.9 (non-infective gastroenteritis and colitis,
unspecified); R11 (nausea and vomiting). Cases will be included in the study if they are hospitalised
with any of these conditions as the primary diagnosis and if they resided in an affected area (as
determined by their postcode) in the two weeks following an event or in a pre-defined control area
during the same time period.
HES/PEDW data have good geographic resolution and good resolution in time. Of particular interest,
they are robust to bias; hospitalised cases are more severe, making it less likely that hospitalisation
could be influenced by patients’ perception of risk if, for example, they were aware that their water
supply was discoloured. This is in contrast to NHSdirect (see below).
NHS Direct
NHS Direct is a telephone service provided by the NHS since May 2001 with the aim of providing
advice to individuals prior to seeking medical advice in healthcare facilities. Information is available
on calls related to the occurrence of 10 specific conditions, including diarrhea and vomiting. The age,
sex and seven-digit residential postcode of callers who do not wish to remain anonymous are also
available. Thus, it is possible to use NHS Direct as a measure of disease occurrence (for which health
advice is sought) in the community. NHS Direct data have good geographic and temporal resolution.
A limitation of NHS Direct data is the potential for bias: cases recorded by NHS Direct are a self-
selected group of cases, in that they represent those cases who have GI illness and have decided to call
56

NHS Direct. If people who know that they have been exposed to discoloured water are more likely to
call NHS Direct, this could lead to an observed increase in GI illness that did not necessarily reflect a
true increase in disease incidence.
Although neither of these data sources provide complete ascertainment of all GI illness in the
community - they only capture GI illness either resulting in hospitalisation or for which telephone
advice was sought - they should be sufficiently consistent to be good indicators of changes in
incidence of mild and severe GI illness over time.
Other sources of routine data on GI illness have been assessed for use in the proposed study, but have
been deemed to be inadequate, either due to poor geographic resolution or limited geographic
coverage. These include the General Practitioner Research Database (GPRD), over-the-counter sales
of diarrhoea-related drugs, laboratory reports of pathogens routinely isolated from stool samples,
notifications of food poisoning and reports of disease outbreaks. The grounds on which these data
sources were excluded are summarised in Annex 1.
Definition of exposure
The main exposure under study is discolouration classified as an event occurring within geographic
areas defined by affected water supply zones. Under the Water Undertakers (Information) Direction
1998, water companies are required to report as soon as possible to the Drinking Water Inspectorate
(DWI) any event which gives rise, or is likely to give rise, to a significant risk to the health of
consumers. All events must be confirmed in writing within 72 hours and an assessment of this initial
report is carried out by the DWI within five days of receipt. Events of a particular nature, including
adverse water quality changes (e.g. discolouration) as perceived by consumers, are classified by the
DWI as an ’incident’ and a full report must be submitted by the water company to the DWI within 30
days. We propose that in this study all events reported to the DWI since 1999 (the first full year in
which the Direction came into force defining an incident) and affecting at least 1000 people (for
statistical power and applicability/generalisability of results) are included, irrespective of whether they
57

are classified as an incident or non-incident. Events not classified by DWI as incidents (non-incidents)
may include changes to the water supply that are less perceivable (e.g. less visible) to the consumer. A
potential advantage of including such events is that the potential for bias (resulting from people
modifying their water consumption behaviour) could be reduced. Although only a ‘72-hour’ report is
available for each non-incident the quality of data relevant to the primary objectives of the proposed
study is comparable to that of incidents (a number of non-incidents may have insufficient data on the
characteristics of the event (objective 3) because a full report is not available but this is likely to be a
small proportion of all non-incidents). See annex 6 for more details regarding the inclusion of non-
incidents.
A database of all incidents and non-incidents under study will be produced. The variables in the
database will include parameters characterising each event, e.g. cloudy or brown discolouration, level
of iron, manganese, aluminum and turbidity, ground or surface water, number of consumer
complaints. Data regarding individual events will be abstracted from the 72-hour and 30-day reports
and entered into the database. Geographic information on postcodes affected by the event will be
extracted from the geographical information system (GIS) held by each company (see annex 6). An
exposed area will be defined as a group of postcodes affected by an event at a certain time as
identified by the water company together with a dedicated researcher. The geographic boundaries of
the exposed areas will be defined by mapping the postcodes affected by an event to census Output
Areas (OAs), the smallest geographical area for which basic demographic data have been aggregated.
These are statistical units of geography largely defined on the basis of geographic proximity and
social homogeneity (2). All 2001 census data are available at the level of census OAs with a
population size of approximately 300 individuals. Thus, the 2001 census data on the exact population
size, age structure, female/male ratio, social deprivation and ethnicity can be linked to OAs. Although
these data are only available for the 2001 census year, we are confident that they can be used to
characterise affected and control areas throughout the study period, as socio-demographic measures
are unlikely to have changed materially over such a short time. Since tables specifying the OA to
which a postcode belongs are available, routine health data at 7-digit postcode level can be linked to
58
each OA, numbers of cases of GI illness from routine sources can be related to the population in the
areas, and the incidence of acute GI illness in exposed and unexposed areas estimated and compared.
The misclassification introduced by the use of OAs rather than 7-digit postcode is likely to be
minimal, particularly for large events, and can be examined by conducting sensitivity analyses (e.g.
by excluding smaller events from the analysis). See Annex 6 for further discussion of exposure
misclassification.
Selecting a control area for each exposed area
In order to obtain potential control areas of sufficient size, England and Wales will be divided into
areas resulting from the combination of adjacent OAs, comprising between 1,000 and 50,000
individuals (between 3 and 160 OAs). For events affecting more than 50,000 people, OAs will be
aggregated further. Control areas for each individual event will be selected from these pre-defined
areas. In order to control for differences in the baseline (pre-event) level of acute GI illness, control
areas will be matched to exposed areas with respect to the incidence of acute GI illness in a defined
period before the event. For each half-year (Jan-Jun or Jul-Dec) between July 1998 and December
2003, the incidence of GI illness will be calculated for every pre-defined control area. These estimates
will be used to construct sets of 11 separate maps of England and Wales (one per half-year)
categorising control areas by incidence of GI illness. A separate set of GIS maps will be developed for
each data source used (hospitalisations and NHS Direct calls).
The matching of a control area to an exposed area will be based on the incidence of GI illness before
the event. For each exposed area, the incidence of acute GI illness in the preceding six full calendar
months (Jan-Jun or Jul-Dec) will be calculated. For example, for an event taking place in September
2000, the cumulative incidence of acute GI illness will be calculated for January to June 2000
separately for hospitalisations and calls to NHS Direct.
Each exposed area will then be matched to a pre-defined control area based on geographic proximity
and baseline incidence of acute GI illness using the map appropriate to the time period of the incident
59

in the exposed area. In order to avoid exposure misclassification in control areas, a safety boundary
will be constructed around each exposed area. A potential control area must lie outside this boundary
to minimise the likelihood that (a) the control area will be served by the same water supply zone as the
exposed area, and (b) that individuals residing in the control area will not consume water in the
exposed area (e.g. which might occur if, for example, their place of employment were in an exposed
area).
Estimating incidence of acute GI illness in pairs of exposed and control areas after an event
Incidence of acute GI illness in each pair of exposed and control areas will be estimated separately for
hospitalisations and NHS Direct calls for the two weeks following an event. This will be done by
linking cases to areas using their postcode of residence and dividing the number of cases by the
population of the area. Incidence estimates will be calculated overall, as well as by sex and age group.
Statistical analysis
The analysis will compare the incidence of acute GI illness in affected areas and in control areas; the
estimate produced by this analysis is the rate ratio (RR) - the relative increase in rate of acute GI
illness. The analysis will control for incidence of acute GI illness in the affected and control areas
before the event and any relevant census characteristics of the areas. Several analytical approaches
would be appropriate to compare rates of acute GI illness in exposed and control areas following an
event (Objectives 1 and 2). A simple meta-analysis, Poisson model, or Random Effects Model (3)
would all provide an estimate of the rate ratio (RR), while taking account of the fact that each exposed
area is individually paired with a control area. The adequacy of each model will be assessed by
examining the goodness of fit and the choice of which approach to adopt will be based on this formal
evaluation. Each of these approaches can be extended to the multivariate situation in which the
confounding and modifying effects of co-factors, (Objectives 3, 4, and 5) and the age of the
population affected (Objective 8) are examined. Ninety-five percent confidence intervals (95% CIs)
and significance tests will be produced. The proportion of cases (the population attributable fraction,
or PAF) of acute GI illness occurring in England and Wales that can be attributed to discoloured (or
60

depressurised) water would be calculated on the basis of the RR calculated from objective 1 and 2 and
the estimated proportion of people affected each year by an event (Objective 6). If an increase in acute
GI illness is found in areas exposed to a water discolouration (or depressurisation) event (Objective
1), then analyses will be carried out to examine whether there is a characteristic time lag after which a
peak in incidence occurs (Objective 7).
Sample size calculation
The following sample size calculations refer to events of water discolouration, but apply equally to
depressurisation events, since an equal number of these would be available for analyses.
According to the DWI Website (1), a total of 310 water discolouration incidents occurred between
1999 and 2003 (the annual number of incidents has decreased steadily from 95 in 1999 to 44 in 2003).
Approximately 90% of these incidents affect more than 1000 people, so the maximum number of
discolouration incidents available for a retrospective analyses is likely to be approximately 280.
Approximately 50% of discolouration events reported to the DWI are classified as non-incidents, so a
similar number (280) of non-incidents (affecting at least 1000 people) would be available, providing a
total of 560 events in total. However, as stated in the ‘Choice of outcome’ section earlier, NHS Direct
has only been in operation since May 2001. Therefore, only incidents and non-incidents since that date
can be included in an analysis of NHS Direct calls, of which there have been approximately 240
discolourations in total.
Assuming the number of incidents and non-incidents continues to decline to a plateau over
forthcoming years, then the number of future events per year is likely to be, on average, around 60 (30
incidents and 30 non-incidents) in total.
Based on the 1999-2003 incident and non-incident data, the mean number of people affected per
incident is approximately 18,000.
61
Background incidence in HES/PEDW
According to the 2000 and 2001 HES/PEDW databases the number of NHS hospital admissions in
England and Wales due to acute GI illness (as defined by the ICD-10 codes described earlier) is
around 70,000 per year. This equates to approximately 5 admissions per 100,000 individuals during a
two-week period.
Background incidence in NHS Direct
Based on NHS Direct calls from 1st Aug 2003 to 31st July 2004, at least 14 calls due to diarrhoea and
20 calls due to vomiting can be expected in a two-week period.
The table in Annex 2 shows the number of events that would be required in order to detect a range of
specified rate ratios, reflecting the increase in risk of GI after an event. The following assumptions are
made: (i) the coefficient of variation between clusters is k=0.5, (ii) a power of 80% and significance
level of 0.05 is required.
If all (560 for HES/PEDW and 240 for NHS Direct) retrospective incidents and non-incidents were
available for analysis, there would be 80% power to detect a rate ratio of approximately 1.2 for
HES/PEDW and 1.18 for NHS direct. A rate ratio of 1.2 for HES/PEDW represents a 20% increase in
the number of admissions in exposed areas during the two weeks following an event. Thus, if the
baseline rate of hospitalisations for acute GI illness in control areas is 5 per 100,000 (as stated above),
then there would be approximately 504 expected admissions in all of the control areas combined (from
560 areas of 18,000 people = 10,080,000 people) and 605 admissions (an extra 20% = 101 admissions)
in areas exposed to discoloured water.
Up to 20% of retrospective events may not be available for analysis because of practical limitations of
collecting the data or difficulties in identifying the affected population. If only 80% of events during
1999 to 2003 were available for analyses then the retrospective study would still have 80% power to
62

detect an increase in hospital admissions of approximately 22% (compared to 20% if all events were
available for analysis) and an increase in NHS Direct calls of 20% (compared to 18%).
The extent to which only readily available retrospective events could be used to examine whether
specific characteristics of water discolouration events are responsible for increases in acute GI illness
(Objective 3) is dependent on the frequency with which the characteristic occurs. For example,
approximately 70% of discolouration events are classified as “brown”, so there would be 392
retrospective events of “brown” discolouration available for HES/PEDW analysis and 168 events for
NHS Direct. This would provide 80% power to detect a 25% increase (RR=1.25) in hospital
admissions and a 22% increase (RR=1.22) in NHS Direct calls.
Although the inclusion of prospective events over future years would increase the statistical power of
the study, the detectable rate ratios would be reduced only slightly. Continuation of the study for a
further 5 years would add approximately 300 extra events into the analysis, and an increase in hospital
admissions of 16% (rather than 20%) and NHS Direct calls of 12% (rather 18%) would be detectable
if all 300 prospective events were analysed together with the retrospective events.
Decision to include future incidents into the study
The inclusion of events occurring after the start of the study would be necessary if the number of past
events (or the population affected by past events) with adequate geographic information (i.e.
information of sufficient quality to obtain a precise definition of exposed areas) is too small or the
information regarding the events themselves as provided by DWI/water companies is insufficiently
detailed to provide adequate statistical power to detect the desired magnitude of effect on GI illness.
Detection of smaller increases in risk require larger sample sizes. In this case, the study can be
extended to include future events. More precise geographic and other information for future events
may be obtainable by increasing the degree of sampling following an event and increasing the degree
of customer contact. However, the practical limitations (e.g. costs) of increased sampling and
increased customer contact, together with the modest increase in statistical power (as stated in the
63

sample size section above) suggest that inclusion of prospective events over a five-year period may be
of limited value. Inclusion of prospective events may be of greatest relevance for analyses of NHS
Direct calls (since only 240 retrospective events are available) and examination of whether specific
characteristics of events are responsible for increases in acute GI illness (objective 3). For example, in
a group of 300 prospective events there are likely to be approximately 200 in which the water is
classified as “brown”. The analysis would then have 80% power to detect a 20% increase in hospital
admissions of acute GI illness related to “brown” water events (compared with 25% if only
retrospective events were included).
The methods of selecting exposed and control areas would be the same as used in the retrospective
analysis. Since the annual number of future events is uncertain, but likely to decline, the timeframe of
the prospective assessment of events is not entirely certain (see sample size calculation).
Part II: Survey of the effect of new discolouration incidents on water consumption and on
community-level acute GI illness
Aims of the study
The first part of the study described above will investigate whether water discolouration events have
an effect on the incidence of acute GI illness - as measured by hospitalisations and calls to NHS Direct
- that is detectable at a population level. Although geographic information will be used to define
exposed areas with the greatest possible precision, the study does not explore whether an absence of
increased risk after an event is associated with the discoloured water being safe or an avoidance of
water consumption by consumers because of awareness of discolouration. Data on consumption of
water are not routinely available at individual level. The proposed second phase of the study will
address these issues by using telephone surveys of exposed and control areas following an event in
order to collect information on changes in water consumption. This information will be used to
interpret findings arising from Part I of the project. This second phase will also investigate whether
discolouration events have an effect on the incidence of milder GI illness as recalled by individuals. A
64

limitation of such telephone surveys is that they are subject to reporting bias as awareness of the
discolouration event can influence whether the respondent will consider as diarrhoea mild changes in
frequency and/or consistency of stools that are unrelated to acute GI illness. Thus, data from both the
telephone surveys and NHS Direct are more susceptible to bias than data from hospitalisations. An
advantage of using telephone surveys, however, is that they allow for investigation of any effect of
discolouration events on mild acute GI illness (as opposed to severe illness obtained using
hospitalisation data).
Study objectives
1. To estimate the effect of discolouration events on mild acute GI illness in the community.
2. To calculate the population attributable fraction (PAF) of mild acute GI illness caused by water
discolouration events
3. To study the effect of water discolouration on water consumption behaviour and to determine
whether changes in drinking behaviour can explain any effect on frequency of diarrhoea.
Study design and methods
Because each survey would need to be conducted a short time after the event, the timeliness of
notification and information exchange is crucial. This will require close collaboration between the
water companies, the DWI and the study team. Water companies will be requested, through the
Drinking Water Inspectorate, to provide accurate geographic information on the area affected by an
event within 10 days of it being declared. Once geographic information is obtained, exposed and
control areas will be determined by the same methods as used in the retrospective component.
Data collection: telephone surveys
Two weeks after each event a telephone survey in the exposed and control areas will be conducted for
a duration of seven days. During this time, a number (sample size calculations are shown for 500 and
1000) of randomly selected households in each exposed and control area will be contacted. In the UK,
approximately 95% of private households have a fixed line4. Established procedures exist for using
65

postcode information to carry out random digit dialing of residential telephone numbers within a
geographical area (MORI). One option is to subcontract the telephone survey to an organisation such
as MORI who are established in carrying out such large volume telephone surveys over a short time.
Mobile telephone numbers will not be included. Individuals selected for an interview will be asked
questions including those on symptoms of acute GI illness (using procedures established for the
assessment of diarrhoea in the community (4)) following an event, frequency and recent changes in tap
water consumption and whether they noticed anything unusual about their water in the last few weeks.
Statistical analysis
Analysis similar to that proposed in Part I of the project will be carried out to compare incidence of
mild acute GI illness in exposed and control areas (Objective 1) and also to calculate the proportion of
mild acute GI illness in the community that is attributable to events of water discolouration (Objective
2). Descriptive analyses will be carried out of reported changes in water consumption, reported
awareness of the discolouration event and reported frequency of mild acute GI illness in the two weeks
preceding the interview (Objective 3). A comparison of the incidence of mild acute GI illness in
exposed and control areas will then be conducted taking into account awareness of the event and water
consumption.
Sample size
The incidence rate of diarrhoea in the community is estimated to be around 194 per 1000 person years
(6). This approximately corresponds to a cumulative incidence risk of 8 cases per 1000 individuals in a
two-week period.
Table 2 in Annex 2 shows the number of prospective events (incidents and non-incidents) that would
be required to detect specified rate ratios using a telephone survey. Five years of prospective events
(i.e. 300 in total) would provide 80% power to detect rate ratios between 1.15 and 1.2 depending on
the number of successful calls made per event. If only two years of prospective events were analysed
66

(120 events) then a rate ratio of 1.3 would be detectable with 80% power (assuming 500 calls were
made in exposed and control areas) for both HES/PEDW and NHS Direct.
67

Timeframe of study
Retrospective part:
Preparatory phase Months
Planning and recruitment 3
Ethic and confidentiality approval PEDW , HES, NHSdirect databases
3
Acquiring GIS system and training 4
Acquiring HES, PEDW, NHSdirect, and census data 6
Liaison with DWI and water industry to identify all potential past events and acquire postcode data of areas affected
11
Abstracting information on past events (including characteristics of events) from 7 day and 30 days reports and creating the database on past events, and entering data on data base
9
GIS mapping of England and Wales into potential control areas based on SOAs (3 months)
3
Linking incidence of acute GI (separately for hospital data and from NHS direct data) to all potential control areas and estimation of incidence by age and sex in 6 months periods in control areas
3
Linking postcodes of areas affected by each event to geographical areas in the GIS system. Definition of exposed areas. Estimate of incidence of GI in the 6 months prior to event. Transfer to the event database
5
Selection of a control area for each exposed area. 2
Linking incidence of acute GI (separately for hospital data and from NHS direct data) to each pair of exposed area and control area and estimation of incidence by age and sex in the 2 weeks after the event. Transfer to the event database.
2
Abstracting census data on characteristics of exposed areas and control areas and transferring to the event database.
2
Analytical Phase
Analysis of primary study questions (for both discolouration and depressurisation events)
10
Analysis of secondary study questions (for both discolouration and depressurisation events)
7
Interpretation and writing up phase: Writing report to DWI, discussion with DWI, preparation of final report and writing manuscripts for publications
6
68

Prospective part:
Preparatory phase Months
Planning and recruitment 3
Ethic and confidentiality approval PEDW , HES, NHSdirect databases
3
Acquiring GIS system and training 4
Acquiring HES, PEDW, NHSdirect, and census data 6
Liaison with DWI and water companies to establish procedures for identifying events and notifying LSHTM
6
Liaison with telephone survey company to establish procedures for responding to incident.
6
GIS mapping of England and Wales into potential control areas based on SOAs (3 months)
3
Linking incidence of acute GI (separately for hospital data and from NHS direct data) to all potential control areas and estimation of incidence by age and sex in 6 months periods in control areas
3
Accrual of prospective events. Within 2 weeks following event: (I) Notification of event by DWI to LSHTM, (ii) selection of a control area, (iii) notification by LSHTM to telephone survey company of postcodes affected by event and postcodes pf potential control households, (iv) conduct of telephone interview by company.
24
Analytical Phase
Analysis of primary study questions 5
Analysis of secondary study questions 4
Interpretation and writing up phase: Writing report to DWI, discussion with DWI, preparation of final report and writing manuscripts for publications
2
69

Ethical considerations
HES and PEDW require approval by the Security and Confidentiality Advisory Groups responsible.
This process will take approximately 2 to 3 months. The NHS Direct Clinical Governance Committee
gives the final decision on approval of any studies hoping to use NHS Direct data. This will have to be
achieved separately for England and Wales. NHS Direct also requires approval by an appropriate
Research Ethics Committee, before research activity may commence. Part II of the project will also
require approval by a Research Ethics Committee.
70
Annex 1: Data sources excluded form the proposal and the reasons for exclusion:
• The General Practitioner Research Database (GPRD). Only 5% of the population of England and
Wales is covered by this data source. The geographic resolution is poor (cases are allocated to
large areas for confidentiality reasons). Detailed information of acute GI cases can only be
obtained with the approval of all GPs responsible for providing care. This would be unfeasible in
the time frame required.
• Sales of over-the-counter medications. These data can be acquired only at regional level. Sales
from wholesalers to pharmacies are available for 4 to 5 letter postcodes, but the resolution in time
is poor (sales per calendar month only).
• Laboratory reports of isolates in routine stool samples. These represent only a small fraction of
incident acute GI illness and do not include non-microbiological causes. Temporal resolution is
not very good as date of disease onset is rarely available, and geographic resolution is poor.
• Notifications of food poisoning are of limited use for this study, as the geographic information
provided is imprecise and date of illness onset is not available at national level.
• Reports of disease outbreaks contain information about the characteristics of outbreaks, but no
information at the individual level. Thus, geographic information on cases affected is of
insufficient quality.
71

Annex 2 : Sample size calculation
The following formula5 (Bennett and Hayes) has been used to determine the number of incidents
required to detect specified rate ratios:
c = 2+f[p0 (1 - p0) / m + p1(1 - p1) / m + k2(p02 + p1
2)] / (p0 - p1) 2
where c is the number of water discolouration events (clusters) required (an equal no. of unexposed
areas is also required), p0 is the cumulative incidence risk in the unexposed area, p1 is the incidence
risk in the exposed area, m is the number of individuals in each cluster, and k the coefficient of
variation between clusters; f equals 7.84 for a power of 80% and alpha of 0.05.
Table 1. Sample size (number of events) required to detect specified Rate Ratios using HES/PEDW,
NHS Direct.
Relative Risk HES NHSdirect
1.1 3480 704
1.2 558 192
1.3 263 151
1.5 176 93
2.0 58 16
72

Table 2. Sample size (number of events) required to detect specified Rate Ratios using a telephone
survey.
Relative Risk 500 calls* Years required 250 calls* 1000 calls *
1.1 843 10+ 1251 639
1.2 228 5-10 300 174
1.3 110 3-4 143 85
1.5 47 2 60 37
2.0 17 1 21 15
*Number of calls required in both the exposed and control areas
73
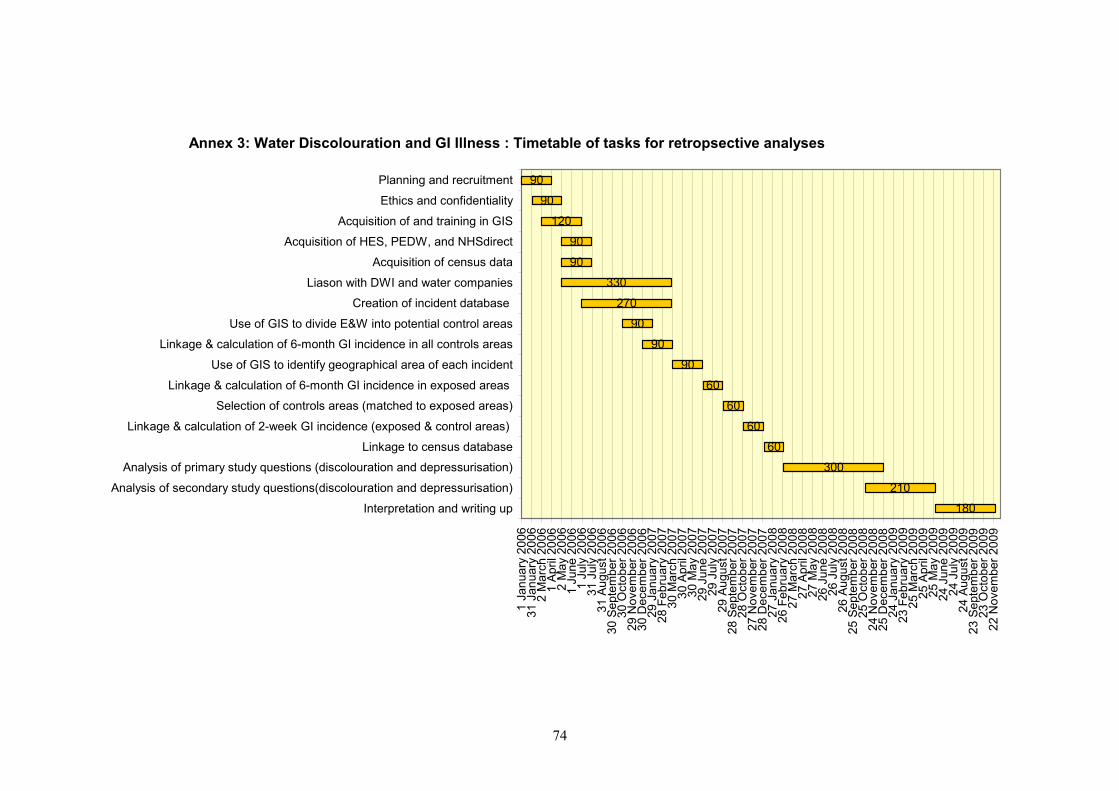
Annex 3: Water Discolouration and GI Illness : Timetable of tasks for retropsective analyses
180
210
300
60
60
60
60
90
90
90
270
330
90
90
120
90
90
1 Ja
nuar
y 20
0631
Jan
uary
200
62
Mar
ch 2
006
1 Ap
ril 2
006
2 M
ay 2
006
1 Ju
ne 2
006
1 Ju
ly 2
006
31 J
uly
2006
31 A
ugus
t 200
630
Sep
tem
ber 2
006
30 O
ctob
er 2
006
29 N
ovem
ber 2
006
30 D
ecem
ber 2
006
29 J
anua
ry 2
007
28 F
ebru
ary
2007
30 M
arch
200
730
Apr
il 20
0730
May
200
729
Jun
e 20
0729
Jul
y 20
0729
Aug
ust 2
007
28 S
epte
mbe
r 200
728
Oct
ober
200
727
Nov
embe
r 200
728
Dec
embe
r 200
727
Jan
uary
200
826
Feb
ruar
y 20
0827
Mar
ch 2
008
27 A
pril
2008
27 M
ay 2
008
26 J
une
2008
26 J
uly
2008
26 A
ugus
t 200
825
Sep
tem
ber 2
008
25 O
ctob
er 2
008
24 N
ovem
ber 2
008
25 D
ecem
ber 2
008
24 J
anua
ry 2
009
23 F
ebru
ary
2009
25 M
arch
200
925
Apr
il 20
0925
May
200
924
Jun
e 20
0924
Jul
y 20
0924
Aug
ust 2
009
23 S
epte
mbe
r 200
923
Oct
ober
200
922
Nov
embe
r 200
9
Interpretation and writing up
Analysis of secondary study questions(discolouration and depressurisation)
Analysis of primary study questions (discolouration and depressurisation)
Linkage to census database
Linkage & calculation of 2-week GI incidence (exposed & control areas)
Selection of controls areas (matched to exposed areas)
Linkage & calculation of 6-month GI incidence in exposed areas
Use of GIS to identify geographical area of each incident
Linkage & calculation of 6-month GI incidence in all controls areas
Use of GIS to divide E&W into potential control areas
Creation of incident database
Liason with DWI and water companies
Acquisition of census data
Acquisition of HES, PEDW, and NHSdirect
Acquisition of and training in GIS
Ethics and confidentiality
Planning and recruitment
74

Annex 4: Water Discolouration and GI Illness : Timetable of tasks for prospective part
60
122
149
740
91
91
183
183
91
91
121
88
90
1 Ja
nuar
y 20
0631
Jan
uary
200
62
Mar
ch 2
006
1 Ap
ril 2
006
2 M
ay 2
006
1 Ju
ne 2
006
1 Ju
ly 2
006
31 J
uly
2006
31 A
ugus
t 200
630
Sep
tem
ber 2
006
30 O
ctob
er 2
006
29 N
ovem
ber 2
006
30 D
ecem
ber 2
006
29 J
anua
ry 2
007
28 F
ebru
ary
2007
30 M
arch
200
730
Apr
il 20
0730
May
200
729
Jun
e 20
0729
Jul
y 20
0729
Aug
ust 2
007
28 S
epte
mbe
r 200
728
Oct
ober
200
727
Nov
embe
r 200
728
Dec
embe
r 200
727
Jan
uary
200
826
Feb
ruar
y 20
0827
Mar
ch 2
008
27 A
pril
2008
27 M
ay 2
008
26 J
une
2008
26 J
uly
2008
26 A
ugus
t 200
825
Sep
tem
ber 2
008
25 O
ctob
er 2
008
24 N
ovem
ber 2
008
25 D
ecem
ber 2
008
24 J
anua
ry 2
009
23 F
ebru
ary
2009
25 M
arch
200
925
Apr
il 20
0925
May
200
924
Jun
e 20
0924
Jul
y 20
0924
Aug
ust 2
009
23 S
epte
mbe
r 200
923
Oct
ober
200
922
Nov
embe
r 200
923
Dec
embe
r 200
9
Interpretation and writing up
Analysis of secondary study questions
Analysis of primary study questions
Accrual of all prospective events
Calculation of 6-month GI incidence in potential controls areas
Use of GIS to divide E&W into potential control areas
Liaison with telephone survey company
Liaison with DWI and water companies
Acquisition of census data
Acquisition of HES, PEDW, and NHSdirect
Acquisition of and training in GIS
Ethics and confidentiality
Planning and recruitment
75

Annex 5 : Personal communication with Mr Peter Marsden
1)The vast majority of discoloured water incidents will be identified
through customer complaints not through the spot sampling done to comply
with the regulations.
2) The vast majority of discoloured water incidents are associated with
distribution rather than treatment works
3)We do not hold postcode data for the areas affected a by incidents, just
the maps/descriptions from the company 30 day reports. However I am
reasonably confident we can get companies to provide this information should
a full study go ahead. If necessary we can revise the requirements. Do not
contact the companies at this stage, DWI will do so should a full study go ahead.
4)We discussed the need to include "non-incidents". There are arguments on both
sides. For many non-incidents water quality will not have been visibly
affected. In those where quality has been affected it may be only mildly so
resulting in increased likelihood of exposure (ie failure to reject the
water). On the other hand, they are probably of a relatively small scale and
so may not add to the power of the study. The data on area affected may be
less good, since no 30 day report will be available. You should also be
aware we have also given companies a commitment not to report non incidents
against individual companies though this should not prevent including in
this analysis. In conclusion, and contrary to my previous advice, I consider
your report should give consideration to factors described above and the
merits or otherwise of including or excluding non-incidents from any study
design including effect both on the power and the cost of the study. I will
forward data on "non-incidents" to inform your judgement.
5) I mentioned that from 1 Jan 2004 DWI will hold individual compliance
sample data that is geocoded or postcoded. We think your report should also
give consideration to the merits or otherwise of comparing these data
against any health data.
6) In my preliminary review of our database I have noticed a significant
number of notifications that relate to loss of supply or reduced pressure,
as you would expect these are almost all classified as non incidents. During
such episodes the distribution system will be vulnerable to potential ingress
which in turn could cause illness. Many discoloured water events will also
be related to loss of pressure which may be a confounding factor.
Consequently you should give consideration to how we can establish in the
main study a relation between loss of pressure and illness and hence
eliminate this from any relation between dirty water and illness. I will
forward the relevant information
77

Annex 6: Modifications to the study design to address geographic resolution and the inclusion
of ‘non-incident’ and ‘depressurisation’ events.
Following receipt of the draft Study Design Proposal in December 2004, the DWI commissioned an
extension to the original contract to address several further issues.
Specifically the DWI requested:
“The additional objective is to:
Discuss with six selected water companies (names and contact details to be provided by DWI)
the practical aspects of providing company data on the geographical area affected by event
in, and/or converting into, a format that can be used in the proposed retrospective study.
1) The discussions should cover availability of data for both the discolouration and
depressurisation events for the relevant period and irrespective of whether they are classified
as incidents or non-incidents.
2) Discussion should identify any scope for misclassification of the exposed group both in
term of the data available from the company and the proposed use of SOAs and the resulting
reduction in the power of the study the such misclassification may cause.
3) The output should inform a more detailed discussion in the final report of how any possible
confounding of association of illness with depressurisation may be quantified and eliminated
from any possible association of illness with discolouration.”
These additional issues were addressed by visiting six water companies selected by the DWI (United
Utilities, Three Valleys, Dwr Cymru, Northumbrian, Wessex, and Yorkshire) and discussing the

following questions with them. A brief conclusion is given for each question and a more detailed
commentary is presented later.
1) How accurately can the area affected by an incident be defined, what is the likely degree
of misclassification of exposure, and what are the practical implications of making the
geographical data available?
Conclusion: For the majority of incidents, the affected area (defined as area from where
complaints were received) can be identified at the 7-digit postcode level and analysed at the
level of census Output Area. The area affected might be larger than the one identified, but the
use of an exclusion boundary when selecting control areas will ensure that exposure
misclassification will not be a significant problem. No major difficulties are envisaged in
transferring the data.
2) Could events classified by the DWI as ‘non-incidents’ be included in a study?
Conclusion: Yes, the quality of data relating to non-incidents is adequate for addressing the
primary aims of the study.
3) Could events of depressurisation be included in a study and could the separate effects of
depressurisation and discolouration be examined?
Conclusion: Yes, the quality of data relating to depressurisation events is adequate for
examining their separate effects on risk of GI illness.
A detailed commentary relating to each of the above questions is given below together with the
proposed amendments to the study protocol.
79

1. Geographical definition of area affected by an ‘incident’
All six water companies visited use a geographic information system (GIS) to map customer
complaints and water supply systems. In general, at least the first 50 customer complaints of each
incident are held on the system (with a 7-digit postcode) and can be mapped and overlaid onto district
metering areas (DMAs) and water supply systems. Subsequent calls, which may be recorded by an
automated answering service, may be stored on other media and would need to be retrieved and
uploaded onto the GIS system. This information, together with supplementary information (e.g.
sampling measurements) from the ‘30-day’ paper report, could be used to identify groups of 7-digit
postcodes affected by an incident and so define the affected area. According to the water companies,
this task is likely to take an average of approximately 1 to 2 hours per incident and would require both
a dedicated researcher familiar with the paper report and a GIS person within the company.
For some incidents (estimated at 20%) during 1999-2003, either none or only a small proportion of
the customer complaints are currently available on the GIS system. In order to include these incidents
in a study, it would be necessary to extract the data from either magnetic tape or the paper report. In
this case, an additional 1 to 2 hours (estimated by the water companies) would be required per
incident, so 20% of the incidents may require up to 4 hours of labour to obtain 7-digit postcode data.
The health data (HES/PEDW and NHSdirect) are also available at 7-digit postcode. However, it is
proposed that analyses be conducted at the level of census Output Area (OA), the smallest
(approximately 120 households) geographical area for which basic demographic data (e.g. exact
population size, age structure) have been aggregated.
Two forms of exposure misclassification are possible: (i) that houses truly affected by water
discolouration are not included in the exposed group, (ii) that houses truly unaffected by water
discolouration are included in the exposed group. The first of these would only bias results if the
affected house were included in the control (comparison) group, but since the proposed design
80

excludes adjacent Output Areas as potential controls this is unlikely to occur. In fact, both forms of
misclassification will be minimised by the identification of affected and control areas at the level of
Output Area. However, for certain incidents it may be more difficult to achieve 7-digit postcode (and
hence OA) accuracy (e.g. if not all customer complaints are available or only a small proportion of
customers complain), so the degree of misclassification may vary by incident. Larger incidents are
likely to be less susceptible to bias due to misclassification, as a smaller proportion of households will
be misclassified. Thus, the effect of misclassification on the results could be assessed by conducting
sensitivity analyses (e.g. by excluding smaller incidents from the analyses). Any differences found
following the exclusion of smaller incidents will, of course, need to be interpreted with caution given
that smaller incidents may differ from larger incidents in factors other than size (e.g. cause).
All six companies reported that transferral of the postcode data from their GIS system would be
relatively straightforward. One company was reluctant (for data protection reasons) to provide exact
addresses of customer complaints.
Summary: For the majority of incidents, the area affected can be identified at the 7-digit postcode
level. This will take an average of 1 to 2 hours per incident and involve both a researcher and a GIS
person within the company. For approximately 20% of incidents, an extra 1 to 2 hours per incident
will be required to transfer data from other sources. For all 280 incidents from 1999 to 2003, a total of
84 days (up to 4 reports per day) would be required. Analyses will be conducted at the level of census
Output Area, which will improve the accuracy of population denominators whilst preserving a
minimal level of misclassification error.
2. Inclusion of “non-incidents”
The information held by each company on non-incidents is broadly similar to that of incidents (i.e.
customer complaint postcodes, DMA boundaries, and water supply systems on a GIS system) and the
data availability, quality and transferability are likely to be comparable with that for incidents. Data
81

from incidents and non-incidents can therefore be pooled in the analysis, which will increase the
power of the main study objectives. Only a 72-hour report is available for non-incidents, but the
information necessary to address the primary objectives of the study should be available within these.
For a small number of non-incidents, the availability and quality of the data necessary for an analyses
of the characteristics of the event (objective 3) may be inferior to that recorded in the 30-day incident
reports.
As with incidents, there is a proportion (estimated to be 20%) of non-incidents between 1999 and
2003 for which the geographical data are currently not on the GIS system and would need to be
transferred from other media. A similar process of examining the GIS data and paper report of each
non-incident would enable identification of the affected area at 7-digit postcode level. The person-
time required for this would be 84 days.
Inclusion of both incidents and non-incidents in the study would approximately double the number of
discolouration events available for the analyses (560 in total) and increase the power of the study such
that the minimum detectable rate ratios would be 1.2 (compared to 1.3 for 280 incidents only) for
HES/PEDW and 1.1 (compared to 1.2) for NHS Direct.
Summary: The primary aims of the study can be addressed by including non-incidents in the analyses
without compromising data quality. The contribution of non-incidents to an analyses of the
characteristics of an event (objective 3) may be limited because there is no 30-day report on these. A
further 84 days of labour would be required to extract the data on non-incidents from the water
companies. The number of events available for analyses would double and allow detection of a 20%
increase in GI-related hospital admissions and a 10% increase in NHSdirect calls over a two-week
period in affected compared to control areas.
3. Inclusion of depressurisation events (incidents and non-incidents)
82

All six water companies reported that depressurisation events reported to the DWI invariably relate to
a total loss of supply. They are recorded by the water companies in the same way as events of
discolouration. Thus, the geographical data relating to them (e.g. customer complaints within the GIS
system) are the same, making an analysis of GI illness following events of depressurisation possible.
The process of defining the geographical area affected would be similar to discolouration events
above and would require similar person-hours of labour (168 days for both incidents and non-
incidents).
Approximately half of all events (incidents and non-incidents) reported to DWI are classed as
depressurisation events, so from 1999 to 2003 there are likely to be approximately 560 of these
available for analysis. The study would, therefore, have 80% power to detect an increase of 20%
(RR=1.2) in the rate of hospital admissions for GI illness over a two-week period.
A proportion of discolouration events is associated with a loss of pressure, so their effects can be
examined separately and in combination. Interpretation of apparent effects will, however, be difficult
given the potentially complicated causal pathways that may exist (e.g. depressurisation may lead to GI
illness by causing discolouration, which could in turn results in GI illness; by mechanisms
independent of discolouration; or both). Thus the causal factor may not be easily identifiable. The
paper reports of each discolouration event can be examined to determine whether there was an
associated loss of pressure during the event. This would take approximately 20 minutes per report, 30
days of labour in total (for 560 discolouration events).
Summary: The data available on depressurisation events are of equal quality to that of discolouration
and separate analyses can be conducted on these. Where a discolouration report indicates a loss of
pressure, then it may be possible to examine their combined effects but cautious interpretation will be
required.
83

Summary of data extraction time Discolouration Identifying geographical area: 224 incidents @ 90 minutes each. 4 per day = 56 days. 56 incidents @ 180 minutes each. 2 per day = 28 days 224 non-incidents @ 90 minutes each. 4 per day = 56 days. 56 non-incidents @ 180 minutes each. 2 per day = 28 days Identifying whether associated with depressurisation 560 events @ 20 minutes each. 18 per day = 30 days. Depressurisation Identifying geographical area: 224 depressurisation incidents @ 90 minutes each. 4 per day = 56 days. 56 depressurisation incidents @ 180 minutes each. 2 per day = 28 days 224 depressurisation non-incidents @ 90 minutes each. 4 per day = 56 days. 56 depressurisation non-incidents @ 180 minutes each. 2 per day = 28 days Total number of days = 366
84

References 1. Drinking Water 2003: A report by the Chief Inspector, Drinking Water Inspectorate 2003.
http://www.dwi.gov.uk/pubs/annrep03/contents.shtm. Date last accessed Nov 2004.
2. Office of National Statistics. http://www.statistics.gov.uk/geography/soa.asp. Date last accessed
Oct 2004.
3. Kirkwood B, Sterne J. Essential Medical Statistics. 2003. Blackwell Publishing Ltd.
4. Acute Gastroenteritis in Ireland, North and South: A Telephone Survey.
http://www.fsai.ie/surveillance/human/gastro_report/Acute_Gastroenteritis.pdf.
5. Hayes R, Bennett S. Simple sample size calculation for cluster-randomized trials. Int J
Epidemiol. 1999;28:319-326.
6. Wheeler JG, Sethi D, Cowden JM, Wall PG, Rodrigues LC, Tompkins DS, Hudson MJ,
Roderick PJ. Study of infectious intestinal disease in England: rates in the community,
presenting to general practice, and reported to national surveillance. Br Med J. 1999 Apr
17;318(7190):1046-50.
7. MORI Telephone Surveys. http://www.mori.com/mts/. Date last accessed: 17 Nov 2004
85

Acknowledgements
We would like to thank the following persons and institutions for advice and information:
Peter Marsden and Anthony Lloyd (DWI)
Chris Grundy (Centre for Spatial Analysis in Public Health, LSHTM)
Anthony Nicholls (NHSdirect England)
Paul Wilkinson (Public and Environmental Health Research Unit, LSHTM)
MORI Telephone Surveys, London Office
86