Embed Size (px)
Citation preview
DWI 8102/3 AUGUST 2011
An Investigation of Leaching from Flexible Rising Mains Leading from Borehole Pumps
Final Report to the Drinking Water Inspectorate

AN INVESTIGATION OF LEACHING FROM FLEXIBLE RISING MAINS LEADING FROM BOREHOLE PUMPS
Final Report to the Drinking Water Inspectorate
Report No: DWI 8102/3
August 2011
Authors: P J Jackson, H A James and I C Warren
Contract Manager: P J Jackson
Contract No: 14907-0
DWI Reference No: DWI 70/2/255
Contract Duration: November 2007-March 2009
Any enquiries relating to this report should be referred to the Contract Manager at the following address: WRc-NSF Ltd, Unit 25, Robert Cort Estate, Britten Road, Reading, RG2 0AU. Telephone: 01495 236260 Fax 01495 249234

AN INVESTIGATION OF LEACHING FROM FLEXIBLE RISING MAINS LEADING FROM BOREHOLE PUMPS
EXECUTIVE SUMMARY
Many water undertakers have used flexible rising mains as the preferred option to fixed piping systems for rising mains leading from borehole pumps. These flexible hoses are usually made from fabric-reinforced polyurethane. They offer several advantages over fixed installations.
Formerly such rising mains were treated as traditional materials under the requirements of Regulation 25(1)(c) of the Water Supply (Water Quality) Regulations 1989. Water undertakers would replace existing flexible rising mains with new lengths of flexible hose as required, on a like for like basis. Regulation 31 of the current Water Supply (Water Quality) Regulations 2000 (2001 in Wales) does not contain a comparable provision for the continued use of product on a ‘traditional’ basis. This has meant that water undertakers can no longer replace flexible rising mains on a like-for-like basis.
The former Committee for Products and Processes used in Public Water Supply (CPP) received and considered formal applications for approval of flexible rising mains, following the introduction of the new regulations. GC-MS general survey test results obtained from leaching tests undertaken on these products have shown persistent high concentrations of large numbers of unknown organic compounds over the three 72 hour extraction periods of the tests.
The general objective of this project was to analyse samples of water from two sites where flexible rising mains had been in use for some time to determine the quantity and nature of any leachates present. Following this initial sampling, the riser was replaced with a new one and the leachates were monitored over a period of weeks. This work was carried out in co-operation with two water undertakers.
Water companies were contacted to identify those that had flexible rising mains installed and that were willing to co-operate in the project. Two suitable sites were identified – one chalk aquifer and one greensand aquifer. Each of these sites had existing 152 mm (6 inch) diameter flexible rising mains of the same type and manufacturer.
At each of the two identified sampling sites the following general experimental protocol was followed.
• With the existing hose in service, a sample was taken under flowing conditions after one hour’s flushing (as a ‘control’) then a further sample was taken following 72 hour’s stagnation.
• The borehole was taken off line, i.e. no longer feeding the public water supply and the flexible riser was replaced with a new section of flexible hose.
• After flushing with water for one hour a control sample was taken. A stagnation period was imposed, after which a sample was taken immediately.
i
The flushing, stagnation and sampling was repeated to give a time-series over a period of 56 days.
• Samples were analysed for Total Organic Carbon and GC-MS general survey.
At both sites, only low levels of leaching were observed from the original liners that had been in use for many years. After the introduction of new liners, large numbers of unknowns were detected in the stagnation samples. These compounds tended to be present at lower concentrations or were undetectable in samples taken after flushing for 60 minutes.
The major unknowns were identified as a series of oligomers1 differing in molecular weight by 72 mass units, the main compounds having molecular weights of 288, 360, 432, 504 and 576. Examination of mass spectra provided in earlier test reports on leaching from similar materials showed that these same compounds were present. These compounds are likely to be oligomeric cyclic ethers although their identities cannot be confirmed conclusively due to a lack of pure standards.
Overall there did not appear to be a difference in leaching characteristics between chalk- and greensand-derived waters.
Chemicals were still detected in stagnation samples several weeks after the new liners were installed. This suggests that it would be not be practical or effective for the manufacturer to rinse the risers as part of the manufacturing process.
Concentrations of leached chemicals in samples taken after flushing tended to be low. This suggests that a suitable control method would be to flush newly installed risers, with the output going to waste, for 24 hours2 prior to reconnection to the public water supply.
1 A compound intermediate between a monomer and a polymer, normally having up to about ten
monomer units.
2 This time is based on the TOC die-away curve for flushing the riser at site F that had been stagnant for 28 days.
ii

CONTENTS Page
EXECUTIVE SUMMARY I
LIST OF TABLES IV
LIST OF FIGURES IV
1. INTRODUCTION 1 1.1 Background 1 1.2 Objectives 2
2. METHODOLOGY 3 2.1 Sample locations 3 2.2 Sampling programme 3 2.3 Sampling procedure 4 2.4 Analysis 4
3. RESULTS 7 3.1 Site F 7 3.2 Site A 14 3.3 Identification of unknowns 21
4. DISCUSSION 31
5. CONCLUSIONS 33
REFERENCES 35 APPENDICES
APPENDIX A DETAILED GC-MS RESULTS
iii

Page
LIST OF TABLES
Table 3.1 Sample Schedule - Site F 8 Table 3.2 TOC results - Site F 9 Table 3.3 GC-MS results (µg/l) - Site F 11 Table 3.4 Sample Schedule - Site A 15 Table 3.5 TOC results - Site A 16 Table 3.6 GC-MS results (µg/l) - Site A 17
LIST OF FIGURES
Figure 3.1 TOC data - Site F 10 Figure 3.2 TOC results for day 84 flushing experiment - Site F 10 Figure 3.3 TOC data - Site A 16 Figure 3.4 Mass chromatograms of unknowns 22 Figure 3.5 Mass spectrum of unknown m/z 288 23 Figure 3.6 Mass spectrum of unknown m/z 360 24 Figure 3.7 Mass spectrum of unknown m/z 432 25 Figure 3.8 Mass spectrum of unknown m/z 504 26 Figure 3.9 Unknowns in samples from Site F 27 Figure 3.10 Unknowns in samples from Site A 28
iv

1. INTRODUCTION
1.1 Background
Many water undertakers have used flexible rising mains as the preferred option to fixed piping systems for rising mains leading from borehole pumps. These flexible hoses are usually made from fabric-reinforced polyurethane. They offer several potential advantages over fixed installations, including:
• lower initial costs; • lower installation costs and greater convenience; and • lower costs in operations such as raising the pump from the bottom of the
borehole for maintenance.
Formerly such rising mains were treated as traditional materials under the requirements of Regulation 25(1)(c) of the Water Supply (Water Quality) Regulations 1989. Water undertakers would replace existing flexible rising mains with new lengths of flexible hose as required, on a like for like basis.
Regulation 31 of the current Water Supply (Water Quality) Regulations 2000 (2001 in Wales) does not contain a comparable provision for the continued use of product on a ‘traditional’ basis. This has meant that water undertakers can no longer replace flexible rising mains on a like-for-like basis. Where replacement is required, they have to change to approved fixed metallic (usually stainless steel) pipe installations with the concomitant increased cost implications, together with difficulties associated with installation and pump removal.
The former Committee for Products and Processes used in Public Water Supply (CPP) received and considered formal applications for approval of flexible rising mains, following the introduction of the new regulations. GC-MS general survey test results obtained from leaching tests undertaken on these products have shown persistent high concentrations of large numbers of unknown organic compounds over the three 72 hour extraction periods of the tests.
The general objective of this project was to analyse samples of water from sites where flexible rising mains had been in use for some time to determine the quantity and nature of any leachates present. Following this initial sampling, the riser was replaced with a new one and the leachates were monitored over a period of weeks. This work was carried out in co-operation with two water undertakers.
1

1.2 Objectives
a) To conduct extended leaching tests to determine the die-away rates for the unknown compounds found during the previous laboratory testing, taking into account that both outer and inner surfaces of the rising main will normally be in contact with water intended for human consumption.
b) To attempt to identify persistent unknown compounds (some of which may be oligomers of the base polymer used).
c) If compounds reach acceptably low concentrations during extended extraction periods, to consider how this level of leaching could be achieved in practice, through documented commissioning requirements, and whether this could be undertaken by the manufacturer before delivery to the end user.
d) To determine whether leaching characteristics change with differing water types, e.g. from chalk and sandstone aquifers.
e) To determine whether subsequent enhancement of leaching of substances from the rising main into the borehole occurs as a result of stagnation of water during shut-down periods and to consider how any such effects could be ameliorated.
2
2. METHODOLOGY
2.1 Sample locations
Water companies were contacted to identify those that had flexible rising mains installed and that were willing to co-operate in the project. Two suitable sites were identified – these are referred to as sites F (chalk aquifer) and A (greensand aquifer). Each of these sites had existing 152 mm (6 inch) diameter flexible rising mains of the same type and manufacturer (Angus Fire Armour Wellmaster).
It required considerable effort and negotiation with water companies to identify suitable sites and this led to a substantial delay in progressing the project.
In addition, information on leaching from flexible reinforced polyurethane hoses was reviewed. This information was held on DWI’s confidential Regulation 31 approvals files and these files were reviewed at DWI’s offices. This was done to provide information to assist in the identification of unknown chemicals found by GC-MS analysis.
2.2 Sampling programme
At each of the two identified sampling sites (F and A) the following general experimental protocol was followed.
• With the existing hose in service, a sample was taken under flowing conditions after one hour’s flushing (as a ‘control’) then a further sample was taken following 72 hour’s stagnation.
• The borehole was taken off line, i.e. no longer feeding the public water supply. This was carried out by water company staff.
• The flexible riser was replaced with a new section of flexible hose, in accordance with the manufacturer’s Instructions for Use document and following the water company’s normal commissioning procedure. This was carried out by water company and manufacturer’s staff.
• After flushing with water for one hour a control sample was taken. A stagnation period was imposed, after which a sample was taken immediately. The flushing, stagnation and sampling was repeated to give a time-series as below:
Sample No. 1 2 3 4 5 6 7 Stagnation time days 1 2 3 3 5 14 28 Total elapsed time days 1 3 6 9 14 28 56
3

(Sample numbers 1 to 4 were broadly equivalent, in terms of stagnation time, to the three 72 hour samples from laboratory leaching tests.)
• At site F only, following the above time series, a further 28 day stagnation period was imposed. Flow to waste was then resumed and samples of flowing water were taken immediately and after 30 minutes, 1 hour, 6 hours and 24 hours.
• On completion of testing the original rising main could be reinstated and the borehole returned to service by water company staff.
2.3 Sampling procedure
On each sampling occasion two samples were taken into 1-litre glass bottles with PTFE-lined caps for GC-MS analysis. The bottles were filled to the top leaving no headspace. (Duplicate samples were taken in case of sample bottles being broken or leakage occurring during transport to the laboratory.)
The samples were transported to WRc-NSF’s Reading laboratory for analysis for Total Organic Carbon (TOC) and GC-MS General Survey.
2.4 Analysis
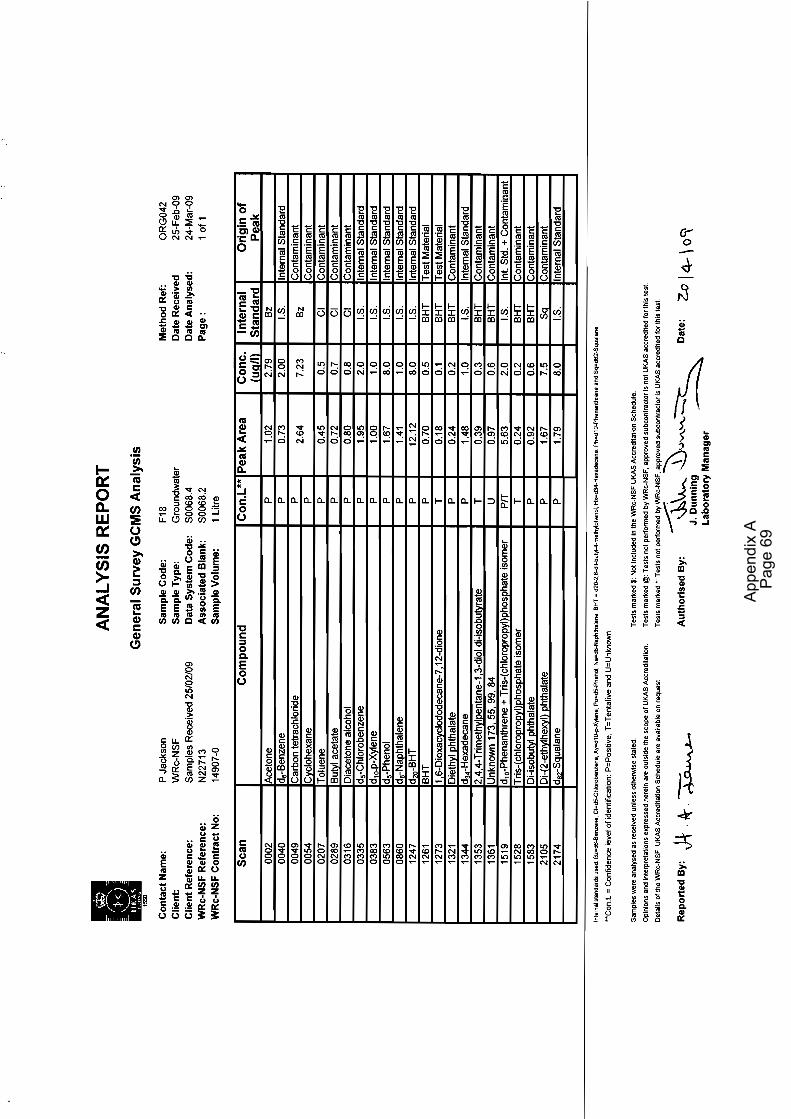
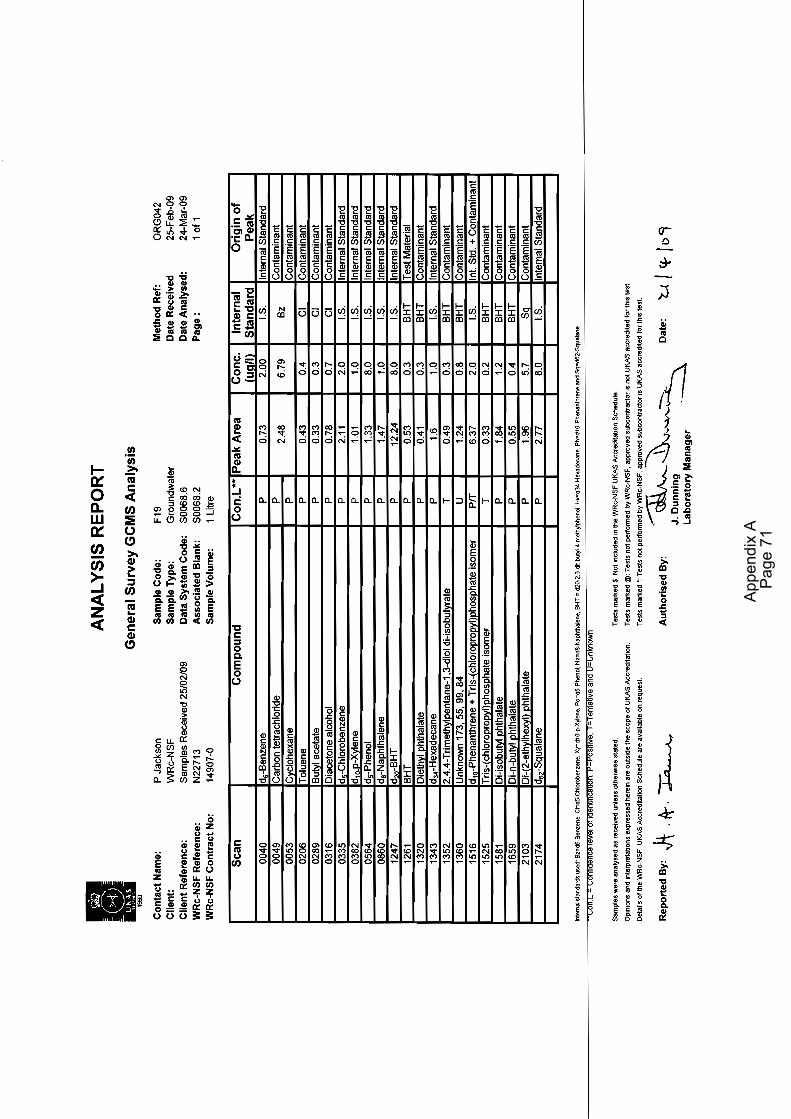
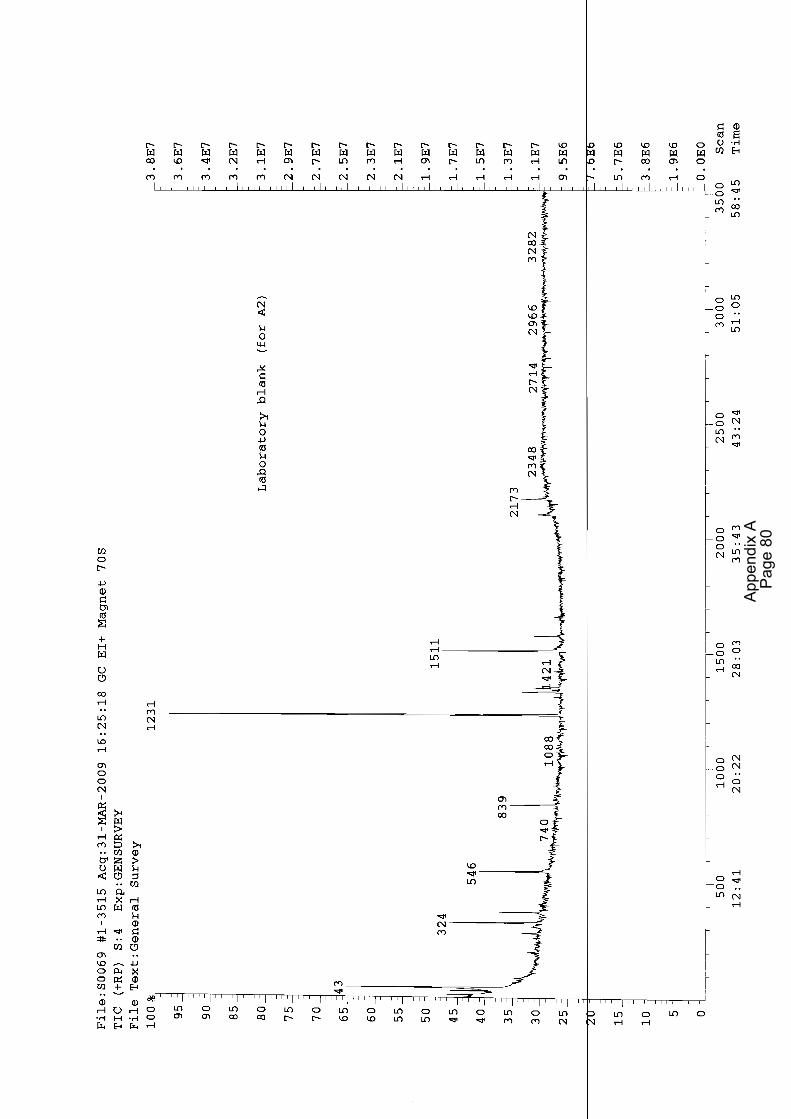
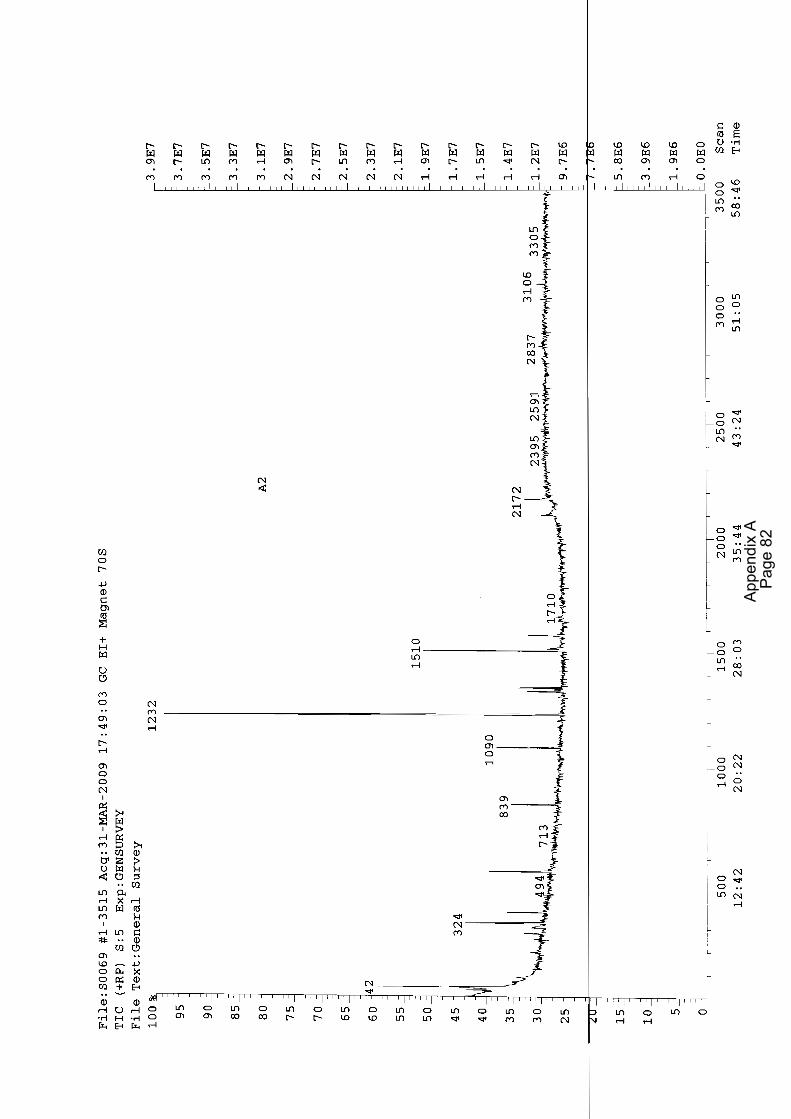
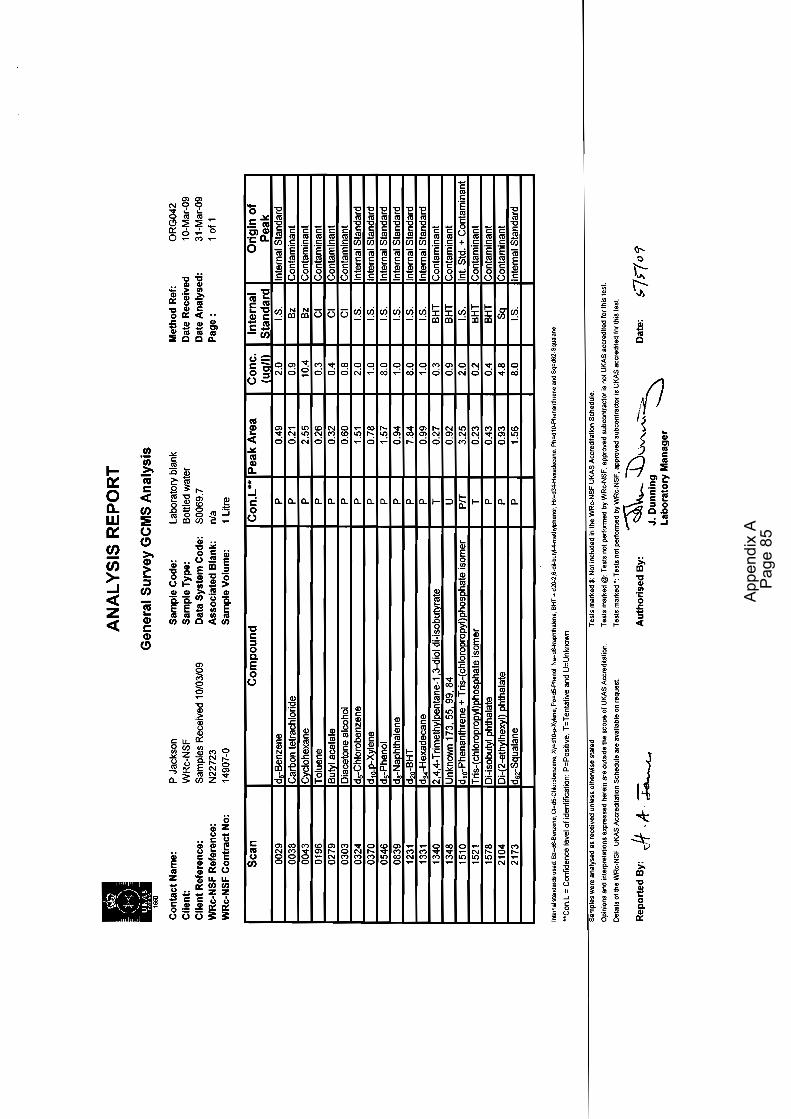
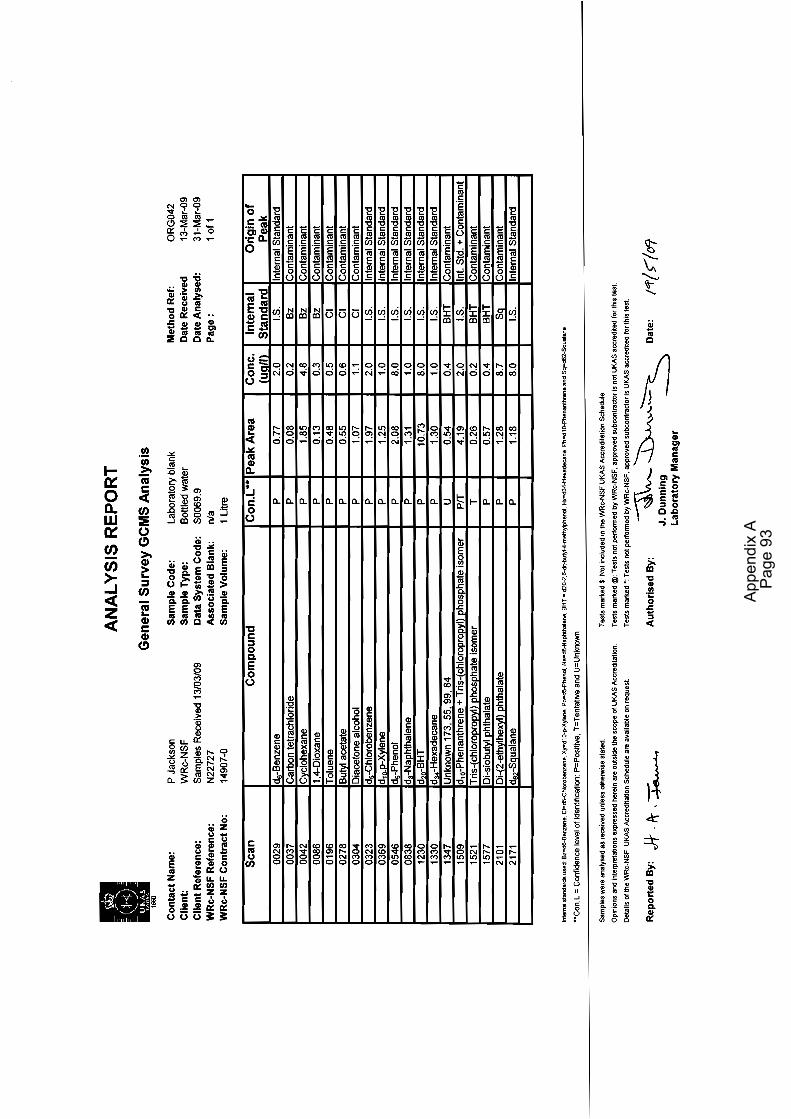
GC-MS analysis was conducted according to BS 6920 Part 4, which specifies extraction at pH 2. Samples for GC-MS analysis were solvent extracted within 48 hours of the time of sampling. The samples were acidified to pH 2 with sulphuric acid (10%) and extracted with dichloromethane (DCM), 2 × 100 ml. The combined DCM extracts were dried (by storing overnight in a freezer and filtering to remove ice crystals) and concentrated in a Kuderna-Danish apparatus at 50°C to approximately 2 ml, and then concentrated further to 500 µl under a stream of nitrogen. The extracts were stored in a freezer for varying lengths of time prior to analysis by GC-MS.
General survey GC-MS analysis was conducted according to BS6920 Part 4 using a Hewlett-Packard 5890 gas chromatograph (GC) directly coupled to a VG 70S mass spectrometer.
Data interpretation was undertaken by inspecting the mass spectra of all the peaks detected on the total ion current (TIC) chromatogram. If mass spectra were not recognised, libraries of mass spectra (either the NIS, NISTREP and Wiley libraries held on the GC-MS data system or a hard copy version of the Eight Peak Index) were utilised in an attempt to identify the compound giving rise to a particular mass spectrum. If this approach was unsuccessful, an attempt was made to interpret the mass spectrum from first principles. Where no identity can be suggested, compounds are listed as unknowns, together with a listing of the four most intense ions in the mass spectrum (in decreasing order of intensity).
4

Estimates of the concentrations of the compounds identified were made using the responses obtained for deuterated internal standards, which were added to the sample prior to analysis. Quantification was based on a comparison of the TIC chromatogram peak area of a compound of interest with the peak area of an internal standard. The internal standard used was that with the closest retention time to the peak for the compound of interest.
TOC was determined by a UV/persulphate oxidation technique with non-dispersive infra-red detection. The instrument was calibrated with a standard solution (10 mg/l as organic carbon) of potassium hydrogen phthalate (single point calibration). In addition, control standards, a solution of potassium hydrogen phthalate (5 mg/l as organic carbon), and blank water were analysed with the samples.
5

6

3. RESULTS
3.1 Site F
3.1.1 Sampling schedule
The sample schedule and associated sample codes are given in Table 3.1.
3.1.2 TOC
The TOC results are tabulated in Table 3.2. The results for TOC during the main phase of sampling are given in Figure 3.1 and Figure 3.2 shows the TOC results from the final flushing experiment.
3.1.3 GC-MS general survey
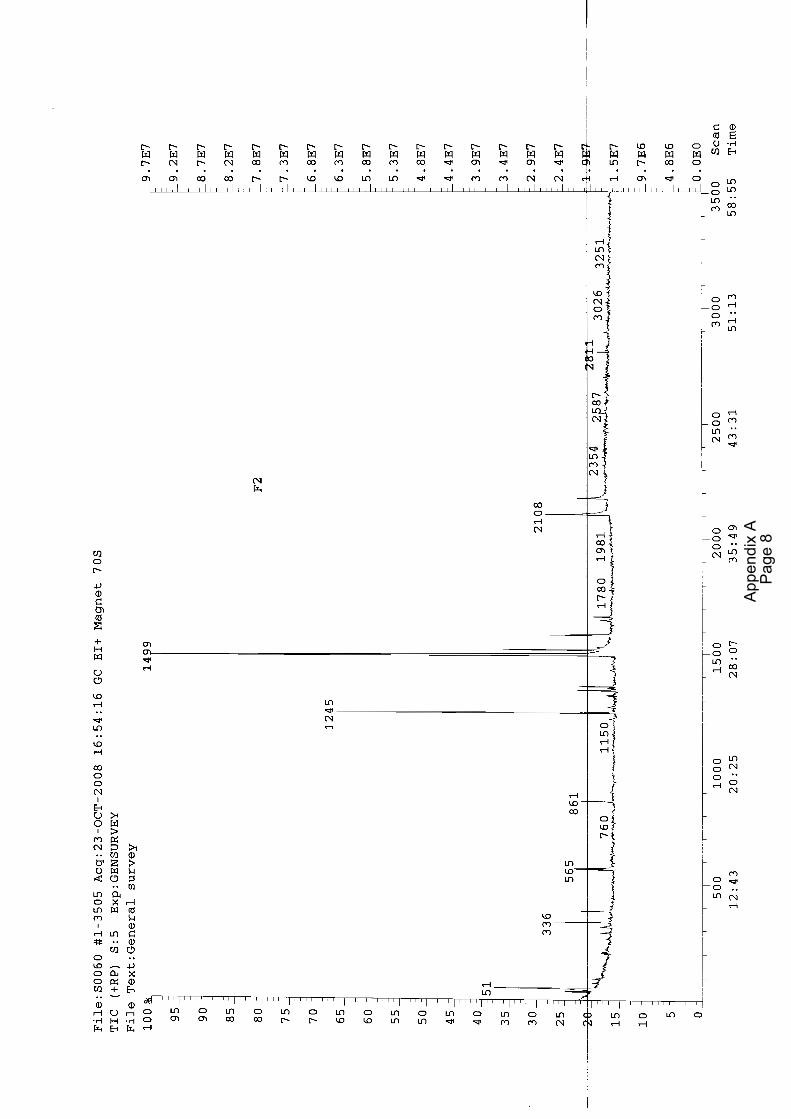
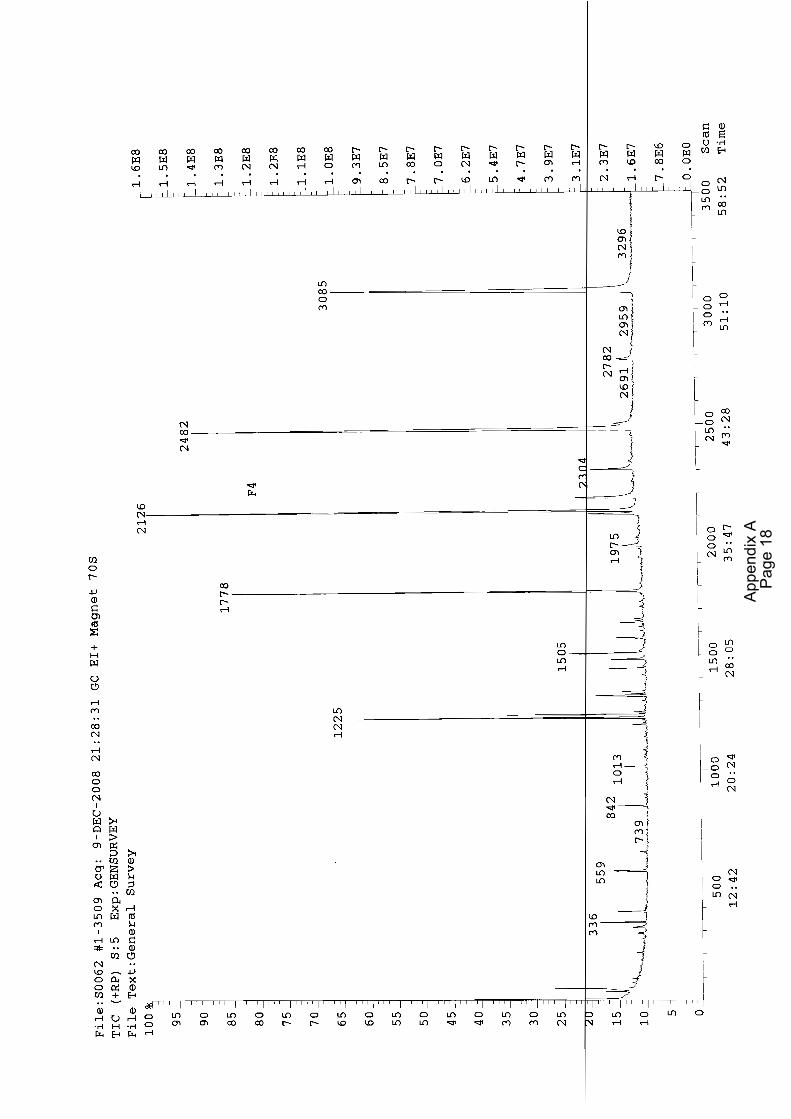
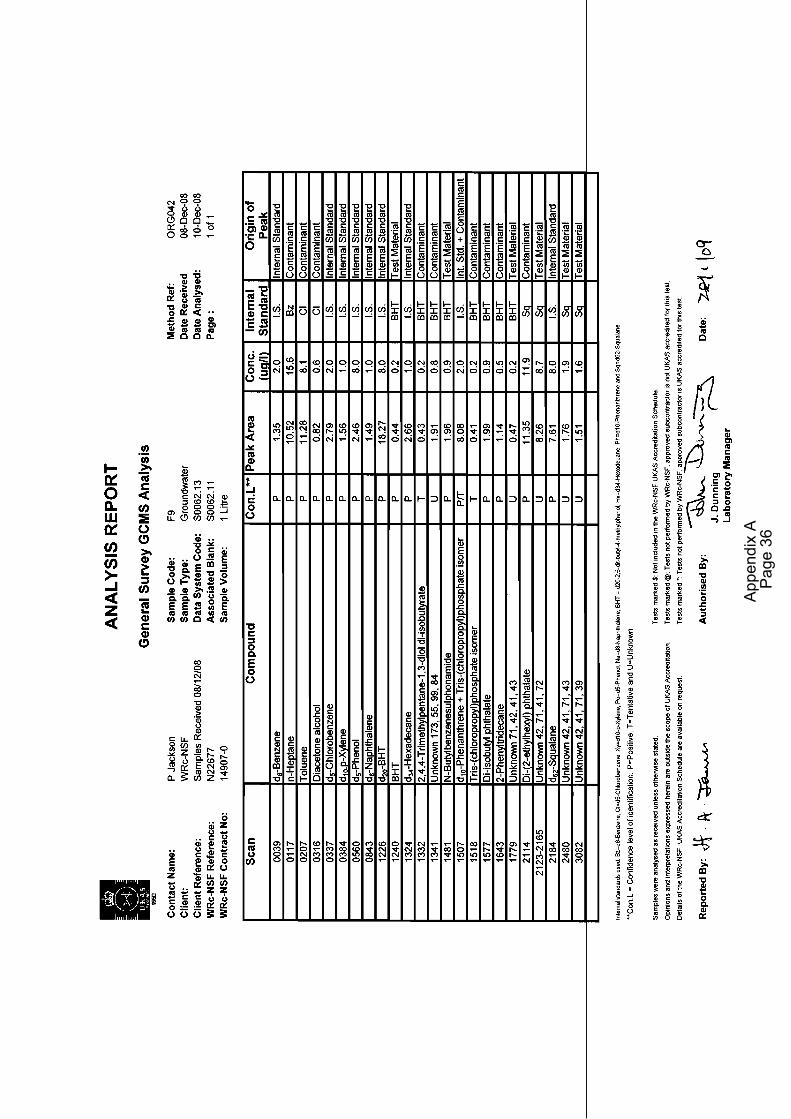
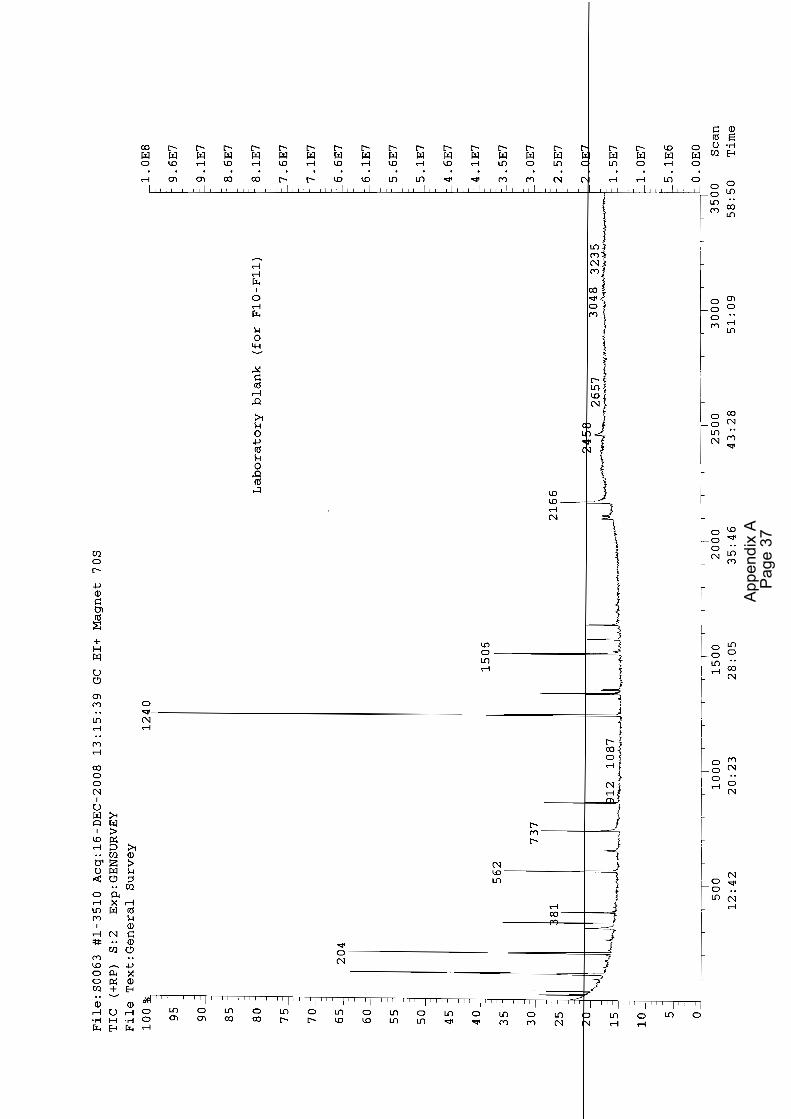
The results for GC-MS general survey are given in Table 3.3. The detailed results are in Appendix A.
7

Table 3.1 Sample Schedule - Site F
Date TimeElapsed days Samples
No. Samples Spl Code
Old riser experiment Flowing sample Day 1 17/10/2008 10:05 60 minute flush 1 FD1 Stagnation sample
Day 4 20/10/2008 10:15
Stagnation
1 F2
New riser experiments Start date 02/12/2008 09:00 60 minute flush 1 F3 Sample # Stagn Days
1 1 03/12/2008 1 08:55 Stagnation 60 minute flush 2 F4/F52 2 05/12/2008 3 09:00 Stagnation 60 minute flush 2 F6/F73 3 08/12/2008 6 08:55 Stagnation 60 minute flush 2 F8/F94 3 11/12/2008 9 08:55 Stagnation 60 minute flush 2 F10/F115 5 16/12/2008 14 08:50 Stagnation 60 minute flush 2 F12/F136 14 30/12/2008 28 09:15 Stagnation 60 minute flush
2 F14/F15
7 28 27/01/2009 56 09:00 Stagnation
1 F16Stagnate 28 24/02/2009 84
Resume flow and sample after following hours
24/02/2009 84 08:55 Stagnation 1 F17 0.5 24/02/2009 84 09:25 Flowing 1 F181 24/02/2009 84 09:55 Flowing 1 F196 24/02/2009 84 14:55 Flowing 1 F2024 25/02/2009
85 08:55
Flowing
1 F21
8
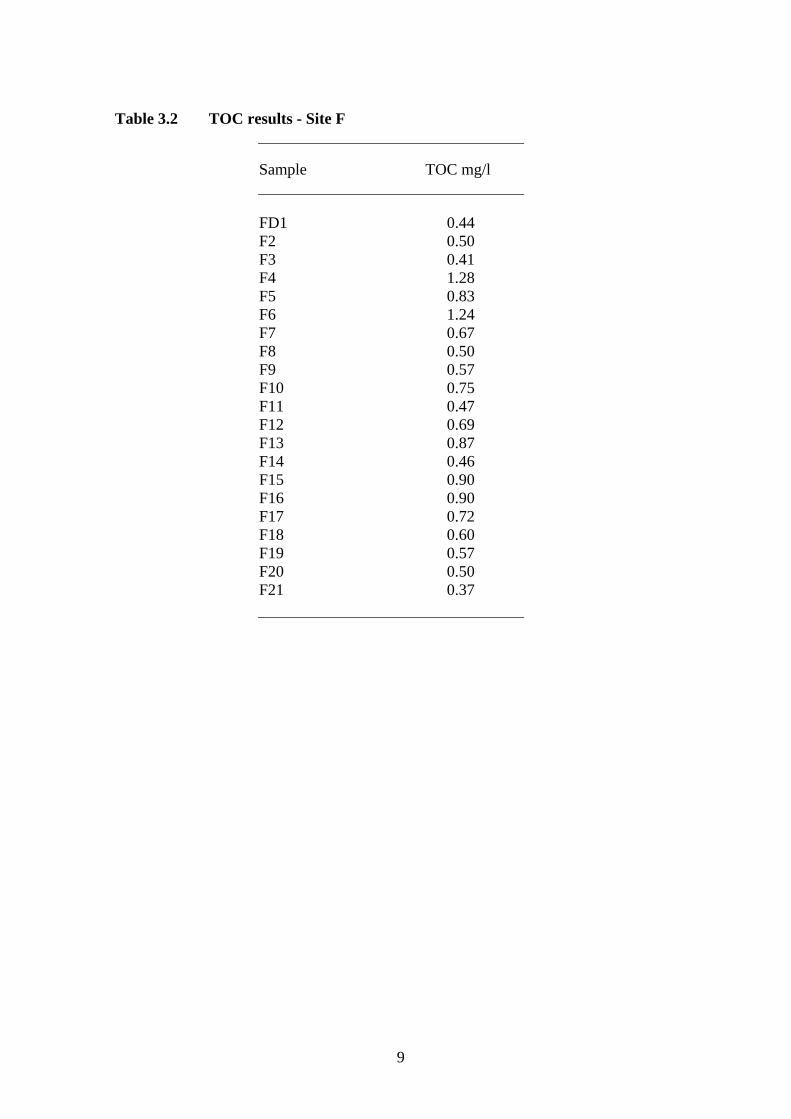
Table 3.2 TOC results - Site F
Sample TOC mg/l
FD1 0.44 F2 0.50 F3 0.41 F4 1.28 F5 0.83 F6 1.24 F7 0.67 F8 0.50 F9 0.57 F10 0.75 F11 0.47 F12 0.69 F13 0.87 F14 0.46 F15 0.90 F16 0.90 F17 0.72 F18 0.60 F19 0.57 F20 0.50 F21 0.37
9

0.00
0.20
0.40
0.60
0.80
1.00
1.20
1.40
0 10 20 30 40 50 60 70 80 9Elapsed days
TOC
mg/
l
0
New FlowingNew StagnationOld FlowingOld Stagnation
Figure 3.1 TOC data - Site F
0.3
0.4
0.5
0.6
0.7
0.8
0 4 8 12 16 20 24
Flow time (h)
TOC
(mg/
l)
Figure 3.2 TOC results for day 84 flushing experiment - Site F
10

Table 3.3 GC-MS results (µg/l) - Site F3
Scan Compound FD1 F2 F3 F4 F5 F6 F7 F8 F9 F10 F11 F12 F13 F14 F15 F16 F17 F18 F19 F20 F21
0004
iso-Butanol 8.4 5.4
0642 2-Ethylhexanol 0.4
0.1
0.3 0.7
0891 2-Phenoxyethanol 0.2
0.6
1013 Unknown m/z 101,42,54,55 0.7
0.7
1018 Unknown m/z 55,84,112,142
0.2
1024 Unknown m/z 55,84,112,41 0.2
1065 Dodecamethylcyclohexasiloxane 0.2 1081 2,4,4-Trimethylpentane-1,3-diol mono-isobutyrate
0.2
1095 Unknown m/z 43,58,41,27 2.0
1192 2,-Di-t-butyl-4-methylene-2,5-cyclohexadien-1-one
0.2
0.1
1196 2,6-Di-t-butyl-2,5-cyclohexadiene-1-one
0.4 0.3 0.1 0.1
1241 BHT 0.2
3.4 0.2
4.5 0.2
0.7
0.2
0.9
0.2
0.6
0.2
1.1 0.6 0.8 0.8 0.5 0.5
0.3
0.4 1250 1,6-Dioxacyclododecane-7,12-dione 0.3 0.3 4.1 0.6 7.4 3.2 0.1
1268 N,N-Diethyl-3-pyridinecarboxamide 0.4 1320
Unknown m/z 71,55,41,43 (M+ 216?)
2.6
2.5
3 Note: In order to ensure the performance of the GC column used for the GC-MS runs is satisfactory, the retention gap (a section of capillary column fitted between the GC injector and the analytical GC column) is usually changed before a batch of sample extracts is run. Also, when this is done a small length of the analytical GC column is usually removed (as on-column injection is used, any non-volatile material remains on the retention gap, and may also contaminate the front end of the analytical GC column). As a consequence the scan number reported for the same compound in different extracts may be different, depending on whether the extracts were run as one batch (i.e. the retention gap and analytical column length were identical for each extract) in which case the reported scan numbers will be within a 1-3 scan range, or whether the extracts were run in different batches (i.e. the retention gap and analytical column length were slightly different for each batch). In the latter case, if there has been a significant time period between running the extracts from a survey taking several months (as in this present case), the scan numbers reported for the same compound may vary by up to 50 scans.
11

Table 3.3 continued
Scan Compound FD1 F2 F3 F4 F5 F6 F7 F8 F9 F10 F11 F12 F13 F14 F15 F16 F17 F18 F19 F20 F21
1409
8
) )
) )
Unknown m/z 41,55,81,43 0.2 1441 Unknown m/z 55,42,101,41 (M+ 229) 1.1 1.3 1494 N-Butylbenzenesulphonamide*
e 1.5
31.6
1.5
1.8
2.6
10.4
1.2
10.1
0.9
5.7
1.0
4.5
0.7
7.9
1.0 162 Di-n-butyl phthalat
0.9
1649 2-Phenyltridecane 0.5
0.4
0.8
1650 Methyl-3-(3,5-di-t-butyl-4-hydroxyphenyl)propionate
0.3
0.3
1742 Unknown m/z 71,42,41,55 1.0
0.5
1778 Unknown m/z 71,42,55,43 (M+ 288)
14.1
12.9
1.5
2.2
1779 Unknown m/z 42,71,41,43 0.2
0.6
1779 Unknown m/z 71,42,41,43 0.2
0.2
1975 Unknown m/z 42,41,71,72 1.2
0.9
2025 Unknown m/z 55,99,173,113 (M+ 344 2.
2 1.
1 2065 Unknown m/z 55,173,99,113 (M+ 344
2.
8 2068 Unknown m/z 42,41,71,39 1.6
2086 Unknown m/z 71,42,41,73 1.4
2107 Unknown m/z 71,42,43,55 (M+ 360)
5.6
9.7
2108 Unknown m/z 42,71,41,72 0.8
1.3
2123-2165Unknown m/z 42,71,41,72 8.7
2124 Unknown m/z 71,42,41,55 (M+ 360)
2.8
3.6
2126 Unknown m/z 42,41,71,27 0.6
35.1
69.1 2126 Unknown m/z 42,71,41,43 (M+ 360) 36.9
61.1
8.8
9.6
2180 Unknown m/z 55,173,99,42 (M+ 372 16
.6
2180
Unknown m/z 55,173,99,53 (M+ 372
1.
5
12

Table 3.3 continued
Scan Compound F1 F2 F3 F4 F5 F6 F7 F8 F9 F10 F11 F12 F13 F14 F15 F16 F17 F18 F19 F20 F21
2217 )
)
Unknown m/z 55,91,173,41 (M+ 372
10
.02304 Unknown m/z 42,41,71,39 4.8
4.9
2351 Unknown m/z 55,42,41,54 (M+ 400)
6.5
4.0
2437 Unknown m/z 42,71,41,55 1.0
2479 Unknown m/z 42,41,71,27 0.6
1.0
2480 Unknown m/z 42,41,71,39 1.1
2480 Unknown m/z 42,41,71,43 1.9
2.0
2482 Unknown m/z 42,71,41,72 (M+ 432) 60.7 96.0 14.9
16.1
8.2
9.6
3.8
4.7
2504 Unknown m/z 221,250,180,132 (M+ 340)
1.1
1.4
2775 Unknown m/z 57,45,101,155
2.5
2782 Unknown m/z 42,41,71,39 2.3
3.0
2816 Unknown m/z 57,45,101,41 3.9
9.1
6.0 3049 Unknown m/z 42,71,41,39 (M+ 504)
11.7
5.9
4.8
1.9
3080 Unknown m/z 42,41,71,27 0.8
3080 Unknown m/z 42,41,71,39 0.8
1.6
3085 Unknown m/z 42,41,71,27 (M+ 504) 61.1
92.0
12.423297 Unknown m/z 57,45,41,101 (M+ 504?
1.
3311
Unknown m/z 57,45,41,29
1.0
* N-Butylbenzenesulphonamide was detected in most samples from Site F but this may have been an artefact that leached from the nylon sampling hose that was installed to enable samples to be taken. This compound has been detected previously in groundwater samples taken using this type of tubing but not detected when this tubing was not used. This chemical was not detected in samples taken from site A.
13

3.2 Site A
3.2.1 Sampling schedule
The sample schedule and associated sample codes are given in Table 3.4.
3.2.2 TOC
The TOC results are given in Table 3.5 and are plotted in Figure 3.3.
3.2.3 GC-MS general survey
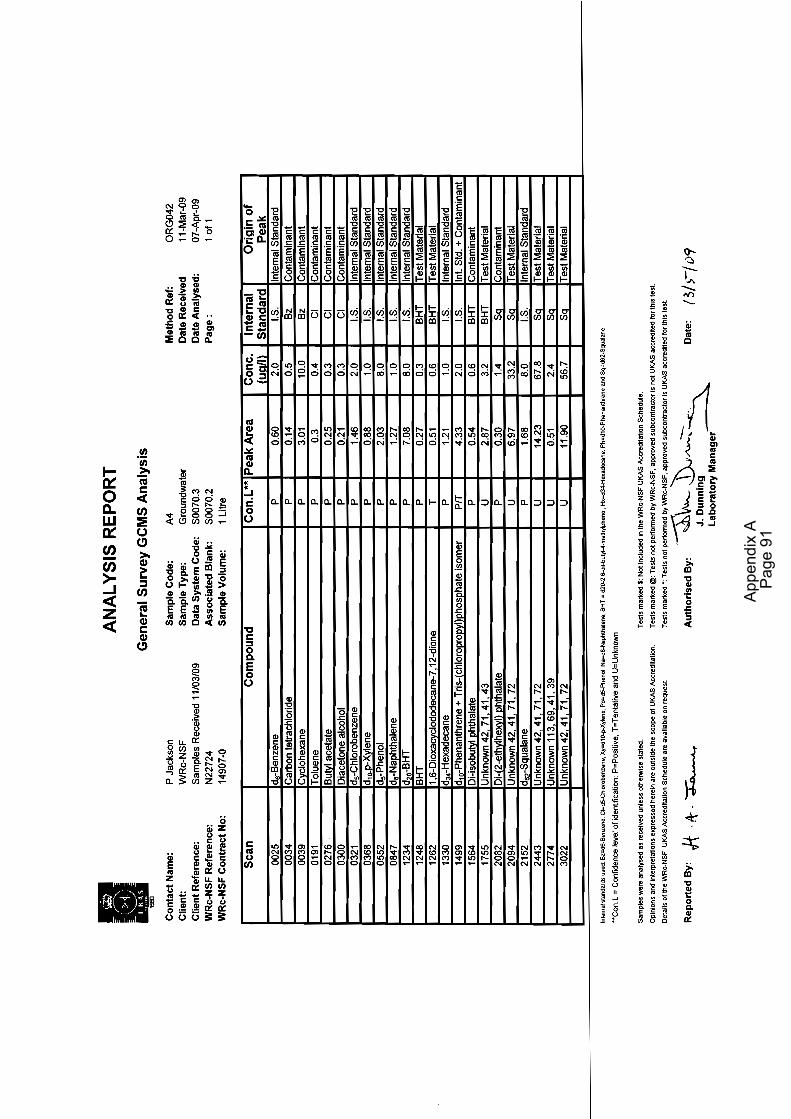
The results are tabulated in Table 3.6 and given in detail in Appendix A. The duplicate sample for A14 (labelled as A14D) was also analysed and the results are included in the table. No compounds attributable to the flexible riser were found in samples A9 and A11 (flowing samples).
14
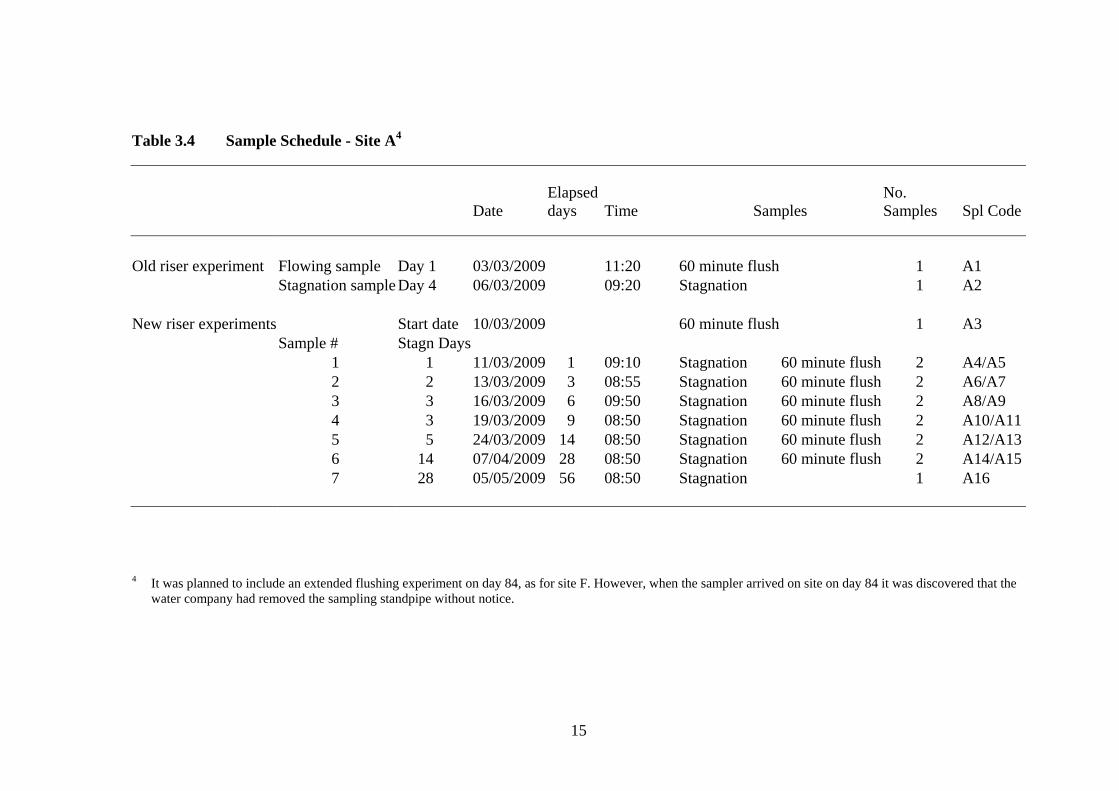
Table 3.4 Sample Schedule - Site A4
Date TimeElapsed days Samples
No. Samples Spl Code
Old riser experiment Flowing sample Day 1 03/03/2009 11:20 60 minute flush 1 A1 Stagnation sample
Day 4
06/03/2009
09:20
Stagnation
1 A2
New riser experiments Start date 10/03/2009 60 minute flush 1 A3 Sample # Stagn Days
1 1 11/03/2009 1 09:10 Stagnation 60 minute flush 2 A4/A52 2 13/03/2009 3 08:55 Stagnation 60 minute flush 2 A6/A73 3 16/03/2009 6 09:50 Stagnation 60 minute flush 2 A8/A94 3 19/03/2009 9 08:50 Stagnation 60 minute flush 2 A10/A115 5 24/03/2009 14 08:50 Stagnation 60 minute flush 2 A12/A136 14 07/04/2009 28 08:50 Stagnation 60 minute flush
2 A14/A15
7 28
05/05/2009
56 08:50
Stagnation
1
A16
4 It was planned to include an extended flushing experiment on day 84, as for site F. However, when the sampler arrived on site on day 84 it was discovered that the
water company had removed the sampling standpipe without notice.
15
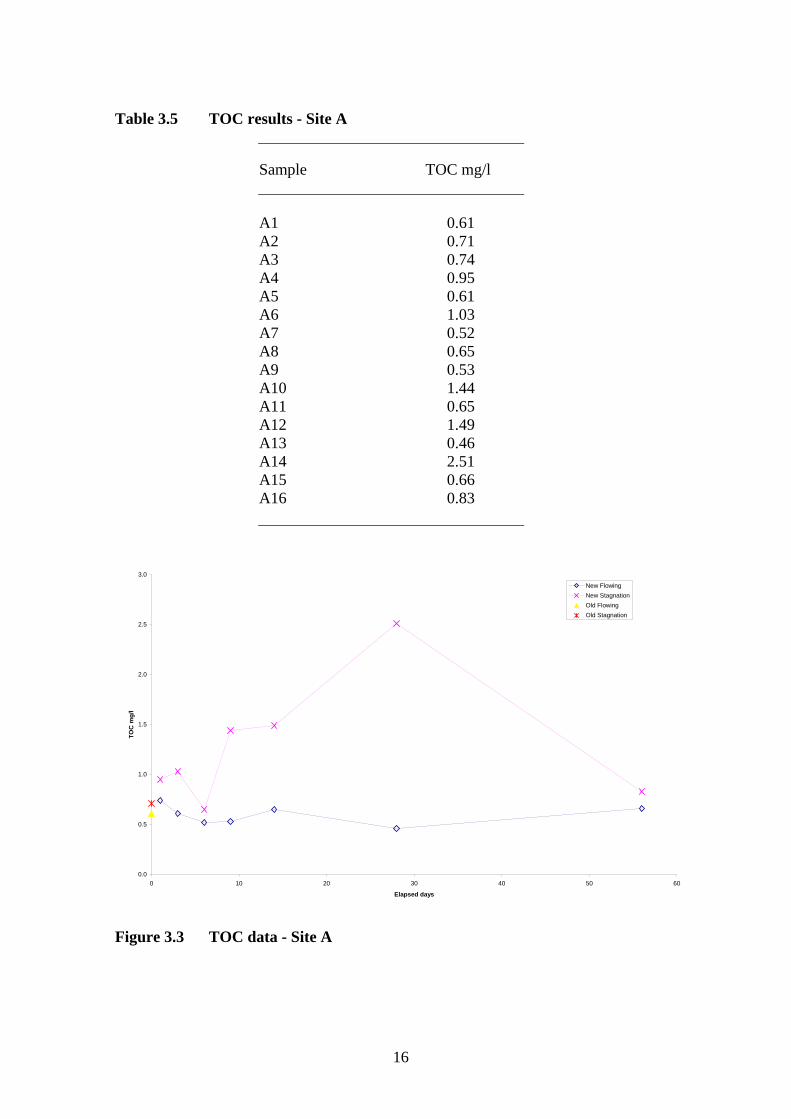
Table 3.5 TOC results - Site A
Sample TOC mg/l
A1 0.61 A2 0.71 A3 0.74 A4 0.95 A5 0.61 A6 1.03 A7 0.52 A8 0.65 A9 0.53 A10 1.44 A11 0.65 A12 1.49 A13 0.46 A14 2.51 A15 0.66 A16 0.83
0.0
0.5
1.0
1.5
2.0
2.5
3.0
0 10 20 30 40 50 6
Elapsed days
TOC
mg/
l
0
New FlowingNew StagnationOld FlowingOld Stagnation
Figure 3.3 TOC data - Site A
16

Table 3.6 GC-MS results (µg/l) - Site A5
Scan Compound A1 A2 A3 A4 A5 A6 A7 A8 A10 A12 A13 A14 A14D A15 A16
0004 Tetrahydrofuran
6.1 0004 iso-Butanol 7.8 0298 Ethyl-2-hydroxypropanoate 0.7
0298 Ethyl lactate + butyl acetate (contaminant)
1.2 0405 Xylene isomer 0.3
0642 2-Ethylhexanol 0.4 0743 2-Butoxyethylacetate
0.2
0817 4-Butoxybutanol 0.5 1013 Unknown m/z 101,42,54,55 1.3
4.2
0.3
1021 Unknown m/z 101,42,54,27 3.3
1023 Unknown m/z 101,42,54,55 2.2
9.0
1095 Unknown m/z 43,58,41,27 1.3
1204 Unknown m/z 42,41,55,71 0.2
1206 4-Methylene-2,6-di-t-butyl-2,5-cyclohexadien-1-one
0.2 1226
Unknown m/z 45,58,115,55
0.2
5 Note: In order to ensure the performance of the GC column used for the GC-MS runs is satisfactory, the retention gap (a section of capillary column fitted between the GC injector and the analytical GC column) is usually changed before a batch of sample extracts is run. Also, when this is done a small length of the analytical GC column is usually removed (as on-column injection is used, any non-volatile material remains on the retention gap, and may also contaminate the front end of the analytical GC column). As a consequence the scan number reported for the same compound in different extracts may be different, depending on whether the extracts were run as one batch (i.e. the retention gap and analytical column length were identical for each extract) in which case the reported scan numbers will be within a 1-3 scan range, or whether the extracts were run in different batches (i.e. the retention gap and analytical column length were slightly different for each batch). In the latter case, if there has been a significant time period between running the extracts from a survey taking several months (as in this present case), the scan numbers reported for the same compound may vary by up to 50 scans.
17

Table 3.6 continued
Scan Compound A1 A2 A3 A4 A5 A6 A7 A8 A10 A12 A13 A14 A14 D A15 A16
1240 2,6-Di-t-butyl-4-hydroxy-4-methyl-2,5-cyclohexadien-1-one
.3
8) .
4) .4
0.3 1241 BHT 0.3
0.3 0.2
2.6 0.2
0.2
2.0 6.3 0.2
6.4 6.8 0.71250 1,6-Dioxacyclododecane-7,12-dione
0.6
2.0
1.8
1.9
4.3
6.8 0.2 1257 Unknown m/z 45,58,54,55 0.7
1257 Unknown m/z 45,115,58,55
0.3
1308 Diethyl phthalate 0.2 0.2 0.11327 Unknown m/z 71,55,41,43 + d34-Hexadexane (internal standard) 3.4 4.2 4.21375 Unknown m/z 71,43,41,57 0.3 0.11440 Unknown m/z 55,101,42,41
0.3
1.0
1.1
1.11628 Di-n-butyl phthalate 0.21650 Methyl-3-(3,5-di-t-butyl-4-hydroxyphenyl)propionate 0.3
0.4
1710 Sulphur (S8) 0 1742 Unknown m/z 71,42,41,55 1.5
1752 Unknown m/z 71,42,55,41 (M+288) 88.7
70.1
8.0 1754 Unknown m/z 71,42,41,55 (M+288) 122.4
1754 Unknown m/z 42,71,41,43 (M+ 288)
11.6
1755 Unknown m/z 42,71,41,43 3.2
1810 Unknown m/z 71,73,55,42 (M+ 28
58
7 1945 Unknown m/z 42,41,71,43 5.8
4.1
1975 Unknown m/z 42,41,71,72 33.2
22.0*
92.9* 1993 Unknown m/z 42,41,71,72 (M+ 576)
68.8* 2001 Unknown m/z 42,71,73,41 3.2
2065
Unknown m/z 55,173,99,113 (M+ 34
1
18

Table 3.6 continued
Scan Compound A1 A2 A3 A4 A5 A6 A7 A8 A10 A12 A13 A14 A14 D A15 A16
2094 Unknown m/z 42,71,41,55 (M+ 360)
0) .7
6)
2) .1
236.2 2094 Unknown m/z 71,42,41,55 (M+ 360) 175.8
2094 Unknown m/z 42,41,71,39 (M+ 360)
153.9 2095 Unknown m/z 42,41,71,39 3.3
2135 Di-(2-ethylhexyl) phthalate 2.92151 Unknown m/z 71,42,73,55 (M+ 36 14
2153 Unknown m/z 71,55,73,42 (M+ 360) 127.9
113.62250 Unknown m/z 55,41,42,173 (M+ 372)
1.7 2272 Unknown m/z 42,41,71,72 10.1
2273 Unknown m/z 42,41,71,73 12.9
2339 Unknown m/z 42,73,71,55 8.4
2340 Unknown m/z 42,73,71,41 6.2
2433 Unknown m/z 55,42,41,71 (M+ 400) 1.4
2436 Unknown m/z 42,71,41,72 (M+ 57
122.8*
2443 Unknown m/z 42,41,71,72 67.8
278.1
4.7
2445 Unknown m/z 42,41,71,72 (M+ 432) 345.6
294.2 2528 Unknown m/z 71,42,41,55 (M+ 43 21
2534 Unknown m/z 42,71,41,55 (M+ 432) 218.5 2535 Unknown m/z 71,42,55,73 (M+ 432)
227.9 2560 Unknown m/z 250,221,180,132
1.3 2736 Unknown m/z 42,41,71,72 7.7
2774 Unknown m/z 113,69,41,39 2.4
2866
Unknown m/z 42,73,71,41
4.1
19
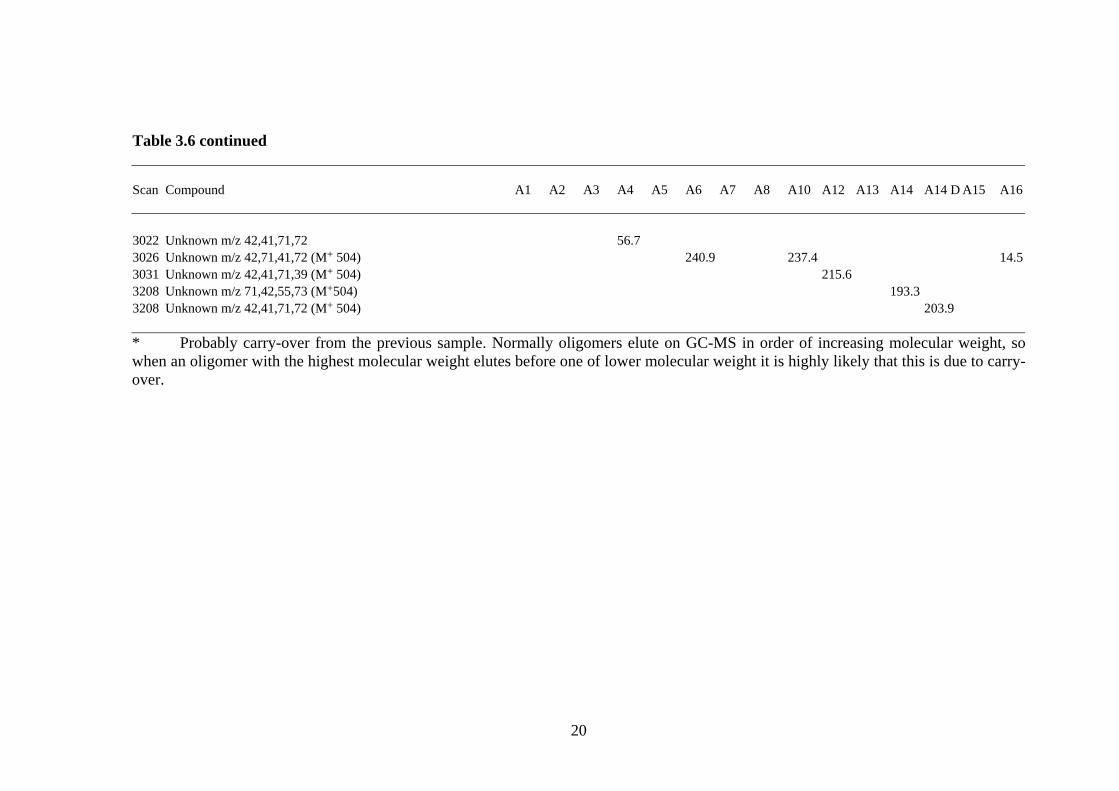
Table 3.6 continued
Scan Compound A1 A2 A3 A4 A5 A6 A7 A8 A10 A12 A13 A14 A14 D A15 A16
3022 Unknown m/z 42,41,71,72
56.7
3026 Unknown m/z 42,71,41,72 (M+ 504) 240.9
237.4
14.5 3031 Unknown m/z 42,41,71,39 (M+ 504) 215.6
3208 Unknown m/z 71,42,55,73 (M+504) 193.3 3208
Unknown m/z 42,41,71,72 (M+ 504)
203.9
* Probably carry-over from the previous sample. Normally oligomers elute on GC-MS in order of increasing molecular weight, so when an oligomer with the highest molecular weight elutes before one of lower molecular weight it is highly likely that this is due to carry-over.
20
3.3 Identification of unknowns
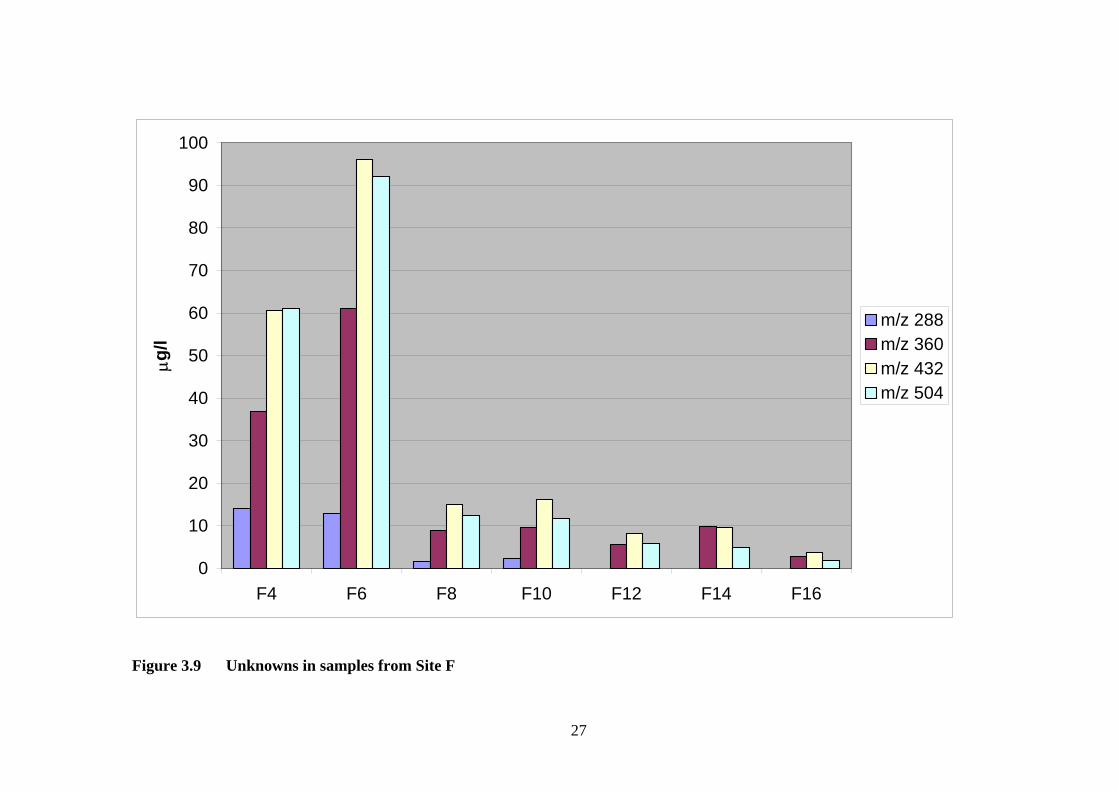
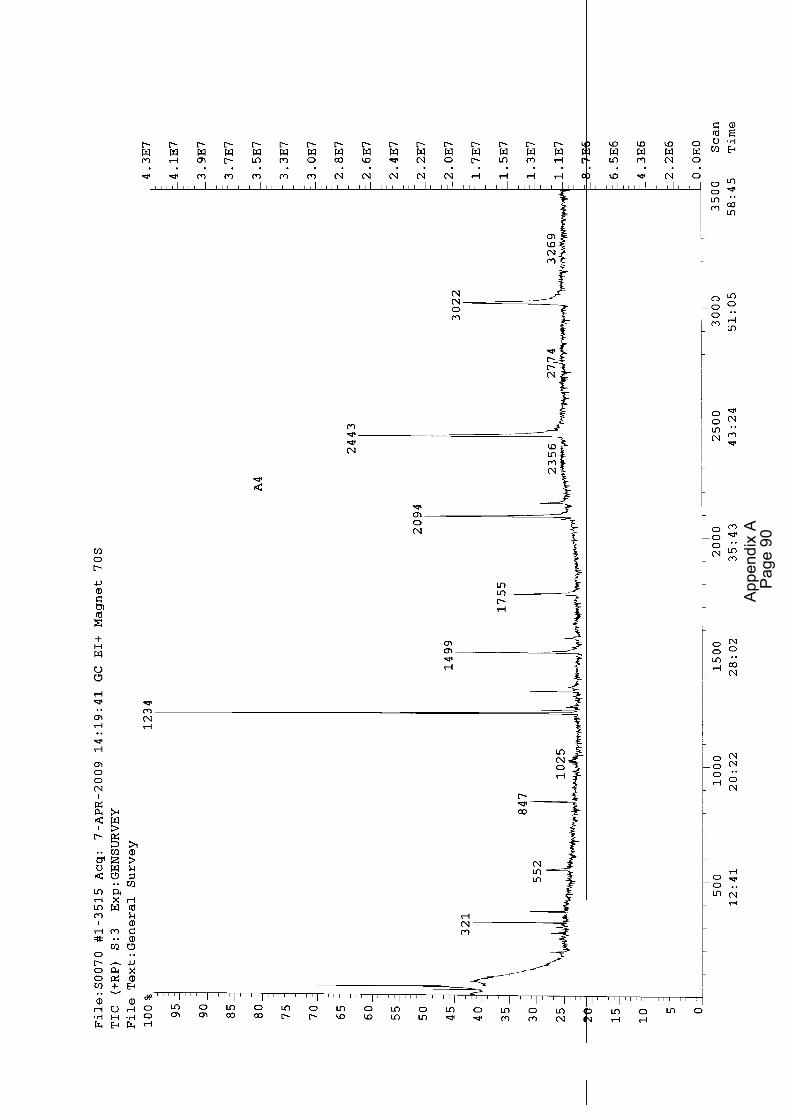
A series of unknowns with molecular weights in multiples of 72 (i.e. m/z 288, 360, 432 and 504) was found in many of the stagnation samples. An example chromatogram is given in Figure 3.4 and representative mass spectra are given in Figure 3.5 to Figure 3.8. Plots of the concentrations of these compounds are shown in Figure 3.9 and Figure 3.10.
Prior to carrying out the GC-MS analysis of extracts from the water samples taken at the selected sampling sites, previous analytical results obtained by two other Regulation 31 designated test laboratories when flexible rising mains were considered for approval, were inspected.
Two reports by laboratory M provide analytical results relating to two different test samples. The first relates to a hose, diameter 51 mm, whereas the second relates to a riser with a diameter of 152 mm. Both samples were submitted for approval by the same manufacturer and both products are described as the same trade name. However, from an examination of the GC-MS data contained in the two reports it appears that the two reports relate to different materials – the migration waters from the 51 mm diameter hose contain many significant unidentified compounds that have mass spectra in which the base peak is at m/z 59, while the migration waters from the 152 mm diameter riser contain significant compounds (again unidentified) whose mass spectra have a base peak at m/z 71. The total ion current (TIC) chromatograms also differ significantly.
Four reports from laboratory L relate to a flexible rising main from a different manufacturer, nominal internal diameter 38 mm. The compounds present at the highest concentrations in the migration waters were not identified in the initial report but the base peaks in their mass spectra were at m/z 71, and from the mass spectra provided in the appendix to this report it appears that these compounds were the same as those detected by laboratory M in the 152 mm diameter riser. One of the later reports from laboratory L suggests that the unknown compounds detected at the highest concentrations in the migration waters could be a series of oligomers of poly(tetrahydrofuran) (polyTHF), also referred to as poly(tetramethyleneglycol) (PTMEG). Butane-1,4-diol and PTMEG may be used in the production of polyurethanes.
21

Figure 3.4 Mass chromatograms of unknowns
22

Figure 3.5 Mass spectrum of unknown m/z 288
23

Figure 3.6 Mass spectrum of unknown m/z 360
24

Figure 3.7 Mass spectrum of unknown m/z 432
25

Figure 3.8 Mass spectrum of unknown m/z 504
26
0
10
20
30
40
50
60
70
80
90
100
F4 F6 F8 F10 F12 F14 F16
µg/l
m/z 288m/z 360m/z 432m/z 504
Figure 3.9 Unknowns in samples from Site F
27

0
50
100
150
200
250
300
350
400
A4 A6 A8 A10 A12 A14 A16
µg/l
m/z 288m/z 360m/z 432m/z 504
Figure 3.10 Unknowns in samples from Site A
28
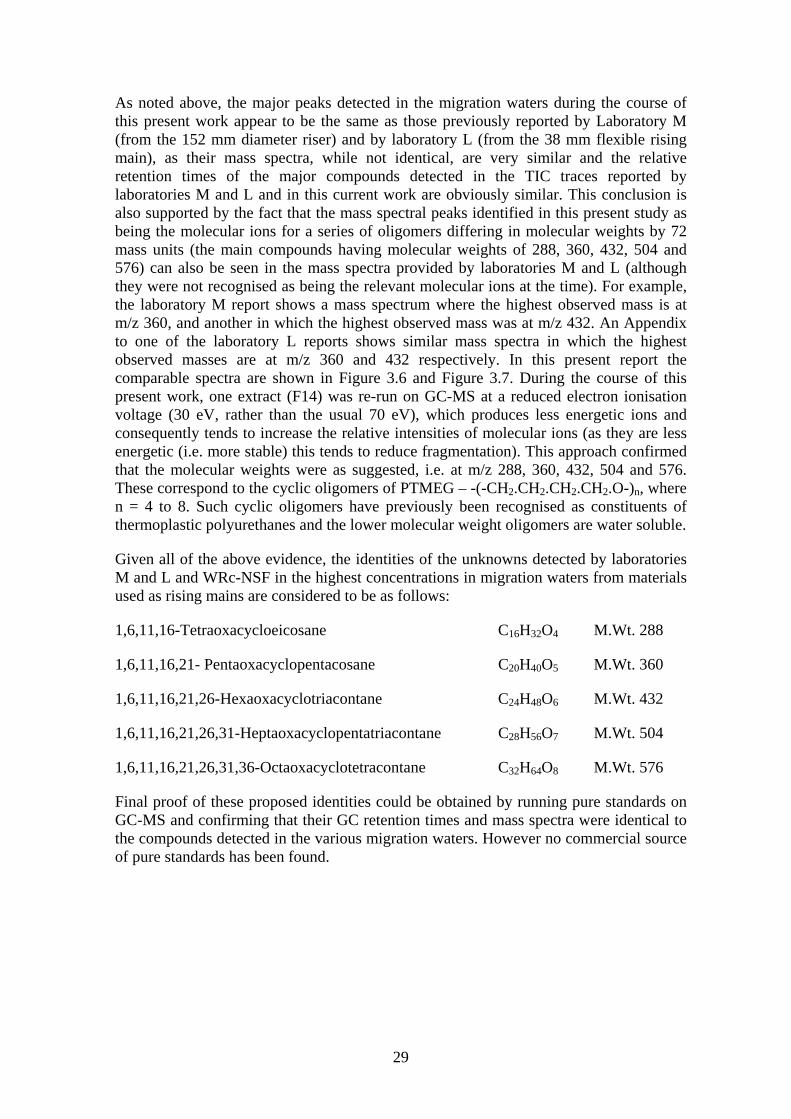
As noted above, the major peaks detected in the migration waters during the course of this present work appear to be the same as those previously reported by Laboratory M (from the 152 mm diameter riser) and by laboratory L (from the 38 mm flexible rising main), as their mass spectra, while not identical, are very similar and the relative retention times of the major compounds detected in the TIC traces reported by laboratories M and L and in this current work are obviously similar. This conclusion is also supported by the fact that the mass spectral peaks identified in this present study as being the molecular ions for a series of oligomers differing in molecular weights by 72 mass units (the main compounds having molecular weights of 288, 360, 432, 504 and 576) can also be seen in the mass spectra provided by laboratories M and L (although they were not recognised as being the relevant molecular ions at the time). For example, the laboratory M report shows a mass spectrum where the highest observed mass is at m/z 360, and another in which the highest observed mass was at m/z 432. An Appendix to one of the laboratory L reports shows similar mass spectra in which the highest observed masses are at m/z 360 and 432 respectively. In this present report the comparable spectra are shown in Figure 3.6 and Figure 3.7. During the course of this present work, one extract (F14) was re-run on GC-MS at a reduced electron ionisation voltage (30 eV, rather than the usual 70 eV), which produces less energetic ions and consequently tends to increase the relative intensities of molecular ions (as they are less energetic (i.e. more stable) this tends to reduce fragmentation). This approach confirmed that the molecular weights were as suggested, i.e. at m/z 288, 360, 432, 504 and 576. These correspond to the cyclic oligomers of PTMEG – -(-CH2.CH2.CH2.CH2.O-)n, where n = 4 to 8. Such cyclic oligomers have previously been recognised as constituents of thermoplastic polyurethanes and the lower molecular weight oligomers are water soluble.
Given all of the above evidence, the identities of the unknowns detected by laboratories M and L and WRc-NSF in the highest concentrations in migration waters from materials used as rising mains are considered to be as follows:
1,6,11,16-Tetraoxacycloeicosane C16H32O4 M.Wt. 288
1,6,11,16,21- Pentaoxacyclopentacosane C20H40O5 M.Wt. 360
1,6,11,16,21,26-Hexaoxacyclotriacontane C24H48O6 M.Wt. 432
1,6,11,16,21,26,31-Heptaoxacyclopentatriacontane C28H56O7 M.Wt. 504
1,6,11,16,21,26,31,36-Octaoxacyclotetracontane C32H64O8 M.Wt. 576
Final proof of these proposed identities could be obtained by running pure standards on GC-MS and confirming that their GC retention times and mass spectra were identical to the compounds detected in the various migration waters. However no commercial source of pure standards has been found.
29

30

4. DISCUSSION
At both sites, only low levels of leaching were observed from the original liners that had been in use for many years. After the introduction of new liners, large numbers of unknowns were detected in the stagnation samples. These compounds tended to be present at lower concentrations or were undetectable in samples taken after flushing for 60 minutes.
The major unknowns were identified as a series of oligomers differing in molecular weight by 72 mass units, the main compounds having molecular weights of 288, 360, 432, 504 and 576. Examination of mass spectra provided in earlier test reports on leaching from similar materials from laboratories L and M showed that these same compounds were present. These compounds are likely to be oligomeric cyclic ethers although their identities cannot be confirmed conclusively due to a lack of pure standards. However, a reasonably high degree of confidence can be attached to this identification since the same series of cyclic ethers (although wrongly named after the first one) are included in NSF Standard 61 (NSF 2007, NSF 2007a). The presence of oligomeric cyclic ethers in polyurethanes has been reported (e.g. US Patent 4638097).
Based upon the TOC results there did not appear to be a difference in leaching characteristics between chalk- and greensand-derived waters. There were differences in the concentrations of chemicals detected by GC-MS but it is not known whether these differences were attributable to differences in water quality or to differences between batches of flexible hose.
Chemicals were still detected in stagnation samples several weeks after the new liners were installed. This suggests that it would not be practical or effective for the manufacturer to rinse the risers as part of the manufacturing process.
Concentrations of leached chemicals in samples taken after flushing tended to be low. At site F when samples were taken after flushing for up to 24 hours, practically no leaching was observed after 24 hours flushing. This suggests that a suitable control method would be to flush newly installed risers, with the output going to waste, for 24 hours prior to reconnection to the public water supply.
31

32
5. CONCLUSIONS
1. Negligible leaching of chemicals occurred from old risers that had been in use for five years or longer.
2. GC-MS analysis of stagnation samples from new flexible risers installed at both sites showed the presence of a number of unknowns (that were subsequently tentatively identified) at relatively high concentrations.
3. These chemicals were absent or present at lower concentrations in flushed samples.
4. The chemicals were still detected in stagnation samples several weeks after the liners were installed.
5. The major unknowns were identified as a series of oligomers differing in molecular weight by 72 mass units, the main compounds having molecular weights of 288, 360, 432, 504 and 576.
6. These compounds are likely to be oligomeric cyclic ethers although their identities cannot be conclusively confirmed due to a lack of pure standards.
7. Conclusions 4 and 5 are supported by examination of earlier test reports from two other test laboratories.
8. There did not appear to be an overall difference in the leaching characteristics at the two sites.
9. It would not be practical or effective for the manufacturer to rinse the risers as part of the manufacturing process.
10. Flushing to waste before reconnection to a public water supply could be a suitable means for water undertakers to ensure low concentrations of leached chemicals entering supply.
33

34

REFERENCES
NSF International (2007) NSF/ANSI Standard 61. Revisions to Standard 61 Section 3. http://standards.nsf.org/apps/group_public/download.php/220/Table%203.1%20Revisions.pdf
NSF (2007a) NSF/ANSI 61-2007a. Drinking water system components. Health effects. Table D2.
US Patent 4638097 Reducing the content of cyclic oligomeric ethers in polytetramethylene ether glycols or polyoxybutylene polyoxyalkylene glycols.
35

36

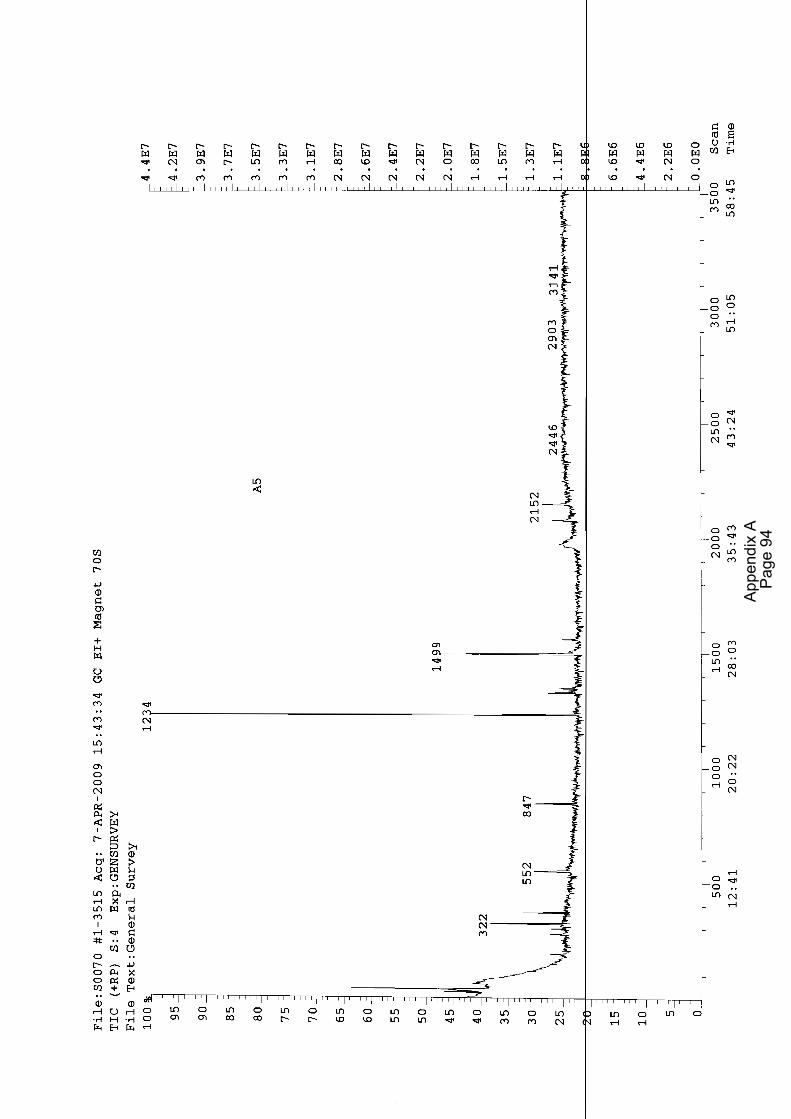
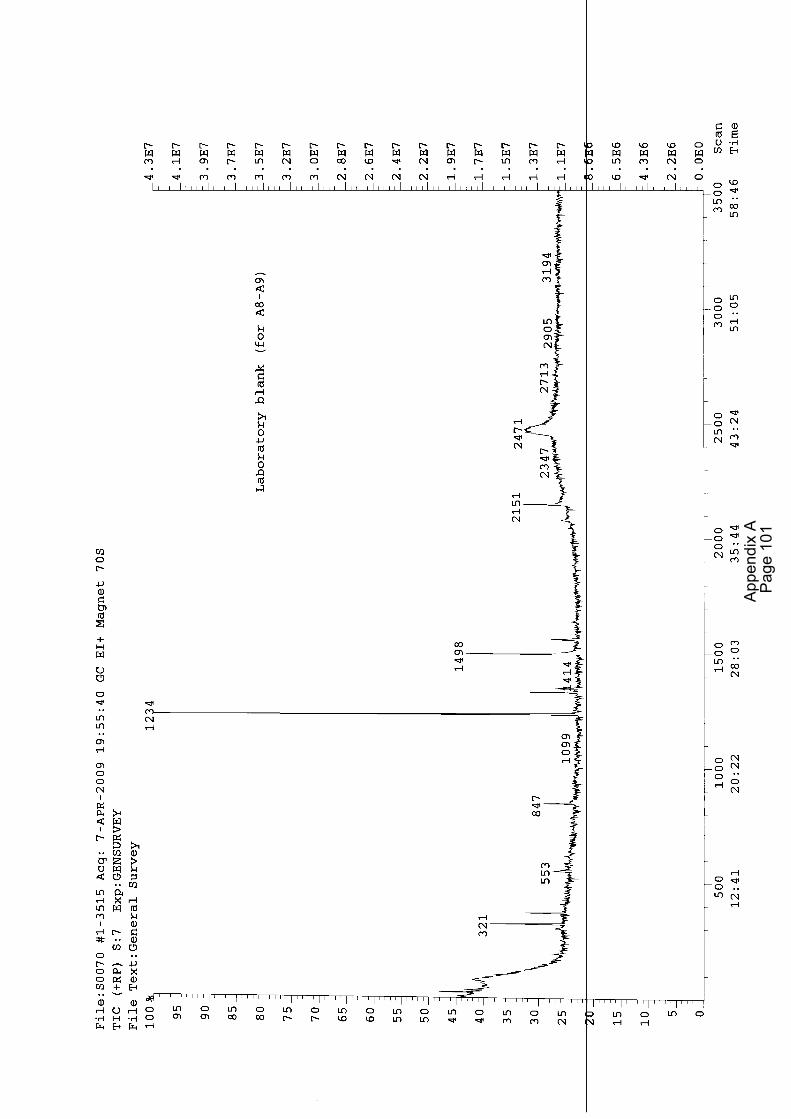
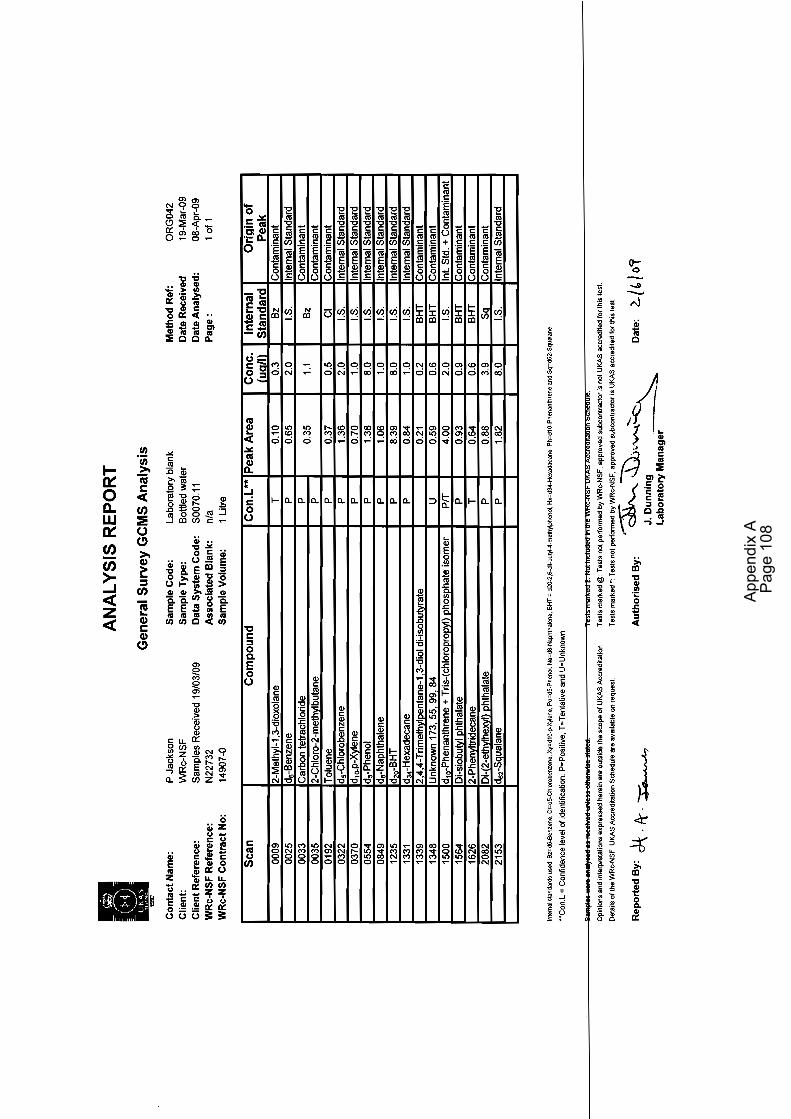
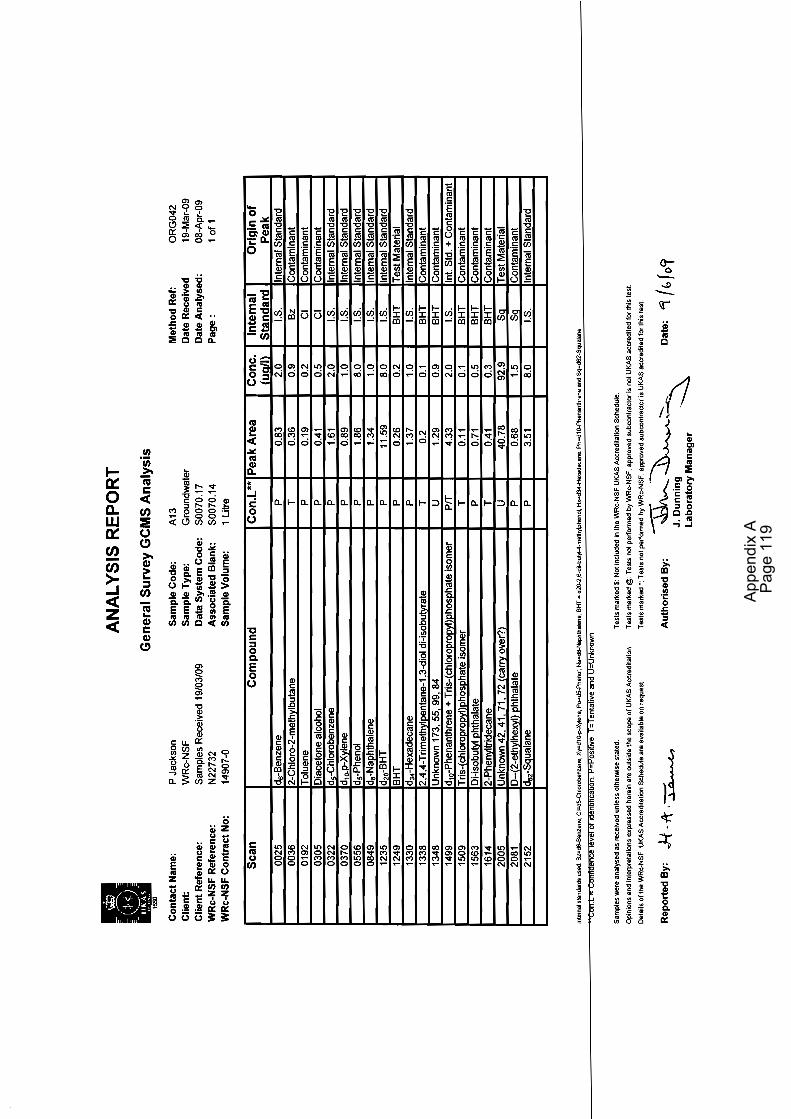
APPENDIX A DETAILED GC-MS RESULTS
Appendix A Page 1

Appendix
A
Page 2
Appendix
A
Page 3

Appendix
A
Page 4

Appendix
A
Page 5

Appendix
A
Page 6

Appendix
A
Page 7
Appendix
A
Page 8

Appendix
A
Page 9

Appendix
A
Page 1
0

Appendix
A
Page 1
1

Appendix
A
Page 1
2

Appendix
A
Page 1
3

Appendix
A
Page 1
4

Appendix
A
Page 1
5

Appendix
A
Page 1
6

Appendix
A
Page 1
7
Appendix
A
Page 1
8

Appendix
A
Page 1
9

Appendix
A
Page 2
0

Appendix
A
Page 2
1

Appendix
A
Page 2
2

Appendix
A
Page 2
3

Appendix
A
Page 2
4

Appendix
A
Page 2
5

Appendix
A
Page 2
6

Appendix
A
Page 2
7

Appendix
A
Page 2
8

Appendix
A
Page 2
9

Appendix
A
Page 3
0

Appendix
A
Page 3
1

Appendix
A
Page 3
2

Appendix
A
Page 3
3

Appendix
A
Page 3
4

Appendix
A
Page 3
5
Appendix
A
Page 3
6
Appendix
A
Page 3
7

Appendix
A
Page 3
8
Appendix
A
Page 3
9

Appendix
A
Page 4
0

Appendix
A
Page 4
1

Appendix
A
Page 4
2

Appendix
A
Page 4
3

Appendix
A
Page 4
4

Appendix
A
Page 4
5

Appendix
A
Page 4
6

Appendix
A
Page 4
7

Appendix
A
Page 4
8
Appendix
A
Page 4
9
Appendix
A
Page 5
0

Appendix
A
Page 5
1

Appendix
A
Page 5
2

Appendix
A
Page 5
3

Appendix
A
Page 5
4

Appendix
A
Page 5
5
Appendix
A
Page 5
6

Appendix
A
Page 5
7

Appendix
A
Page 5
8

Appendix
A
Page 5
9

Appendix
A
Page 6
0

Appendix
A
Page 6
1

Appendix
A
Page 6
2

Appendix
A
Page 6
3

Appendix
A
Page 6
4

Appendix
A
Page 6
5

Appendix
A
Page 6
6

Appendix
A
Page 6
7

Appendix
A
Page 6
8
Appendix
A
Page 6
9

Appendix
A
Page 7
0
Appendix
A
Page 7
1

Appendix
A
Page 7
2

Appendix
A
Page 7
3

Appendix
A
Page 7
4

Appendix
A
Page 7
5

Appendix
A
Page 7
6

Appendix
A
Page 7
7

Appendix
A
Page 7
8

Appendix
A
Page 7
9
Appendix
A
Page 8
0

Appendix
A
Page 8
1
Appendix
A
Page 8
2

Appendix
A
Page 8
3

Appendix
A
Page 8
4
Appendix
A
Page 8
5

Appendix
A
Page 8
6

Appendix
A
Page 8
7

Appendix
A
Page 8
8

Appendix
A
Page 8
9
Appendix
A
Page 9
0
Appendix
A
Page 9
1

Appendix
A
Page 9
2
Appendix
A
Page 9
3
Appendix
A
Page 9
4

Appendix
A
Page 9
5

Appendix
A
Page 9
6

Appendix
A
Page 9
7

Appendix
A
Page 9
8

Appendix
A
Page 9
9

Appendix
A
Page 1
00
Appendix
A
Page 1
01

Appendix
A
Page 1
02

Appendix
A
Page 1
03

Appendix
A
Page 1
04

Appendix
A
Page 1
05

Appendix
A
Page 1
06

Appendix
A
Page 1
07
Appendix
A
Page 1
08

Appendix
A
Page 1
09

Appendix
A
Page 1
10

Appendix
A
Page 1
11

Appendix
A
Page 1
12

Appendix
A
Page 1
13

Appendix
A
Page 1
14

Appendix
A
Page 1
15

Appendix
A
Page 1
16

Appendix
A
Page 1
17

Appendix
A
Page 1
18
Appendix
A
Page 1
19

Appendix
A
Page 1
20

Appendix
A
Page 1
21
Appendix
A
Page 1
22

Appendix
A
Page 1
23

Appendix
A
Page 1
24

Appendix
A
Page 1
25
Appendix
A
Page 1
26

Appendix
A
Page 1
27

Appendix
A
Page 1
28

Appendix
A
Page 1
29

Appendix
A
Page 1
30

Appendix
A
Page 1
31