Embed Size (px)
Citation preview
Formation of DBPS during Booster Chlorination
Defra Project WT1291
Department: Water, Environment and Energy Date: 19th March 2017
Formation of DBPS during Booster Chlorination Defra Project WT1291
Project No.: DWI 70/2/297 Client: Defra Drinking Water Inspectorate Client Manager: Mr Shaun Jones/Dr Peter Marsden Prepared by: Emma H. Goslan Cranfield Water Science Institute Cranfield University, Cranfield, Bedfordshire, MK43 0AL
2

Disclaimer The research was funded by the Department for Environment, Food and Rural Affairs (Defra) under Project WT 1291 (DWI 70/2/297) and managed by the Drinking Water Inspectorate. The views expressed here are those of the authors and not necessarily those of the Department or the Inspectorate. The contents of this document are subject to copyright and all rights are reserved. No part of this document may be reproduced, stored in a retrieval system or transmitted, in any form or by any means electronic, mechanical, photocopying, recording or otherwise, without the prior written consent of the copyright owner.
3

Acknowledgements The authors thank the Defra Project Managers for their helpful advice throughout the project and comments on this report. The authors are grateful to the participating water companies for enabling the collection of samples and for providing the necessary information about their water supply systems.
4
Executive Summary Disinfection by-products (DBPs) are formed by the reaction of chemical disinfectants with naturally occurring organic matter and bromide in source waters. These DBPs are regulated and measured at consumer taps. It is necessary to maintain a disinfectant residual in order that the efficacy of the disinfection is not compromised. Typically chemical disinfectants are added to treated drinking water at the treatment works and this is sufficient to maintain a residual up to the consumers’ taps. However, where the distribution system is lengthy, it may be necessary to add or boost the disinfectant concentration in the network to maintain a residual throughout. The aim of this project was to understand more about the formation of DBPs, specifically trihalomethanes (THMs) and haloacetic acids (HAAs) in drinking water across England and Wales where the water is subject to booster chlorination. This report presents the literature review, data analysis for potential sites, site selection, sampling, analysis and findings of the work carried out. The deliverables are detailed below: 1. Completion of the literature review and summary 2. Liaison with all water companies and selection of study sites 3. Sampling, analysis and investigations 4. Completion of the final report including any suggestions or recommendations
The literature review gave the following conclusions:
• THM concentration increases when more chlorine is added during booster chlorination • The rate of chlorine decay and corresponding THM formation can be modelled using a
second order decay model • The concentration of free chlorine residual present in the water is not related to the level
of THMs formed when free chlorine levels are less than 1 mg/L • HAA concentration can increase or decrease or stay the same after booster chlorination • HAA behaviour depends on the concentration of free chlorine residual in the water • HAAs can be degraded if the chlorine residual is low and the correct type of bacteria are
present in the water It was recommended that the sites selected to study would encompass a range of chlorine concentrations and colony counts to determine the impact on HAA behaviour. Twenty-six water companies in England and Wales were contacted and a good response was received from the majority of water companies. Ten companies were selected where booster chlorination was carried out and it was practical to collect samples. Samples were collected monthly over a period of one year. The location of the sampling points were before booster chlorination, after booster chlorination and downstream of booster chlorination. The samples were analysed for THMs and HAAs as well as residual chlorine, temperature and pH. Additional samples were collected at the exit of the treatment works to determine the total organic carbon (TOC) content, ultraviolet absorbance at 254 nm (UV) and bromide concentration. The results were investigated to determine the impact of booster chlorination on DBPs. When free chlorine concentrations were low (≤ 0.3 mg/L), levels of THMs and HAAs were stable or slightly increased after booster chlorination by up to 10.42% and <10% respectively when comparing the means. The increase was not statistically significant at the 95% level. At these low chlorine concentrations there is also evidence of degradation with a shift to TXAAs and an increase in BIF caused by a reduction in DXAA, particularly those that are chlorinated. The chlorinated DXAAs have been shown to be the easiest to biodegrade. The levels of THMs and HAAs were often stable due to the low free chlorine residual concentrations.
5
At medium chlorine concentrations (0.3 – 0.7 mg/L), the increase in THMs and HAAs is greater (16.68% and 12.72% respectively) and this increase is significant for THMs (t = 2.251, p = 0.0258) but not for HAAs at the 95% confidence level. At high chlorine concentrations (>0.7 mg/L) the difference in THMs (increase of 13.42%) and HAAs (<10% change) was not significant at the 95% confidence level. When considering all of the data collected over the time period, the increase in THMs after booster chlorination was statistically significant at the 95% confidence level when comparing the means. The increase was small (just over 10%). The change in HAAs after booster chlorination was not significant at the 95% confidence level. Although there was no significant difference in overall HAA concentrations, it is possible to determine whether there is evidence for bacterial degradation by looking at the speciation of the HAAs and their incorporation of bromine. An increase in the TXAA:DXAA ratio and an increase in the HAA BIF coupled with no increase in the HAA concentration overall can indicate biological or bacterial degradation of HAAs, particularly the dihalogenated HAAs. Here there was no evidence of bacterial degradation at 10 out of the 16 sites. Where there was evidence of bacterial degradation, it was not consistent over the period sampled. In agreement with previous researchers it can be concluded that the degradation of HAAs following booster chlorination is a site-specific occurrence, depending on residual chlorine concentrations at various locations in the system and temperature, both of which affect the colonisation of HAA degrading bacteria. Degradation of HAAs was observed in a number of locations whereas THM degradation did not occur to any significant degree The reduction in HAA concentrations observed here might have gone unnoticed in typical sampling programs currently used by water utilities. The discovery of notable phenomena such as HAA degradation leading to spatial and temporal variations in HAA concentrations can be attributed to the comprehensive sampling carried out over a period of time on a month-by-month basis. Such a sampling programme would be required to determine distribution systems where degradation of HAAs may occur and this should not be restricted to locations where booster chlorination is carried out. Should HAAs be regulated in the EU and the UK in the future, this further degree of understanding may be useful.
6
Introduction Disinfection by-products are formed by the reaction of chemical disinfectants with naturally occurring organic matter and bromide in source waters. These disinfection by-products are regulated and measured at consumer taps. It is necessary to maintain a disinfectant residual in order that the efficacy of the disinfection is not compromised. Typically chemical disinfectants are added to treated drinking water at the treatment works and this is sufficient to maintain a residual up to the consumers’ taps. However, where the distribution system is lengthy, it may be necessary to add or boost the disinfectant concentration in the network to maintain a residual throughout. The aim of this project was to understand more about the formation of disinfection by-products in drinking water across England and Wales where the water is subject to booster chlorination. This project focused on the effect of booster chlorination on the formation of disinfection by-products and the causes of such effects. This report presents the literature review, data analysis for potential sites, site selection, sampling, analysis and findings of the work carried out. The milestones and deliverables are detailed below:
Deliverables 1. Completion of the literature review and summary 2. Liaison with all water companies and selection of study sites 3. Sampling, analysis and investigations 4. Completion of the final report including any suggestions or recommendations
Milestones 1. Completion of literature review and summary 2. Completion of data gathering 3. Completion of site selection 4. Submission of 12 month interim report 5. Completion of sampling surveys 6. Submission of draft report 7. Acceptance of final report.
7
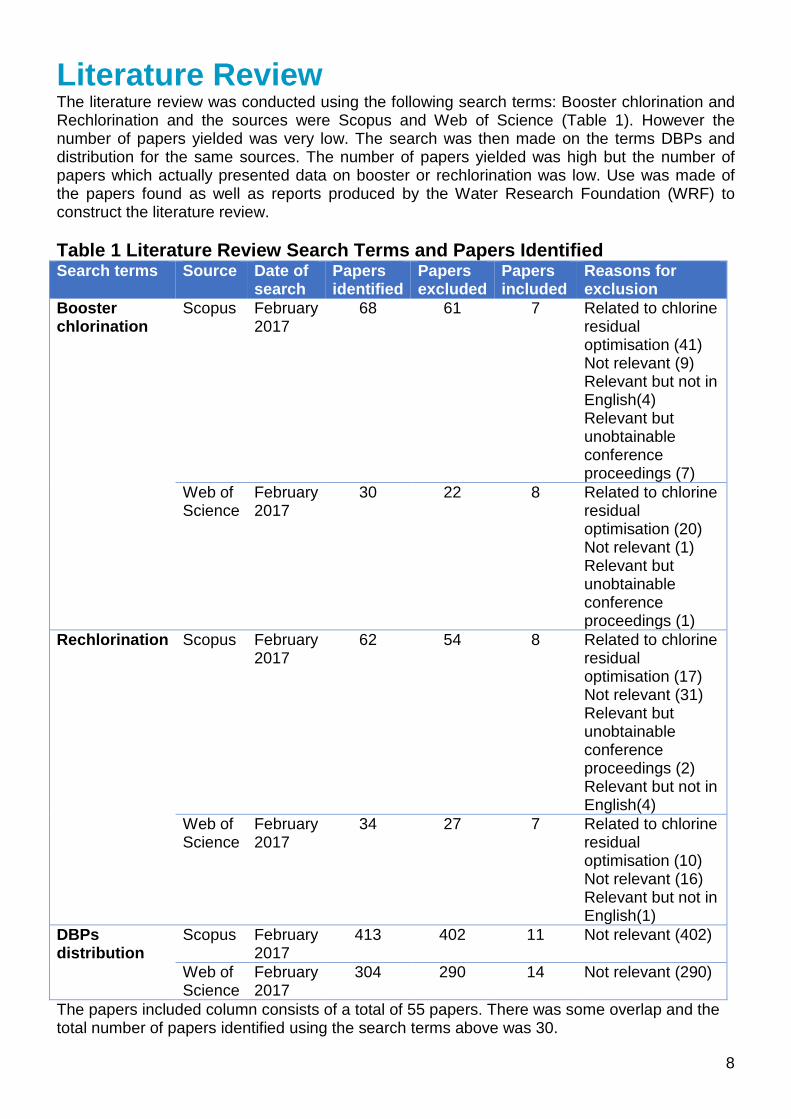
Literature Review The literature review was conducted using the following search terms: Booster chlorination and Rechlorination and the sources were Scopus and Web of Science (Table 1). However the number of papers yielded was very low. The search was then made on the terms DBPs and distribution for the same sources. The number of papers yielded was high but the number of papers which actually presented data on booster or rechlorination was low. Use was made of the papers found as well as reports produced by the Water Research Foundation (WRF) to construct the literature review. Table 1 Literature Review Search Terms and Papers Identified Search terms Source Date of
search Papers identified
Papers excluded
Papers included
Reasons for exclusion
Booster chlorination
Scopus February 2017
68 61 7 Related to chlorine residual optimisation (41) Not relevant (9) Relevant but not in English(4) Relevant but unobtainable conference proceedings (7)
Web of Science
February 2017
30 22 8 Related to chlorine residual optimisation (20) Not relevant (1) Relevant but unobtainable conference proceedings (1)
Rechlorination Scopus February 2017
62 54 8 Related to chlorine residual optimisation (17) Not relevant (31) Relevant but unobtainable conference proceedings (2) Relevant but not in English(4)
Web of Science
February 2017
34 27 7 Related to chlorine residual optimisation (10) Not relevant (16) Relevant but not in English(1)
DBPs distribution
Scopus February 2017
413 402 11 Not relevant (402)
Web of Science
February 2017
304 290 14 Not relevant (290)
The papers included column consists of a total of 55 papers. There was some overlap and the total number of papers identified using the search terms above was 30.
8
Introduction In the UK, DBP concentrations must be kept as low as possible without compromising the effectiveness of the disinfection. In addition, a prescribed concentration of 100 µg L-1 has been set for the sum of the concentrations of the four THMs measured at the consumers tap. An HAA9 standard was proposed in a document submitted to the European Union (Cortvriend, 2008) but following that the Commission announced it did not propose to amend the standards. More recently the Commission has conducted a number of consultations which may lead to revision of the Directive. Although HAAs are not regulated in the UK, they can be monitored as part of the Risk Assessment process required to be carried out by Water Companies (DWI, 2010). There are nine brominated and/or chlorinated HAAs in total and they are, with THMs, a major group of DBPs found in chlorinated and chloraminated supplies. US EPA (1998) have set a MCL of 60 µg L-1 for HAA5 (mono-, di-, trichloroacetic acid, mono-, dibromoacetic acid) and the WHO has established guideline values for monochloroacetic acid (MCAA) and trichloroacetic acid (TCAA) at 20 µg L-1 and 200 µg L-1 respectively and a provisional guideline value for dichloroacetic acid (DCAA) at 50 µg L-1 (WHO, 2011).
DBP Formation Free chlorine (HOCl) is a powerful oxidant that can react with organic compounds by a variety of mechanisms, including simple oxidation reactions (e.g., RCHO + HOCl → RCOOH + Cl- + H+), substitution and addition reactions (e.g., the formation of chlorophenol from phenol), and addition to unsaturated carbon-carbon bonds to from chlorohydrins (e.g., RHC=CHR + HOCl → ClRHC-CHROH) (Larson and Weber, 1994). Chlorine also can react with substituted benzenes resulting in ring cleavage (De Leer et al., 1985). Trihalomethanes are formed via the haloform reaction in which chlorine reacts with enolizable carbonyl compounds via electrophilic addition (Morris and Baum, 1978). Observed products of the chlorination of NOM solutions include the aforementioned trihalomethanes along with halogenated acetic acids, halonitriles, haloaldehydes, and chlorophenols (Tate and Arnold, 1990; Krasner et al., 2001). Among the THMs and HAAs, chloroform, DCAA and TCAA are the major components observed in drinking waters (Williams et al., 1997a, Sung et al., 2000). The brominated DBPs are formed when free chlorine reacts with bromide to form hypobromous acid (HOBr), which reacts with the organic matter in a similar fashion to HOCl. In addition to free chlorine, combined chlorine (chloramines) reacts with organic matter to form DBPs, but at a much slower rate. With chloramines, increasing pH decreases THM formation, which is the opposite of the trend observed for free chlorine (Diehl et al., 2000). Dissolved organic halogen (DOX) and HAAs also decreased with increasing pH. The Cl2:N ratio also plays a role in DBP levels, with DBPs decreasing at lower Cl2:N ratios. Unfortunately, the dihalogenated acetic acids are preferentially formed during chloramination, and these species may be of the greatest health concern (Diehl et al., 2000).
DBP Fate in Distribution Systems Numerous full-scale monitoring campaigns have demonstrated that THM levels generally increase with increasing residence time along the distribution system. Conversely, HAAs have been shown to decrease along the distribution systems in some cases (e.g., LeBel et al., 1997; Williams et al., 1997a). Singer et al. (1995), however, reported an increase in HAAs along the distribution system, which was attributed to elevated chlorine levels. Although most utilities that use chlorine in the distribution system detect their highest concentrations of THMs at the distribution system location with the maximum detention time, Williams and colleagues (1995) observed that DCAA and other HAAs were significantly reduced in concentration in many samples collected from locations with the maximum residence time. Williams and colleagues (1997b) also found that bacteria at locations with maximum residence time (in a portion of the distribution system in which the chlorine residual had significantly decreased) are capable of degradation of DCAA and other HAAs.
9
A study of 9 water treatment works across the UK has been undertaken (by Cranfield University on behalf of Defra) to assess the levels of HAA9 in distribution (Parsons and Goslan, 2011).HAA9 levels were observed to increase in 7 of the 9 distribution systems tested, in the case of one works a threefold increase was observed. There is a need for more information and research to better understand the role of pipe materials, contact time and chlorine dose play in this trend. As found in previous work by the authors (Goslan et al., 2009; Bougeard et al., 2010) there was no significant increase in HAA9 concentrations in distribution systems that used chloramines compared to chlorine, this may be useful when considering options for reducing HAA concentrations. Although decreases, increases and no change in HAA levels with increasing residence time in distribution systems have been observed, several parameters such as chlorine residual, retention time, bacterial counts, natural organic matter (NOM), pH, and temperature are believed to be important factors affecting the fate of DBPs. Chlorine residual is considered one of the most important parameters controlling DBP concentrations with its dual impact of increasing formation rates and decreasing biological activity. When DBPs were observed to increase, the chlorine residuals tended to be as high as 3-7 mg/L (Krasner et al., 1989; Nieminski et al., 1993; Singer et al., 1995) while lower chlorine residuals (0.5-1.5 mg/L) were associated with decreases in DBP concentrations (LeBel et al., 1997; Chen and Weisel, 1998). It has been found that THM concentrations are closely associated with chlorine residuals. Lower levels of THMs are observed at low free chlorine residual concentrations agreeing with other US studies. Again, the concentrations of chlorine regarded as low were < 1 mg/L Cl2 (Tung and Xie, 2009). However, HAAs do not follow the same pattern. Because HAAs are easily biodegradable compounds, HAA concentrations may be lower where bioactivity is high. These locations are often associated with longer residence times and low chlorine residual (Tung and Xie, 2009). Temperature and pH are likely to significantly impact DBP levels due to their impacts on DBP formation and degradation. Temperature is one of the most important parameters affecting the fate of HAAs, as seasonal differences in HAA concentrations were observed in several studies (Nieminski et al., 1993, LeBel et al., 1997, Chen and Weisel, 1998). A higher temperature generally increases the kinetics of both chemical and biological reactions. For example, Baribeau and colleagues (2000) found—when the disinfectant residual was absent—that DCAA was stable only in cold water conditions, but was degraded under warm water conditions. When considering what DBP degradation pathways are likely in distribution systems, it is important to consider the types of surfaces that the water comes in contact with. For example, abiotic reduction of halogenated DBPs is possible in unlined steel and iron pipes (Hozalski et al., 2001, Zhang et al., 2004). In addition, corroded iron pipes may harbour high densities of bacteria that are protected from the biocidal activity of chlorine by their association with the pipe wall and tubercles (LeChevallier et al., 1996). It is important to note that growth of bacteria on surfaces to form biofilms is possible on virtually any surface. Although it might be more favourable on corroded iron, biofilm accumulation (and possibly HAA degradation) is not precluded in other types of pipe (e.g., concrete, PVC). Where HAA degradation is observed, the changes in speciation can give information on the mechanism of degradation. For example, if the losses only occur in iron pipe, and trihalogenated HAAs are preferentially degraded to form di- and monohalogenated species, then this suggests abiotic reduction of HAAs. If, on the other hand, the degradation of mono- and dihalogenated HAAs is observed resulting in a net loss of HAAs (i.e. no by-products formed), then this suggests aerobic biological degradation is occurring.
10
Booster Chlorination Booster chlorination refers to the process of adding additional chlorine to water in the distribution system to increase residual chlorine concentrations at locations where they are depleted. A corollary strategy of booster chlorination (re-chlorination) is to reduce the chlorine dose applied at the treatment plant, and to then add chlorine at later points in the distribution system where the chlorine concentration falls below a specified value (Carrico and Singer, 2009). Tryby et al. (1999) concluded that booster chlorination may allow a utility to reduce overall disinfectant dosages while still meeting disinfection goals in the plant and in the distribution system. Additional studies have investigated optimization of the placement of booster stations within the distribution system (Boccelli et al. 1998; Tryby et. al. 2002) but there are few studies on the effect of rechlorination schemes on DBP levels in the system. Of those that state that the impact of THMs is investigated, generally the statement is made that a lower chlorine residual will result in lower THM formation (Li et al., 2015, Radhakrishnan et al., 2012, Cozzolino et al., 2005) or a maintaining a low contact will limit THM formation despite rechlorination (Gatel et al., 2000) but no data is presented. A study which did not look at the impact of rechlorination (Beaulieu et al., 2009) but looked at the organic character and DBPs formed from NOM fractions, nevertheless noted the importance of NOM character when considering rechlorination. This was because they had found that doubling the chlorine dose in laboratory experiments had led to an increase in THMs and HAAs but that this was particularly pronounced for HAA formation from the more hydrophilic organic matter. An early UK study (Gibbs et al., 1990) noted that there was a decrease in THM concentration immediately following booster chlorination but an increase after further retention in the distribution system. Gibbs et al. (1990) also compared samples when booster chlorination was operational and when it was not switched on. They found little difference in the THM behaviour between the two modes of operation. This is possibly due to the low chlorine residual levels in the UK study where the maximum combined chlorine concentration was 0.34 mg/L and the maximum free chlorine concentration was 0.46 mg/L. Gibbs et al. (1990) also noted that assimilable organic carbon was reduced when booster chlorination was operational. Two studies noted that booster chlorination had a notable effect on DBP occurrence. Although the levels of THMs and HAAs are stabilised after a certain amount of time in the distribution system, an additional application of chlorine can produce a significant increase in both THMs and HAAs (Rodriguez et al., 2007, Rodriguez et al., 2004). Another study (Carrico and Singer, 2005) stated that “previous research has indicated that the rates of chlorine consumption and THM formation remain the same under re-chlorination conditions”. They tested this statement using a model water comprised of NOM extracted from Lake Drummond, Virginia which was chlorinated under two scenarios: one representing conventional chlorination, and one representing booster chlorination. Chlorine consumption and THM formation were monitored over a 72 hour time period, and the results show that both THM formation and chlorine consumption were the same under both scenarios. The results of the study also confirmed the findings of previous research that THM formation and chlorine consumption are linearly correlated, even under re-chlorination conditions. However, the study by Carrico and Singer (2005) did not consider other DBPs nor does it take into account the influence of the biofilm or state of the distribution system. Indeed booster chlorination may serve to mask inadequacies in the distribution such as ingress of organic matter or microbes and unwittingly increase concentrations of DBPs beyond levels expected with an increase in chlorine residual. When looking at the kinetics of chlorine decay and the corresponding THM formation, they are said to follow a second order decay model (Clark, 1998, Boccelli et al., 2003). THMs are formed as a linear function of the chlorine demand and this applies to single or multiple dose scenarios. It is possible to estimate total THM formation accurately by calculating the chlorine demand or by using a second order decay model. The chlorine demand is calculated by measuring the chlorine applied to a sample and the free chlorine remaining after time, t. The second order decay models described in the literature consider that there is a reactive species or group of species which decreases as the chlorine reactions proceed. Generally the models described
11
take into account the “bulk decay” that results from the reaction of chlorine with substances in the bulk water but doesn’t take into account the “wall decay” which is due to the reaction of chlorine with the material on the pipe walls (Fisher et al., 2012). The factors influencing bulk decay have been explored in detail including water from the Severn Trent region (Powell et al., 2000). The influencing parameters are initial chlorine concentration, temperature and organic content of the water. For these waters a second order decay model was regarded as suitable for describing the bulk chlorine decay. In all cases, rechlorination of a sample reduced the rate of bulk decay. This is due to the organic levels being lower during rechlorination. The simplicity of this relationship between chlorine decay and THM formation has been questioned by Ohar and Ostfeld (2014) who modelled THM formation under conditions of several booster chlorination systems in a water distribution system and found uncorrelated data when changing the hydraulic conditions and booster timings. The degree of sophistication of models has vastly increased from the earlier days with a greater number of variables being able to be accounted for. A direct measurement of rechlorination has been carried out (Monly et al. 2010). Rechlorination was shown to increase THMs as previously observed by Lee et al. (2007). It was indicated by Monly et al. (2010) that modelling of the distribution system to determine THM levels would be improved by knowing the dose of chlorine applied at rechlorination points but acknowledged that, in practice, these values are rarely known. This is because the chlorine dose is regulated automatically based on the free residual chlorine concentration after the rechlorination point. The study by Lee et al. (2007) investigated the timing of rechlorination by adding additional chlorine at 36 and 72 hours and found that the increase in formation of THMs after rechlorination was less pronounced at 72 hours than at 36 hours. There have been many laboratory studies carried out to investigate the impact of rechlorination particularly on THM formation. One of these reported the THM formation after 4 hours and 24 hours among four different chlorination strategies, using a chlorine dosing time interval of 30 min and a total chlorine dose of 4 mg/L. Results showed that two-point chlorination formed less TTHMs than the one-point dosing strategy, and the lower chlorine doses at the 1st point corresponded to the reduced TTHMs formation (Liu et al., 2012). A recent pilot scale study (Tian et al., 2017) showed that TCAA concentrations rose, then fell after different doses of rechlorination (0.9, 1.2 and 1.5 mg/L). The maximum concentration was reached at 1.5, 2 and 3 hours respectively after rechlorination indicating that a lower chlorine dosage could shorten the rising period. Another laboratory scale study (Gerrity et al., 2009) evaluated the impact of photocatalysis as a treatment process on THMs formed after rechlorination. A large increase in THMs formed was observed (200% in some cases). However there were no control experiments to confirm if this was due to the use of photocatalysis or if this was a feature of this particular sample of water. Conversely, little increase in THMs was observed after coagulation, flocculation and membrane ultrafiltration (Chan et al., 2002). The most comprehensive study carried out to date on booster chlorination in real distribution systems is the WRF (formerly AwwaRF) study which investigated the fate of THM4 and HAA9 in distribution before and after booster chlorination (Baribeau et al., 2006). They sampled seven times over one year. They sampled a storage tank as well as a booster chlorination station before and after rechlorination but because the sampling points were very close together (less than 2 metres apart) they deemed that the “after” location was not representative and a sampling point downstream (water age of 323 hours – 13.5 days) was used instead. They drew the following conclusions:
• Surprisingly storage reservoirs (without booster chlorination) did not affect THM4 and HAA9 concentrations significantly with variations of 20% or less most of the time. DBP concentration would, however, be highly dependent on the reservoir hydraulic scenario (e.g. filling or emptying) at the time of sampling.
• Booster chlorination increased THM4 concentrations by 16-101% • The fate of HAAs resulted from a balance between their formation and degradation which
was related to the free chlorine residual present. 12
• Decreases in HAA concentration were most likely due to HAA biodegradation when the free chlorine was <0.1 mg/L downstream of the booster chlorination station. Increases in HAA9 were observed when the free chlorine residual remained high (1.3 and 1.4 mg/L) downstream of booster chlorination. When the free chlorine decreased but remained detectable (0.3-0.5 mg/L) HAA9 concentrations did not change following booster chlorination.
Summary of Findings • THM concentration increases when more chlorine is added during booster chlorination • The rate of chlorine decay and corresponding THMs can be modelled using a second
order decay model • The concentration of free chlorine residual present in the water is not related to the level
of THMs formed when free chlorine levels are less than 1 mg/L • HAA concentration can increase or decrease or stay the same after booster chlorination • HAA behaviour depends on the concentration of free chlorine residual in the water • HAAs can be degraded if the chlorine residual is low and the correct type of bacteria are
present in the water When selecting sites to study, it would be prudent to select sites that have a range of chlorine concentrations and colony counts to determine the impact on HAA behaviour.
13
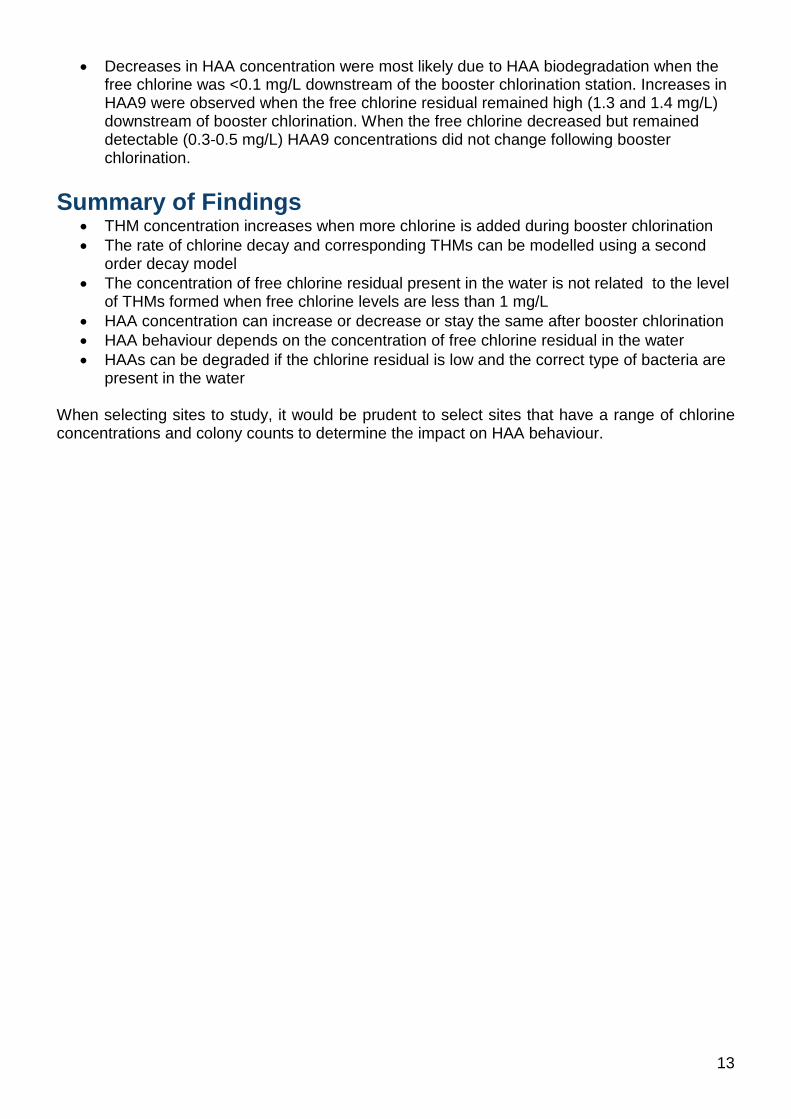
Response and data collected from Water Companies Twenty-six water companies in England and Wales were contacted by Shaun Jones of Defra. The letter sent is in Appendix 2. A good response was received from the majority of water companies. However, three companies did not respond at all (9, 18 & 24) although the request for information was sent out three times in total. A late response was received from Water Company 23 and when the work was explained in more detail, they identified a single site that fitted the criteria. The responses are tabulated (Table 2). Table 2 Response from Water Companies regarding Booster Chlorination Response
received? Do they booster chlorinate?
How many sites?
Information available?
1 Yes Yes 2 Cl2 residual and THMs 2 Yes No n/a n/a 3 Yes Yes 8 Cl2 residual plus nitrate,
turbidity, phosphate for 1 site
4 Yes Yes 9 Cl2 residual, water age and travel time 5 Yes Yes 2 Cl2 residual, source water data, treatment
processes, extent of blending with other sources / supplies
6 Yes No n/a n/a 7 Yes Yes 9 Cl2 residual 8 Yes Yes 2 Cl2 residual and THM spot sample data 9 No 10 Yes No n/a n/a 11 Yes No n/a n/a 12 Yes Yes 25 Cl2 residual data
THM in network from customer taps 13 Yes No n/a n/a 14 Yes TBC TBC TBC 15 Yes No n/a n/a 16 Yes Yes 81 Cl2 residual and THMs for some sites 17 Yes Yes 4 Associated with the reservoir, Cl2 residual,
THMs, 18 No 19 Yes Yes 9 Cl2 residual, THM, very limited HAA at some
locations, Approx water age? 20 Yes Yes 8 Cl2 telemetry trends, sampling data for Cl2 and
THMs in distribution, water age could be modelled
21 Yes No n/a n/a 22 Yes No n/a n/a 23 Yes Yes 5 Cl2 residual and THMs 24 No 25 Yes Yes 18 Cl2 residual and THMs for some sites 26 Yes Yes ~80 Information not provided n/a – not applicable
14
In total 23 out of 26 companies provided a response and of these, 14 practice booster chlorination.
Data Processing The locations (names) of all of the booster chlorination sites were requested and this information was provided to the data team at DWI. They then wrote to each company to ask for permission to access the data for each site and provide this data to Cranfield University. All 14 companies agreed to provide the information. The data mainly consisted of the water quality data from the service reservoirs and the data that was processed was:
1. Free chlorine 2. Total chlorine 3. Coliforms 4. E. Coli 5. Colony counts (after 3 days at 22ºC)
The data was provided for a 5 year period (2009-2013) and assessed according to the maximum, minimum and median. The median is one of a number of ways of summarising the typical values associated with members of a statistical population particularly when the distribution may be skewed as with colony counts and has been used here instead of the mean. Two types of data were supplied by the DWI data team:
1. WTW and Zonal data 2. Service Reservoir data
The WTW and Zonal data is summarised in Appendix 3 for information purposes. The data was not complete for all sites and so was not used in the site selection process. The Service Reservoir data has been processed to produce the mean values for Colony Counts and Residual Chlorine (free in most cases but total where free was not available) and plotted on graphs (see Appendix 1) to inform the site selection process.
15
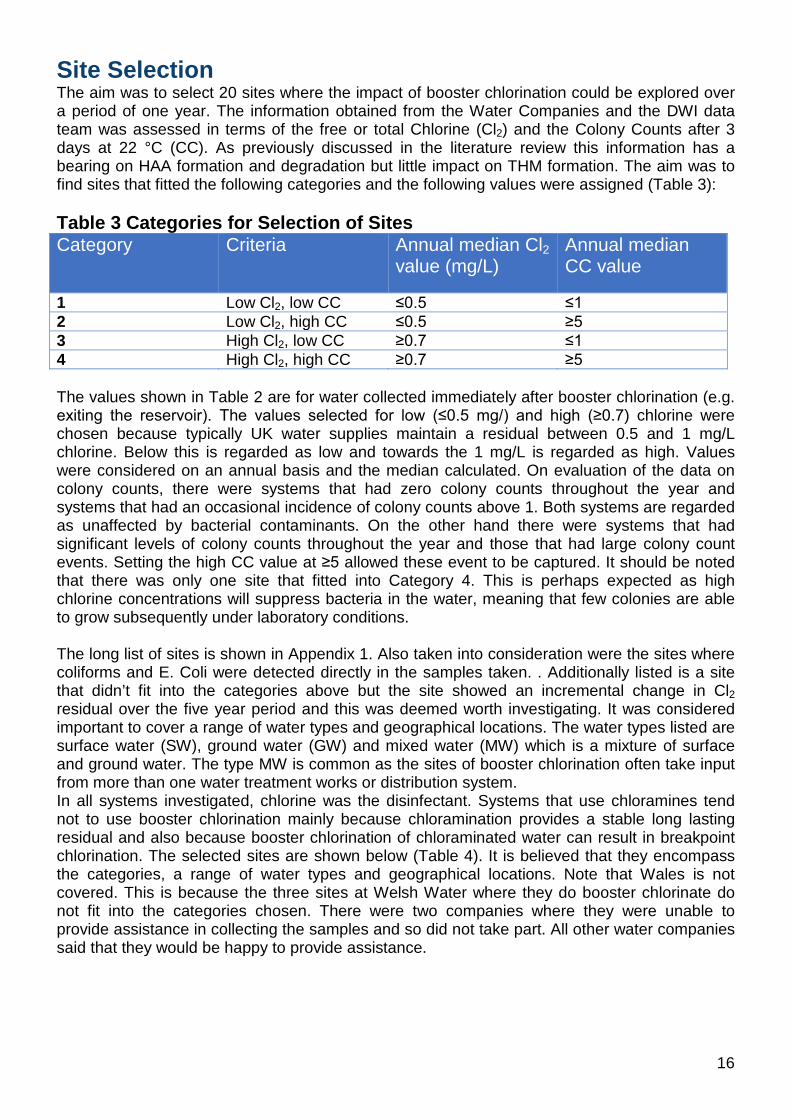
Site Selection The aim was to select 20 sites where the impact of booster chlorination could be explored over a period of one year. The information obtained from the Water Companies and the DWI data team was assessed in terms of the free or total Chlorine (Cl2) and the Colony Counts after 3 days at 22 °C (CC). As previously discussed in the literature review this information has a bearing on HAA formation and degradation but little impact on THM formation. The aim was to find sites that fitted the following categories and the following values were assigned (Table 3): Table 3 Categories for Selection of Sites Category Criteria Annual median Cl2
value (mg/L) Annual median CC value
1 Low Cl2, low CC ≤0.5 ≤1 2 Low Cl2, high CC ≤0.5 ≥5 3 High Cl2, low CC ≥0.7 ≤1 4 High Cl2, high CC ≥0.7 ≥5 The values shown in Table 2 are for water collected immediately after booster chlorination (e.g. exiting the reservoir). The values selected for low (≤0.5 mg/) and high (≥0.7) chlorine were chosen because typically UK water supplies maintain a residual between 0.5 and 1 mg/L chlorine. Below this is regarded as low and towards the 1 mg/L is regarded as high. Values were considered on an annual basis and the median calculated. On evaluation of the data on colony counts, there were systems that had zero colony counts throughout the year and systems that had an occasional incidence of colony counts above 1. Both systems are regarded as unaffected by bacterial contaminants. On the other hand there were systems that had significant levels of colony counts throughout the year and those that had large colony count events. Setting the high CC value at ≥5 allowed these event to be captured. It should be noted that there was only one site that fitted into Category 4. This is perhaps expected as high chlorine concentrations will suppress bacteria in the water, meaning that few colonies are able to grow subsequently under laboratory conditions. The long list of sites is shown in Appendix 1. Also taken into consideration were the sites where coliforms and E. Coli were detected directly in the samples taken. . Additionally listed is a site that didn’t fit into the categories above but the site showed an incremental change in Cl2 residual over the five year period and this was deemed worth investigating. It was considered important to cover a range of water types and geographical locations. The water types listed are surface water (SW), ground water (GW) and mixed water (MW) which is a mixture of surface and ground water. The type MW is common as the sites of booster chlorination often take input from more than one water treatment works or distribution system. In all systems investigated, chlorine was the disinfectant. Systems that use chloramines tend not to use booster chlorination mainly because chloramination provides a stable long lasting residual and also because booster chlorination of chloraminated water can result in breakpoint chlorination. The selected sites are shown below (Table 4). It is believed that they encompass the categories, a range of water types and geographical locations. Note that Wales is not covered. This is because the three sites at Welsh Water where they do booster chlorinate do not fit into the categories chosen. There were two companies where they were unable to provide assistance in collecting the samples and so did not take part. All other water companies said that they would be happy to provide assistance. 16
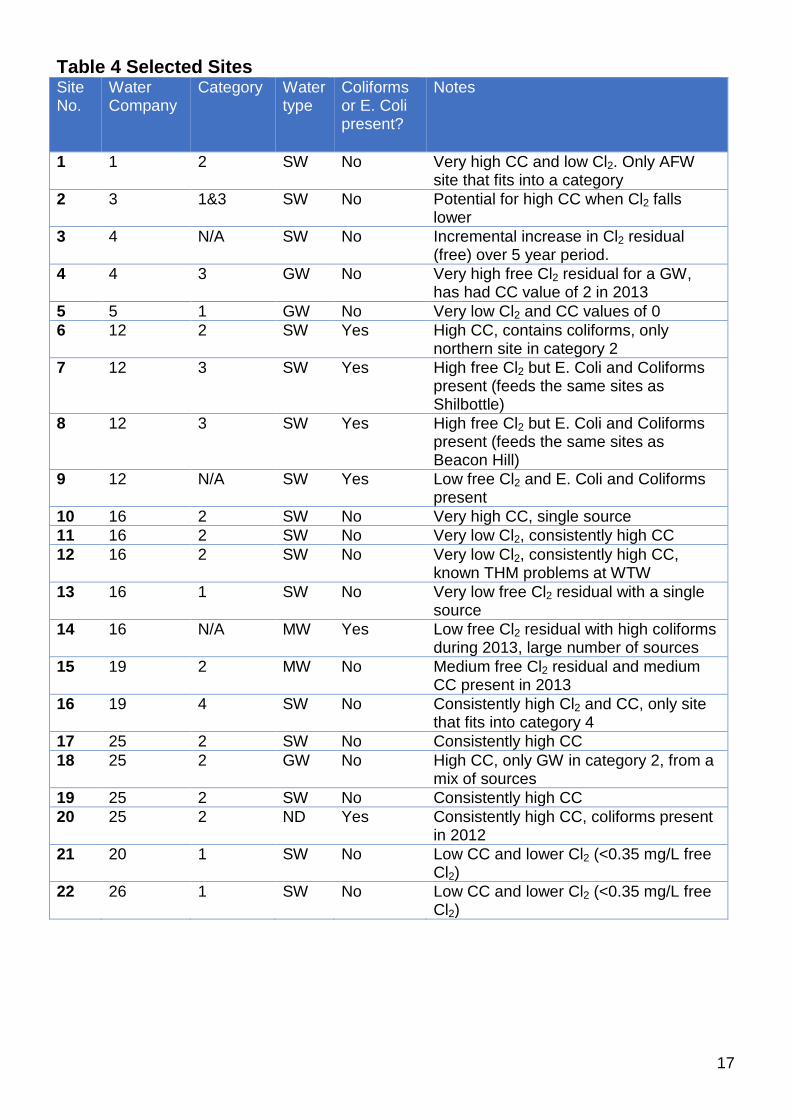
Table 4 Selected Sites Site No.
Water Company
Category Water type
Coliforms or E. Coli present?
Notes
1 1 2 SW No Very high CC and low Cl2. Only AFW site that fits into a category
2 3 1&3 SW No Potential for high CC when Cl2 falls lower
3 4 N/A SW No Incremental increase in Cl2 residual (free) over 5 year period.
4 4 3 GW No Very high free Cl2 residual for a GW, has had CC value of 2 in 2013
5 5 1 GW No Very low Cl2 and CC values of 0 6 12 2 SW Yes High CC, contains coliforms, only
northern site in category 2 7 12 3 SW Yes High free Cl2 but E. Coli and Coliforms
present (feeds the same sites as Shilbottle)
8 12 3 SW Yes High free Cl2 but E. Coli and Coliforms present (feeds the same sites as Beacon Hill)
9 12 N/A SW Yes Low free Cl2 and E. Coli and Coliforms present
10 16 2 SW No Very high CC, single source 11 16 2 SW No Very low Cl2, consistently high CC 12 16 2 SW No Very low Cl2, consistently high CC,
known THM problems at WTW 13 16 1 SW No Very low free Cl2 residual with a single
source 14 16 N/A MW Yes Low free Cl2 residual with high coliforms
during 2013, large number of sources 15 19 2 MW No Medium free Cl2 residual and medium
CC present in 2013 16 19 4 SW No Consistently high Cl2 and CC, only site
that fits into category 4 17 25 2 SW No Consistently high CC 18 25 2 GW No High CC, only GW in category 2, from a
mix of sources 19 25 2 SW No Consistently high CC 20 25 2 ND Yes Consistently high CC, coliforms present
in 2012 21 20 1 SW No Low CC and lower Cl2 (<0.35 mg/L free
Cl2) 22 26 1 SW No Low CC and lower Cl2 (<0.35 mg/L free
Cl2)
17
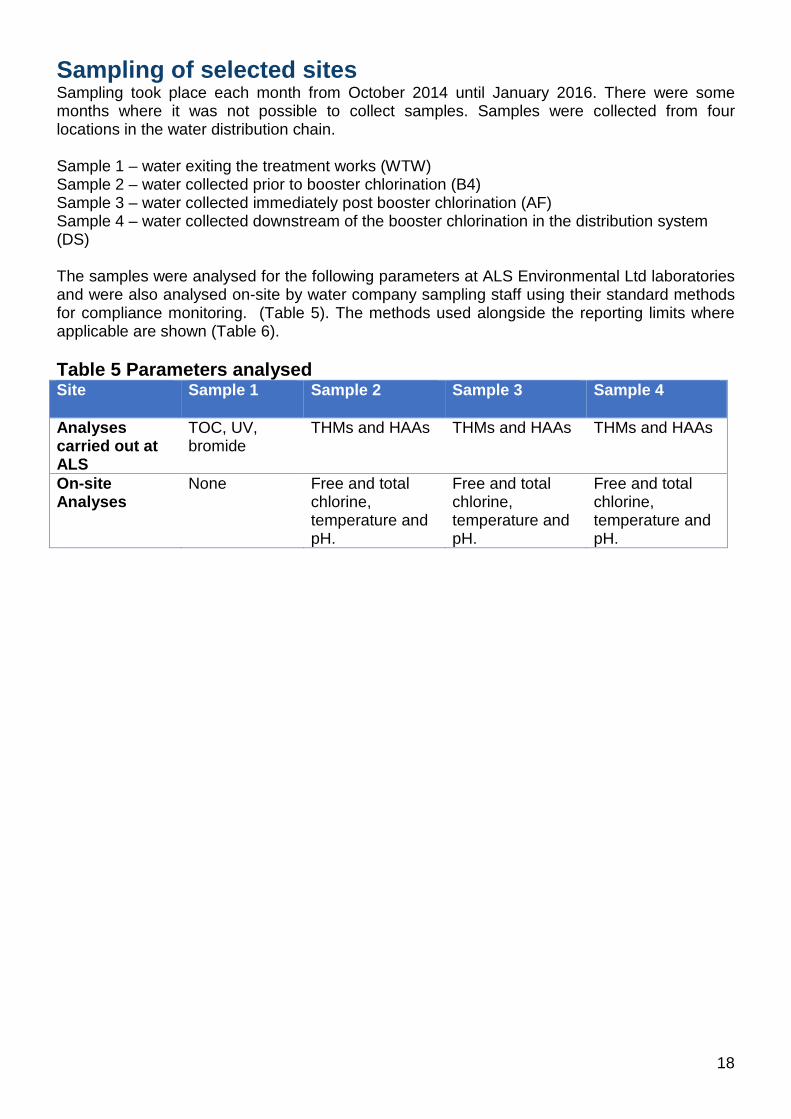
Sampling of selected sites Sampling took place each month from October 2014 until January 2016. There were some months where it was not possible to collect samples. Samples were collected from four locations in the water distribution chain. Sample 1 – water exiting the treatment works (WTW) Sample 2 – water collected prior to booster chlorination (B4) Sample 3 – water collected immediately post booster chlorination (AF) Sample 4 – water collected downstream of the booster chlorination in the distribution system (DS) The samples were analysed for the following parameters at ALS Environmental Ltd laboratories and were also analysed on-site by water company sampling staff using their standard methods for compliance monitoring. (Table 5). The methods used alongside the reporting limits where applicable are shown (Table 6). Table 5 Parameters analysed Site Sample 1 Sample 2 Sample 3 Sample 4
Analyses carried out at ALS
TOC, UV, bromide
THMs and HAAs THMs and HAAs THMs and HAAs
On-site Analyses
None Free and total chlorine, temperature and pH.
Free and total chlorine, temperature and pH.
Free and total chlorine, temperature and pH.
18
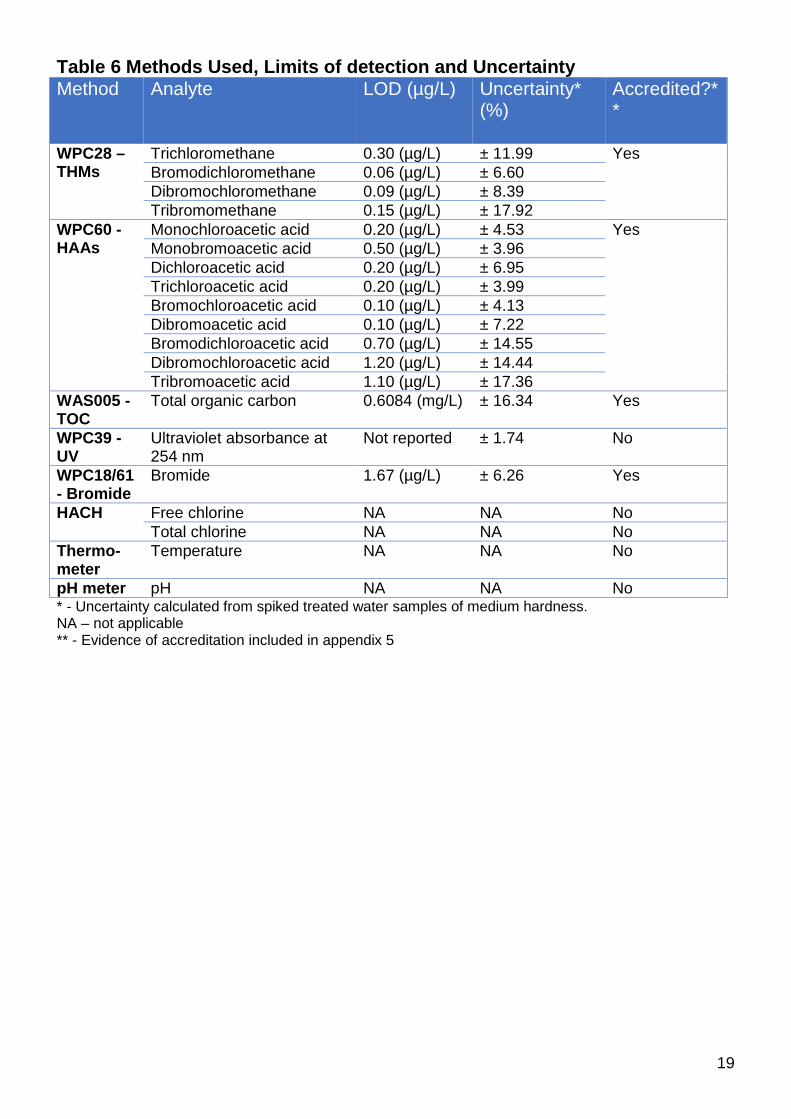
Table 6 Methods Used, Limits of detection and Uncertainty Method Analyte LOD (µg/L) Uncertainty*
(%) Accredited?**
WPC28 – THMs
Trichloromethane 0.30 (µg/L) ± 11.99 Yes Bromodichloromethane 0.06 (µg/L) ± 6.60 Dibromochloromethane 0.09 (µg/L) ± 8.39 Tribromomethane 0.15 (µg/L) ± 17.92
WPC60 - HAAs
Monochloroacetic acid 0.20 (µg/L) ± 4.53 Yes Monobromoacetic acid 0.50 (µg/L) ± 3.96 Dichloroacetic acid 0.20 (µg/L) ± 6.95 Trichloroacetic acid 0.20 (µg/L) ± 3.99 Bromochloroacetic acid 0.10 (µg/L) ± 4.13 Dibromoacetic acid 0.10 (µg/L) ± 7.22 Bromodichloroacetic acid 0.70 (µg/L) ± 14.55 Dibromochloroacetic acid 1.20 (µg/L) ± 14.44 Tribromoacetic acid 1.10 (µg/L) ± 17.36
WAS005 - TOC
Total organic carbon 0.6084 (mg/L) ± 16.34 Yes
WPC39 - UV
Ultraviolet absorbance at 254 nm
Not reported ± 1.74 No
WPC18/61 - Bromide
Bromide 1.67 (µg/L) ± 6.26 Yes
HACH Free chlorine NA NA No Total chlorine NA NA No
Thermo-meter
Temperature NA NA No
pH meter pH NA NA No * - Uncertainty calculated from spiked treated water samples of medium hardness. NA – not applicable ** - Evidence of accreditation included in appendix 5
19
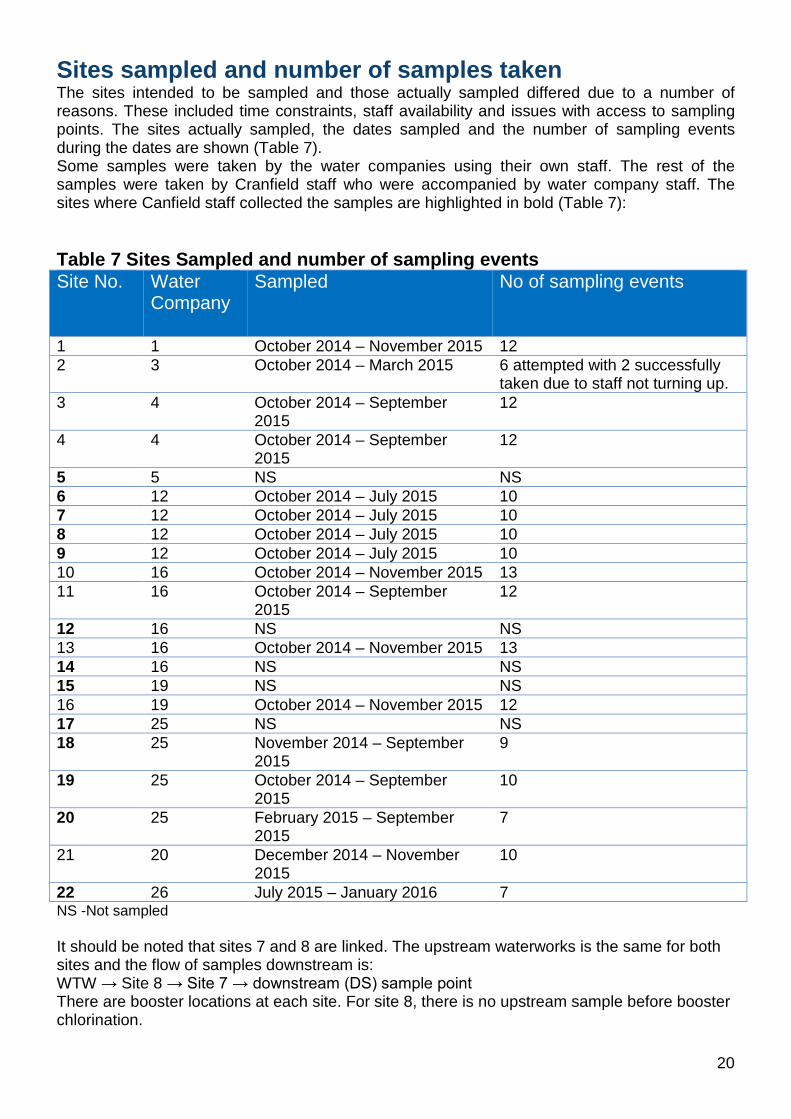
Sites sampled and number of samples taken The sites intended to be sampled and those actually sampled differed due to a number of reasons. These included time constraints, staff availability and issues with access to sampling points. The sites actually sampled, the dates sampled and the number of sampling events during the dates are shown (Table 7). Some samples were taken by the water companies using their own staff. The rest of the samples were taken by Cranfield staff who were accompanied by water company staff. The sites where Canfield staff collected the samples are highlighted in bold (Table 7): Table 7 Sites Sampled and number of sampling events Site No. Water
Company Sampled No of sampling events
1 1 October 2014 – November 2015 12 2 3 October 2014 – March 2015 6 attempted with 2 successfully
taken due to staff not turning up. 3 4 October 2014 – September
2015 12
4 4 October 2014 – September 2015
12
5 5 NS NS 6 12 October 2014 – July 2015 10 7 12 October 2014 – July 2015 10 8 12 October 2014 – July 2015 10 9 12 October 2014 – July 2015 10 10 16 October 2014 – November 2015 13 11 16 October 2014 – September
2015 12
12 16 NS NS 13 16 October 2014 – November 2015 13 14 16 NS NS 15 19 NS NS 16 19 October 2014 – November 2015 12 17 25 NS NS 18 25 November 2014 – September
2015 9
19 25 October 2014 – September 2015
10
20 25 February 2015 – September 2015
7
21 20 December 2014 – November 2015
10
22 26 July 2015 – January 2016 7 NS -Not sampled It should be noted that sites 7 and 8 are linked. The upstream waterworks is the same for both sites and the flow of samples downstream is: WTW → Site 8 → Site 7 → downstream (DS) sample point There are booster locations at each site. For site 8, there is no upstream sample before booster chlorination.
20
Results When examining the results against each category, there were no consistent patterns in terms of behaviour of DBPs. As a result the results are reported as a whole and not in the categories which were used in the collection of the samples. The following abbreviations are used throughout the results and discussion: BDCAA Bromodichloroacetic acid BDCM Bromodichloromethane Cl2 Chlorine DBAA Dibromoacetic acid DBCAA Dibromochloroacetic acid DBCM Dibromochloromethane DCAA Dichloroacetic acid DOC Dissolved organic carbon DXAA Dihalogenated acetic acids MCAA Monochloroacetic acid MBAA Monobromoacetic acid TBAA Tribromoacetic acid TBNM Tribromonitromethane TBM Tribromomethane (bromoform) TCAA Trichloroacetic acid TCM Trichloromethane (chloroform) TXAA Trihalogenated acetic acids
Seasonal Variation in THMs and HAAs THMs and HAAs concentrations were sometimes lowest in the colder months and highest in the warmer months as shown in Figures A4.1-A4.30 presented in appendix 4 (particularly for sites 7, 9 and 16 THMs). The data in the figures is from the sample taken before booster chlorination (sample point 2) in most instances. The free chlorine data is also from the sample taken before booster chlorination. Where the bromide data is presented, these are the values measured in the treated water leaving the works (sample point 1). The lower temperature and lower THMs and HAAs are often consistent with higher chlorine residuals. These trends are consistent with the literature (Krasner et al., 1989, Summers et al., 1996, Obolensky and Frey, 2002). An explanation is that chemical reaction rate constants increase with increasing temperature and that the higher temperatures in the warm season accelerate the rate of THM production in the distribution system as compared with the cold season (Chen and Weisel, 1998). However, there are many sites where the THMs and HAAs are independent of the temperature of the water indicating that other factors are having an impact such as the variation in organic matter, chlorination conditions or presence of bacteria in the system impacting on HAAs. Indeed the opposite trend can often be seen with HAAs with higher temperatures giving rise to higher levels of bacteria with the potential for HAA degradation. No strong seasonal trends were observed except for sites 7, 9 and 16 due to the complexity of the reactions and number of factors involved.
21
Impact of Booster Chlorination on THMs and HAAs Samples were taken before booster chlorination, after booster chlorination and downstream of booster chlorination. Here we have discussed the behaviour in terms of an increase or decrease in THM or HAA concentration and this is shown in the tables with arrows to indicate the behaviour. For the terms of reporting the change in THMs and HAAs at each sample point, a change is only noted if the change in THMs or HAAs is ≥10%. This is to take into account the uncertainty associated with the analytical method. The different types of behaviour were observed and these were categorised (Figure 31, Table 8). As well as the type of behaviour the following tables also present the Free and Total Chlorine concentration and indicate where HAA concentrations were higher than THM concentrations (underlined). The ratio of TXAA to DXAA is reported alongside the bromine incorporation factor (BIF) for the HAAs to show the change in speciation at each sample point. There are very limited results from Site no. 2 as sampling was unable to be carried out due to staff shortages at the water company. The results from Site no. 2 are only complete for one sampling event and will not be considered here. The findings are presented (Table 8).
22
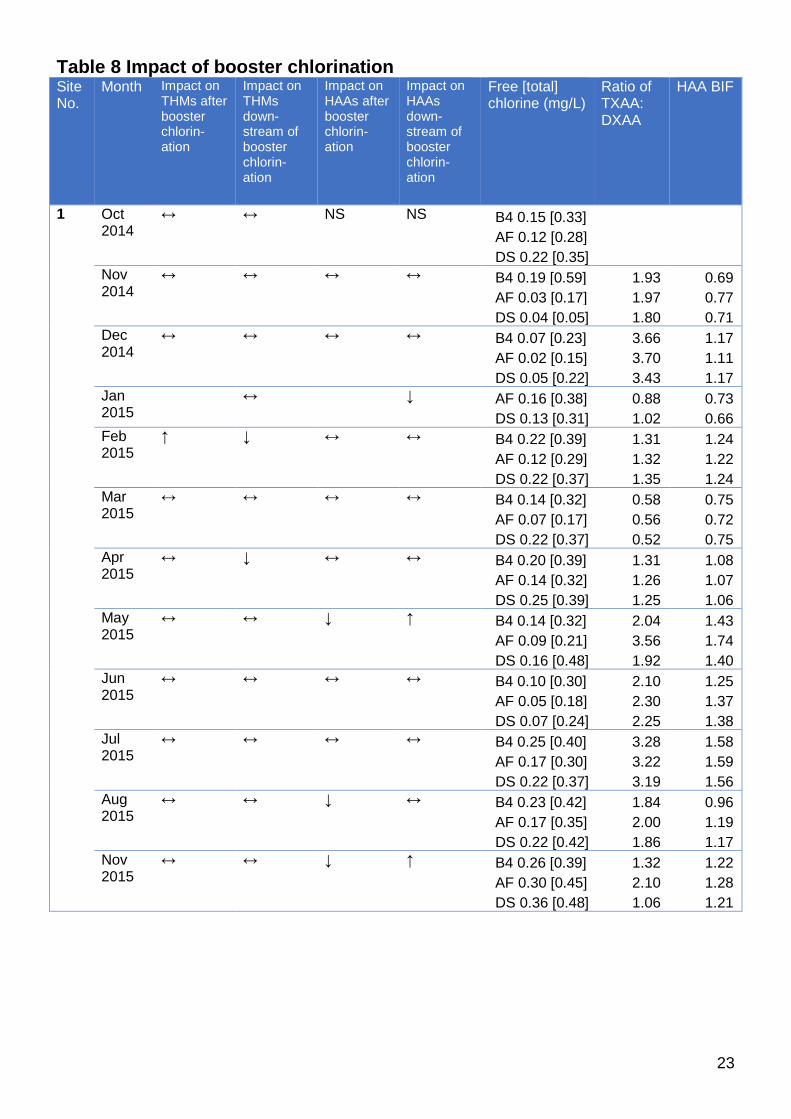
Table 8 Impact of booster chlorination Site No.
Month Impact on THMs after booster chlorin-ation
Impact on THMs down-stream of booster chlorin-ation
Impact on HAAs after booster chlorin-ation
Impact on HAAs down-stream of booster chlorin-ation
Free [total] chlorine (mg/L)
Ratio of TXAA: DXAA
HAA BIF
1 Oct 2014
↔ ↔ NS NS B4 0.15 [0.33] AF 0.12 [0.28] DS 0.22 [0.35]
Nov 2014
↔ ↔ ↔ ↔ B4 0.19 [0.59] AF 0.03 [0.17] DS 0.04 [0.05]
1.93 1.97 1.80
0.69 0.77 0.71
Dec 2014
↔ ↔ ↔ ↔ B4 0.07 [0.23] AF 0.02 [0.15] DS 0.05 [0.22]
3.66 3.70 3.43
1.17 1.11 1.17
Jan 2015
↔ ↓ AF 0.16 [0.38] DS 0.13 [0.31]
0.88 1.02
0.73 0.66
Feb 2015
↑ ↓ ↔ ↔ B4 0.22 [0.39] AF 0.12 [0.29] DS 0.22 [0.37]
1.31 1.32 1.35
1.24 1.22 1.24
Mar 2015
↔ ↔ ↔ ↔ B4 0.14 [0.32] AF 0.07 [0.17] DS 0.22 [0.37]
0.58 0.56 0.52
0.75 0.72 0.75
Apr 2015
↔ ↓ ↔ ↔ B4 0.20 [0.39] AF 0.14 [0.32] DS 0.25 [0.39]
1.31 1.26 1.25
1.08 1.07 1.06
May 2015
↔ ↔ ↓ ↑ B4 0.14 [0.32] AF 0.09 [0.21] DS 0.16 [0.48]
2.04 3.56 1.92
1.43 1.74 1.40
Jun 2015
↔ ↔ ↔ ↔ B4 0.10 [0.30] AF 0.05 [0.18] DS 0.07 [0.24]
2.10 2.30 2.25
1.25 1.37 1.38
Jul 2015
↔ ↔ ↔ ↔ B4 0.25 [0.40] AF 0.17 [0.30] DS 0.22 [0.37]
3.28 3.22 3.19
1.58 1.59 1.56
Aug 2015
↔ ↔ ↓ ↔ B4 0.23 [0.42] AF 0.17 [0.35] DS 0.22 [0.42]
1.84 2.00 1.86
0.96 1.19 1.17
Nov 2015
↔ ↔ ↓ ↑ B4 0.26 [0.39] AF 0.30 [0.45] DS 0.36 [0.48]
1.32 2.10 1.06
1.22 1.28 1.21
23
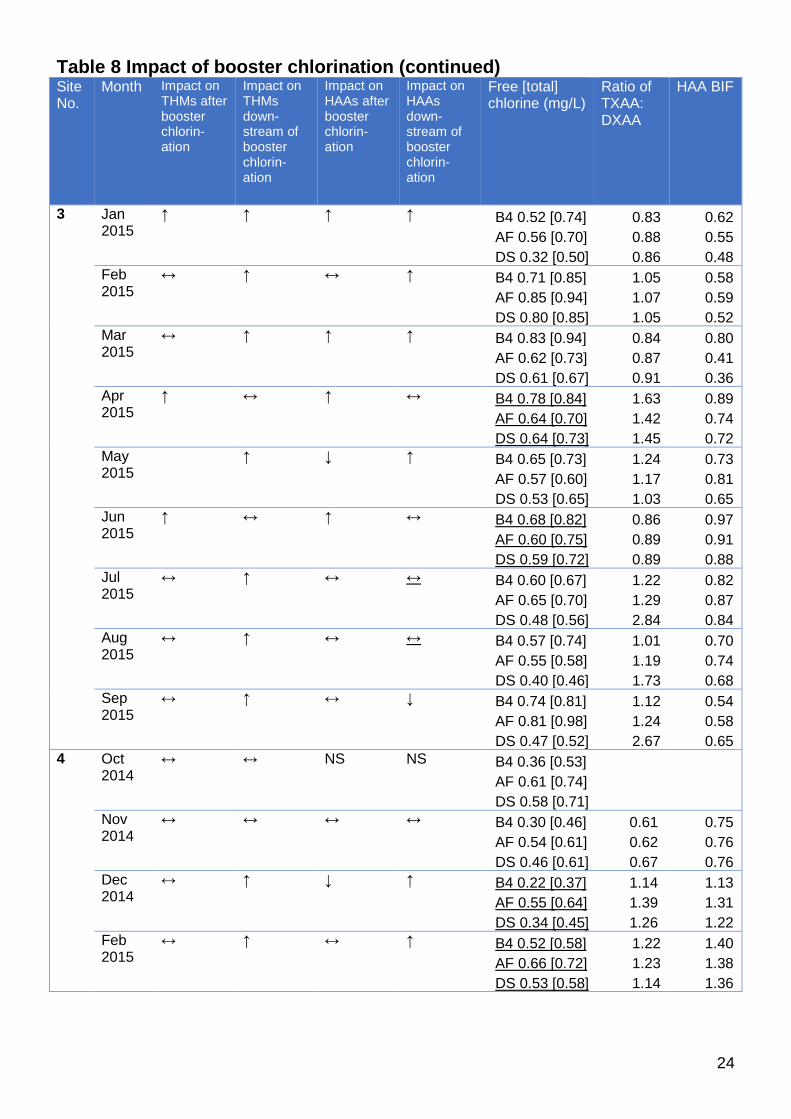
Table 8 Impact of booster chlorination (continued) Site No.
Month Impact on THMs after booster chlorin-ation
Impact on THMs down-stream of booster chlorin-ation
Impact on HAAs after booster chlorin-ation
Impact on HAAs down-stream of booster chlorin-ation
Free [total] chlorine (mg/L)
Ratio of TXAA: DXAA
HAA BIF
3 Jan 2015
↑ ↑ ↑ ↑ B4 0.52 [0.74] AF 0.56 [0.70] DS 0.32 [0.50]
0.83 0.88 0.86
0.62 0.55 0.48
Feb 2015
↔ ↑ ↔ ↑ B4 0.71 [0.85] AF 0.85 [0.94] DS 0.80 [0.85]
1.05 1.07 1.05
0.58 0.59 0.52
Mar 2015
↔ ↑ ↑ ↑ B4 0.83 [0.94] AF 0.62 [0.73] DS 0.61 [0.67]
0.84 0.87 0.91
0.80 0.41 0.36
Apr 2015
↑ ↔ ↑ ↔ B4 0.78 [0.84] AF 0.64 [0.70] DS 0.64 [0.73]
1.63 1.42 1.45
0.89 0.74 0.72
May 2015
↑ ↓ ↑ B4 0.65 [0.73] AF 0.57 [0.60] DS 0.53 [0.65]
1.24 1.17 1.03
0.73 0.81 0.65
Jun 2015
↑ ↔ ↑ ↔ B4 0.68 [0.82] AF 0.60 [0.75] DS 0.59 [0.72]
0.86 0.89 0.89
0.97 0.91 0.88
Jul 2015
↔ ↑ ↔ ↔ B4 0.60 [0.67] AF 0.65 [0.70] DS 0.48 [0.56]
1.22 1.29 2.84
0.82 0.87 0.84
Aug 2015
↔ ↑ ↔ ↔ B4 0.57 [0.74] AF 0.55 [0.58] DS 0.40 [0.46]
1.01 1.19 1.73
0.70 0.74 0.68
Sep 2015
↔ ↑ ↔ ↓ B4 0.74 [0.81] AF 0.81 [0.98] DS 0.47 [0.52]
1.12 1.24 2.67
0.54 0.58 0.65
4 Oct 2014
↔ ↔ NS NS B4 0.36 [0.53] AF 0.61 [0.74] DS 0.58 [0.71]
Nov 2014
↔ ↔ ↔ ↔ B4 0.30 [0.46] AF 0.54 [0.61] DS 0.46 [0.61]
0.61 0.62 0.67
0.75 0.76 0.76
Dec 2014
↔ ↑ ↓ ↑ B4 0.22 [0.37] AF 0.55 [0.64] DS 0.34 [0.45]
1.14 1.39 1.26
1.13 1.31 1.22
Feb 2015
↔ ↑ ↔ ↑ B4 0.52 [0.58] AF 0.66 [0.72] DS 0.53 [0.58]
1.22 1.23 1.14
1.40 1.38 1.36
24
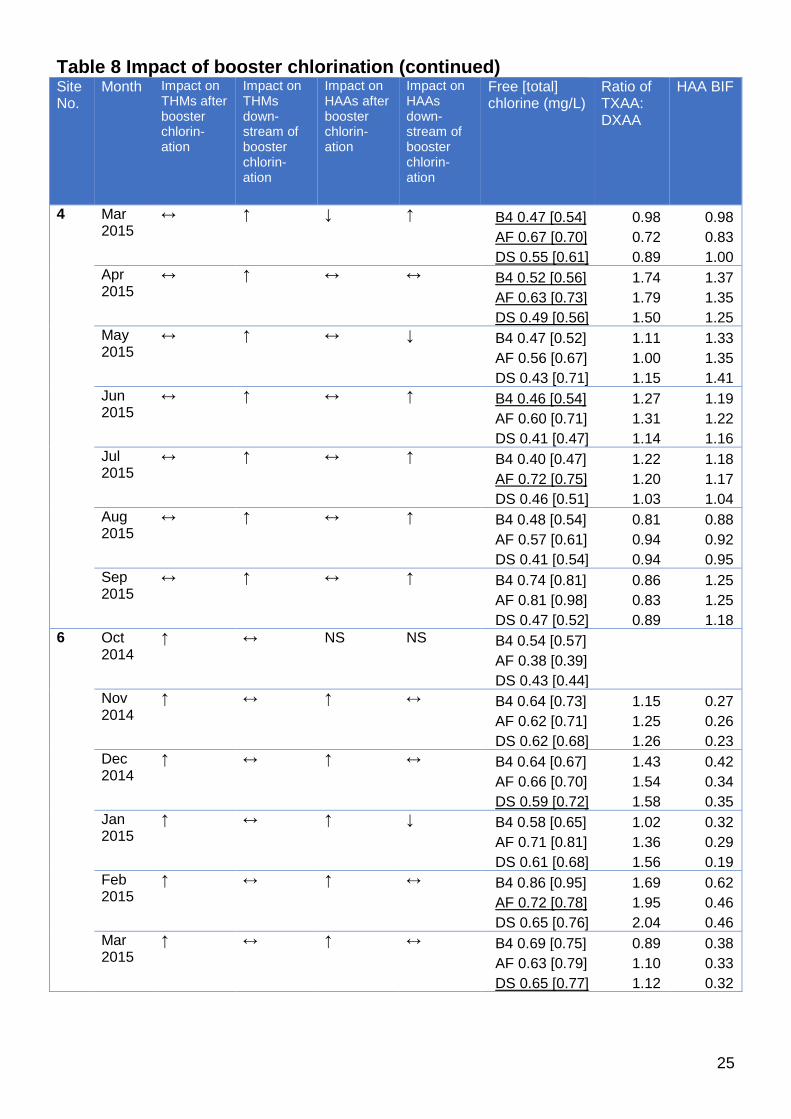
Table 8 Impact of booster chlorination (continued) Site No.
Month Impact on THMs after booster chlorin-ation
Impact on THMs down-stream of booster chlorin-ation
Impact on HAAs after booster chlorin-ation
Impact on HAAs down-stream of booster chlorin-ation
Free [total] chlorine (mg/L)
Ratio of TXAA: DXAA
HAA BIF
4 Mar 2015
↔ ↑ ↓ ↑ B4 0.47 [0.54] AF 0.67 [0.70] DS 0.55 [0.61]
0.98 0.72 0.89
0.98 0.83 1.00
Apr 2015
↔ ↑ ↔ ↔ B4 0.52 [0.56] AF 0.63 [0.73] DS 0.49 [0.56]
1.74 1.79 1.50
1.37 1.35 1.25
May 2015
↔ ↑ ↔ ↓ B4 0.47 [0.52] AF 0.56 [0.67] DS 0.43 [0.71]
1.11 1.00 1.15
1.33 1.35 1.41
Jun 2015
↔ ↑ ↔ ↑ B4 0.46 [0.54] AF 0.60 [0.71] DS 0.41 [0.47]
1.27 1.31 1.14
1.19 1.22 1.16
Jul 2015
↔ ↑ ↔ ↑ B4 0.40 [0.47] AF 0.72 [0.75] DS 0.46 [0.51]
1.22 1.20 1.03
1.18 1.17 1.04
Aug 2015
↔ ↑ ↔ ↑ B4 0.48 [0.54] AF 0.57 [0.61] DS 0.41 [0.54]
0.81 0.94 0.94
0.88 0.92 0.95
Sep 2015
↔ ↑ ↔ ↑ B4 0.74 [0.81] AF 0.81 [0.98] DS 0.47 [0.52]
0.86 0.83 0.89
1.25 1.25 1.18
6 Oct 2014
↑ ↔ NS NS B4 0.54 [0.57] AF 0.38 [0.39] DS 0.43 [0.44]
Nov 2014
↑ ↔ ↑ ↔ B4 0.64 [0.73] AF 0.62 [0.71] DS 0.62 [0.68]
1.15 1.25 1.26
0.27 0.26 0.23
Dec 2014
↑ ↔ ↑ ↔ B4 0.64 [0.67] AF 0.66 [0.70] DS 0.59 [0.72]
1.43 1.54 1.58
0.42 0.34 0.35
Jan 2015
↑ ↔ ↑ ↓ B4 0.58 [0.65] AF 0.71 [0.81] DS 0.61 [0.68]
1.02 1.36 1.56
0.32 0.29 0.19
Feb 2015
↑ ↔ ↑ ↔ B4 0.86 [0.95] AF 0.72 [0.78] DS 0.65 [0.76]
1.69 1.95 2.04
0.62 0.46 0.46
Mar 2015
↑ ↔ ↑ ↔ B4 0.69 [0.75] AF 0.63 [0.79] DS 0.65 [0.77]
0.89 1.10 1.12
0.38 0.33 0.32
25
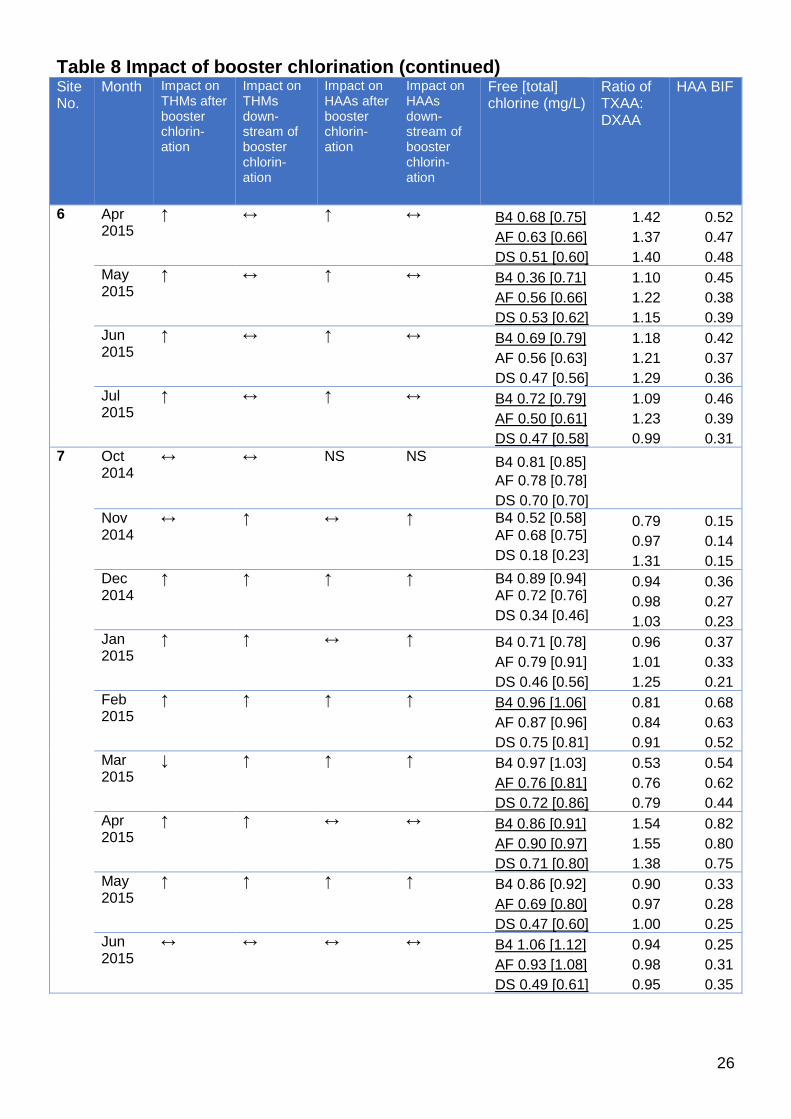
Table 8 Impact of booster chlorination (continued) Site No.
Month Impact on THMs after booster chlorin-ation
Impact on THMs down-stream of booster chlorin-ation
Impact on HAAs after booster chlorin-ation
Impact on HAAs down-stream of booster chlorin-ation
Free [total] chlorine (mg/L)
Ratio of TXAA: DXAA
HAA BIF
6 Apr 2015
↑ ↔ ↑ ↔ B4 0.68 [0.75] AF 0.63 [0.66] DS 0.51 [0.60]
1.42 1.37 1.40
0.52 0.47 0.48
May 2015
↑ ↔ ↑ ↔ B4 0.36 [0.71] AF 0.56 [0.66] DS 0.53 [0.62]
1.10 1.22 1.15
0.45 0.38 0.39
Jun 2015
↑ ↔ ↑ ↔ B4 0.69 [0.79] AF 0.56 [0.63] DS 0.47 [0.56]
1.18 1.21 1.29
0.42 0.37 0.36
Jul 2015
↑ ↔ ↑ ↔ B4 0.72 [0.79] AF 0.50 [0.61] DS 0.47 [0.58]
1.09 1.23 0.99
0.46 0.39 0.31
7 Oct 2014
↔ ↔ NS NS B4 0.81 [0.85] AF 0.78 [0.78] DS 0.70 [0.70]
Nov 2014
↔ ↑ ↔ ↑ B4 0.52 [0.58] AF 0.68 [0.75] DS 0.18 [0.23]
0.79 0.97 1.31
0.15 0.14 0.15
Dec 2014
↑ ↑ ↑ ↑ B4 0.89 [0.94] AF 0.72 [0.76] DS 0.34 [0.46]
0.94 0.98 1.03
0.36 0.27 0.23
Jan 2015
↑ ↑ ↔ ↑ B4 0.71 [0.78] AF 0.79 [0.91] DS 0.46 [0.56]
0.96 1.01 1.25
0.37 0.33 0.21
Feb 2015
↑ ↑ ↑ ↑ B4 0.96 [1.06] AF 0.87 [0.96] DS 0.75 [0.81]
0.81 0.84 0.91
0.68 0.63 0.52
Mar 2015
↓ ↑ ↑ ↑ B4 0.97 [1.03] AF 0.76 [0.81] DS 0.72 [0.86]
0.53 0.76 0.79
0.54 0.62 0.44
Apr 2015
↑ ↑ ↔ ↔ B4 0.86 [0.91] AF 0.90 [0.97] DS 0.71 [0.80]
1.54 1.55 1.38
0.82 0.80 0.75
May 2015
↑ ↑ ↑ ↑ B4 0.86 [0.92] AF 0.69 [0.80] DS 0.47 [0.60]
0.90 0.97 1.00
0.33 0.28 0.25
Jun 2015
↔ ↔ ↔ ↔ B4 1.06 [1.12] AF 0.93 [1.08] DS 0.49 [0.61]
0.94 0.98 0.95
0.25 0.31 0.35
26
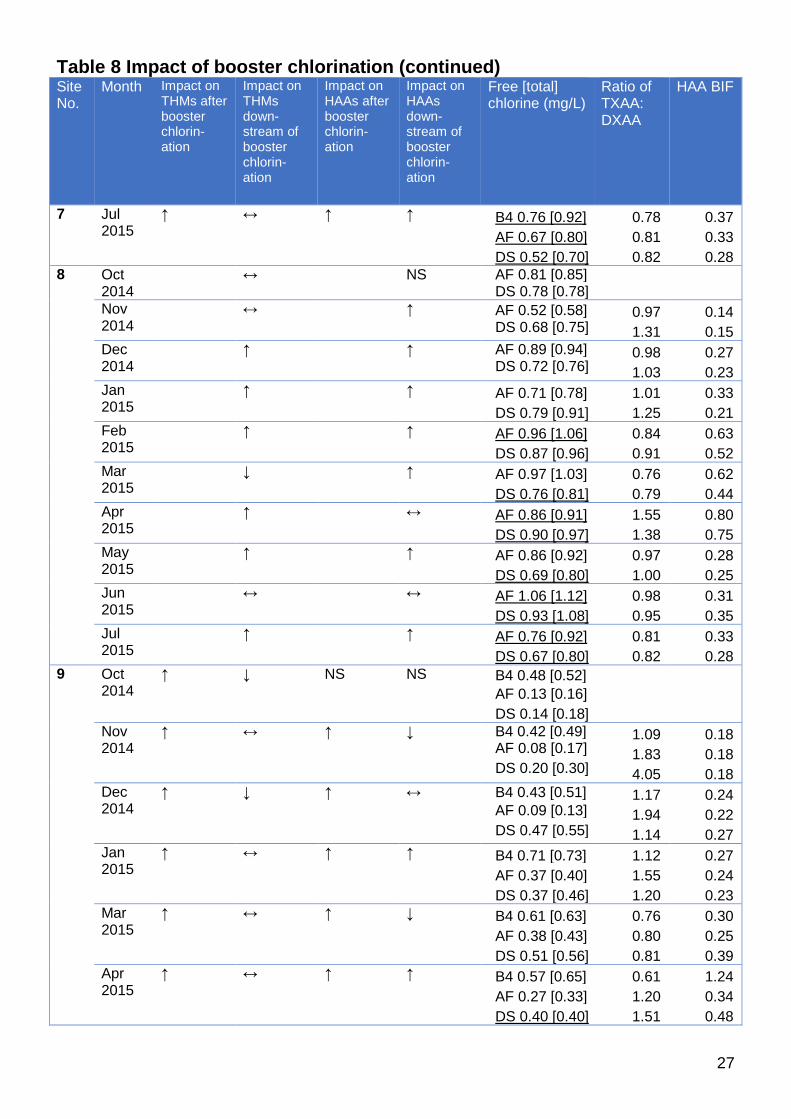
Table 8 Impact of booster chlorination (continued) Site No.
Month Impact on THMs after booster chlorin-ation
Impact on THMs down-stream of booster chlorin-ation
Impact on HAAs after booster chlorin-ation
Impact on HAAs down-stream of booster chlorin-ation
Free [total] chlorine (mg/L)
Ratio of TXAA: DXAA
HAA BIF
7 Jul 2015
↑ ↔ ↑ ↑ B4 0.76 [0.92] AF 0.67 [0.80] DS 0.52 [0.70]
0.78 0.81 0.82
0.37 0.33 0.28
8 Oct 2014
↔ NS AF 0.81 [0.85] DS 0.78 [0.78]
Nov 2014
↔ ↑ AF 0.52 [0.58] DS 0.68 [0.75]
0.97 1.31
0.14 0.15
Dec 2014
↑ ↑ AF 0.89 [0.94] DS 0.72 [0.76]
0.98 1.03
0.27 0.23
Jan 2015
↑ ↑ AF 0.71 [0.78] DS 0.79 [0.91]
1.01 1.25
0.33 0.21
Feb 2015
↑ ↑ AF 0.96 [1.06] DS 0.87 [0.96]
0.84 0.91
0.63 0.52
Mar 2015
↓ ↑ AF 0.97 [1.03] DS 0.76 [0.81]
0.76 0.79
0.62 0.44
Apr 2015
↑ ↔ AF 0.86 [0.91] DS 0.90 [0.97]
1.55 1.38
0.80 0.75
May 2015
↑ ↑ AF 0.86 [0.92] DS 0.69 [0.80]
0.97 1.00
0.28 0.25
Jun 2015
↔ ↔ AF 1.06 [1.12] DS 0.93 [1.08]
0.98 0.95
0.31 0.35
Jul 2015
↑ ↑ AF 0.76 [0.92] DS 0.67 [0.80]
0.81 0.82
0.33 0.28
9 Oct 2014
↑ ↓ NS NS B4 0.48 [0.52] AF 0.13 [0.16] DS 0.14 [0.18]
Nov 2014
↑ ↔ ↑ ↓ B4 0.42 [0.49] AF 0.08 [0.17] DS 0.20 [0.30]
1.09 1.83 4.05
0.18 0.18 0.18
Dec 2014
↑ ↓ ↑ ↔ B4 0.43 [0.51] AF 0.09 [0.13] DS 0.47 [0.55]
1.17 1.94 1.14
0.24 0.22 0.27
Jan 2015
↑ ↔ ↑ ↑ B4 0.71 [0.73] AF 0.37 [0.40] DS 0.37 [0.46]
1.12 1.55 1.20
0.27 0.24 0.23
Mar 2015
↑ ↔ ↑ ↓ B4 0.61 [0.63] AF 0.38 [0.43] DS 0.51 [0.56]
0.76 0.80 0.81
0.30 0.25 0.39
Apr 2015
↑ ↔ ↑ ↑ B4 0.57 [0.65] AF 0.27 [0.33] DS 0.40 [0.40]
0.61 1.20 1.51
1.24 0.34 0.48
27

Table 8 Impact of booster chlorination (continued) Site No.
Month Impact on THMs after booster chlorin-ation
Impact on THMs down-stream of booster chlorin-ation
Impact on HAAs after booster chlorin-ation
Impact on HAAs down-stream of booster chlorin-ation
Free [total] chlorine (mg/L)
Ratio of TXAA: DXAA
HAA BIF
9 May 2015
↑ ↔ ↑ ↔ B4 0.53 [0.63] AF 0.23 [0.31] DS 0.19 [0.24]
1.06 1.06 1.11
0.29 0.28 0.27
Jun 2015
↑ ↓ ↑ ↔ B4 0.44 [0.50] AF 0.20 [0.35] DS 0.32 [0.52]
1.07 1.24 1.25
0.29 0.25 0.37
Jul 2015
↑ ↓ ↓ ↑ B4 0.56 [0.71] AF 0.08 [0.15] DS 0.41 [0.50]
0.82 3.72 0.80
0.22 0.25 0.23
10 Oct 2014
↑ ↓ NS NS B4 0.82 [0.95] AF 0.37 [0.55] DS 0.18 [0.19]
Nov 2014
↔ ↑ ↓ ↑ B4 0.20 [0.33] AF 0.73 [0.96] DS 0.33 [0.48]
2.25 2.33 2.92
0.54 0.56 0.41
Dec 2014
↔ ↑ ↔ ↑ B4 0.08 [0.22] AF 0.83 [0.98] DS 0.41 [0.55]
2.32 2.39 2.28
0.66 0.69 0.51
Jan 2015
↔ ↑ ↔ ↑ B4 0.13 [0.31] AF 0.72 [0.92] DS 0.42 [0.62]
1.95 1.84 1.72
0.50 0.51 0.42
Feb 2015
↔ ↑ ↔ ↑ B4 0.20 [0.34] AF 1.01 [1.20] DS 0.57 [0.85]
1.94 1.88 1.61
0.60 0.62 0.55
Mar 2015
↔ ↑ ↔ ↑ B4 0.28 [0.42] AF 0.56 [0.73] DS 0.35 [0.55]
1.20 1.22 1.20
0.62 0.60 0.54
Apr 2015
↔ ↑ ↔ ↑ B4 0.17 [0.40] AF 0.37 [0.59] DS 0.23 [0.42]
0.89 1.27 1.24
0.76 0.60 0.55
May 2015
↑ ↔ ↔ ↑ B4 0.33 [0.46] AF 0.50 [0.70] DS 0.30 [0.50]
1.03 1.07 1.04
0.61 0.62 0.55
Jun 2015
↑ ↑ ↔ ↔ B4 0.17 [0.39] AF 0.50 [0.69] DS 0.19 [0.37]
1.14 1.20 1.16
0.64 0.65 0.61
Jul 2015
↑ ↑ ↔ ↔ B4 0.17 [0.33] AF 0.33 [0.53] DS 0.20 [0.34]
2.63 3.09 3.02
0.84 0.85 0.81
28
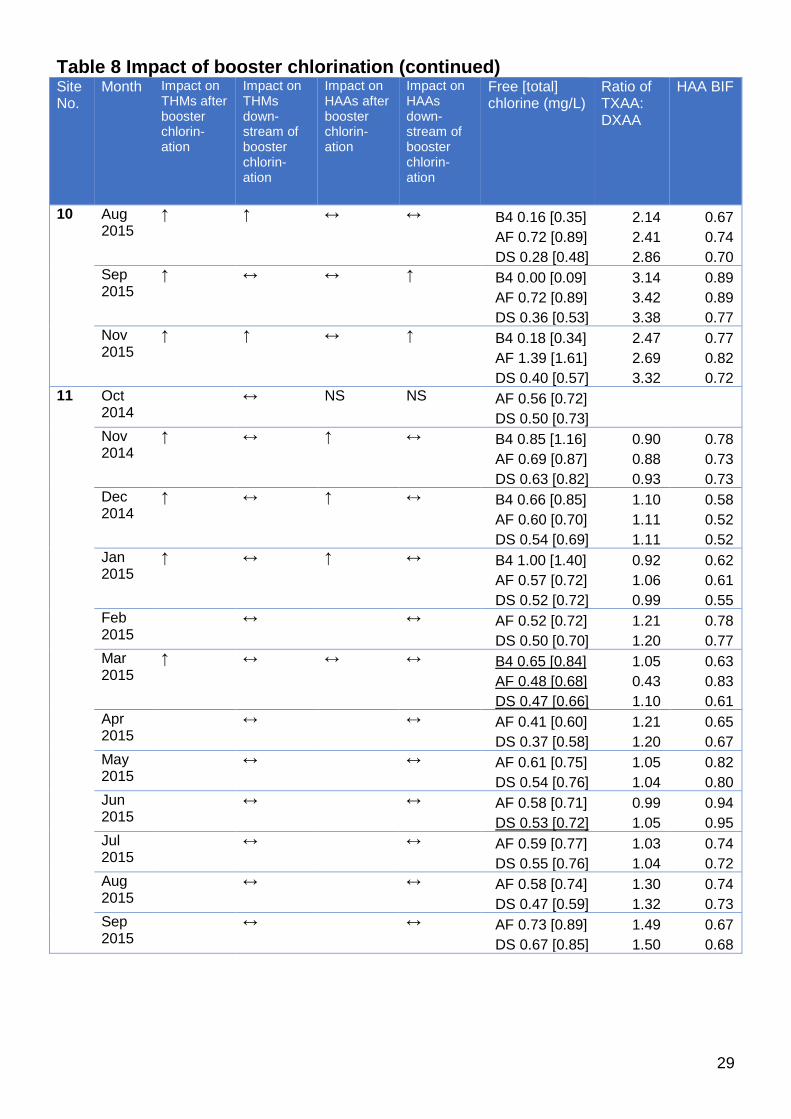
Table 8 Impact of booster chlorination (continued) Site No.
Month Impact on THMs after booster chlorin-ation
Impact on THMs down-stream of booster chlorin-ation
Impact on HAAs after booster chlorin-ation
Impact on HAAs down-stream of booster chlorin-ation
Free [total] chlorine (mg/L)
Ratio of TXAA: DXAA
HAA BIF
10 Aug 2015
↑ ↑ ↔ ↔ B4 0.16 [0.35] AF 0.72 [0.89] DS 0.28 [0.48]
2.14 2.41 2.86
0.67 0.74 0.70
Sep 2015
↑ ↔ ↔ ↑ B4 0.00 [0.09] AF 0.72 [0.89] DS 0.36 [0.53]
3.14 3.42 3.38
0.89 0.89 0.77
Nov 2015
↑ ↑ ↔ ↑ B4 0.18 [0.34] AF 1.39 [1.61] DS 0.40 [0.57]
2.47 2.69 3.32
0.77 0.82 0.72
11 Oct 2014
↔ NS NS AF 0.56 [0.72] DS 0.50 [0.73]
Nov 2014
↑ ↔ ↑ ↔ B4 0.85 [1.16] AF 0.69 [0.87] DS 0.63 [0.82]
0.90 0.88 0.93
0.78 0.73 0.73
Dec 2014
↑ ↔ ↑ ↔ B4 0.66 [0.85] AF 0.60 [0.70] DS 0.54 [0.69]
1.10 1.11 1.11
0.58 0.52 0.52
Jan 2015
↑ ↔ ↑ ↔ B4 1.00 [1.40] AF 0.57 [0.72] DS 0.52 [0.72]
0.92 1.06 0.99
0.62 0.61 0.55
Feb 2015
↔ ↔ AF 0.52 [0.72] DS 0.50 [0.70]
1.21 1.20
0.78 0.77
Mar 2015
↑ ↔ ↔ ↔ B4 0.65 [0.84] AF 0.48 [0.68] DS 0.47 [0.66]
1.05 0.43 1.10
0.63 0.83 0.61
Apr 2015
↔ ↔ AF 0.41 [0.60] DS 0.37 [0.58]
1.21 1.20
0.65 0.67
May 2015
↔ ↔ AF 0.61 [0.75] DS 0.54 [0.76]
1.05 1.04
0.82 0.80
Jun 2015
↔ ↔ AF 0.58 [0.71] DS 0.53 [0.72]
0.99 1.05
0.94 0.95
Jul 2015
↔ ↔ AF 0.59 [0.77] DS 0.55 [0.76]
1.03 1.04
0.74 0.72
Aug 2015
↔ ↔ AF 0.58 [0.74] DS 0.47 [0.59]
1.30 1.32
0.74 0.73
Sep 2015
↔ ↔ AF 0.73 [0.89] DS 0.67 [0.85]
1.49 1.50
0.67 0.68
29
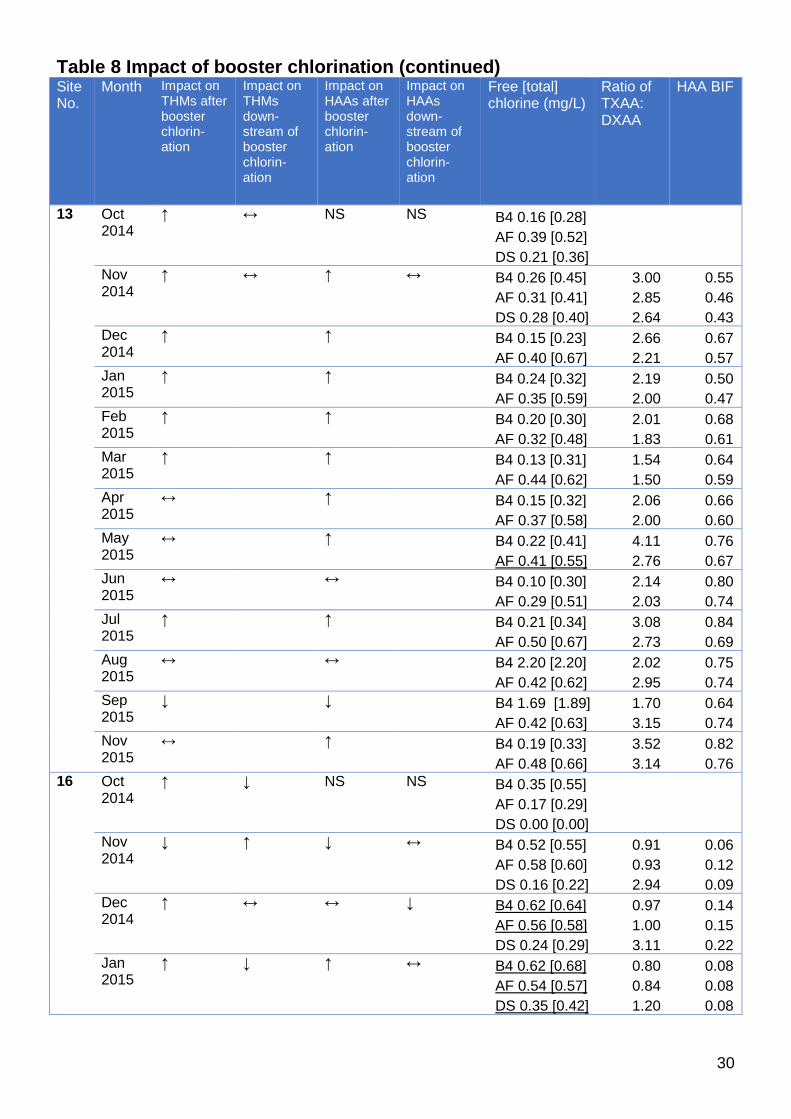
Table 8 Impact of booster chlorination (continued) Site No.
Month Impact on THMs after booster chlorin-ation
Impact on THMs down-stream of booster chlorin-ation
Impact on HAAs after booster chlorin-ation
Impact on HAAs down-stream of booster chlorin-ation
Free [total] chlorine (mg/L)
Ratio of TXAA: DXAA
HAA BIF
13 Oct 2014
↑ ↔ NS NS B4 0.16 [0.28] AF 0.39 [0.52] DS 0.21 [0.36]
Nov 2014
↑ ↔ ↑ ↔ B4 0.26 [0.45] AF 0.31 [0.41] DS 0.28 [0.40]
3.00 2.85 2.64
0.55 0.46 0.43
Dec 2014
↑ ↑ B4 0.15 [0.23] AF 0.40 [0.67]
2.66 2.21
0.67 0.57
Jan 2015
↑ ↑ B4 0.24 [0.32] AF 0.35 [0.59]
2.19 2.00
0.50 0.47
Feb 2015
↑ ↑ B4 0.20 [0.30] AF 0.32 [0.48]
2.01 1.83
0.68 0.61
Mar 2015
↑ ↑ B4 0.13 [0.31] AF 0.44 [0.62]
1.54 1.50
0.64 0.59
Apr 2015
↔ ↑ B4 0.15 [0.32] AF 0.37 [0.58]
2.06 2.00
0.66 0.60
May 2015
↔ ↑ B4 0.22 [0.41] AF 0.41 [0.55]
4.11 2.76
0.76 0.67
Jun 2015
↔ ↔ B4 0.10 [0.30] AF 0.29 [0.51]
2.14 2.03
0.80 0.74
Jul 2015
↑ ↑ B4 0.21 [0.34] AF 0.50 [0.67]
3.08 2.73
0.84 0.69
Aug 2015
↔ ↔ B4 2.20 [2.20] AF 0.42 [0.62]
2.02 2.95
0.75 0.74
Sep 2015
↓ ↓ B4 1.69 [1.89] AF 0.42 [0.63]
1.70 3.15
0.64 0.74
Nov 2015
↔ ↑ B4 0.19 [0.33] AF 0.48 [0.66]
3.52 3.14
0.82 0.76
16 Oct 2014
↑ ↓ NS NS B4 0.35 [0.55] AF 0.17 [0.29] DS 0.00 [0.00]
Nov 2014
↓ ↑ ↓ ↔ B4 0.52 [0.55] AF 0.58 [0.60] DS 0.16 [0.22]
0.91 0.93 2.94
0.06 0.12 0.09
Dec 2014
↑ ↔ ↔ ↓ B4 0.62 [0.64] AF 0.56 [0.58] DS 0.24 [0.29]
0.97 1.00 3.11
0.14 0.15 0.22
Jan 2015
↑ ↓ ↑ ↔ B4 0.62 [0.68] AF 0.54 [0.57] DS 0.35 [0.42]
0.80 0.84 1.20
0.08 0.08 0.08
30
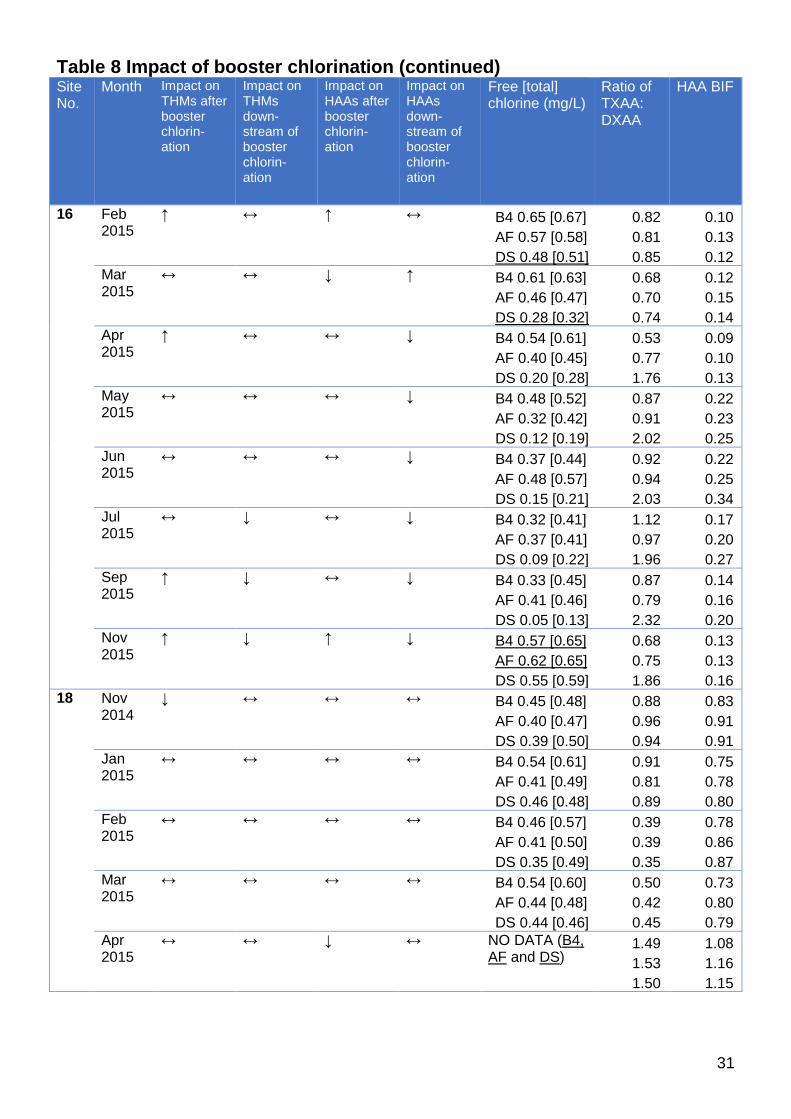
Table 8 Impact of booster chlorination (continued) Site No.
Month Impact on THMs after booster chlorin-ation
Impact on THMs down-stream of booster chlorin-ation
Impact on HAAs after booster chlorin-ation
Impact on HAAs down-stream of booster chlorin-ation
Free [total] chlorine (mg/L)
Ratio of TXAA: DXAA
HAA BIF
16 Feb 2015
↑ ↔ ↑ ↔ B4 0.65 [0.67] AF 0.57 [0.58] DS 0.48 [0.51]
0.82 0.81 0.85
0.10 0.13 0.12
Mar 2015
↔ ↔ ↓ ↑ B4 0.61 [0.63] AF 0.46 [0.47] DS 0.28 [0.32]
0.68 0.70 0.74
0.12 0.15 0.14
Apr 2015
↑ ↔ ↔ ↓ B4 0.54 [0.61] AF 0.40 [0.45] DS 0.20 [0.28]
0.53 0.77 1.76
0.09 0.10 0.13
May 2015
↔ ↔ ↔ ↓ B4 0.48 [0.52] AF 0.32 [0.42] DS 0.12 [0.19]
0.87 0.91 2.02
0.22 0.23 0.25
Jun 2015
↔ ↔ ↔ ↓ B4 0.37 [0.44] AF 0.48 [0.57] DS 0.15 [0.21]
0.92 0.94 2.03
0.22 0.25 0.34
Jul 2015
↔ ↓ ↔ ↓ B4 0.32 [0.41] AF 0.37 [0.41] DS 0.09 [0.22]
1.12 0.97 1.96
0.17 0.20 0.27
Sep 2015
↑ ↓ ↔ ↓ B4 0.33 [0.45] AF 0.41 [0.46] DS 0.05 [0.13]
0.87 0.79 2.32
0.14 0.16 0.20
Nov 2015
↑ ↓ ↑ ↓ B4 0.57 [0.65] AF 0.62 [0.65] DS 0.55 [0.59]
0.68 0.75 1.86
0.13 0.13 0.16
18 Nov 2014
↓ ↔ ↔ ↔ B4 0.45 [0.48] AF 0.40 [0.47] DS 0.39 [0.50]
0.88 0.96 0.94
0.83 0.91 0.91
Jan 2015
↔ ↔ ↔ ↔ B4 0.54 [0.61] AF 0.41 [0.49] DS 0.46 [0.48]
0.91 0.81 0.89
0.75 0.78 0.80
Feb 2015
↔ ↔ ↔ ↔ B4 0.46 [0.57] AF 0.41 [0.50] DS 0.35 [0.49]
0.39 0.39 0.35
0.78 0.86 0.87
Mar 2015
↔ ↔ ↔ ↔ B4 0.54 [0.60] AF 0.44 [0.48] DS 0.44 [0.46]
0.50 0.42 0.45
0.73 0.80 0.79
Apr 2015
↔ ↔ ↓ ↔ NO DATA (B4, AF and DS)
1.49 1.53 1.50
1.08 1.16 1.15
31

Table 8 Impact of booster chlorination (continued) Site No.
Month Impact on THMs after booster chlorin-ation
Impact on THMs down-stream of booster chlorin-ation
Impact on HAAs after booster chlorin-ation
Impact on HAAs down-stream of booster chlorin-ation
Free [total] chlorine (mg/L)
Ratio of TXAA: DXAA
HAA BIF
18 May 2015
↔ ↓ ↔ ↔ B4 0.40 [0.44] AF 0.28 [0.33] DS 0.32 [0.39]
1.19 1.25 1.22
1.26 1.39 1.42
Jun 2015
↔ ↔ ↔ ↔ B4 0.38 [0.43] AF 0.31 [0.35] DS 0.33 [0.39]
0.95 1.06 1.08
0.96 1.06 1.05
Jul 2015
↓ ↑ ↓ ↔ B4 0.31 [0.37] AF 0.23 [0.27] DS 0.28 [0.31]
1.49 2.20 2.22
1.20 1.45 1.45
Sep 2015
↓ ↔ ↔ ↔ B4 0.33 [0.37] AF 0.26 [0.32] DS 0.29 [0.33]
3.88 3.15 3.10
1.62 1.66 1.87
19 Oct 2014
↑ ↔ NS NS B4 0.44 [0.56] AF 0.26 [0.37] DS 0.49 [0.59]
Nov 2014
↑ ↔ ↑ ↔ B4 0.60 [0.71] AF 0.95 [1.12] DS 0.24 [0.29]
0.67 0.83 0.88
1.07 0.89 0.84
Jan 2015
↓ ↑ ↓ ↑ B4 0.42 [0.47] AF 0.51 [0.58] DS 0.41 [0.46]
0.97 0.98 0.96
0.80 0.84 0.75
Feb 2015
↓ ↑ ↓ ↑ B4 0.45 [0.52] AF 0.51 [0.59] DS 0.48 [0.56]
0.37 0.20 0.41
0.79 0.86 0.73
Mar 2015
↔ ↑ ↔ ↔ B4 0.49 [0.56] AF 0.57 [0.63] DS 0.48 [0.54]
0.41 0.41 0.57
0.73 0.74 0.70
Apr 2015
↑ ↑ NO DATA (B4 and DS)
1.67 1.68
1.17 1.08
May 2015
↔ ↑ ↑ ↓ B4 0.47 [0.53] AF 0.57 [0.65] DS 0.44 [0.51]
1.40 1.25 1.86
1.45 1.33 1.41
Jun 2015
↑ ↔ ↑ ↔ B4 0.46 [0.49] AF 0.47 [0.52] DS 0.39 [0.44]
0.99 0.93 0.94
1.19 1.02 0.99
Jul 2015
↑ ↑ ↔ ↓ B4 0.47 [0.52] AF 0.56 [0.59] DS 0.43 [0.48]
1.27 1.16 0.91
1.24 1.17 0.99
Sep 2015
↔ ↔ ↑ ↔ B4 0.47 [0.52] AF 0.51 [0.58] DS 0.36 [0.41]
1.23 1.05 1.03
1.32 1.20 1.16
32
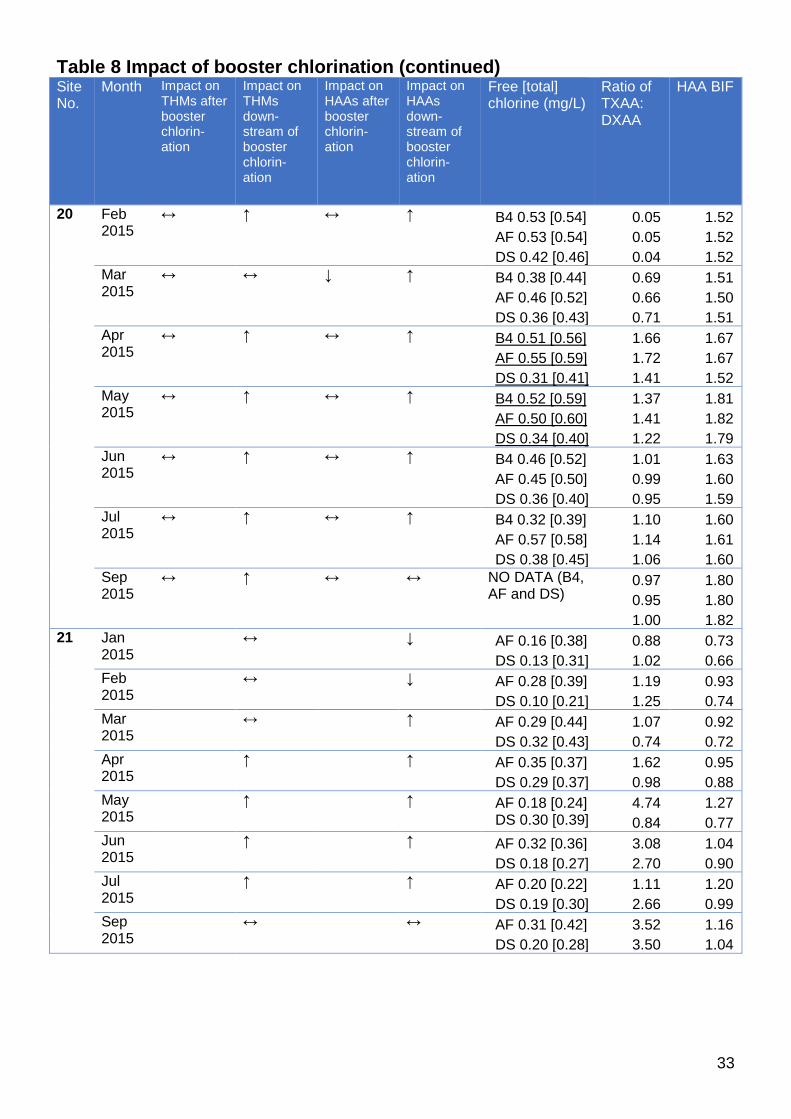
Table 8 Impact of booster chlorination (continued) Site No.
Month Impact on THMs after booster chlorin-ation
Impact on THMs down-stream of booster chlorin-ation
Impact on HAAs after booster chlorin-ation
Impact on HAAs down-stream of booster chlorin-ation
Free [total] chlorine (mg/L)
Ratio of TXAA: DXAA
HAA BIF
20 Feb 2015
↔ ↑ ↔ ↑ B4 0.53 [0.54] AF 0.53 [0.54] DS 0.42 [0.46]
0.05 0.05 0.04
1.52 1.52 1.52
Mar 2015
↔ ↔ ↓ ↑ B4 0.38 [0.44] AF 0.46 [0.52] DS 0.36 [0.43]
0.69 0.66 0.71
1.51 1.50 1.51
Apr 2015
↔ ↑ ↔ ↑ B4 0.51 [0.56] AF 0.55 [0.59] DS 0.31 [0.41]
1.66 1.72 1.41
1.67 1.67 1.52
May 2015
↔ ↑ ↔ ↑ B4 0.52 [0.59] AF 0.50 [0.60] DS 0.34 [0.40]
1.37 1.41 1.22
1.81 1.82 1.79
Jun 2015
↔ ↑ ↔ ↑ B4 0.46 [0.52] AF 0.45 [0.50] DS 0.36 [0.40]
1.01 0.99 0.95
1.63 1.60 1.59
Jul 2015
↔ ↑ ↔ ↑ B4 0.32 [0.39] AF 0.57 [0.58] DS 0.38 [0.45]
1.10 1.14 1.06
1.60 1.61 1.60
Sep 2015
↔ ↑ ↔ ↔ NO DATA (B4, AF and DS)
0.97 0.95 1.00
1.80 1.80 1.82
21 Jan 2015
↔ ↓ AF 0.16 [0.38] DS 0.13 [0.31]
0.88 1.02
0.73 0.66
Feb 2015
↔ ↓ AF 0.28 [0.39] DS 0.10 [0.21]
1.19 1.25
0.93 0.74
Mar 2015
↔ ↑ AF 0.29 [0.44] DS 0.32 [0.43]
1.07 0.74
0.92 0.72
Apr 2015
↑ ↑ AF 0.35 [0.37] DS 0.29 [0.37]
1.62 0.98
0.95 0.88
May 2015
↑ ↑ AF 0.18 [0.24] DS 0.30 [0.39]
4.74 0.84
1.27 0.77
Jun 2015
↑ ↑ AF 0.32 [0.36] DS 0.18 [0.27]
3.08 2.70
1.04 0.90
Jul 2015
↑ ↑ AF 0.20 [0.22] DS 0.19 [0.30]
1.11 2.66
1.20 0.99
Sep 2015
↔ ↔ AF 0.31 [0.42] DS 0.20 [0.28]
3.52 3.50
1.16 1.04
33
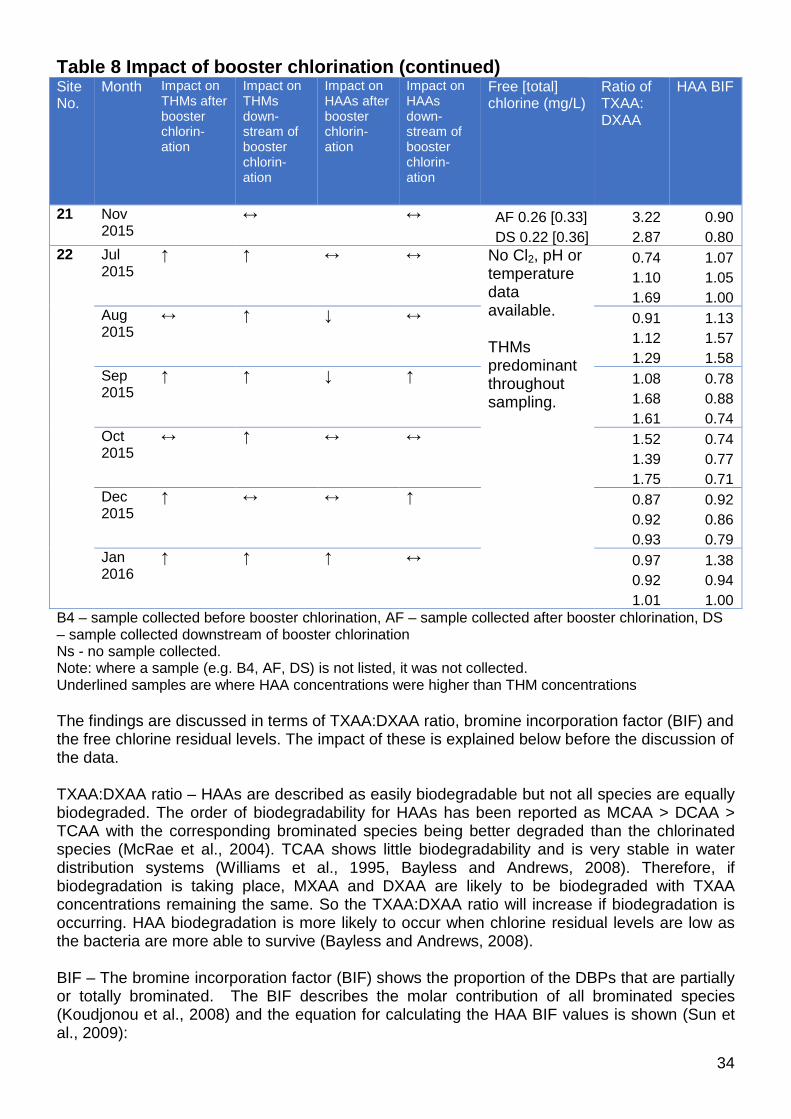
Table 8 Impact of booster chlorination (continued) Site No.
Month Impact on THMs after booster chlorin-ation
Impact on THMs down-stream of booster chlorin-ation
Impact on HAAs after booster chlorin-ation
Impact on HAAs down-stream of booster chlorin-ation
Free [total] chlorine (mg/L)
Ratio of TXAA: DXAA
HAA BIF
21 Nov 2015
↔ ↔ AF 0.26 [0.33] DS 0.22 [0.36]
3.22 2.87
0.90 0.80
22 Jul 2015
↑ ↑ ↔ ↔ No Cl2, pH or temperature data available. THMs predominant throughout sampling.
0.74 1.10 1.69
1.07 1.05 1.00
Aug 2015
↔ ↑ ↓ ↔ 0.91 1.12 1.29
1.13 1.57 1.58
Sep 2015
↑ ↑ ↓ ↑ 1.08 1.68 1.61
0.78 0.88 0.74
Oct 2015
↔ ↑ ↔ ↔ 1.52 1.39 1.75
0.74 0.77 0.71
Dec 2015
↑ ↔ ↔ ↑ 0.87 0.92 0.93
0.92 0.86 0.79
Jan 2016
↑ ↑ ↑ ↔ 0.97 0.92 1.01
1.38 0.94 1.00
B4 – sample collected before booster chlorination, AF – sample collected after booster chlorination, DS – sample collected downstream of booster chlorination Ns - no sample collected. Note: where a sample (e.g. B4, AF, DS) is not listed, it was not collected. Underlined samples are where HAA concentrations were higher than THM concentrations The findings are discussed in terms of TXAA:DXAA ratio, bromine incorporation factor (BIF) and the free chlorine residual levels. The impact of these is explained below before the discussion of the data. TXAA:DXAA ratio – HAAs are described as easily biodegradable but not all species are equally biodegraded. The order of biodegradability for HAAs has been reported as MCAA > DCAA > TCAA with the corresponding brominated species being better degraded than the chlorinated species (McRae et al., 2004). TCAA shows little biodegradability and is very stable in water distribution systems (Williams et al., 1995, Bayless and Andrews, 2008). Therefore, if biodegradation is taking place, MXAA and DXAA are likely to be biodegraded with TXAA concentrations remaining the same. So the TXAA:DXAA ratio will increase if biodegradation is occurring. HAA biodegradation is more likely to occur when chlorine residual levels are low as the bacteria are more able to survive (Bayless and Andrews, 2008). BIF – The bromine incorporation factor (BIF) shows the proportion of the DBPs that are partially or totally brominated. The BIF describes the molar contribution of all brominated species (Koudjonou et al., 2008) and the equation for calculating the HAA BIF values is shown (Sun et al., 2009):
34
BIF (HAAs) = ]9[
][3][2][1][2][1][1HAA
TBAADBCAABDCAADBAABCAAMBAA ×+×+×+×+×+×
The BIF can range from 0 (no brominated species) to 3 (purely TBAA). An increase in BIF means that more brominated species are present as a mole fraction of the total HAAs. A decrease in BIF means that less brominated species are present as a mole fraction of the total HAAs. Typically, expected behaviour after booster chlorination (an increase in chlorine) would be an increase in chlorinated HAA species, particularly TXAAs. This would be coupled with a decrease in BIF. If an increase is observed, this could represent preferential degradation of chlorinated HAAs or perhaps inadequate chlorination concentrations. The findings for each site are presented individually but a summary of findings is presented first. Summary of findings When free chlorine concentrations were low (≤ 0.3 mg/L), levels of THMs and HAAs were stable or slightly increased after booster chlorination by up to 10.42% and <10% respectively when comparing the means. The increase was not statistically significant at the 95% level. At these low chlorine concentrations there is also evidence of degradation with a shift to TXAAs and an increase in BIF caused by a reduction in DXAA, particularly those that are chlorinated. The chlorinated DXAAs have been shown to be the easiest to biodegrade. The levels of THMs and HAAs were often stable due to the low free chlorine residual concentrations. At medium chlorine concentrations (0.3 – 0.7 mg/L), the increase in THMs and HAAs is greater (16.68% and 12.72% respectively) and this increase is significant for THMs (t = 2.251, p = 0.0258) but not for HAAs at the 95% confidence level. At high chlorine concentrations (>0.7 mg/L) the difference in THMs (increase of 13.42%) and HAAs (<10% change) was not significant at the 95% confidence level. Although there can be no difference in overall HAA concentrations, it is possible to determine whether there is evidence for bacterial degradation by looking at the speciation of the HAAs and their incorporation of bromine. An increase in the TXAA:DXAA ratio and an increase in the HAA BIF coupled with no increase in the HAA concentration overall can indicate biological or bacterial degradation of HAAs, particularly the dihalogenated HAAs. Here there was no evidence of bacterial degradation at 10 out of the 16 sites. Where there was evidence of bacterial degradation, this was sporadic and occurred on one or two occasions during the sampling period where between 6 and 12 sampling events took place. The overall results for all sites are compared in terms of the impact of booster chlorination on THM and HAA levels (Figure 1). The figure shows box-whisker plots with the median indicated by the small square and the top and bottom of the surrounding box indicating the 75th and 25th percentile of the dataset respectively. The whisker ends indicate the minimum and maximum values observed. The THM and HAA medians show a slight increase in concentration after and downstream of booster chlorination.
35
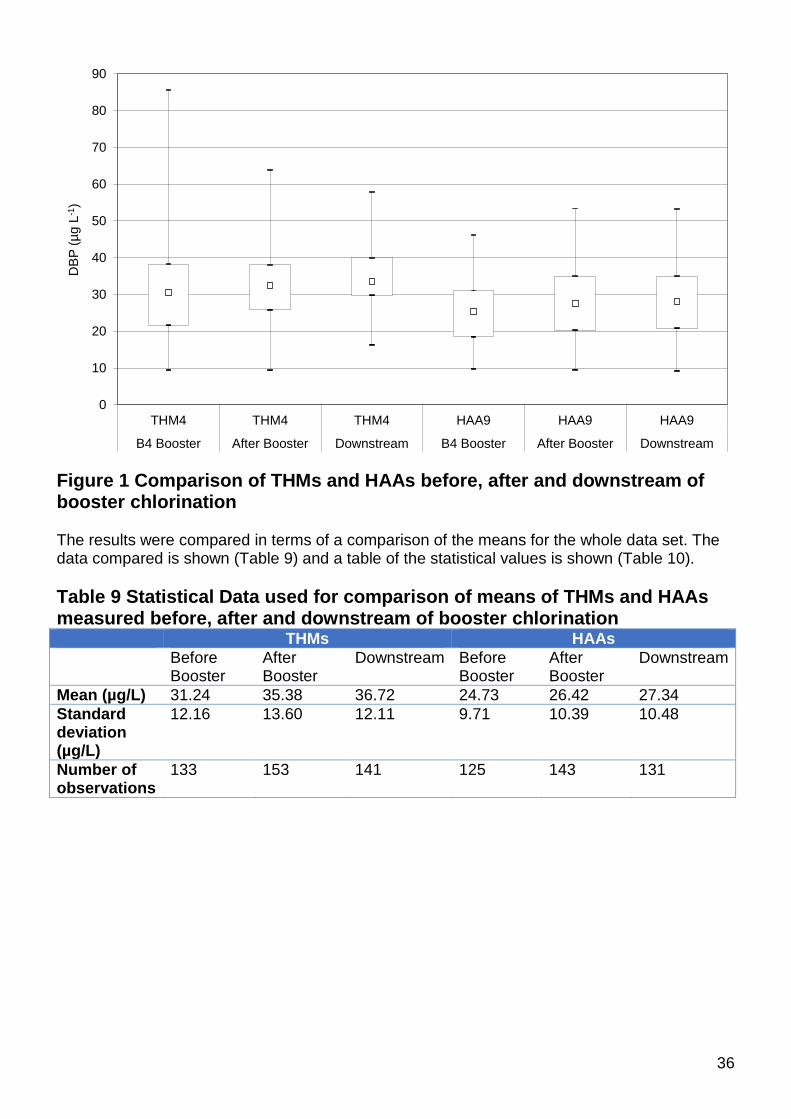
Figure 1 Comparison of THMs and HAAs before, after and downstream of booster chlorination The results were compared in terms of a comparison of the means for the whole data set. The data compared is shown (Table 9) and a table of the statistical values is shown (Table 10). Table 9 Statistical Data used for comparison of means of THMs and HAAs measured before, after and downstream of booster chlorination THMs HAAs Before
Booster After Booster
Downstream Before Booster
After Booster
Downstream
Mean (µg/L) 31.24 35.38 36.72 24.73 26.42 27.34 Standard deviation (µg/L)
12.16 13.60 12.11 9.71 10.39 10.48
Number of observations
133 153 141 125 143 131
0
10
20
30
40
50
60
70
80
90
THM4 THM4 THM4 HAA9 HAA9 HAA9
B4 Booster After Booster Downstream B4 Booster After Booster Downstream
DB
P (µ
g L-
1 )
36
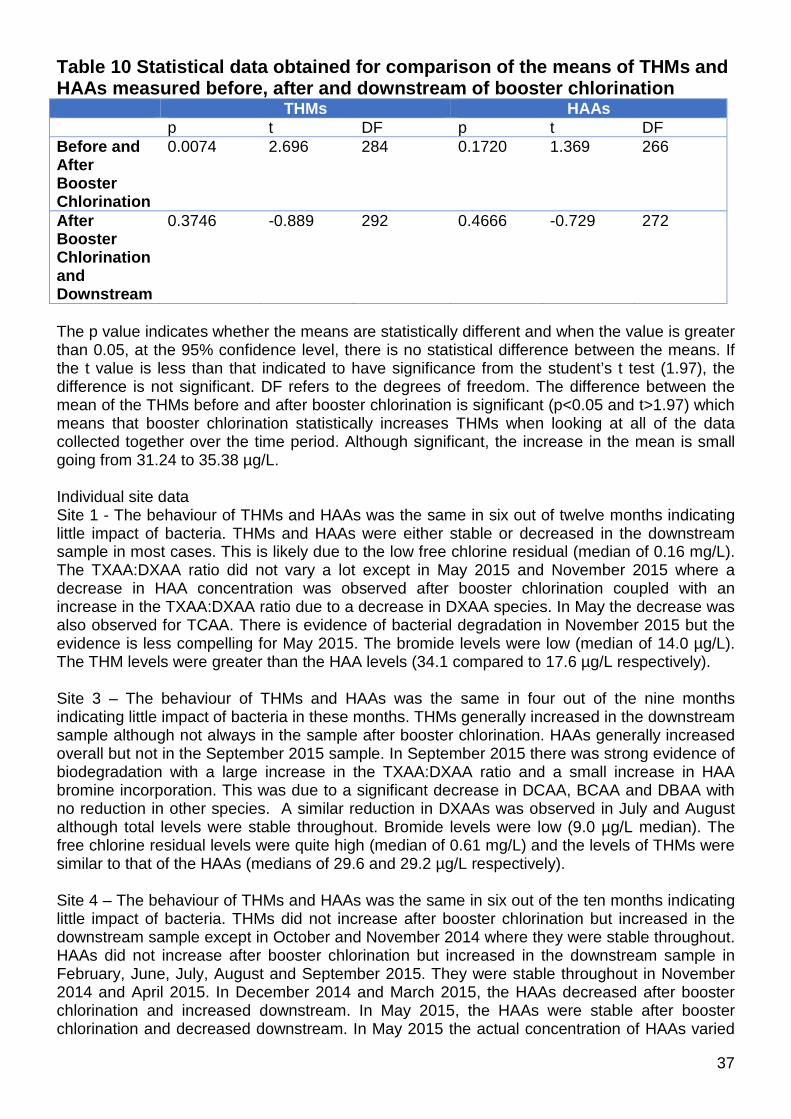
Table 10 Statistical data obtained for comparison of the means of THMs and HAAs measured before, after and downstream of booster chlorination THMs HAAs p t DF p t DF Before and After Booster Chlorination
0.0074 2.696 284 0.1720 1.369 266
After Booster Chlorination and Downstream
0.3746 -0.889 292 0.4666 -0.729 272
The p value indicates whether the means are statistically different and when the value is greater than 0.05, at the 95% confidence level, there is no statistical difference between the means. If the t value is less than that indicated to have significance from the student’s t test (1.97), the difference is not significant. DF refers to the degrees of freedom. The difference between the mean of the THMs before and after booster chlorination is significant (p<0.05 and t>1.97) which means that booster chlorination statistically increases THMs when looking at all of the data collected together over the time period. Although significant, the increase in the mean is small going from 31.24 to 35.38 µg/L. Individual site data Site 1 - The behaviour of THMs and HAAs was the same in six out of twelve months indicating little impact of bacteria. THMs and HAAs were either stable or decreased in the downstream sample in most cases. This is likely due to the low free chlorine residual (median of 0.16 mg/L). The TXAA:DXAA ratio did not vary a lot except in May 2015 and November 2015 where a decrease in HAA concentration was observed after booster chlorination coupled with an increase in the TXAA:DXAA ratio due to a decrease in DXAA species. In May the decrease was also observed for TCAA. There is evidence of bacterial degradation in November 2015 but the evidence is less compelling for May 2015. The bromide levels were low (median of 14.0 µg/L). The THM levels were greater than the HAA levels (34.1 compared to 17.6 µg/L respectively). Site 3 – The behaviour of THMs and HAAs was the same in four out of the nine months indicating little impact of bacteria in these months. THMs generally increased in the downstream sample although not always in the sample after booster chlorination. HAAs generally increased overall but not in the September 2015 sample. In September 2015 there was strong evidence of biodegradation with a large increase in the TXAA:DXAA ratio and a small increase in HAA bromine incorporation. This was due to a significant decrease in DCAA, BCAA and DBAA with no reduction in other species. A similar reduction in DXAAs was observed in July and August although total levels were stable throughout. Bromide levels were low (9.0 µg/L median). The free chlorine residual levels were quite high (median of 0.61 mg/L) and the levels of THMs were similar to that of the HAAs (medians of 29.6 and 29.2 µg/L respectively). Site 4 – The behaviour of THMs and HAAs was the same in six out of the ten months indicating little impact of bacteria. THMs did not increase after booster chlorination but increased in the downstream sample except in October and November 2014 where they were stable throughout. HAAs did not increase after booster chlorination but increased in the downstream sample in February, June, July, August and September 2015. They were stable throughout in November 2014 and April 2015. In December 2014 and March 2015, the HAAs decreased after booster chlorination and increased downstream. In May 2015, the HAAs were stable after booster chlorination and decreased downstream. In May 2015 the actual concentration of HAAs varied
37
from 14 to 15.1 to 13.1 so although the variation was more than 10% in the downstream value the change in speciation was not big and there was no indication of degradation. Unusually there was no TCAA detected in the May 2015 samples although the free chlorine levels were similar to all of the other months the bromide levels were at the high end of the range measured (22 µg/L compared to the median of 17.5 µg/L). The free chlorine residual levels were medium (median of 0.49 mg/L) and the levels of THMs were similar to that of the HAAs (medians of 20.0 and 20.1 µg/L respectively). The TXAA:DXAA did not vary a lot after booster chlorination or in the downstream sample and the change in species was very small (generally less than 0.5 µg/L). The BIF did vary a little but this did not translate to significant changes in any species. There was no evidence of HAA degradation. Site 6 - The behaviour of THMs and HAAs was the same in all but one month indicating little impact of bacteria. THMs and HAAs increased after booster chlorination and were stable in the downstream sample in most cases. The free chlorine residual levels were higher than observed from the historical data when categorising the sites (median of 0.74 mg/L) and the levels of THMs was similar to that of the HAAs (medians of 33.9 and 33.1 µg/L respectively). The TXAA:DXAA ratio increased after booster chlorination and often again in the downstream sample with an increase or shift to TXAAs with the BIF correspondingly decreasing. There was no evidence of HAA degradation and the high levels of residual free chlorine may have suppressed any biological activity. The levels of bromide were low in these samples (range of 3-5 with a median of 3 µg/L as bromide). Site 7 - The behaviour of THMs and HAAs was the same in five out of ten months indicating little impact of bacteria in those months. THMs and HAAs generally increased after booster chlorination and continued to increase or were stable in the downstream sample. The free chlorine residual levels were higher than expected given the historical data (median of 0.62 mg/L) and the levels of THMs was similar to that of the HAAs (medians of 29.5 and 28.5 µg/L respectively). The TXAA:DXAA ratio increased after booster chlorination and often again in the downstream sample with an increase or shift to TXAAs with the BIF correspondingly decreasing. There was very little bromide present in the samples (3-7 with a median of 5 µg/L as bromide). There was no evidence of HAA degradation. Site 8 – For this site only AF and DS samples were collected. The behaviour of THMs and HAAs was largely the same showing an increase in the downstream sample compared to after booster chlorination with the exception of November 2014, March and April 2015 indicating little impact of bacteria. In November 2014, THMs stayed stable while HAAs increased after booster chlorination and downstream. In March 2015, THMs actually decreased in the downstream sample whereas HAAs increased. This is somewhat unusual and has not been recognised as typical behaviour in the literature. In April 2015, THMs increased in the downstream sample and HAAs remained stable. The free chlorine residual levels were high (median of 0.80 mg/L) and the levels of THMs was similar to that of the HAAs (medians of 32.1 and 33.0 µg/L respectively). The TXAA:DXAA either increased (November 2014, January 2015), decreased (April 2015) but mainly did not vary a lot in the downstream sample. The BIF decreased did not vary a lot except in January, February and March where it decreased due to an increase in chlorinated species. There was no evidence of HAA degradation. Site 9 - The behaviour of THMs and HAAs was the same in one out of the nine months. THMs followed two different types of behaviour: an increase after booster chlorination followed by a decrease downstream or an increase after booster chlorination with the downstream sample levels staying stable. HAAs mainly followed the behaviour of THMs but not in the same months or exhibited an increase throughout or a decrease after booster chlorination followed by an increase downstream. There was evidence of degradation in November 2014 in the downstream sample with a large increase in the TXAA:DXAA ratio. There was a decrease observed for all species but this was greater for the DXAAs. There is some evidence for 38
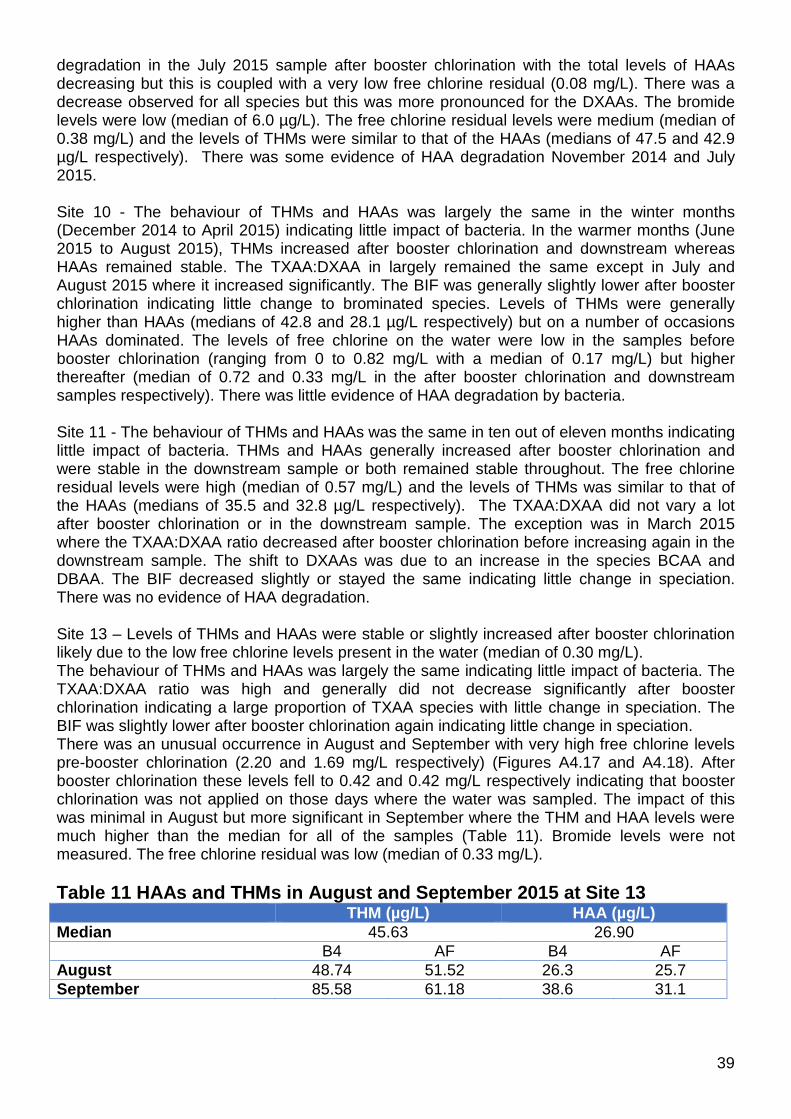
degradation in the July 2015 sample after booster chlorination with the total levels of HAAs decreasing but this is coupled with a very low free chlorine residual (0.08 mg/L). There was a decrease observed for all species but this was more pronounced for the DXAAs. The bromide levels were low (median of 6.0 µg/L). The free chlorine residual levels were medium (median of 0.38 mg/L) and the levels of THMs were similar to that of the HAAs (medians of 47.5 and 42.9 µg/L respectively). There was some evidence of HAA degradation November 2014 and July 2015. Site 10 - The behaviour of THMs and HAAs was largely the same in the winter months (December 2014 to April 2015) indicating little impact of bacteria. In the warmer months (June 2015 to August 2015), THMs increased after booster chlorination and downstream whereas HAAs remained stable. The TXAA:DXAA in largely remained the same except in July and August 2015 where it increased significantly. The BIF was generally slightly lower after booster chlorination indicating little change to brominated species. Levels of THMs were generally higher than HAAs (medians of 42.8 and 28.1 µg/L respectively) but on a number of occasions HAAs dominated. The levels of free chlorine on the water were low in the samples before booster chlorination (ranging from 0 to 0.82 mg/L with a median of 0.17 mg/L) but higher thereafter (median of 0.72 and 0.33 mg/L in the after booster chlorination and downstream samples respectively). There was little evidence of HAA degradation by bacteria. Site 11 - The behaviour of THMs and HAAs was the same in ten out of eleven months indicating little impact of bacteria. THMs and HAAs generally increased after booster chlorination and were stable in the downstream sample or both remained stable throughout. The free chlorine residual levels were high (median of 0.57 mg/L) and the levels of THMs was similar to that of the HAAs (medians of 35.5 and 32.8 µg/L respectively). The TXAA:DXAA did not vary a lot after booster chlorination or in the downstream sample. The exception was in March 2015 where the TXAA:DXAA ratio decreased after booster chlorination before increasing again in the downstream sample. The shift to DXAAs was due to an increase in the species BCAA and DBAA. The BIF decreased slightly or stayed the same indicating little change in speciation. There was no evidence of HAA degradation. Site 13 – Levels of THMs and HAAs were stable or slightly increased after booster chlorination likely due to the low free chlorine levels present in the water (median of 0.30 mg/L). The behaviour of THMs and HAAs was largely the same indicating little impact of bacteria. The TXAA:DXAA ratio was high and generally did not decrease significantly after booster chlorination indicating a large proportion of TXAA species with little change in speciation. The BIF was slightly lower after booster chlorination again indicating little change in speciation. There was an unusual occurrence in August and September with very high free chlorine levels pre-booster chlorination (2.20 and 1.69 mg/L respectively) (Figures A4.17 and A4.18). After booster chlorination these levels fell to 0.42 and 0.42 mg/L respectively indicating that booster chlorination was not applied on those days where the water was sampled. The impact of this was minimal in August but more significant in September where the THM and HAA levels were much higher than the median for all of the samples (Table 11). Bromide levels were not measured. The free chlorine residual was low (median of 0.33 mg/L). Table 11 HAAs and THMs in August and September 2015 at Site 13 THM (µg/L) HAA (µg/L) Median 45.63 26.90 B4 AF B4 AF August 48.74 51.52 26.3 25.7 September 85.58 61.18 38.6 31.1
39
Site 16 - The behaviour of THMs and HAAs was largely different with the exception of February, July and November 2015. There was no clear pattern for the THMs. The HAAs were often stable after booster chlorination followed by a decrease in the downstream sample. This was coupled with a large increase in the TXAA:DXAA ratio and a small increase in the BIF and a significant decrease in DCAA indicating bacterial degradation. In January and February 2015, the same type of behaviour is observed for HAAs – an increase after booster chlorination with levels stable in the downstream sample. However in January the TXAA:DXAA ratio increases in the DS sample with degradation of DCAA. In February the ratio does not change significantly and the speciation does not change. Although the overall behaviour is the same, there is evidence of biodegradation in January with the only difference observed being that the free chlorine levels in the downstream sample in January are slightly lower and the total HAAs higher in January compared to February 2015 (41.4 and 31.3 µg/L in the downstream samples respectively). Similarly in November 2014 and November 2015, the increase in TXAA:DXAA ratio was indicative of DCAA degradation likely by bacteria. In March 2015, there was no evidence of degradation. The free chlorine residual levels were medium (median of 0.41 mg/L) which was not consistent with historical data and the levels of THMs were higher than that of the HAAs (medians of 43.0 and 35.3 µg/L respectively). The BIF not vary a lot likely due to the low bromide levels (always <3 µg/L). Here the lower than expected free chlorine levels coupled with the likely presence of bacteria has led to the ideal conditions for HAA degradation. Site 18 – It should be noted that this site was fed by four different water treatment works. The data for TOC, UV and bromide is taken as an average of measurements taken from the four treatment works. The behaviour of THMs and HAAs was the same in four of the nine months (January, February, March and June 2015) indicating little impact of bacteria. In these months there was not a big variation in the TXAA:DXAA ratio but there was a slight increase in the BIF perhaps due to the availability of bromide in the water (Br:TOC ratio ranges from 6.6 to 26.3). During the other months the behaviour of THMs varied from month to month. The HAAs were either stable or decreased after booster chlorination then remained stable downstream. In November 2014 and September 2015 there was a decrease in THMs after booster chlorination with levels remaining stable downstream. In April and May 2015, there was no change in the TXAA:DXAA ratio but there was an increase in bromine incorporation. In July 2015 there was an increase in TXAAs and bromine containing HAAs with the corresponding reduction in DXAAs indicating a degree of bacterial degradation. In September 2015 the speciation changed to DXAAs and the incorporation of bromine (BIF) increased with no net increase overall. The residual chlorine levels were low (median of 0.39 mg/L). The median THM and HAA values were 21.5 and 14.1 µg/L respectively). The average bromide levels were low (median of 12.5 µg/L). Site 19 - The behaviour of THMs and HAAs was the same in five of the nine months (November 2014, January, February, April and June 2015) indicating little impact of bacteria. There was no decrease observed in DXAAs in any of the months and the small variations in the TXAA:DXAA ratios are due to the variation in TXAAs. The bromide levels were low (median of 4 µg/L). The residual chlorine levels were medium (median of 0.47 mg/L). The median THM and HAA values were 18.4 and 12.7 µg/L respectively). There was no evidence of bacterial degradation of HAAs. The bromide levels were low (median of 4.0 µg/L). Site 20 - The behaviour of THMs and HAAs was the same in five out of seven months indicating little impact of bacteria. THMs and HAAs generally did not increase after booster chlorination but increased in the downstream sample. The free chlorine residual levels were medium (median of 0.46 mg/L) and the levels of THMs was similar to that of the HAAs (medians of 19.4 and 18.1 µg/L respectively). The TXAA:DXAA did not vary a lot after booster chlorination or in the downstream sample except in April and May 2015. The BIF barely varied at all except in
40
April 2015 indicating little change in speciation. However in April 2015 the TXAA:DXAA ratio increased after booster chlorination then decreased in the downstream sample. This was coupled with a decrease in the BIF in the downstream sample with an overall decrease in MBAA and TBAA. There was no evidence of HAA degradation. The bromide levels were medium (median of 26.0 µg/L). Site 21 - Levels of THMs and HAAs were stable or increased after booster chlorination likely due to the low free chlorine levels present in the water (median of 0.26 mg/L). The behaviour of THMs and HAAs was the same in six out of the nine months. Although levels of HAAs increased in July 2015, there was a shift to DXAAs. All of the species increased but the TXAAs increased more than the DXAAs. The BIF was always lower after booster chlorination again indicating a shift to more chlorinated species. In January and February 2015 HAA levels fell after booster chlorination perhaps due to the very low levels of free chlorine present (0.13 and 0.10 mg/L respectively in downstream samples) although the reduction in DXAAs indicates there may have been some bacterial degradation of DXAAs. Indeed all species decreased except TCAA but the DXAAs decreased the most. Levels of THMs were greater than HAAs with median values of 46.6 and 24.4 µg/L respectively. The bromide levels were low (median of 17 µg/L). Site 22 - The behaviour of THMs and HAAs was not the same in any month indicating some impact of bacteria. The behaviour of HAAs varied from stable (July and October 2015) to decreasing after booster chlorination and then stable downstream (August 2015) or increasing downstream (September 2015). Other variations included being stable after chlorination followed by an increase in the downstream sample (December 2015) or increasing after booster chlorination and stating the same in the downstream sample (January 2016). Where HAAs decreased (August 2015) there was a reduction in all species but this was greater in DXAAs. However when the HAAs decreased in September 2015 this was solely due to a decrease in DXAAs. The reduction in DCAA and BCAA produced an increase in the HAA bromine incorporation. Levels of THMs were stable or slightly increased after booster chlorination whereas HAAs were more susceptible to a reduction likely due to bacterial degradation. Overall the THMs were present at higher levels than the HAAs (medians of 32.9 and 23.9 µg/L respectively). Bromide levels were low (median of 14.0 µg/L). No on-site measurements of chlorine were carried out although historic data indicated
41
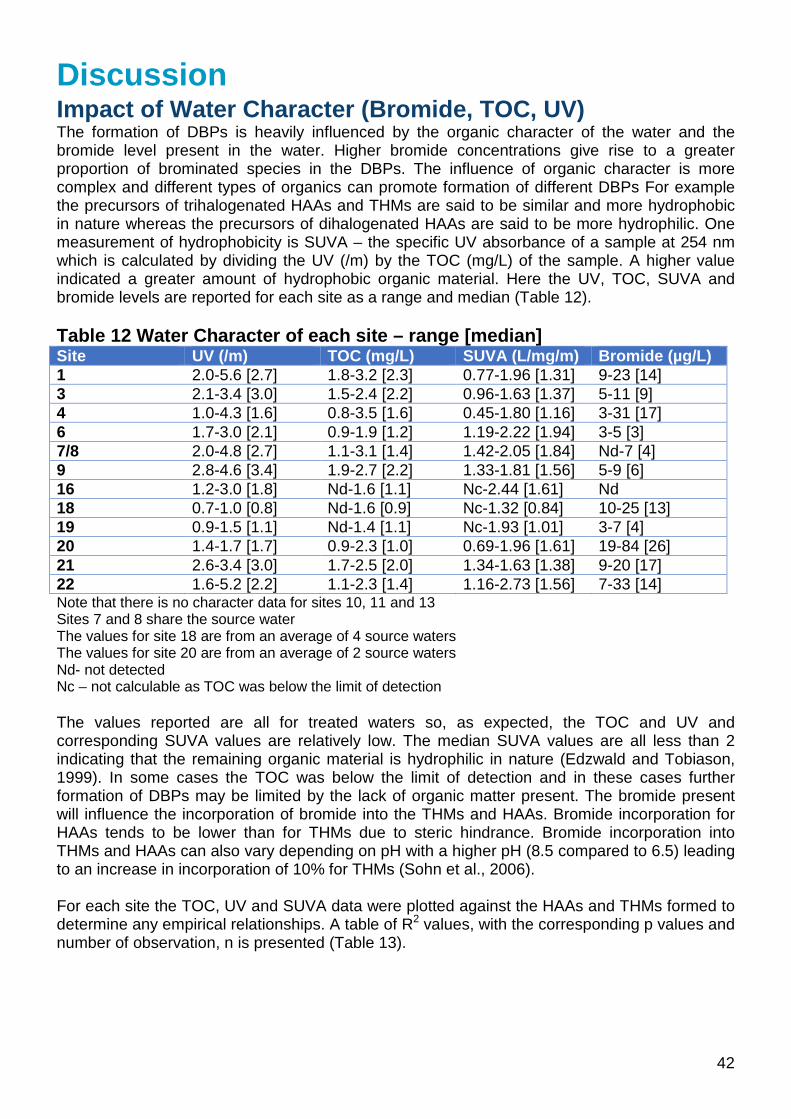
Discussion Impact of Water Character (Bromide, TOC, UV) The formation of DBPs is heavily influenced by the organic character of the water and the bromide level present in the water. Higher bromide concentrations give rise to a greater proportion of brominated species in the DBPs. The influence of organic character is more complex and different types of organics can promote formation of different DBPs For example the precursors of trihalogenated HAAs and THMs are said to be similar and more hydrophobic in nature whereas the precursors of dihalogenated HAAs are said to be more hydrophilic. One measurement of hydrophobicity is SUVA – the specific UV absorbance of a sample at 254 nm which is calculated by dividing the UV (/m) by the TOC (mg/L) of the sample. A higher value indicated a greater amount of hydrophobic organic material. Here the UV, TOC, SUVA and bromide levels are reported for each site as a range and median (Table 12). Table 12 Water Character of each site – range [median] Site UV (/m) TOC (mg/L) SUVA (L/mg/m) Bromide (µg/L) 1 2.0-5.6 [2.7] 1.8-3.2 [2.3] 0.77-1.96 [1.31] 9-23 [14] 3 2.1-3.4 [3.0] 1.5-2.4 [2.2] 0.96-1.63 [1.37] 5-11 [9] 4 1.0-4.3 [1.6] 0.8-3.5 [1.6] 0.45-1.80 [1.16] 3-31 [17] 6 1.7-3.0 [2.1] 0.9-1.9 [1.2] 1.19-2.22 [1.94] 3-5 [3] 7/8 2.0-4.8 [2.7] 1.1-3.1 [1.4] 1.42-2.05 [1.84] Nd-7 [4] 9 2.8-4.6 [3.4] 1.9-2.7 [2.2] 1.33-1.81 [1.56] 5-9 [6] 16 1.2-3.0 [1.8] Nd-1.6 [1.1] Nc-2.44 [1.61] Nd 18 0.7-1.0 [0.8] Nd-1.6 [0.9] Nc-1.32 [0.84] 10-25 [13] 19 0.9-1.5 [1.1] Nd-1.4 [1.1] Nc-1.93 [1.01] 3-7 [4] 20 1.4-1.7 [1.7] 0.9-2.3 [1.0] 0.69-1.96 [1.61] 19-84 [26] 21 2.6-3.4 [3.0] 1.7-2.5 [2.0] 1.34-1.63 [1.38] 9-20 [17] 22 1.6-5.2 [2.2] 1.1-2.3 [1.4] 1.16-2.73 [1.56] 7-33 [14] Note that there is no character data for sites 10, 11 and 13 Sites 7 and 8 share the source water The values for site 18 are from an average of 4 source waters The values for site 20 are from an average of 2 source waters Nd- not detected Nc – not calculable as TOC was below the limit of detection The values reported are all for treated waters so, as expected, the TOC and UV and corresponding SUVA values are relatively low. The median SUVA values are all less than 2 indicating that the remaining organic material is hydrophilic in nature (Edzwald and Tobiason, 1999). In some cases the TOC was below the limit of detection and in these cases further formation of DBPs may be limited by the lack of organic matter present. The bromide present will influence the incorporation of bromide into the THMs and HAAs. Bromide incorporation for HAAs tends to be lower than for THMs due to steric hindrance. Bromide incorporation into THMs and HAAs can also vary depending on pH with a higher pH (8.5 compared to 6.5) leading to an increase in incorporation of 10% for THMs (Sohn et al., 2006). For each site the TOC, UV and SUVA data were plotted against the HAAs and THMs formed to determine any empirical relationships. A table of R2 values, with the corresponding p values and number of observation, n is presented (Table 13).
42
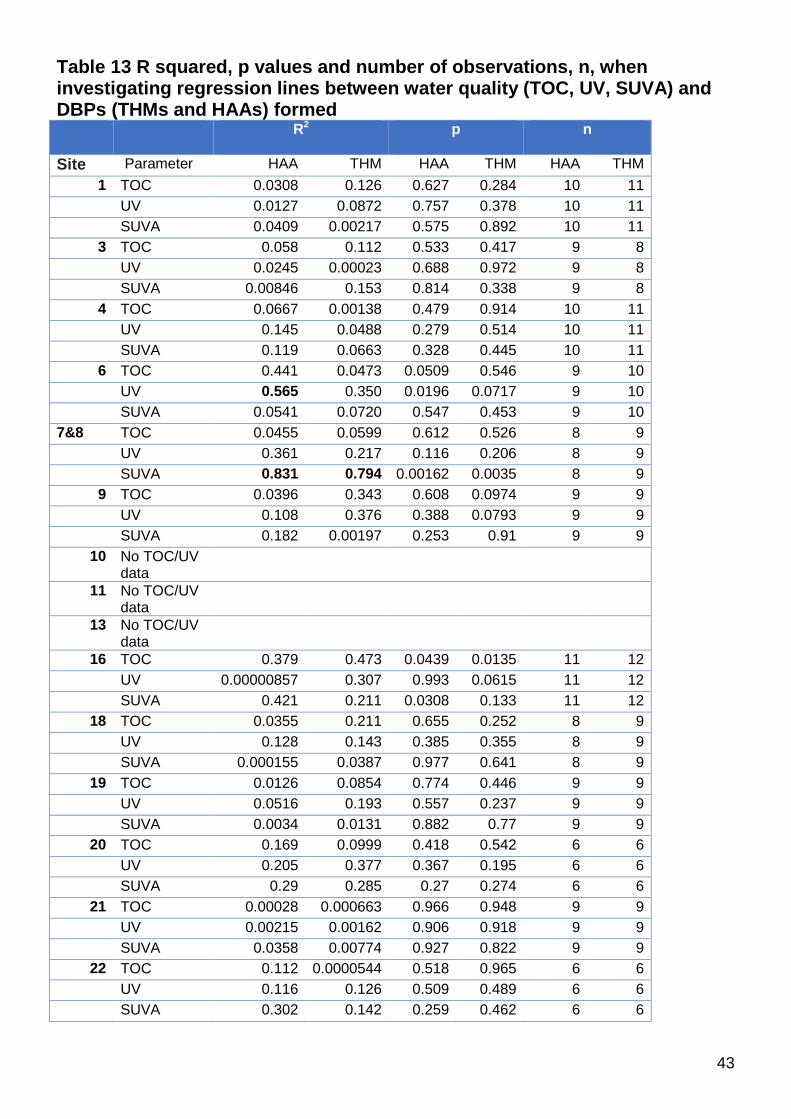
Table 13 R squared, p values and number of observations, n, when investigating regression lines between water quality (TOC, UV, SUVA) and DBPs (THMs and HAAs) formed R2
p
n
Site Parameter HAA THM HAA THM HAA THM 1 TOC 0.0308 0.126 0.627 0.284 10 11
UV 0.0127 0.0872 0.757 0.378 10 11 SUVA 0.0409 0.00217 0.575 0.892 10 11
3 TOC 0.058 0.112 0.533 0.417 9 8 UV 0.0245 0.00023 0.688 0.972 9 8 SUVA 0.00846 0.153 0.814 0.338 9 8
4 TOC 0.0667 0.00138 0.479 0.914 10 11 UV 0.145 0.0488 0.279 0.514 10 11 SUVA 0.119 0.0663 0.328 0.445 10 11
6 TOC 0.441 0.0473 0.0509 0.546 9 10 UV 0.565 0.350 0.0196 0.0717 9 10 SUVA 0.0541 0.0720 0.547 0.453 9 10 7&8 TOC 0.0455 0.0599 0.612 0.526 8 9 UV 0.361 0.217 0.116 0.206 8 9 SUVA 0.831 0.794 0.00162 0.0035 8 9
9 TOC 0.0396 0.343 0.608 0.0974 9 9 UV 0.108 0.376 0.388 0.0793 9 9 SUVA 0.182 0.00197 0.253 0.91 9 9
10 No TOC/UV data
11 No TOC/UV data
13 No TOC/UV data
16 TOC 0.379 0.473 0.0439 0.0135 11 12 UV 0.00000857 0.307 0.993 0.0615 11 12 SUVA 0.421 0.211 0.0308 0.133 11 12
18 TOC 0.0355 0.211 0.655 0.252 8 9 UV 0.128 0.143 0.385 0.355 8 9 SUVA 0.000155 0.0387 0.977 0.641 8 9
19 TOC 0.0126 0.0854 0.774 0.446 9 9 UV 0.0516 0.193 0.557 0.237 9 9 SUVA 0.0034 0.0131 0.882 0.77 9 9
20 TOC 0.169 0.0999 0.418 0.542 6 6 UV 0.205 0.377 0.367 0.195 6 6 SUVA 0.29 0.285 0.27 0.274 6 6
21 TOC 0.00028 0.000663 0.966 0.948 9 9 UV 0.00215 0.00162 0.906 0.918 9 9 SUVA 0.0358 0.00774 0.927 0.822 9 9
22 TOC 0.112 0.0000544 0.518 0.965 6 6 UV 0.116 0.126 0.509 0.489 6 6 SUVA 0.302 0.142 0.259 0.462 6 6
43
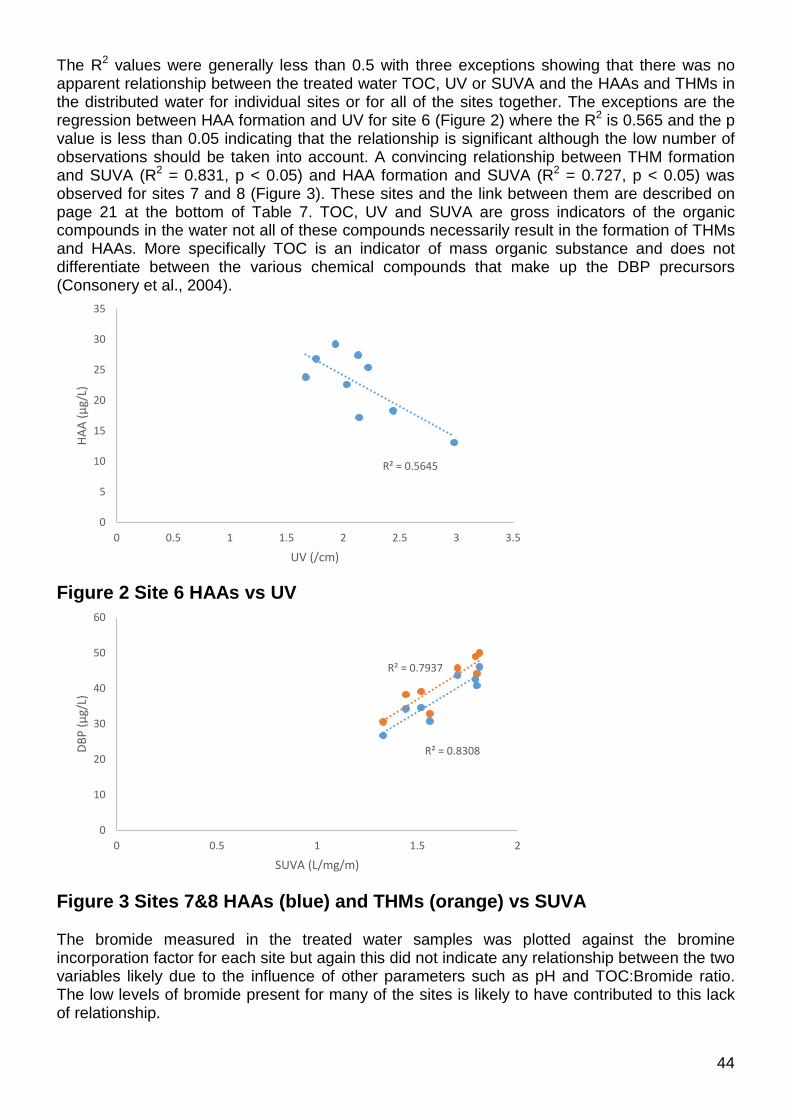
The R2 values were generally less than 0.5 with three exceptions showing that there was no apparent relationship between the treated water TOC, UV or SUVA and the HAAs and THMs in the distributed water for individual sites or for all of the sites together. The exceptions are the regression between HAA formation and UV for site 6 (Figure 2) where the R2 is 0.565 and the p value is less than 0.05 indicating that the relationship is significant although the low number of observations should be taken into account. A convincing relationship between THM formation and SUVA (R2 = 0.831, p < 0.05) and HAA formation and SUVA (R2 = 0.727, p < 0.05) was observed for sites 7 and 8 (Figure 3). These sites and the link between them are described on page 21 at the bottom of Table 7. TOC, UV and SUVA are gross indicators of the organic compounds in the water not all of these compounds necessarily result in the formation of THMs and HAAs. More specifically TOC is an indicator of mass organic substance and does not differentiate between the various chemical compounds that make up the DBP precursors (Consonery et al., 2004).
Figure 2 Site 6 HAAs vs UV
Figure 3 Sites 7&8 HAAs (blue) and THMs (orange) vs SUVA The bromide measured in the treated water samples was plotted against the bromine incorporation factor for each site but again this did not indicate any relationship between the two variables likely due to the influence of other parameters such as pH and TOC:Bromide ratio. The low levels of bromide present for many of the sites is likely to have contributed to this lack of relationship.
R² = 0.5645
0
5
10
15
20
25
30
35
0 0.5 1 1.5 2 2.5 3 3.5
HAA
(µg/
L)
UV (/cm)
R² = 0.8308
R² = 0.7937
0
10
20
30
40
50
60
0 0.5 1 1.5 2
DBP
(µg/
L)
SUVA (L/mg/m)
44
Effect of disinfectant concentration on THMs and HAAs The rate of formation, extent and distribution of DBPs are affected by the chlorine dose and residual. At relatively low doses (such as those applied in water treatment) substitution reactions dominate, whereas at high doses, oxidation and cleavage reactions dominate (Johnson and Jensen, 1986). This observation suggests that in addition to forming greater amounts of DBPs, changes in DBP speciation are also expected with increasing chlorine dosage (Baribeau et al., 2006). For example, higher doses and residuals favour the formation of HAAs over THMs. In addition, higher chlorine doses result in a greater proportion of TXAAs compared to DXAAs (Krasner, 1999). An analysis of a large US study observed that the change in DBP concentrations were strongly associated with finished water total chlorine residual in the systems using free chlorine in distribution (Obolensky and Frey, 2002). Concentrations of THMs and HAAs increased with finished water total chlorine residual in the free chlorinated systems. Here the change in DBPs was not strongly associated with the free chlorine residual concentrations perhaps due to the lower levels of chlorine used here compared to the US studies where residuals can be as high as 7 mg/L. Here we found that largely concentrations of THMs exceeded those of HAAs with the exceptions occurring in the spring/summer months although the median concentrations of both over the period sampled were often very similar. A study of five distribution systems in the US was carried out (Speight and Singer, 2005). They reported that in all five case studies, loss of residual chlorine was a necessary condition for the degradation of HAAs. However, loss of chlorine alone was not sufficient to ensure a decrease in HAA concentrations. It was clear that hydrodynamic factors and temperature clearly played a role in the degradation of HAAs, if only indirectly, by causing conditions that are favourable (or unfavourable) to chlorine decay and biological activity. They concluded that the degradation of HAAs was a site-specific occurrence, depending on residual chlorine concentrations at various locations in the system and temperature, both of which affect microbial colonisation.
Conditions of degradation Each distribution system is complex and the water will have a range of ages depending on the time of day, season and demand. In order to discern where the chlorine and bacteria may be having an impact on HAA behaviour, the THM and HAA behaviour at the same time point was compared. Where the behaviour was the same, it was determined that the impact of bacteria on HAAs was minimal. Where the behaviour varied, it was possible to determine whether this was due to the impact of bacteria, impact of the pipe material or the impact of free chlorine concentration by looking at the speciation and variation in the HAAs. Seven sites out of the sixteen investigated had evidence of bacterial degradation of HAAs but this did not happen consistently throughout the year. The conditions where degradation did occur are summarised (Table 14).
45
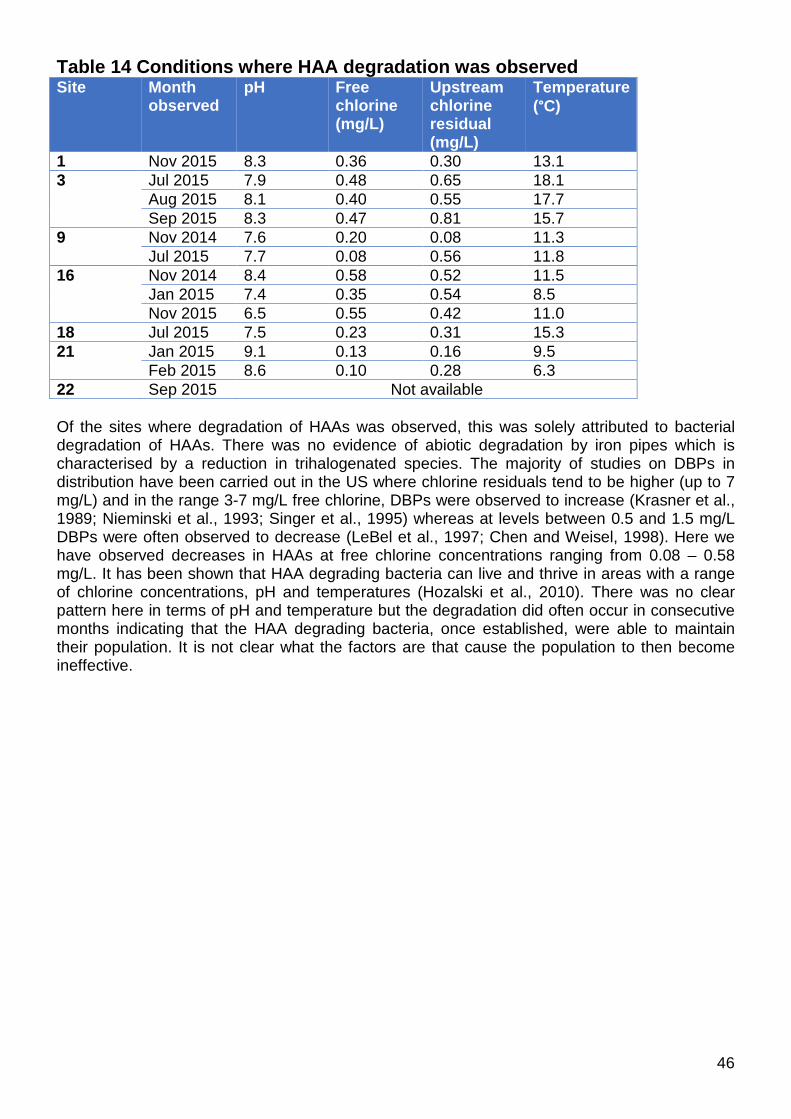
Table 14 Conditions where HAA degradation was observed Site Month
observed pH Free
chlorine (mg/L)
Upstream chlorine residual (mg/L)
Temperature (°C)
1 Nov 2015 8.3 0.36 0.30 13.1 3 Jul 2015 7.9 0.48 0.65 18.1
Aug 2015 8.1 0.40 0.55 17.7 Sep 2015 8.3 0.47 0.81 15.7
9 Nov 2014 7.6 0.20 0.08 11.3 Jul 2015 7.7 0.08 0.56 11.8
16 Nov 2014 8.4 0.58 0.52 11.5 Jan 2015 7.4 0.35 0.54 8.5 Nov 2015 6.5 0.55 0.42 11.0
18 Jul 2015 7.5 0.23 0.31 15.3 21 Jan 2015 9.1 0.13 0.16 9.5
Feb 2015 8.6 0.10 0.28 6.3 22 Sep 2015 Not available Of the sites where degradation of HAAs was observed, this was solely attributed to bacterial degradation of HAAs. There was no evidence of abiotic degradation by iron pipes which is characterised by a reduction in trihalogenated species. The majority of studies on DBPs in distribution have been carried out in the US where chlorine residuals tend to be higher (up to 7 mg/L) and in the range 3-7 mg/L free chlorine, DBPs were observed to increase (Krasner et al., 1989; Nieminski et al., 1993; Singer et al., 1995) whereas at levels between 0.5 and 1.5 mg/L DBPs were often observed to decrease (LeBel et al., 1997; Chen and Weisel, 1998). Here we have observed decreases in HAAs at free chlorine concentrations ranging from 0.08 – 0.58 mg/L. It has been shown that HAA degrading bacteria can live and thrive in areas with a range of chlorine concentrations, pH and temperatures (Hozalski et al., 2010). There was no clear pattern here in terms of pH and temperature but the degradation did often occur in consecutive months indicating that the HAA degrading bacteria, once established, were able to maintain their population. It is not clear what the factors are that cause the population to then become ineffective.
46
Conclusions Levels of THMs and HAAs were stable or slightly increased (up to 16.68%) after booster chlorination. When considering all of the data collected over the time period, the increase in THMs after booster chlorination was statistically significant at the 95% confidence level when comparing the means. The increase was small (just over 10%). The change in HAAs after booster chlorination was not significant at the 95% confidence level. In agreement with previous researchers (Speight and Singer, 2005) it can be concluded that the degradation of HAAs following booster chlorination is a site-specific occurrence, depending on residual chlorine concentrations at various locations in the system and temperature, both of which affect the colonisation of HAA degrading bacteria. Degradation of HAAs was observed in a number of locations whereas THM degradation did not occur to any significant degree The reduction in HAA concentrations observed here might have gone unnoticed in typical sampling programs currently used by water utilities. The discovery of notable phenomena such as HAA degradation leading to spatial and temporal variations in HAA concentrations can be attributed to the comprehensive sampling carried out over a period of time on a month-by-month basis. Such a sampling programme would be required to determine distribution systems where degradation of HAAs may occur and this should not be restricted to locations where booster chlorination is carried out. Should HAAs be regulated in the EU and the UK in the future, this further degree of understanding may be useful.
47
References Baribeau, H., Krasner, S.W., Chinn, R., and Singer, P.C. (2000). Impact of Biomass on the Stability of Haloacetic Acids and Trihalomethanes in a Simulated Distribution System. Proc. 2000 AWWA Water Quality Technology Conf., Salt Lake City, UT. Baribeau, H., Boulos, L., Haileelassie, H., Crozes, G., Singer, P.C., Nichols, C., Schlesinger, S.A., Gullick, R.W., Williams, S.L., Williams, R.L., Fountleroy, L, Andrews, S.A. and Moffat, E. (2006) Formation and Decay of Disinfection By-Products in the Distribution System. AWWA Research Foundation, #91115. Bayless, W. and Andrews, R.C. (2008) Biodegradation of six haloacetic acids in drinking water. Journal of Water and Health, 6(1), 15-22. Beaulieu, C., Rodriguez, M.J and Sérodes, J.-B. (2009) Variations of DBPs precursors according to location within the distribution system. Water Science and Technology: Water Supply, 9(4), 413-421. Boccelli, D. L., Tryby, M.E., Uber, J.G., and Summers, R.S. (2003) A reactive species model for chlorine decay and THM formation under rechlorination conditions. Water Research, 37(11), 2654–2666. Boccelli, D. L., Tryby, M. E., Uber, J. G., Rossman, L. A., Zierolf, M. L., and Polycarpou, M. M. (1998). Optimal scheduling of booster disinfection in water distribution systems. Journal of Water Resources Planning and Management, 124(2), 99-111. Bougeard, C.M.M., Goslan, E.H., Jefferson, B. and Parsons, S.A. (2010) Comparison of the disinfection by-product formation potential of treated waters exposed to chlorine and monochloramine. Water Research 44 729-740 Carrico, B.T. and Singer, P.C. (2009) Impact of Booster Chlorination on Chlorine Decay and THM Production: Simulated Analysis. Journal of Environmental Engineering, 135(10), 928–935. Carrico, B.T. and Singer, P.C. (2005) Impact of Booster Chlorination on THM Production: A Simulated Analysis. Conference Proceedings “Impacts of Global Climate Change” Edited by Raymond Walton, P.E., M.ASCE. World Water and Environmental Resources Congress 2005, Anchorage, Alaska, United States, May 15-19, 2005 Chan, K.C.W., Mavinic, D.S. and Brereton, J.A. (2002) Trihalomethane formation in drinking water and production within a polyvinyl chloride pipe environment. Journal of Environmental Engineering Science, 1, 293-302. Chen, W.J. and Weisel, C.P. (1998). Halogenated DBP Concentrations in a Distribution System. Journal of the American Water Works Association, 90(4): 151-163. Consonery, P.J., Lusardi, P.J., Kopansky, R. and Manning, R.L. (2004) Total Organic Carbon: A reliable indicator of TTHM and HAA5 formation? American Water Works Association WQTC. Cortvriend, J. (2008). Establishment of a list of chemical parameters for the revision of the Drinking Water Directive, ENV.D.2/ETU/2007/0077r url:http://circa.europa.eu/Public/irc/env/drinking_water_rev/library?l=/chemical_parameters/parameters_26092008pdf/_EN_1.0_&a=d Cozzolino, L., Pianese, D. and Pirozzi, F. (2005) Control of DBPs in water distribution systems and disinfection station allocation. Desalination, 176, 113-125. Diehl, A.C, Speitel Jr., G.E., Symons, J.M., Krasner, S.W., Hwang, C.J., and Barrett, S.E. (2000). DBP formation during chloramination. Journal of the American Water Works Association, 92(6): 76-90. De Leer, E.W.B., Sinninghe Damste, J.S., Erkelens, C., and de Galan, L. (1985). Identification of Intermediates Leading to Chloroform and C-4 Diacids in the Chlorination of Humic Acid. Environmental Science and Technology, 19: 512-522. DWI (2000, 2010) Water Supply Regulations (guidance updated 2010) http://dwi.defra.gov.uk/stakeholders/legislation/ws_wqregs2000_cons2010.pdf Edzwald, J.K. and Tobiason, J.E. (1999) Enhanced coagulation: USA requirements in a broader view. Water, Science and Technology 40(9): 63-70
48
Gatel, D., Servais, P., Block, J.C., Bonne, P. and Cavard, J. (2000) Microbiological water quality management in the Paris suburbs distribution system. Journal of Water Supply: Research and Technology – AQUA, 49(5) , 231-241. Gerrity, D., Mayer, B., Ryu, H., Crittenden, J. and Abbaszadegan, M. (2009) A comparison of pilot-scale photocatalysis and enhanced coagulation for disinfection byproduct migration. Water Research, 43, 1597-1610. Gibbs, R.A., Scutt, J.E. and Croll, B.T. (1990) Microbiological and Trihalomethane Response to Booster Chlorination. Journal of the Institute of Water and Environmental Management, 4(2), 131-139. Goslan, E.H., Krasner, S.W., Bower, M. Rocks, S.A., Holmes, P., Levy, L.S. and Parsons, S.A. (2009) A comparison of disinfection by-products found in chlorinated and chloraminated drinking waters in Scotland. Water Research 43 4698-4706 Hozalski, R.M., P. Zhang, T.M. LaPara, A. Grigorescu, L.H. Leach, A.K. Camper, E.H. Goslan, S.A. Parsons, and Y.F. Xie. 2010. Biodegradation of HAAs in Distribution Systems. Denver, Colo.: Water Research Foundation #3122. Hozalski, R.M., Zhang, L., and Arnold, W.A. (2001). Reduction of haloacetic acids by Fe(0): implications for treatment and fate. Environmental Science and Technology 35(11): 2258-2263. Krasner, S.W., Pastor, S., Chinn, R., Scliment, M.J., Weinberg, H.S., Richardson, S.D., and Thurston, Jr., A.D. (2001). The Occurrence of a New Generation of DBPs (Beyond the ICR). Proc. AWWA Water Quality Technology Conf., Nashville, TN. Krasner, S.W., McGuire, M.J., Jacangelo, J.G., Patania, N.L., Reagan, K.M.,and Aieta, E.M. (1989). The occurrence of disinfection by-products in US drinking water. Journal of the American Water Works Association, 81(8): 41-53. Larson, R.A. and Weber, E.J. (1994). Reaction Mechanisms in Environmental Organic Chemistry. Lewis Publishers: Boca Raton, Fla, USA. LeBel, G.L., Benoit, F.M. and Williams, D.T. (1997). A one-year survey of halogenated disinfection by-products in the distribution system of treatment plants using three different disinfection processes. Chemosphere 34(11): 2301-2317. LeChevallier, M.W., Welch, N.J., and Smith, D.B. (1996). Full-scale studies of factors related to coliform regrowth in drinking water. Applied and Environmental Microbiology, 62(7): 2201-2211. Li, C., Yu, J.Z., Zhang, T.Q., Mao, X.W. & Hu, Y.J. (2015) Multiobjective optimization of water quality and rechlorination cost in water distribution systems. Urban Water Journal, 12(8), 646-652. Liu, R., Tian, C., Liu, X., Jiang, H., Liua, H., Qu, J. and Jefferson, W. (2012) Optimization of chlorine-based disinfection for the control of disinfection by-products formation and CODMn: A case study. Chemical Engineering Journal, 197, 116–122 Morris, J.C. and Baum, B. (1978). Precursors and Mechanisms of Haloform Formation in the Chlorination of Water Supplies. In Water Chlorination: Environmental Impacts and Health Effects. R.L. Jolley, H. Gorchev, and D.H. Hamilton (Eds.). Ann Arbor Press: Ann Arbor, Mich, USA. Nieminski, C.E., Chaudhuri, S., and Lamoreaux, T. (1993). The Occurrence of DBPs in Utah Drinking Waters. Journal of the American Water Works Association, 85(9): 98-105. Ohar, Z. and Ostfeld, A. (2014) Optimal design and operation of booster chlorination stations layout in water distribution systems. Water Research, 58, 209-220. Parsons, S.A. and Goslan, E.H. (2011) Evaluation of Haloacetic Acids Concentrations in Treated Drinking Waters (Cranfield University) http://dwi.defra.gov.uk/research/completed-research/reports/DWI70_2_242.pdf Radhakrishnan, M., Pathirana, A., Ghebremichael, K., and Amy, G. (2012) Modelling formation of disinfection by-products in water distribution: optimisation using a multi-objective evolutionary algorithm. Journal of Water Supply Research and Technology – AQUA, 61(3), 176-188. Rodriguez, M. J., Sérodes, J., Levallois, P. and Proulx, F. (2007) Chlorinnated disinfection by-products in drinking water according to source, treatment, season and distribution location. Journal of Environmental Engineering Science, 6, 355-365.
49
Rodriguez, M. J., Sérodes, J. and Levallois, P. (2004). Behavior of trihalomethanes and haloacetic acids in a drinking water distribution system. Water Research, 38(20), 4367- 4382. Singer, P.C., Weinberg, H.S., Brophy, K., Liang, L., Roberts, M., Grisstede, I., Krasner, S.W., Baribeau, H., Arora, H and Najm, I. (2002) Relative Dominance of HAAs and THMs in Treated Drinking Water. AWWA Research Foundation, #90844. Singer, P.C., Obolensky, A., and Greiner, A. (1995). DBPs in Chlorinated North Carolina Drinking Waters. Journal of the American Water Works Association, 87(10): 83-92. Sohn, J., Amy, G. and Yoon, Y. (2006) Bromide Ion Incorporation Into Brominated Disinfection By-Products. Water Air and Soil Pollution 174: 265-277 Sun, Y.-X., Wu, Q.-Y., Hu, H.-Y., Tian, J. (2009) Effect of bromide on the formation of disinfection by-products during wastewater chlorination. Water Research, 43(9), 2391-2398. Sung, W., Reilley-Matthews, B., O'Day, D.K., and Horrigan, K. (2000). Modeling DBP formation. Journal of the American Water Works Association, 92(5): 53-63. Tate, C.H. and Arnold, K.F. (1990). Health and Aesthetic Aspects of Water Quality. In Water Quality and Treatment. F.W. Pontius (Ed.). McGraw-Hill: New York, USA. Tian, Y., Guo, H., Wang, Y., Liu, Y. and Shan, J. (2017) Behaviour of Haloacetic Acids in Drinking Water Distribution Systems. Transactions of Tianjin University – Springer, 23, 93-99. Tryby, M. E., Boccelli, D. L., Uber, J. G., and Rossman, L. A. (2002). Facility location model for booster disinfection of water supply networks. Journal of Water Resources Planning and Management, 128(5), 322-333. Tryby, M. E., Boccelli, D. L. Koechling, M. T. Uber, J. G. Summers, R. S. AND Rossman, L. A. (1999) Booster Chlorination for Managing Disinfectant Residuals. Journal American Water Works Association. 91(1), 95-108. Tung, H. and Xie, Y.F. (2009) Association between haloacetic acid degradation and heterotrophic bacteria in water distribution systems. Water Research 43, 971-978. USEPA (1998). National Primary Drinking Water Regulations: Disinfectants and Disinfection Byproducts, Final Rule, Federal Register, 63:241:69390. Williams, D.T., Lebel, G.L. and Benoit, F.M. (1997a). Disinfection By-Products in Canadian Drinking Water. Chemosphere 34(2), 299-316. Williams, S.L., Williams, R.L., and Gordon, A.S. (1997b). The Impact of Bacterial Degradation of Haloacetic Acids (HAA) in the Distribution System. Proc. 1996 AWWA Water Quality Technology Conf., Boston, MA, USA. Williams, S.L., Rindfleisch, D.F., and Williams, R.L. (1995). Deadend on Haloacetic Acids (HAA). Proc. 1994 AWWA Water Quality Technology Conf., San Francisco, CA, USA. World Health Organisation (WHO) (2011). Guidelines for drinking-water quality, 4th edition. Zhang, P., Hozalski, R.M., Leach, L.H., Camper, A.K., Goslan, E.H., Parsons, S.A., Xie, Y.F. and LaPara, T.M. (2009) Isolation and characterization of haloacetic acid-degrading Afipia spp. from drinking water. FEMS Microbiology Letters. 297, 203-208. Zhang, P., Lapara, T.M., Goslan, E.H., Xie, Y.F., Parsons, S.A. and Hozalski, R.M. (2009) Biodegradation of Haloacetic Acids by Bacterial Isolates and Enrichment Cultures from Drinking Water Systems, Environmental Science and Technology. 43, 3169-3175. Zhang, L., Arnold, W.A., and Hozalski, R.M. (2004). Kinetics of Haloacetic Acid Reactions with Fe(0). Environmental Science and Technology, 38, 6881-6889.
50
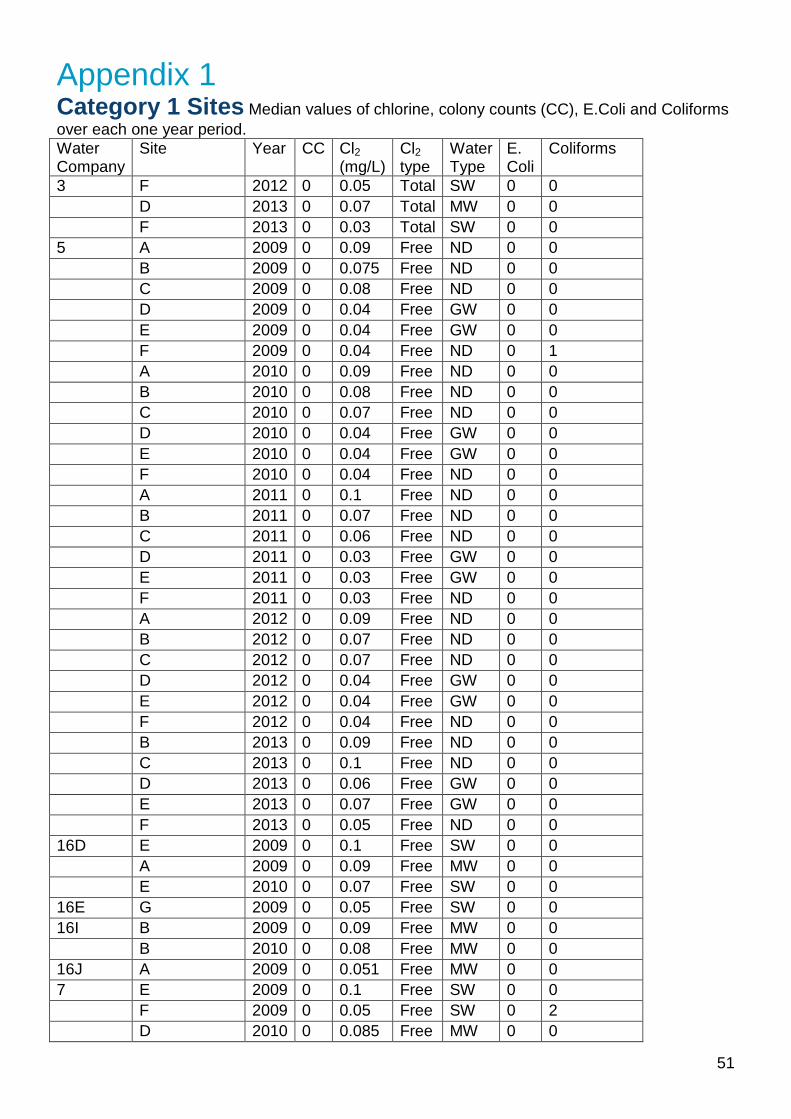
Appendix 1 Category 1 Sites Median values of chlorine, colony counts (CC), E.Coli and Coliforms over each one year period. Water Company
Site Year CC Cl2 (mg/L)
Cl2 type
Water Type
E. Coli
Coliforms
3 F 2012 0 0.05 Total SW 0 0 D 2013 0 0.07 Total MW 0 0 F 2013 0 0.03 Total SW 0 0 5 A 2009 0 0.09 Free ND 0 0 B 2009 0 0.075 Free ND 0 0 C 2009 0 0.08 Free ND 0 0 D 2009 0 0.04 Free GW 0 0 E 2009 0 0.04 Free GW 0 0 F 2009 0 0.04 Free ND 0 1 A 2010 0 0.09 Free ND 0 0 B 2010 0 0.08 Free ND 0 0 C 2010 0 0.07 Free ND 0 0 D 2010 0 0.04 Free GW 0 0 E 2010 0 0.04 Free GW 0 0 F 2010 0 0.04 Free ND 0 0 A 2011 0 0.1 Free ND 0 0 B 2011 0 0.07 Free ND 0 0 C 2011 0 0.06 Free ND 0 0 D 2011 0 0.03 Free GW 0 0 E 2011 0 0.03 Free GW 0 0 F 2011 0 0.03 Free ND 0 0 A 2012 0 0.09 Free ND 0 0 B 2012 0 0.07 Free ND 0 0 C 2012 0 0.07 Free ND 0 0 D 2012 0 0.04 Free GW 0 0 E 2012 0 0.04 Free GW 0 0 F 2012 0 0.04 Free ND 0 0 B 2013 0 0.09 Free ND 0 0 C 2013 0 0.1 Free ND 0 0 D 2013 0 0.06 Free GW 0 0 E 2013 0 0.07 Free GW 0 0 F 2013 0 0.05 Free ND 0 0 16D E 2009 0 0.1 Free SW 0 0 A 2009 0 0.09 Free MW 0 0 E 2010 0 0.07 Free SW 0 0 16E G 2009 0 0.05 Free SW 0 0 16I B 2009 0 0.09 Free MW 0 0 B 2010 0 0.08 Free MW 0 0 16J A 2009 0 0.051 Free MW 0 0 7 E 2009 0 0.1 Free SW 0 0 F 2009 0 0.05 Free SW 0 2 D 2010 0 0.085 Free MW 0 0
51
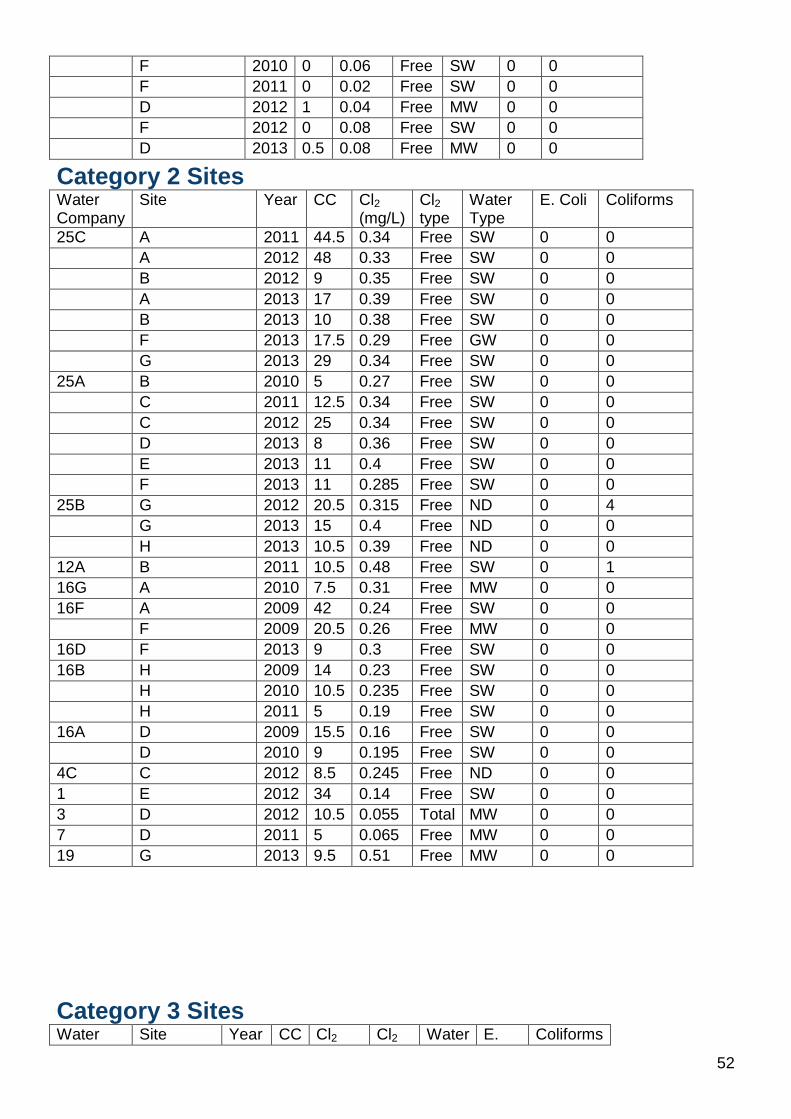
F 2010 0 0.06 Free SW 0 0 F 2011 0 0.02 Free SW 0 0 D 2012 1 0.04 Free MW 0 0 F 2012 0 0.08 Free SW 0 0 D 2013 0.5 0.08 Free MW 0 0
Category 2 Sites Water Company
Site Year CC Cl2 (mg/L)
Cl2 type
Water Type
E. Coli Coliforms
25C A 2011 44.5 0.34 Free SW 0 0 A 2012 48 0.33 Free SW 0 0 B 2012 9 0.35 Free SW 0 0 A 2013 17 0.39 Free SW 0 0 B 2013 10 0.38 Free SW 0 0 F 2013 17.5 0.29 Free GW 0 0 G 2013 29 0.34 Free SW 0 0 25A B 2010 5 0.27 Free SW 0 0 C 2011 12.5 0.34 Free SW 0 0 C 2012 25 0.34 Free SW 0 0 D 2013 8 0.36 Free SW 0 0 E 2013 11 0.4 Free SW 0 0 F 2013 11 0.285 Free SW 0 0 25B G 2012 20.5 0.315 Free ND 0 4 G 2013 15 0.4 Free ND 0 0 H 2013 10.5 0.39 Free ND 0 0 12A B 2011 10.5 0.48 Free SW 0 1 16G A 2010 7.5 0.31 Free MW 0 0 16F A 2009 42 0.24 Free SW 0 0 F 2009 20.5 0.26 Free MW 0 0 16D F 2013 9 0.3 Free SW 0 0 16B H 2009 14 0.23 Free SW 0 0 H 2010 10.5 0.235 Free SW 0 0 H 2011 5 0.19 Free SW 0 0 16A D 2009 15.5 0.16 Free SW 0 0 D 2010 9 0.195 Free SW 0 0 4C C 2012 8.5 0.245 Free ND 0 0 1 E 2012 34 0.14 Free SW 0 0 3 D 2012 10.5 0.055 Total MW 0 0 7 D 2011 5 0.065 Free MW 0 0 19 G 2013 9.5 0.51 Free MW 0 0
Category 3 Sites Water Site Year CC Cl2 Cl2 Water E. Coliforms
52
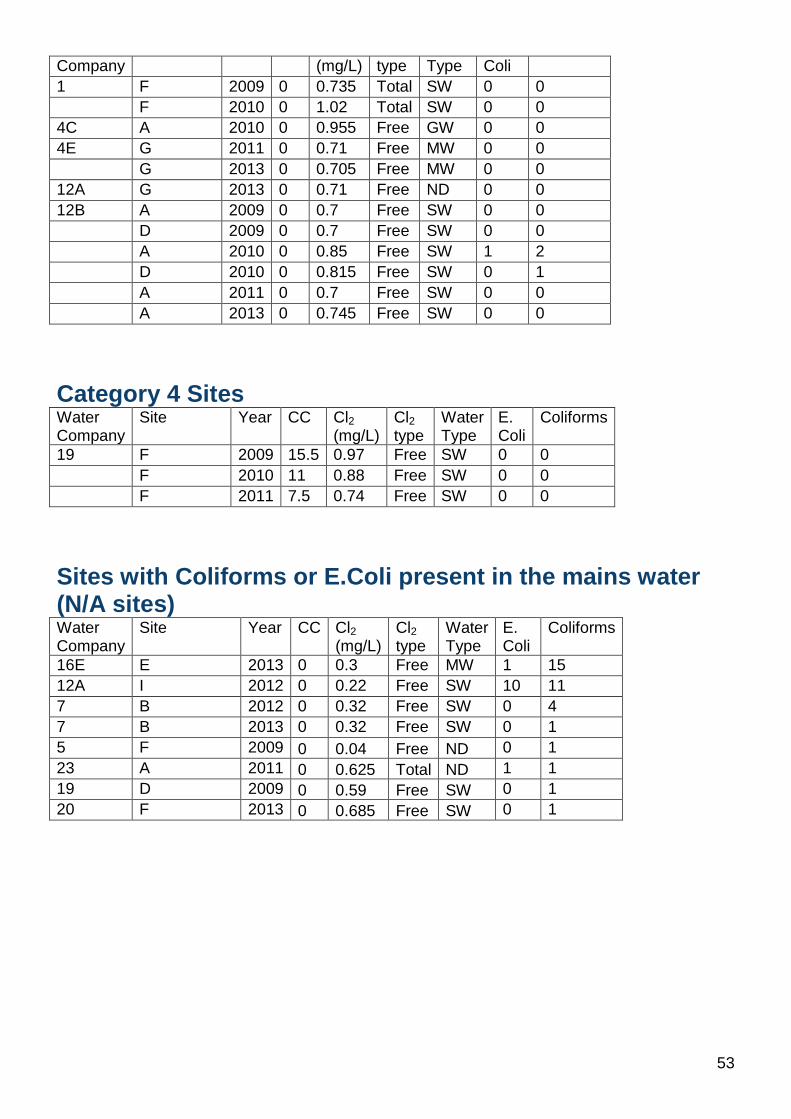
Company (mg/L) type Type Coli 1 F 2009 0 0.735 Total SW 0 0 F 2010 0 1.02 Total SW 0 0 4C A 2010 0 0.955 Free GW 0 0 4E G 2011 0 0.71 Free MW 0 0 G 2013 0 0.705 Free MW 0 0 12A G 2013 0 0.71 Free ND 0 0 12B A 2009 0 0.7 Free SW 0 0 D 2009 0 0.7 Free SW 0 0 A 2010 0 0.85 Free SW 1 2 D 2010 0 0.815 Free SW 0 1 A 2011 0 0.7 Free SW 0 0 A 2013 0 0.745 Free SW 0 0
Category 4 Sites Water Company
Site Year CC Cl2 (mg/L)
Cl2 type
Water Type
E. Coli
Coliforms
19 F 2009 15.5 0.97 Free SW 0 0 F 2010 11 0.88 Free SW 0 0 F 2011 7.5 0.74 Free SW 0 0
Sites with Coliforms or E.Coli present in the mains water (N/A sites) Water Company
Site Year CC Cl2 (mg/L)
Cl2 type
Water Type
E. Coli
Coliforms
16E E 2013 0 0.3 Free MW 1 15 12A I 2012 0 0.22 Free SW 10 11 7 B 2012 0 0.32 Free SW 0 4 7 B 2013 0 0.32 Free SW 0 1 5 F 2009 0 0.04 Free ND 0 1 23 A 2011 0 0.625 Total ND 1 1 19 D 2009 0 0.59 Free SW 0 1 20 F 2013 0 0.685 Free SW 0 1
53
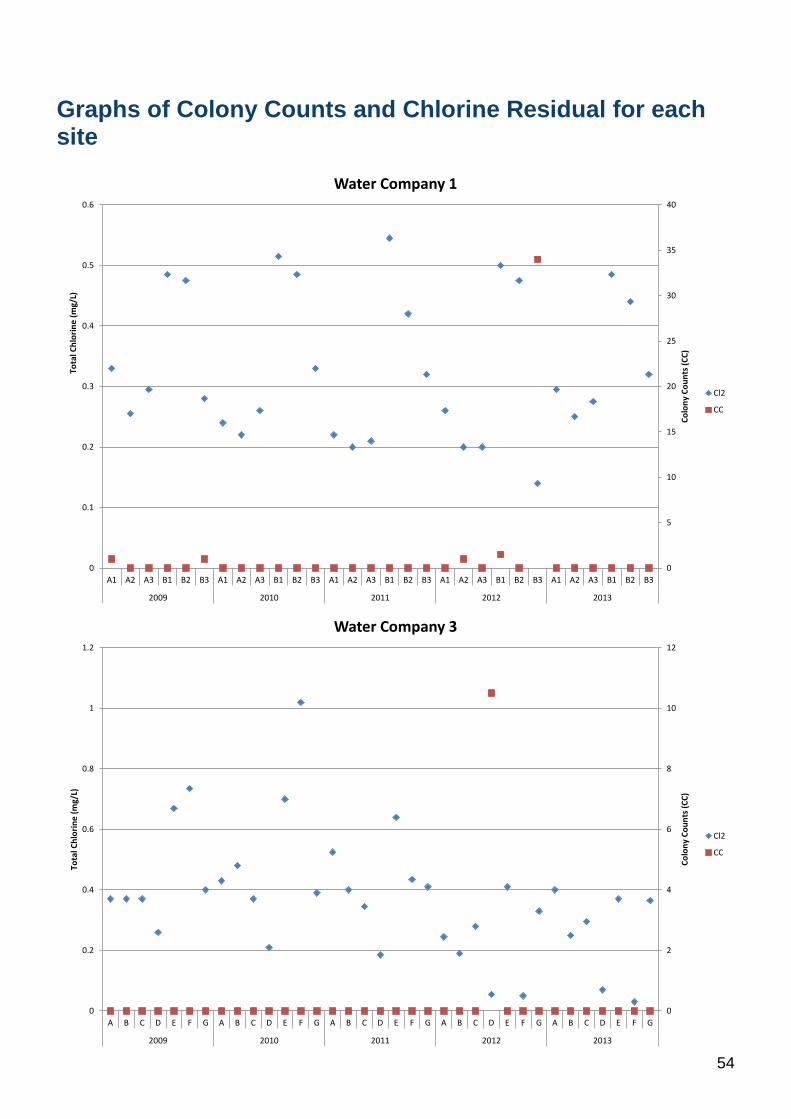
Graphs of Colony Counts and Chlorine Residual for each site
0
5
10
15
20
25
30
35
40
0
0.1
0.2
0.3
0.4
0.5
0.6
A1 A2 A3 B1 B2 B3 A1 A2 A3 B1 B2 B3 A1 A2 A3 B1 B2 B3 A1 A2 A3 B1 B2 B3 A1 A2 A3 B1 B2 B3
2009 2010 2011 2012 2013
Colo
ny C
ount
s (CC
)
Tota
l Chl
orin
e (m
g/L)
Water Company 1
Cl2
CC
0
2
4
6
8
10
12
0
0.2
0.4
0.6
0.8
1
1.2
A B C D E F G A B C D E F G A B C D E F G A B C D E F G A B C D E F G
2009 2010 2011 2012 2013
Colo
ny C
ount
s (CC
)
Tota
l Chl
orin
e (m
g/L)
Water Company 3
Cl2
CC
54
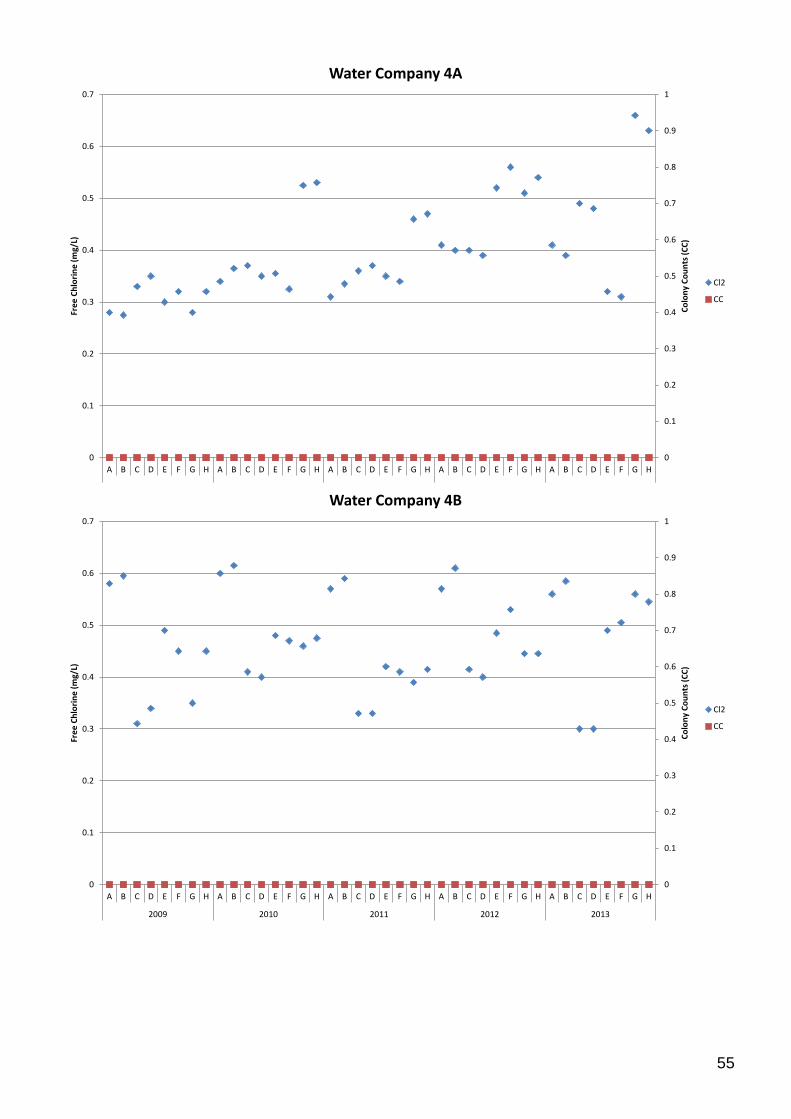
0
0.1
0.2
0.3
0.4
0.5
0.6
0.7
0.8
0.9
1
0
0.1
0.2
0.3
0.4
0.5
0.6
0.7
A B C D E F G H A B C D E F G H A B C D E F G H A B C D E F G H A B C D E F G H
2009 2010 2011 2012 2013
Colo
ny C
ount
s (CC
)
Free
Chl
orin
e (m
g/L)
Water Company 4A
Cl2
CC
0
0.1
0.2
0.3
0.4
0.5
0.6
0.7
0.8
0.9
1
0
0.1
0.2
0.3
0.4
0.5
0.6
0.7
A B C D E F G H A B C D E F G H A B C D E F G H A B C D E F G H A B C D E F G H
2009 2010 2011 2012 2013
Colo
ny C
ount
s (CC
)
Free
Chl
orin
e (m
g/L)
Water Company 4B
Cl2
CC
55
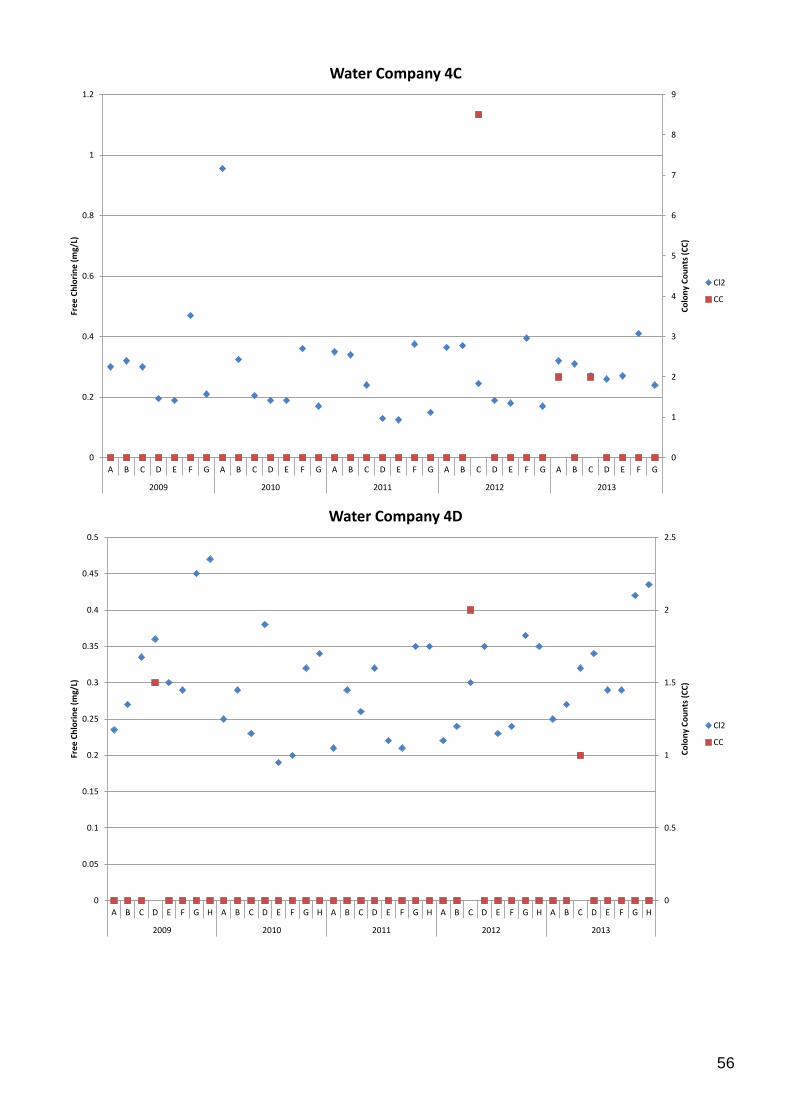
0
1
2
3
4
5
6
7
8
9
0
0.2
0.4
0.6
0.8
1
1.2
A B C D E F G A B C D E F G A B C D E F G A B C D E F G A B C D E F G
2009 2010 2011 2012 2013
Colo
ny C
ount
s (CC
)
Free
Chl
orin
e (m
g/L)
Water Company 4C
Cl2
CC
0
0.5
1
1.5
2
2.5
0
0.05
0.1
0.15
0.2
0.25
0.3
0.35
0.4
0.45
0.5
A B C D E F G H A B C D E F G H A B C D E F G H A B C D E F G H A B C D E F G H
2009 2010 2011 2012 2013
Colo
ny C
ount
s (CC
)
Free
Chl
orin
e (m
g/L)
Water Company 4D
Cl2
CC
56
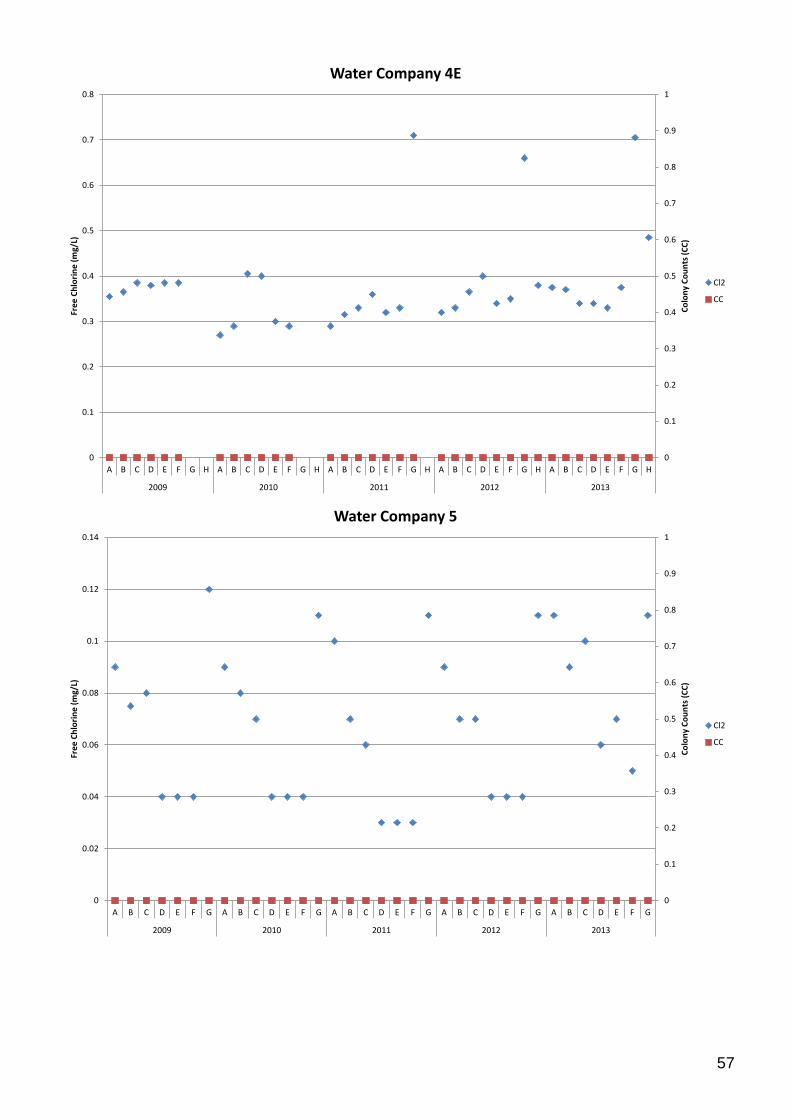
0
0.1
0.2
0.3
0.4
0.5
0.6
0.7
0.8
0.9
1
0
0.1
0.2
0.3
0.4
0.5
0.6
0.7
0.8
A B C D E F G H A B C D E F G H A B C D E F G H A B C D E F G H A B C D E F G H
2009 2010 2011 2012 2013
Colo
ny C
ount
s (CC
)
Free
Chl
orin
e (m
g/L)
Water Company 4E
Cl2
CC
0
0.1
0.2
0.3
0.4
0.5
0.6
0.7
0.8
0.9
1
0
0.02
0.04
0.06
0.08
0.1
0.12
0.14
A B C D E F G A B C D E F G A B C D E F G A B C D E F G A B C D E F G
2009 2010 2011 2012 2013
Colo
ny C
ount
s (CC
)
Free
Chl
orin
e (m
g/L)
Water Company 5
Cl2
CC
57
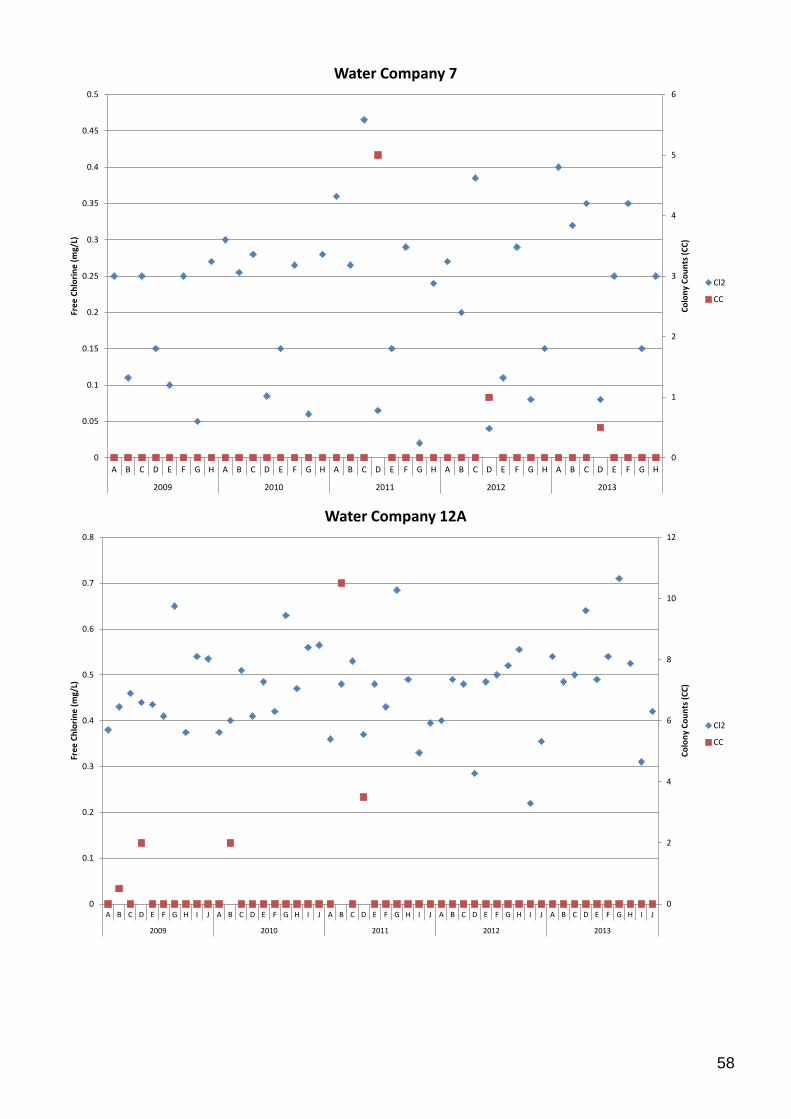
0
1
2
3
4
5
6
0
0.05
0.1
0.15
0.2
0.25
0.3
0.35
0.4
0.45
0.5
A B C D E F G H A B C D E F G H A B C D E F G H A B C D E F G H A B C D E F G H
2009 2010 2011 2012 2013
Colo
ny C
ount
s (CC
)
Free
Chl
orin
e (m
g/L)
Water Company 7
Cl2
CC
0
2
4
6
8
10
12
0
0.1
0.2
0.3
0.4
0.5
0.6
0.7
0.8
A B C D E F G H I J A B C D E F G H I J A B C D E F G H I J A B C D E F G H I J A B C D E F G H I J
2009 2010 2011 2012 2013
Colo
ny C
ount
s (CC
)
Free
Chl
orin
e (m
g/L)
Water Company 12A
Cl2
CC
58
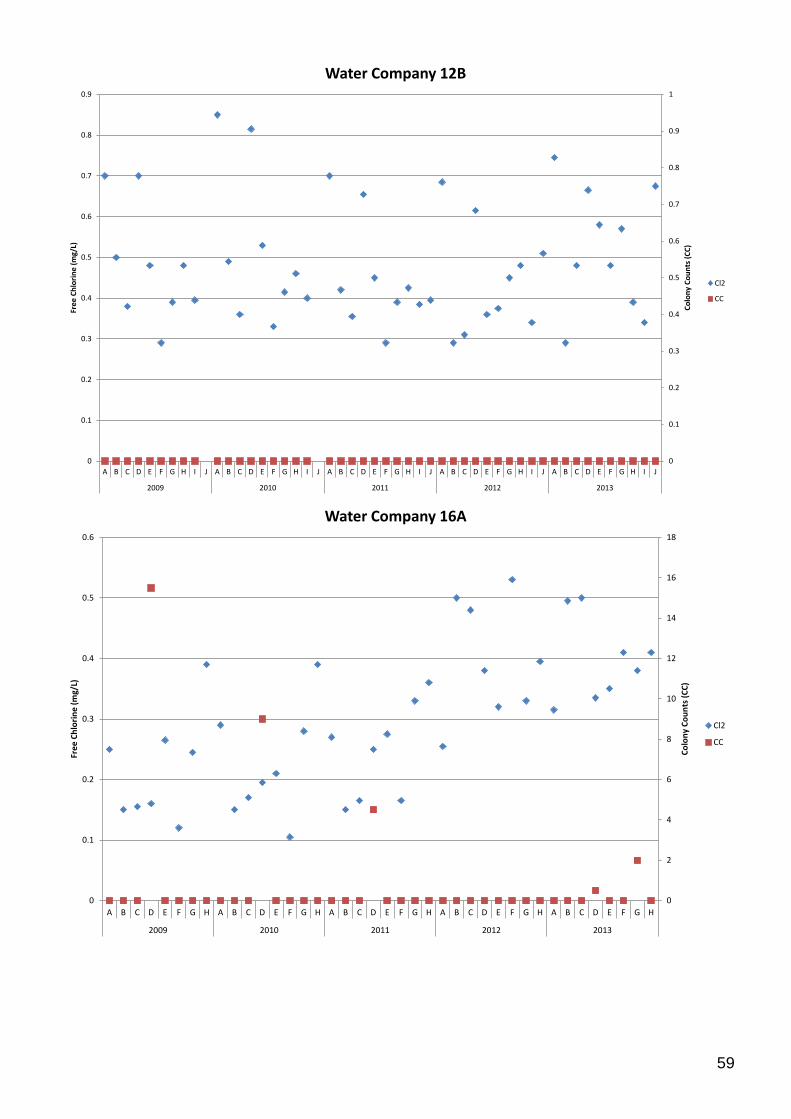
0
0.1
0.2
0.3
0.4
0.5
0.6
0.7
0.8
0.9
1
0
0.1
0.2
0.3
0.4
0.5
0.6
0.7
0.8
0.9
A B C D E F G H I J A B C D E F G H I J A B C D E F G H I J A B C D E F G H I J A B C D E F G H I J
2009 2010 2011 2012 2013
Colo
ny C
ount
s (CC
)
Free
Chl
orin
e (m
g/L)
Water Company 12B
Cl2
CC
0
2
4
6
8
10
12
14
16
18
0
0.1
0.2
0.3
0.4
0.5
0.6
A B C D E F G H A B C D E F G H A B C D E F G H A B C D E F G H A B C D E F G H
2009 2010 2011 2012 2013
Colo
ny C
ount
s (CC
)
Free
Chl
orin
e (m
g/L)
Water Company 16A
Cl2
CC
59
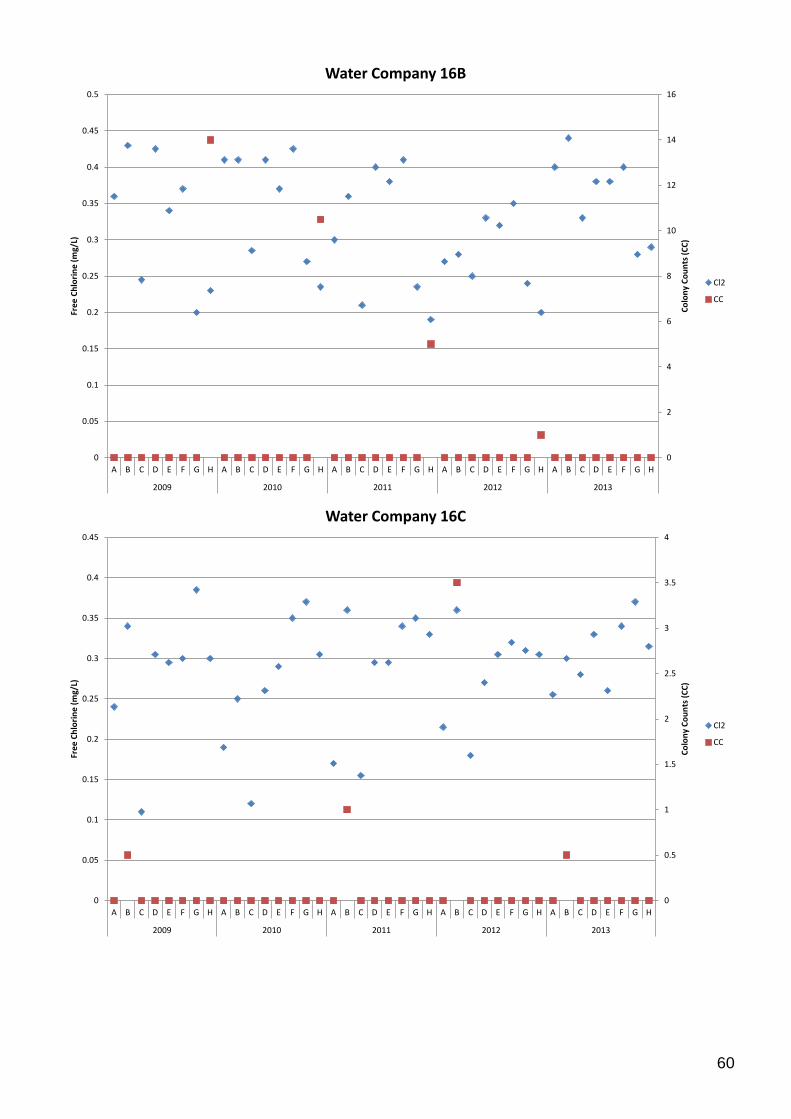
0
2
4
6
8
10
12
14
16
0
0.05
0.1
0.15
0.2
0.25
0.3
0.35
0.4
0.45
0.5
A B C D E F G H A B C D E F G H A B C D E F G H A B C D E F G H A B C D E F G H
2009 2010 2011 2012 2013
Colo
ny C
ount
s (CC
)
Free
Chl
orin
e (m
g/L)
Water Company 16B
Cl2
CC
0
0.5
1
1.5
2
2.5
3
3.5
4
0
0.05
0.1
0.15
0.2
0.25
0.3
0.35
0.4
0.45
A B C D E F G H A B C D E F G H A B C D E F G H A B C D E F G H A B C D E F G H
2009 2010 2011 2012 2013
Colo
ny C
ount
s (CC
)
Free
Chl
orin
e (m
g/L)
Water Company 16C
Cl2
CC
60
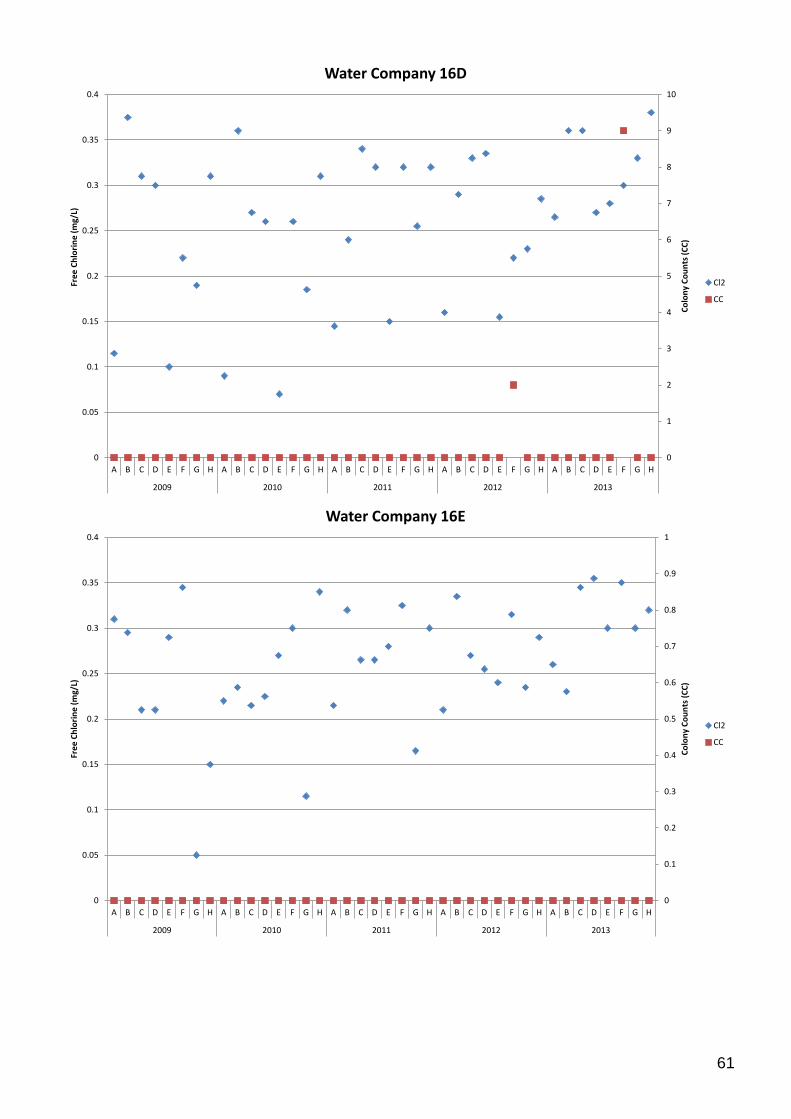
0
1
2
3
4
5
6
7
8
9
10
0
0.05
0.1
0.15
0.2
0.25
0.3
0.35
0.4
A B C D E F G H A B C D E F G H A B C D E F G H A B C D E F G H A B C D E F G H
2009 2010 2011 2012 2013
Colo
ny C
ount
s (CC
)
Free
Chl
orin
e (m
g/L)
Water Company 16D
Cl2
CC
0
0.1
0.2
0.3
0.4
0.5
0.6
0.7
0.8
0.9
1
0
0.05
0.1
0.15
0.2
0.25
0.3
0.35
0.4
A B C D E F G H A B C D E F G H A B C D E F G H A B C D E F G H A B C D E F G H
2009 2010 2011 2012 2013
Colo
ny C
ount
s (CC
)
Free
Chl
orin
e (m
g/L)
Water Company 16E
Cl2
CC
61
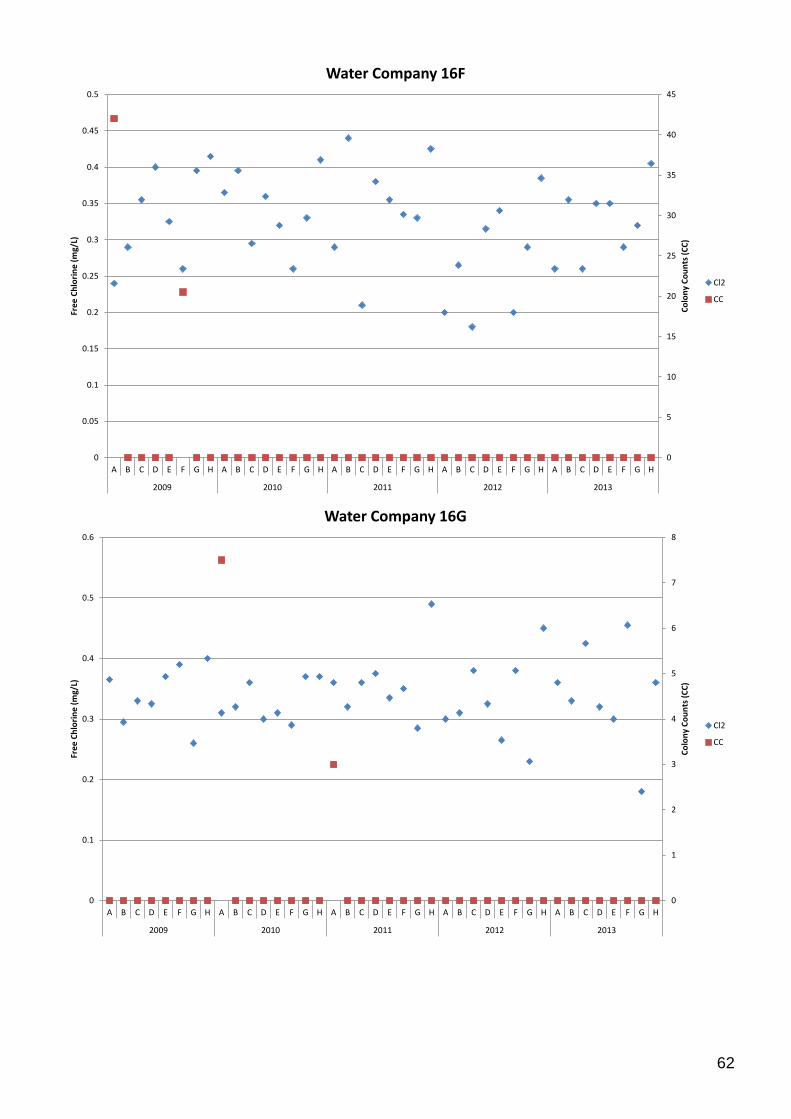
0
5
10
15
20
25
30
35
40
45
0
0.05
0.1
0.15
0.2
0.25
0.3
0.35
0.4
0.45
0.5
A B C D E F G H A B C D E F G H A B C D E F G H A B C D E F G H A B C D E F G H
2009 2010 2011 2012 2013
Colo
ny C
ount
s (CC
)
Free
Chl
orin
e (m
g/L)
Water Company 16F
Cl2
CC
0
1
2
3
4
5
6
7
8
0
0.1
0.2
0.3
0.4
0.5
0.6
A B C D E F G H A B C D E F G H A B C D E F G H A B C D E F G H A B C D E F G H
2009 2010 2011 2012 2013
Colo
ny C
ount
s (CC
)
Free
Chl
orin
e (m
g/L)
Water Company 16G
Cl2
CC
62
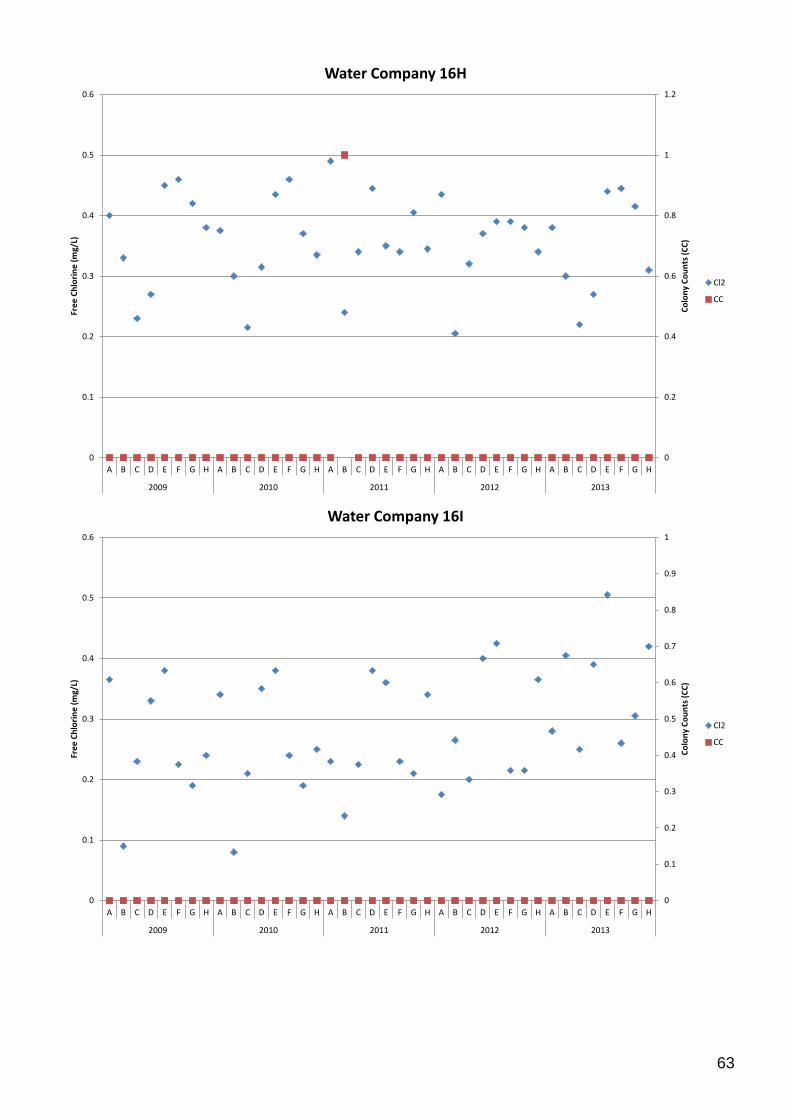
0
0.2
0.4
0.6
0.8
1
1.2
0
0.1
0.2
0.3
0.4
0.5
0.6
A B C D E F G H A B C D E F G H A B C D E F G H A B C D E F G H A B C D E F G H
2009 2010 2011 2012 2013
Colo
ny C
ount
s (CC
)
Free
Chl
orin
e (m
g/L)
Water Company 16H
Cl2
CC
0
0.1
0.2
0.3
0.4
0.5
0.6
0.7
0.8
0.9
1
0
0.1
0.2
0.3
0.4
0.5
0.6
A B C D E F G H A B C D E F G H A B C D E F G H A B C D E F G H A B C D E F G H
2009 2010 2011 2012 2013
Colo
ny C
ount
s (CC
)
Free
Chl
orin
e (m
g/L)
Water Company 16I
Cl2
CC
63
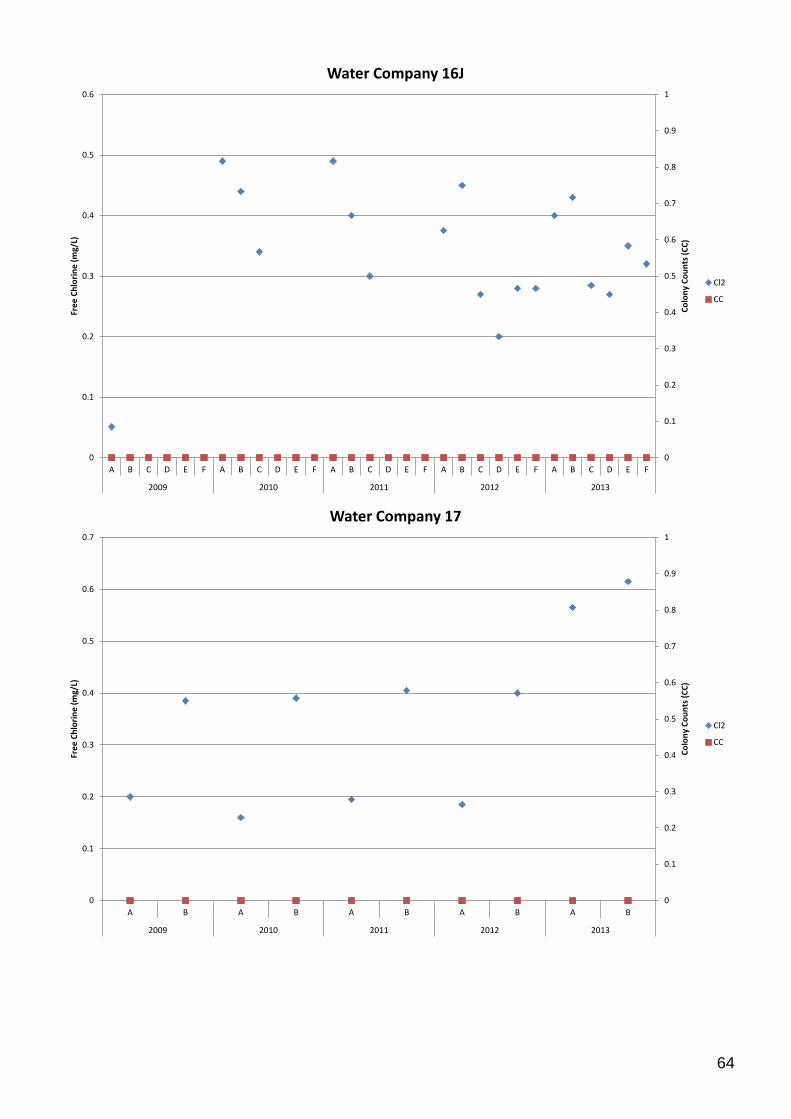
0
0.1
0.2
0.3
0.4
0.5
0.6
0.7
0.8
0.9
1
0
0.1
0.2
0.3
0.4
0.5
0.6
A B C D E F A B C D E F A B C D E F A B C D E F A B C D E F
2009 2010 2011 2012 2013
Colo
ny C
ount
s (CC
)
Free
Chl
orin
e (m
g/L)
Water Company 16J
Cl2
CC
0
0.1
0.2
0.3
0.4
0.5
0.6
0.7
0.8
0.9
1
0
0.1
0.2
0.3
0.4
0.5
0.6
0.7
A B A B A B A B A B
2009 2010 2011 2012 2013
Colo
ny C
ount
s (CC
)
Free
Chl
orin
e (m
g/L)
Water Company 17
Cl2
CC
64
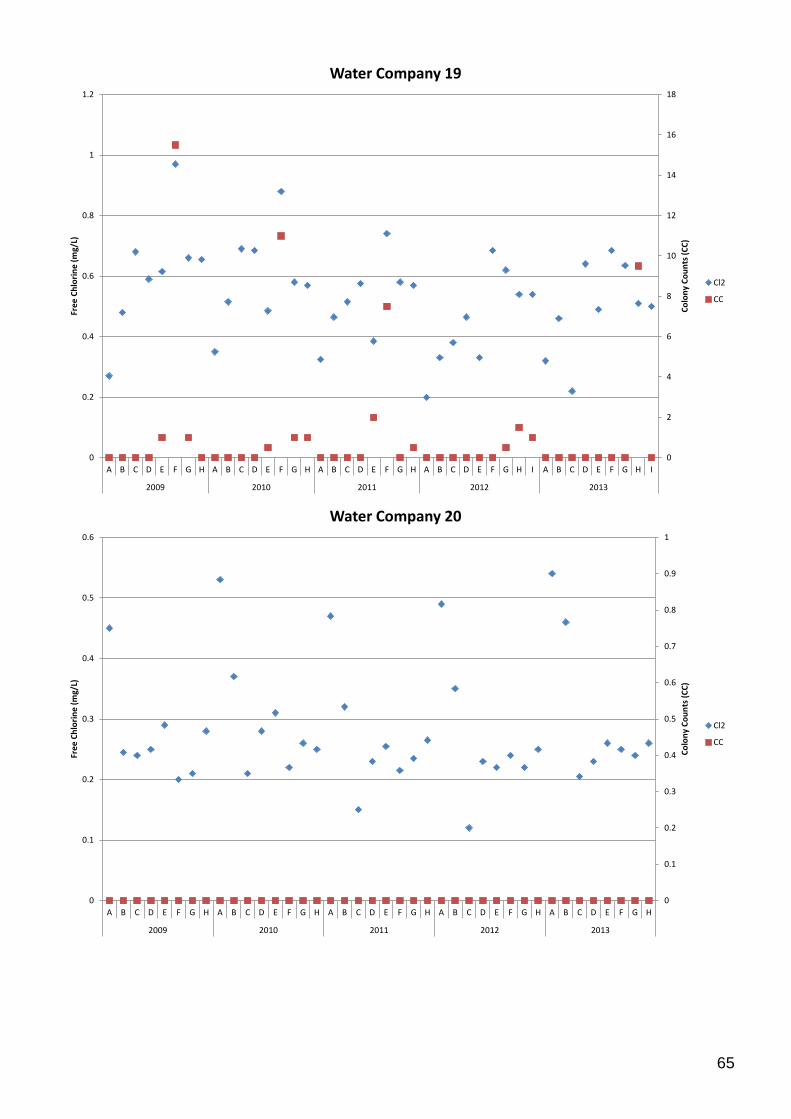
0
2
4
6
8
10
12
14
16
18
0
0.2
0.4
0.6
0.8
1
1.2
A B C D E F G H A B C D E F G H A B C D E F G H A B C D E F G H I A B C D E F G H I
2009 2010 2011 2012 2013
Colo
ny C
ount
s (CC
)
Free
Chl
orin
e (m
g/L)
Water Company 19
Cl2
CC
0
0.1
0.2
0.3
0.4
0.5
0.6
0.7
0.8
0.9
1
0
0.1
0.2
0.3
0.4
0.5
0.6
A B C D E F G H A B C D E F G H A B C D E F G H A B C D E F G H A B C D E F G H
2009 2010 2011 2012 2013
Colo
ny C
ount
s (CC
)
Free
Chl
orin
e (m
g/L)
Water Company 20
Cl2
CC
65
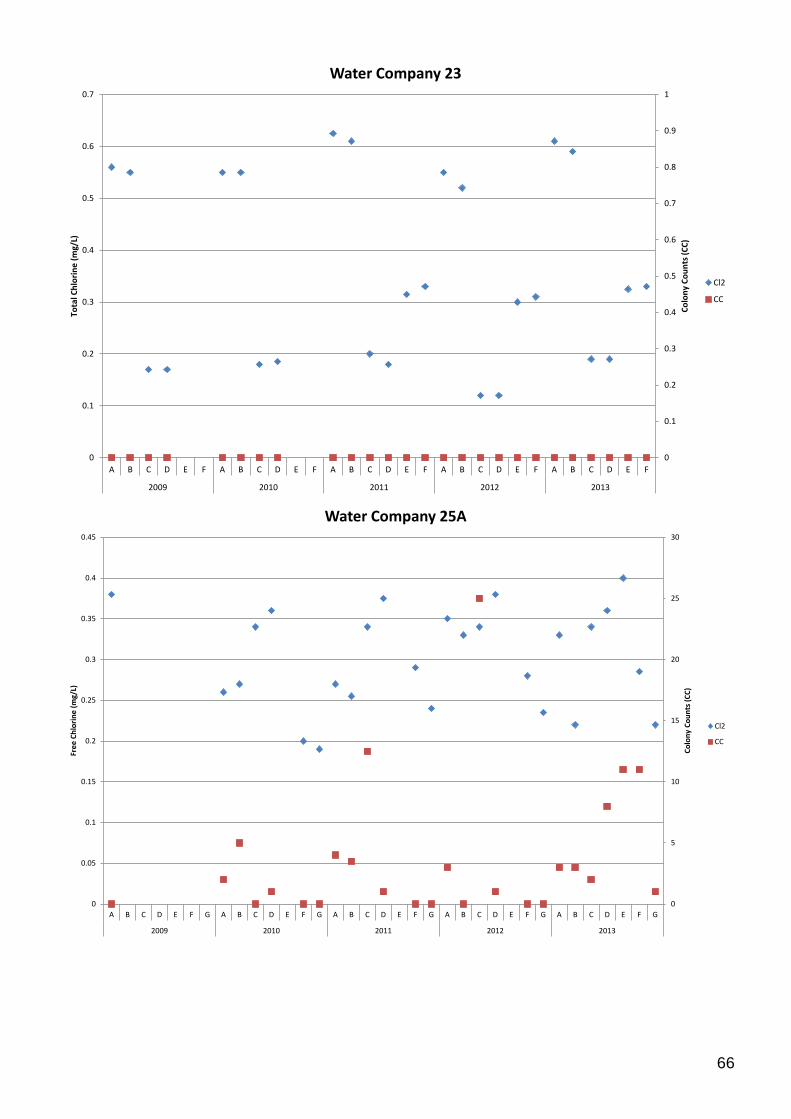
0
0.1
0.2
0.3
0.4
0.5
0.6
0.7
0.8
0.9
1
0
0.1
0.2
0.3
0.4
0.5
0.6
0.7
A B C D E F A B C D E F A B C D E F A B C D E F A B C D E F
2009 2010 2011 2012 2013
Colo
ny C
ount
s (CC
)
Tota
l Chl
orin
e (m
g/L)
Water Company 23
Cl2
CC
0
5
10
15
20
25
30
0
0.05
0.1
0.15
0.2
0.25
0.3
0.35
0.4
0.45
A B C D E F G A B C D E F G A B C D E F G A B C D E F G A B C D E F G
2009 2010 2011 2012 2013
Colo
ny C
ount
s (CC
)
Free
Chl
orin
e (m
g/L)
Water Company 25A
Cl2
CC
66
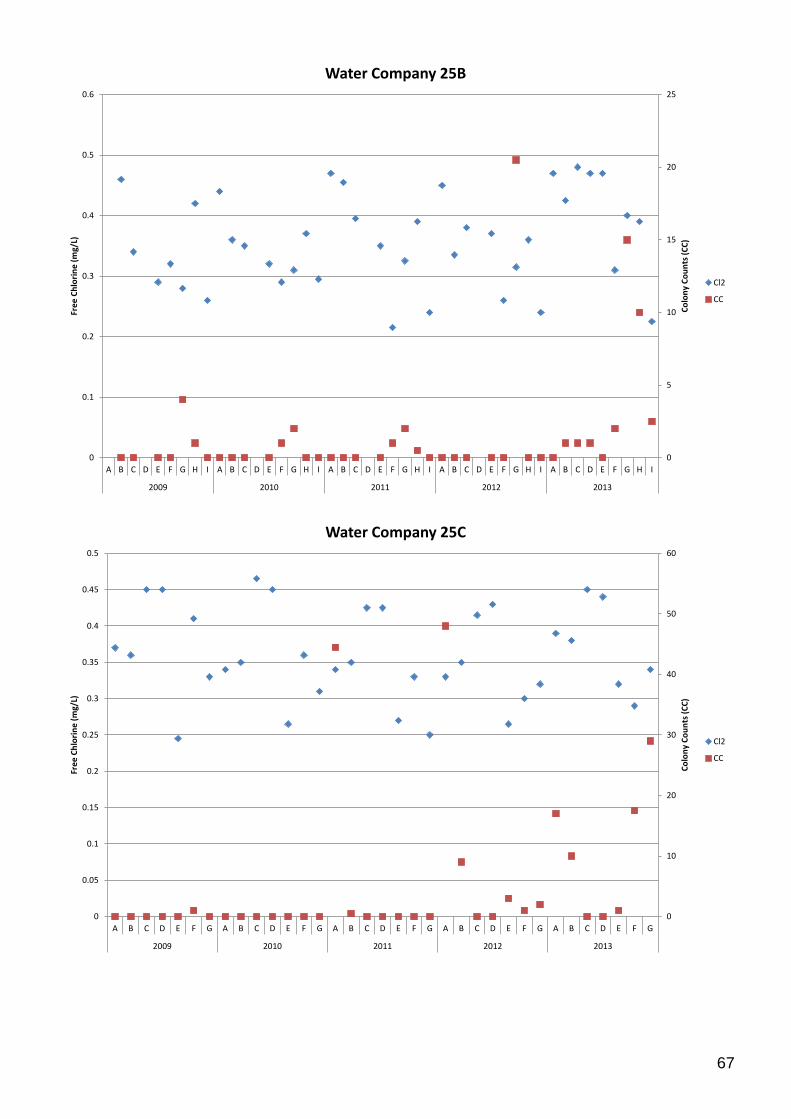
0
5
10
15
20
25
0
0.1
0.2
0.3
0.4
0.5
0.6
A B C D E F G H I A B C D E F G H I A B C D E F G H I A B C D E F G H I A B C D E F G H I
2009 2010 2011 2012 2013
Colo
ny C
ount
s (CC
)
Free
Chl
orin
e (m
g/L)
Water Company 25B
Cl2
CC
0
10
20
30
40
50
60
0
0.05
0.1
0.15
0.2
0.25
0.3
0.35
0.4
0.45
0.5
A B C D E F G A B C D E F G A B C D E F G A B C D E F G A B C D E F G
2009 2010 2011 2012 2013
Colo
ny C
ount
s (CC
)
Free
Chl
orin
e (m
g/L)
Water Company 25C
Cl2
CC
67
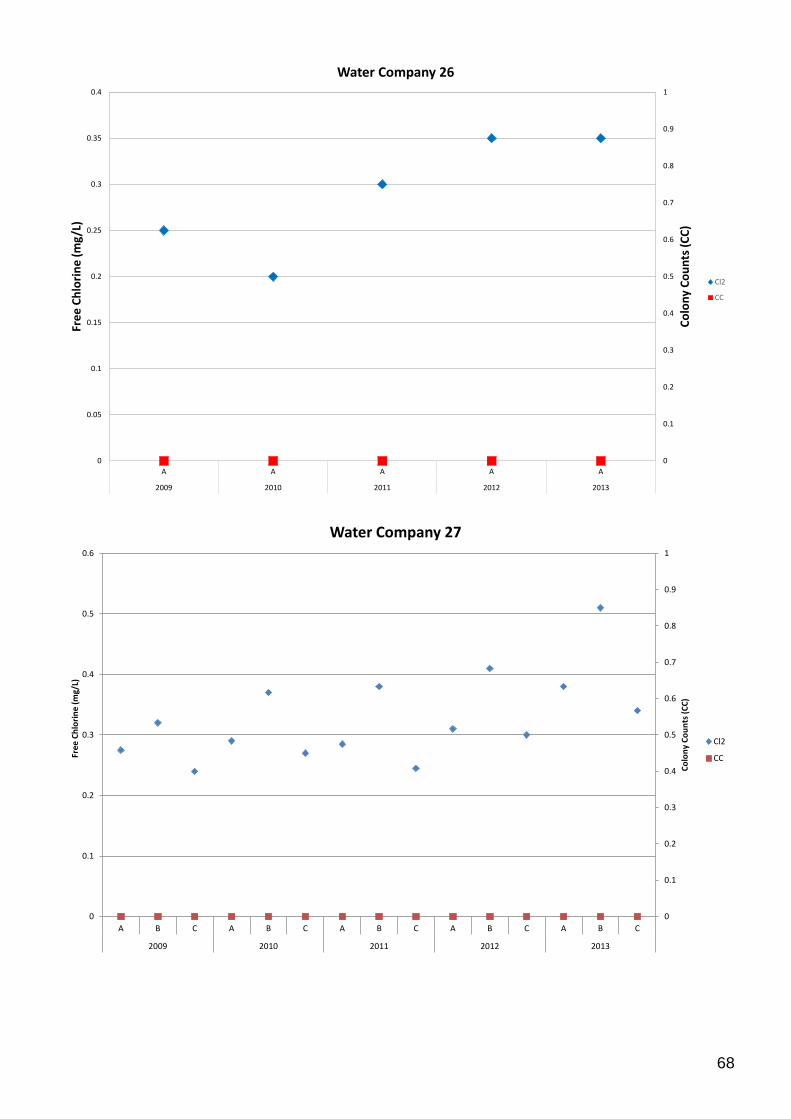
0
0.1
0.2
0.3
0.4
0.5
0.6
0.7
0.8
0.9
1
0
0.05
0.1
0.15
0.2
0.25
0.3
0.35
0.4
A A A A A
2009 2010 2011 2012 2013
Colo
ny C
ount
s (CC
)
Free
Chl
orin
e (m
g/L)
Water Company 26
Cl2
CC
0
0.1
0.2
0.3
0.4
0.5
0.6
0.7
0.8
0.9
1
0
0.1
0.2
0.3
0.4
0.5
0.6
A B C A B C A B C A B C A B C
2009 2010 2011 2012 2013
Colo
ny C
ount
s (CC
)
Free
Chl
orin
e (m
g/L)
Water Company 27
Cl2
CC
68
Appendix 2
DRINKING WATER INSPECTORATE Area 7E, 9 Millbank c/o Nobel House 17 Smith Square London SW1P 3JR Direct Line: Mobile: Enquiries: E-mail: DWI Website: http://www.dwi.gov.uk
DWI Ref.: WT1291 XX April 2014 Dear Day to day contacts Request for assistance with DWI research project The purpose of this letter is to seek your assistance with a DWI funded project about disinfection by-products (DBP’s) in distribution. Regulated and measured at consumer taps, and formed by the reaction of chemical disinfectants with organic matter found naturally in source water, disinfection by-products and the control of these have been studied for years. Both public and private drinking water regulations in England and Wales require the owner / operator of a drinking water supply to design, control and maintain every disinfection process to minimise disinfection by-products without compromising the effectiveness of the disinfection process. Typically, chemical disinfectants are added to drinking water at treatment works. However, where the distribution network is extensive it is sometimes necessary to add or boost disinfectant concentrations in the network to ensure a residual level of disinfectant reaches the farthest point of the network. DWI recently awarded Cranfield University a contract to carry out work to help understand more about the formation of disinfection by-products in drinking water across England and Wales where the water is subject to booster chlorination in distribution. This work will help inform water companies risk assessments and contribute to best practice for management of disinfection by products, in support of the Inspectorate’s role in ensuring water supplies remain safe and compliant with legislation. We would greatly appreciate your assistance with this project, which involves providing information about the location of booster units within your company (as per the table below) to enable the selection of sites that will be studied for a period of one year. Selected sites would be sampled once per month over one year. The project team would be grateful for any support during the study period and we look forward to working collaboratively to better understand the nature of DBP formation where booster chlorination is practiced should any of your units / sites be selected for further study. QUESTION RESPONSE Do you practice booster chlorination in your distribution systems? (If yes, please
69
answer the questions below for each location where booster chlorination is used) Where is booster chlorination used? (Location)
Why do you use booster chlorination in these locations?
Is there a set point for residual chlorine after the booster chlorination is implemented?
What data is available that is associated with booster chlorination? (e.g. chlorine residual data, THM data, water age)
What information on the associated treatment works is available? (e.g. source water data, treatment processes, extent of blending with other sources / supplies)
Who would be the person to contact to access this information and, in the event that the location is selected for sampling, the contact to arrange sampling?
Do you know where the sampling locations are in relation to the booster chlorination and do you have time to enable a member of Cranfield staff to access these locations. Note that sampling will be carried out monthly over 1 year.
Please respond to ……(of Cranfield University) using ....... or using the above email address, either; giving your company’s support for this work and agreement to assist where needed; or, otherwise, including the response to the table of questions. As usual, the names of companies and the sites studied will be anonymised in any published reports. Please don’t hesitate to contact me if you have any queries regarding this letter. Yours sincerely Inspector
70
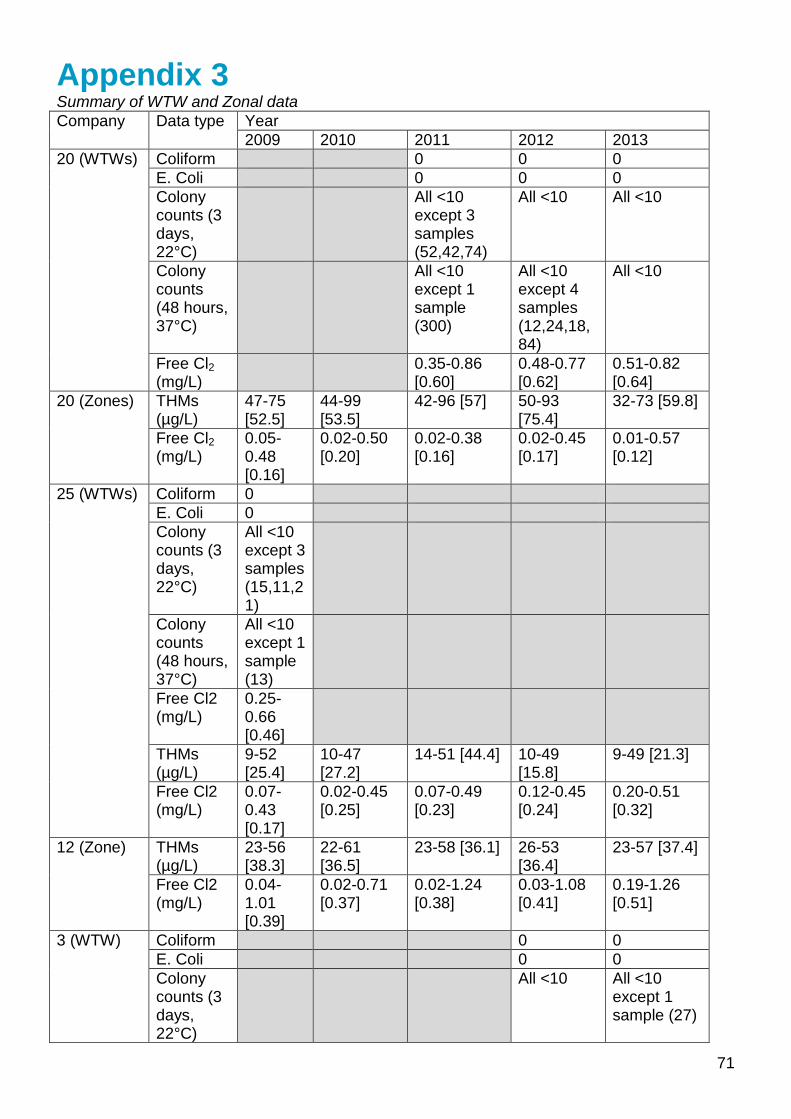
Appendix 3 Summary of WTW and Zonal data Company Data type Year
2009 2010 2011 2012 2013 20 (WTWs) Coliform 0 0 0
E. Coli 0 0 0 Colony counts (3 days, 22°C)
All <10 except 3 samples (52,42,74)
All <10 All <10
Colony counts (48 hours, 37°C)
All <10 except 1 sample (300)
All <10 except 4 samples (12,24,18,84)
All <10
Free Cl2 (mg/L)
0.35-0.86 [0.60]
0.48-0.77 [0.62]
0.51-0.82 [0.64]
20 (Zones) THMs (µg/L)
47-75 [52.5]
44-99 [53.5]
42-96 [57] 50-93 [75.4]
32-73 [59.8]
Free Cl2 (mg/L)
0.05-0.48 [0.16]
0.02-0.50 [0.20]
0.02-0.38 [0.16]
0.02-0.45 [0.17]
0.01-0.57 [0.12]
25 (WTWs) Coliform 0 E. Coli 0 Colony counts (3 days, 22°C)
All <10 except 3 samples (15,11,21)
Colony counts (48 hours, 37°C)
All <10 except 1 sample (13)
Free Cl2 (mg/L)
0.25-0.66 [0.46]
THMs (µg/L)
9-52 [25.4]
10-47 [27.2]
14-51 [44.4] 10-49 [15.8]
9-49 [21.3]
Free Cl2 (mg/L)
0.07-0.43 [0.17]
0.02-0.45 [0.25]
0.07-0.49 [0.23]
0.12-0.45 [0.24]
0.20-0.51 [0.32]
12 (Zone) THMs (µg/L)
23-56 [38.3]
22-61 [36.5]
23-58 [36.1] 26-53 [36.4]
23-57 [37.4]
Free Cl2 (mg/L)
0.04-1.01 [0.39]
0.02-0.71 [0.37]
0.02-1.24 [0.38]
0.03-1.08 [0.41]
0.19-1.26 [0.51]
3 (WTW) Coliform 0 0 E. Coli 0 0 Colony counts (3 days, 22°C)
All <10 All <10 except 1 sample (27)
71

Colony counts (48 hours, 37°C)
All <10 All <10
Free Cl2 (mg/L)
0.32-0.48 [0.39]
0.29-0.45 [0.37]
Grey boxes are where no data was available
72
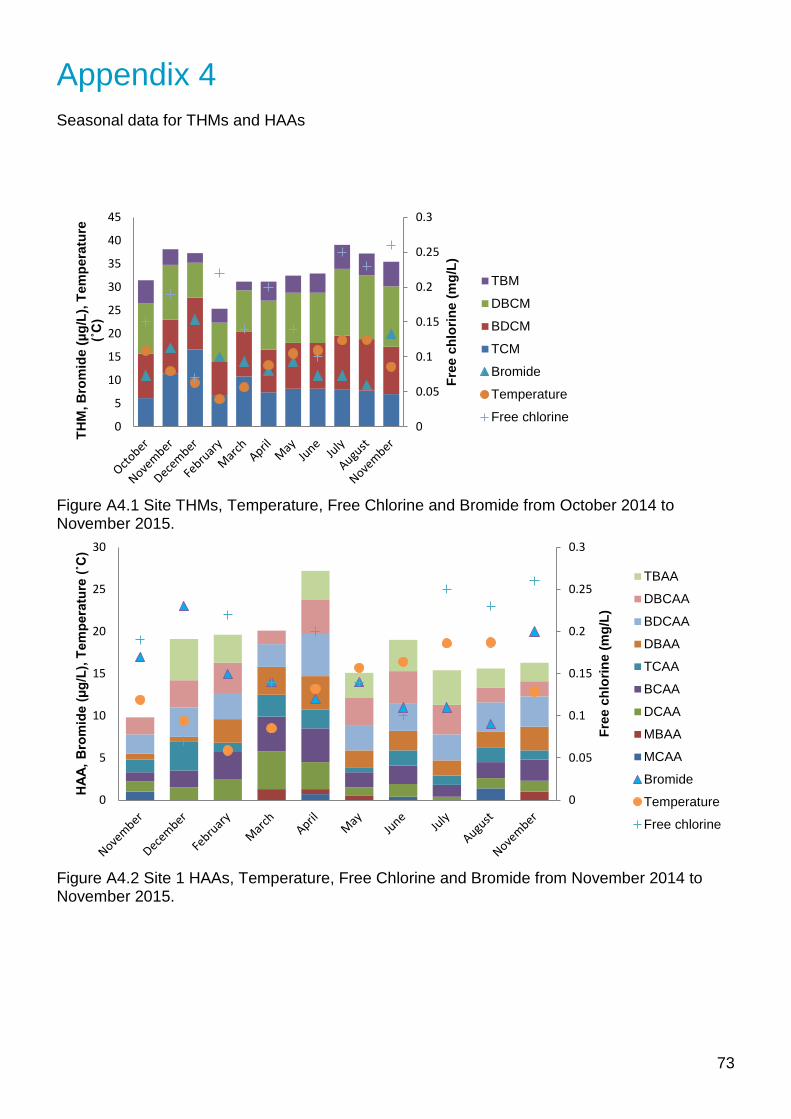
Appendix 4 Seasonal data for THMs and HAAs
Figure A4.1 Site THMs, Temperature, Free Chlorine and Bromide from October 2014 to November 2015.
Figure A4.2 Site 1 HAAs, Temperature, Free Chlorine and Bromide from November 2014 to November 2015.
0
0.05
0.1
0.15
0.2
0.25
0.3
0
5
10
15
20
25
30
35
40
45
Free
chl
orin
e (m
g/L)
THM
, Bro
mid
e (µ
g/L)
, Tem
pera
ture
(˚C
)
TBM
DBCM
BDCM
TCM
Bromide
Temperature
Free chlorine
0
0.05
0.1
0.15
0.2
0.25
0.3
0
5
10
15
20
25
30
Free
chl
orin
e (m
g/L)
HAA
, Bro
mid
e (µ
g/L)
, Tem
pera
ture
(˚C
)
TBAA
DBCAA
BDCAA
DBAA
TCAA
BCAA
DCAA
MBAA
MCAA
Bromide
Temperature
Free chlorine
73
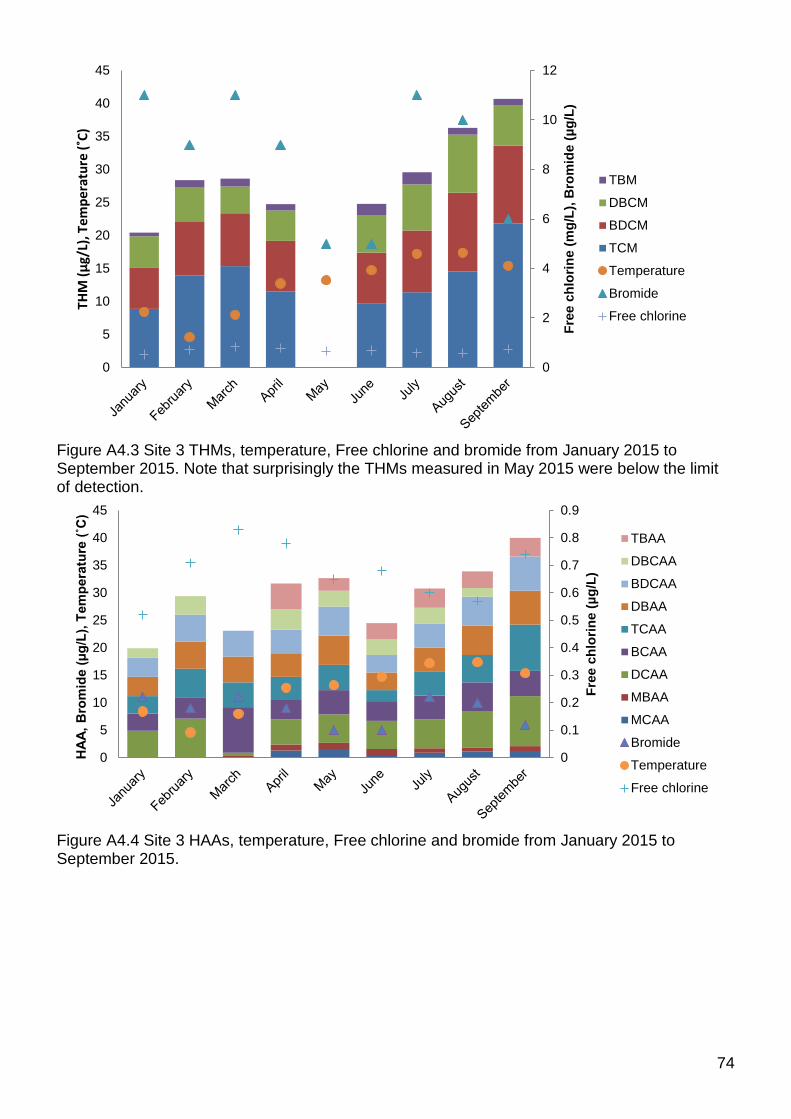
Figure A4.3 Site 3 THMs, temperature, Free chlorine and bromide from January 2015 to September 2015. Note that surprisingly the THMs measured in May 2015 were below the limit of detection.
Figure A4.4 Site 3 HAAs, temperature, Free chlorine and bromide from January 2015 to September 2015.
0
2
4
6
8
10
12
0
5
10
15
20
25
30
35
40
45
Free
chl
orin
e (m
g/L)
, Bro
mid
e (µ
g/L)
THM
(µg/
L), T
empe
ratu
re (˚
C)
TBM
DBCM
BDCM
TCM
Temperature
Bromide
Free chlorine
0
0.1
0.2
0.3
0.4
0.5
0.6
0.7
0.8
0.9
0
5
10
15
20
25
30
35
40
45
Free
chl
orin
e (µ
g/L)
HA
A, B
rom
ide
(µg/
L), T
empe
ratu
re (˚
C)
TBAA
DBCAA
BDCAA
DBAA
TCAA
BCAA
DCAA
MBAA
MCAA
Bromide
Temperature
Free chlorine
74
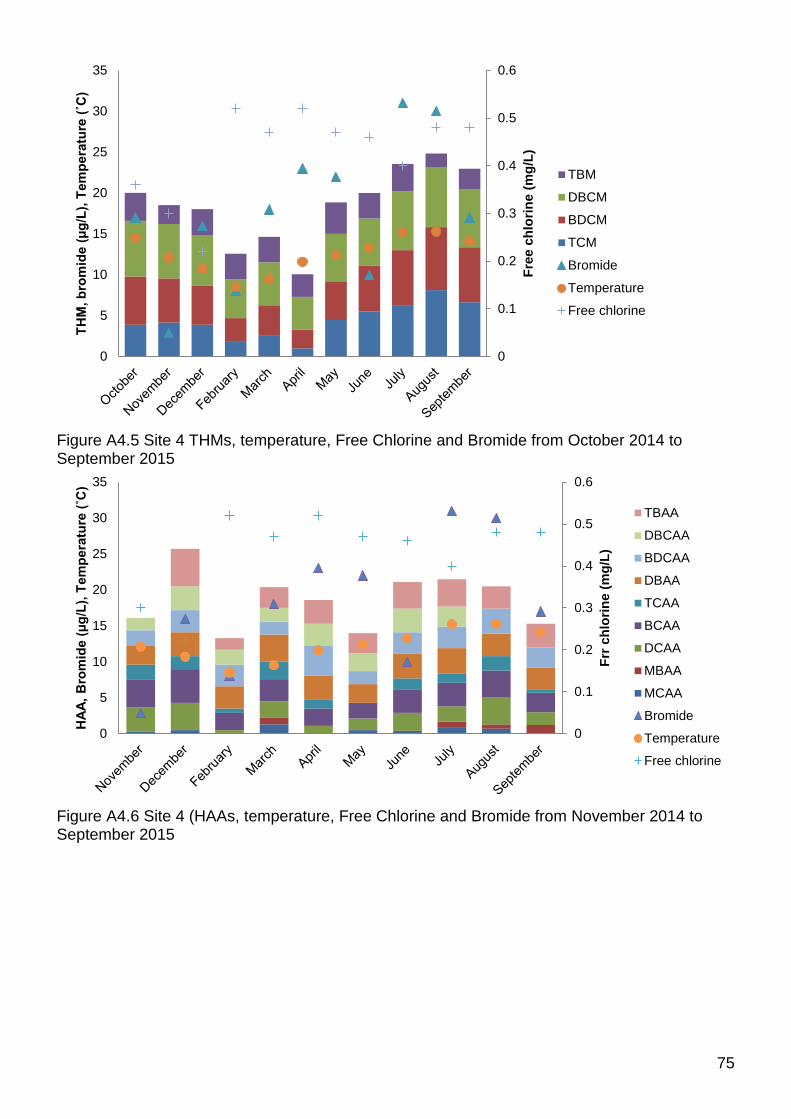
Figure A4.5 Site 4 THMs, temperature, Free Chlorine and Bromide from October 2014 to September 2015
Figure A4.6 Site 4 (HAAs, temperature, Free Chlorine and Bromide from November 2014 to September 2015
0
0.1
0.2
0.3
0.4
0.5
0.6
0
5
10
15
20
25
30
35
Free
chl
orin
e (m
g/L)
THM
, bro
mid
e (µ
g/L)
, Tem
pera
ture
(˚C
)
TBM
DBCM
BDCM
TCM
Bromide
Temperature
Free chlorine
0
0.1
0.2
0.3
0.4
0.5
0.6
0
5
10
15
20
25
30
35
Frr c
hlor
ine
(mg/
L)
HA
A, B
rom
ide
(µg/
L), T
empe
ratu
re (˚
C)
TBAA
DBCAA
BDCAA
DBAA
TCAA
BCAA
DCAA
MBAA
MCAA
Bromide
Temperature
Free chlorine
75
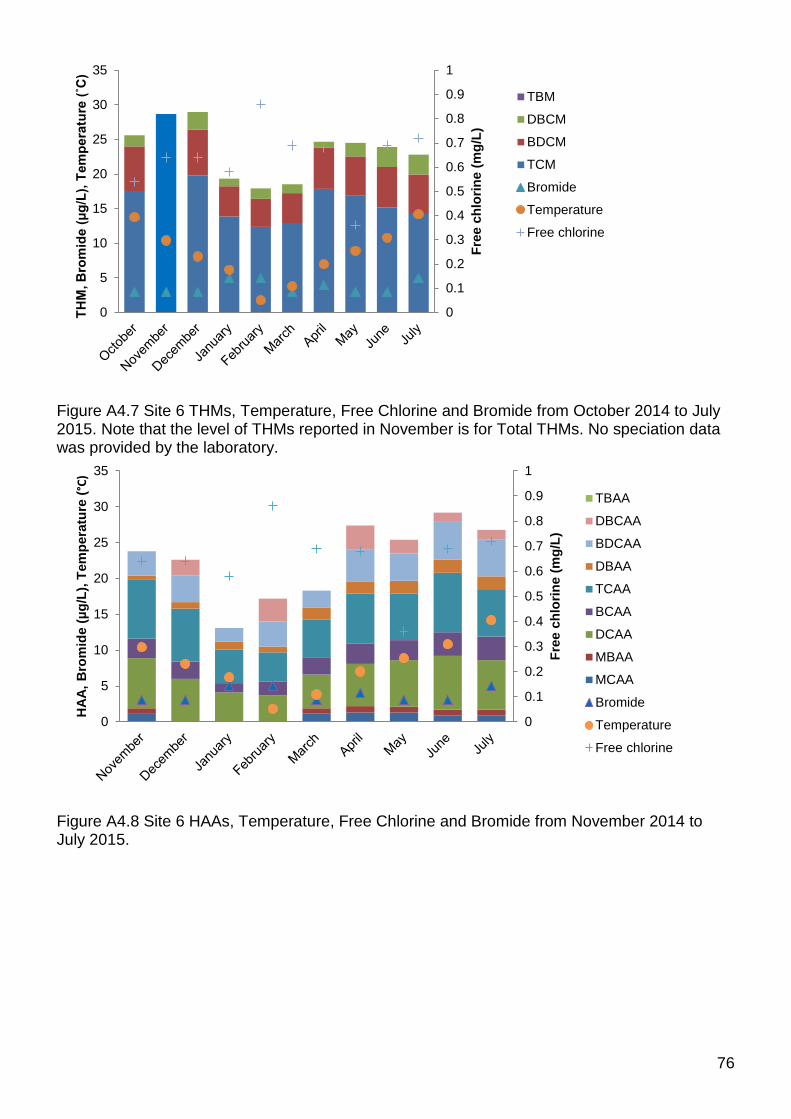
Figure A4.7 Site 6 THMs, Temperature, Free Chlorine and Bromide from October 2014 to July 2015. Note that the level of THMs reported in November is for Total THMs. No speciation data was provided by the laboratory.
Figure A4.8 Site 6 HAAs, Temperature, Free Chlorine and Bromide from November 2014 to July 2015.
0
0.1
0.2
0.3
0.4
0.5
0.6
0.7
0.8
0.9
1
0
5
10
15
20
25
30
35
Free
chl
orin
e (m
g/L)
THM
, Bro
mid
e (µ
g/L)
, Tem
pera
ture
(˚C
)TBM
DBCM
BDCM
TCM
Bromide
Temperature
Free chlorine
0
0.1
0.2
0.3
0.4
0.5
0.6
0.7
0.8
0.9
1
0
5
10
15
20
25
30
35
Free
chl
orin
e (m
g/L)
HA
A, B
rom
ide
(µg/
L), T
empe
ratu
re (°
C)
TBAA
DBCAA
BDCAA
DBAA
TCAA
BCAA
DCAA
MBAA
MCAA
Bromide
Temperature
Free chlorine
76
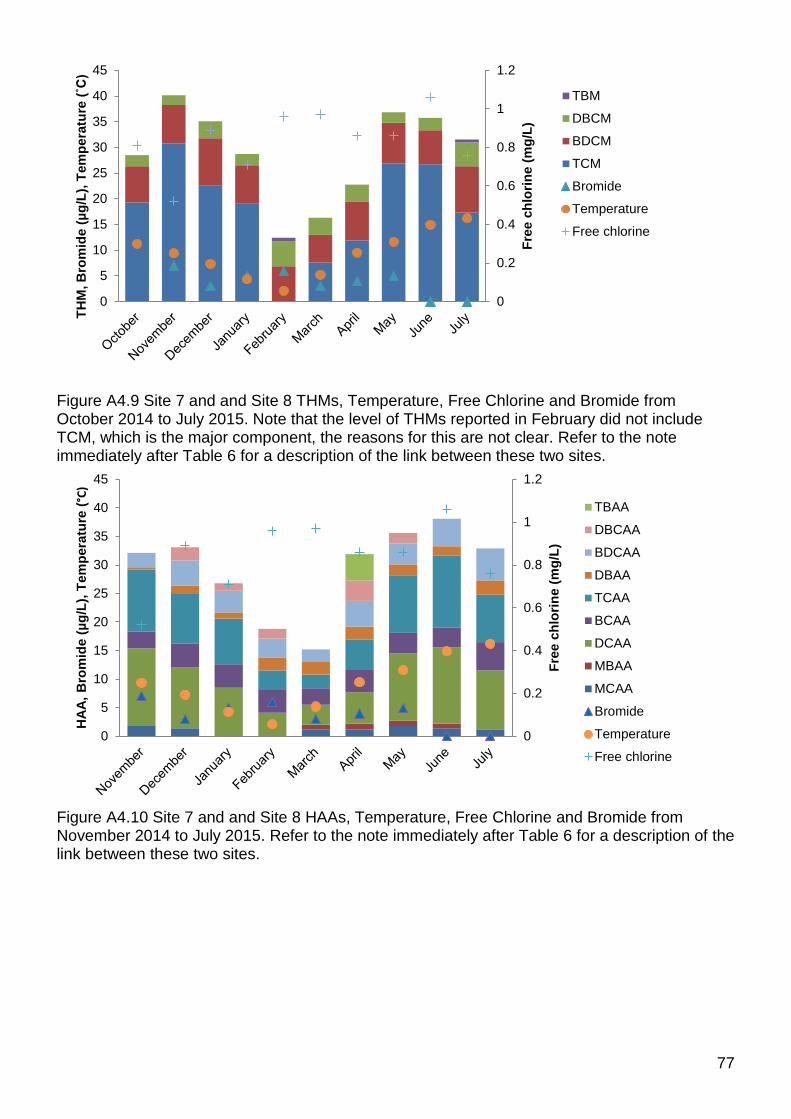
Figure A4.9 Site 7 and and Site 8 THMs, Temperature, Free Chlorine and Bromide from October 2014 to July 2015. Note that the level of THMs reported in February did not include TCM, which is the major component, the reasons for this are not clear. Refer to the note immediately after Table 6 for a description of the link between these two sites.
Figure A4.10 Site 7 and and Site 8 HAAs, Temperature, Free Chlorine and Bromide from November 2014 to July 2015. Refer to the note immediately after Table 6 for a description of the link between these two sites.
0
0.2
0.4
0.6
0.8
1
1.2
0
5
10
15
20
25
30
35
40
45
Free
chl
orin
e (m
g/L)
THM
, Bro
mid
e (µ
g/L)
, Tem
pera
ture
(˚C
)TBM
DBCM
BDCM
TCM
Bromide
Temperature
Free chlorine
0
0.2
0.4
0.6
0.8
1
1.2
0
5
10
15
20
25
30
35
40
45
Free
chl
orin
e (m
g/L)
HA
A, B
rom
ide
(µg/
L), T
empe
ratu
re (°
C)
TBAA
DBCAA
BDCAA
DBAA
TCAA
BCAA
DCAA
MBAA
MCAA
Bromide
Temperature
Free chlorine
77
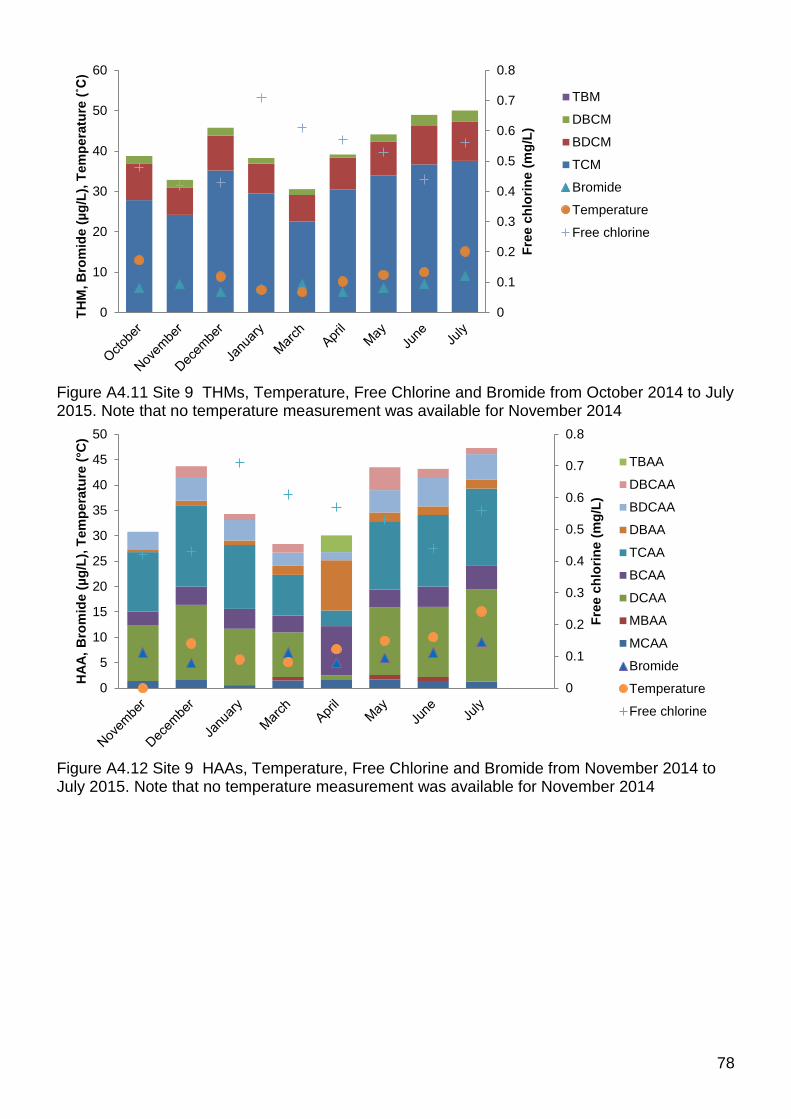
Figure A4.11 Site 9 THMs, Temperature, Free Chlorine and Bromide from October 2014 to July 2015. Note that no temperature measurement was available for November 2014
Figure A4.12 Site 9 HAAs, Temperature, Free Chlorine and Bromide from November 2014 to July 2015. Note that no temperature measurement was available for November 2014
0
0.1
0.2
0.3
0.4
0.5
0.6
0.7
0.8
0
10
20
30
40
50
60
Free
chl
orin
e (m
g/L)
THM
, Bro
mid
e (µ
g/L)
, Tem
pera
ture
(˚C
)TBM
DBCM
BDCM
TCM
Bromide
Temperature
Free chlorine
0
0.1
0.2
0.3
0.4
0.5
0.6
0.7
0.8
0
5
10
15
20
25
30
35
40
45
50
Free
chl
orin
e (m
g/L)
HA
A, B
rom
ide
(µg/
L), T
empe
ratu
re (°
C)
TBAA
DBCAA
BDCAA
DBAA
TCAA
BCAA
DCAA
MBAA
MCAA
Bromide
Temperature
Free chlorine
78
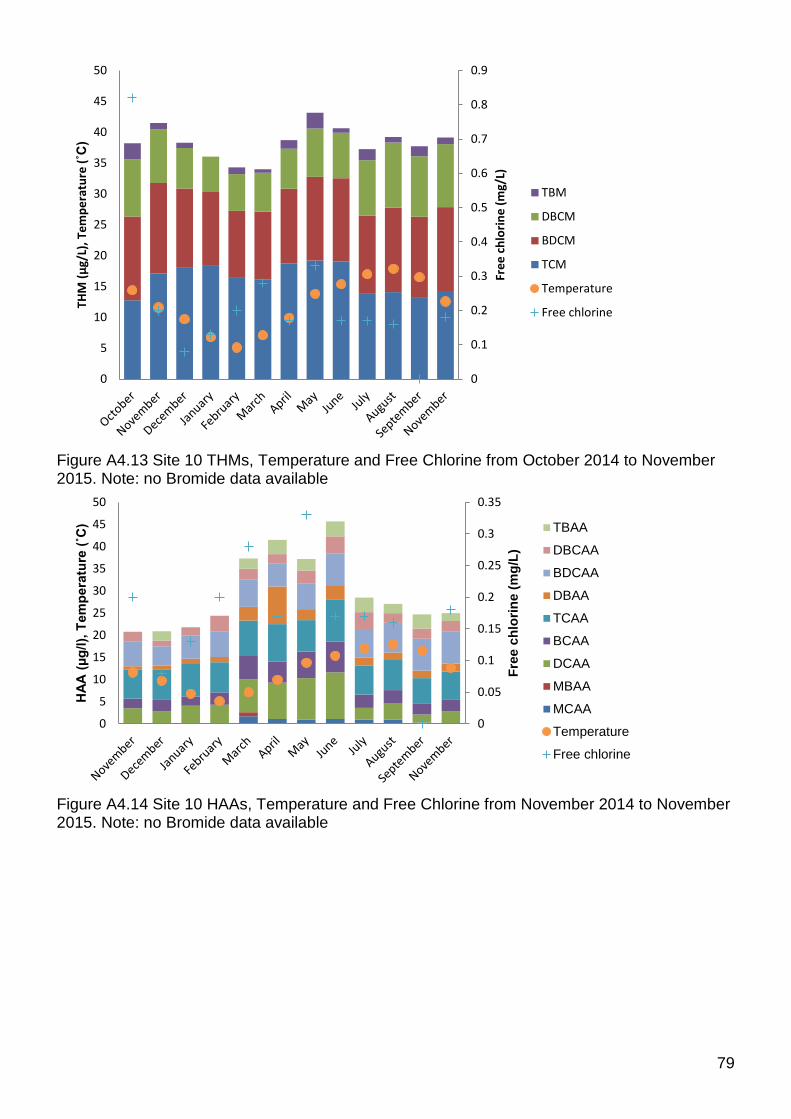
Figure A4.13 Site 10 THMs, Temperature and Free Chlorine from October 2014 to November 2015. Note: no Bromide data available
Figure A4.14 Site 10 HAAs, Temperature and Free Chlorine from November 2014 to November 2015. Note: no Bromide data available
0
0.1
0.2
0.3
0.4
0.5
0.6
0.7
0.8
0.9
0
5
10
15
20
25
30
35
40
45
50
Free
chl
orin
e (m
g/L)
THM
(µg/
L), T
empe
ratu
re (˚
C)
TBM
DBCM
BDCM
TCM
Temperature
Free chlorine
0
0.05
0.1
0.15
0.2
0.25
0.3
0.35
0
5
10
15
20
25
30
35
40
45
50Fr
ee c
hlor
ine
(mg/
L)
HA
A (µ
g/l),
Tem
pera
ture
(˚C
) TBAA
DBCAA
BDCAA
DBAA
TCAA
BCAA
DCAA
MBAA
MCAA
Temperature
Free chlorine
79
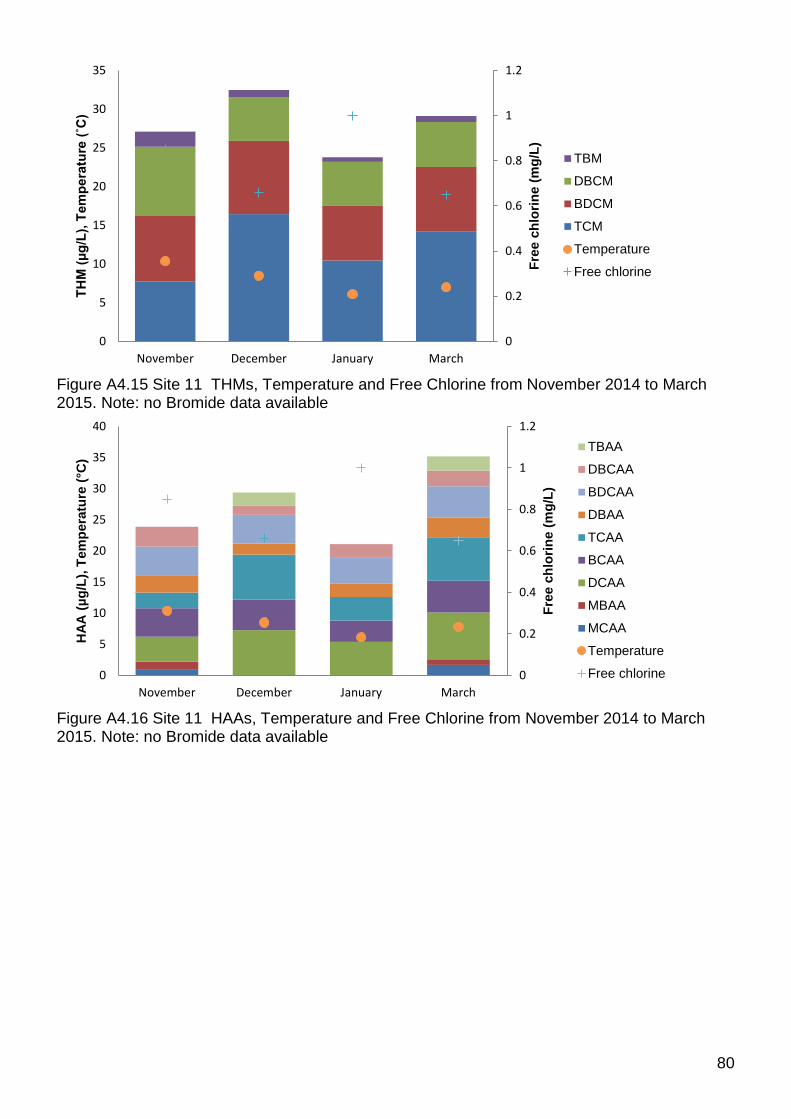
Figure A4.15 Site 11 THMs, Temperature and Free Chlorine from November 2014 to March 2015. Note: no Bromide data available
Figure A4.16 Site 11 HAAs, Temperature and Free Chlorine from November 2014 to March 2015. Note: no Bromide data available
0
0.2
0.4
0.6
0.8
1
1.2
0
5
10
15
20
25
30
35
November December January March
Free
chl
orin
e (m
g/L)
THM
(µg/
L), T
empe
ratu
re (˚
C)
TBM
DBCM
BDCM
TCM
Temperature
Free chlorine
0
0.2
0.4
0.6
0.8
1
1.2
0
5
10
15
20
25
30
35
40
November December January March
Free
chl
orin
e (m
g/L)
HA
A (µ
g/L)
, Tem
pera
ture
(°C
)
TBAA
DBCAA
BDCAA
DBAA
TCAA
BCAA
DCAA
MBAA
MCAA
Temperature
Free chlorine
80
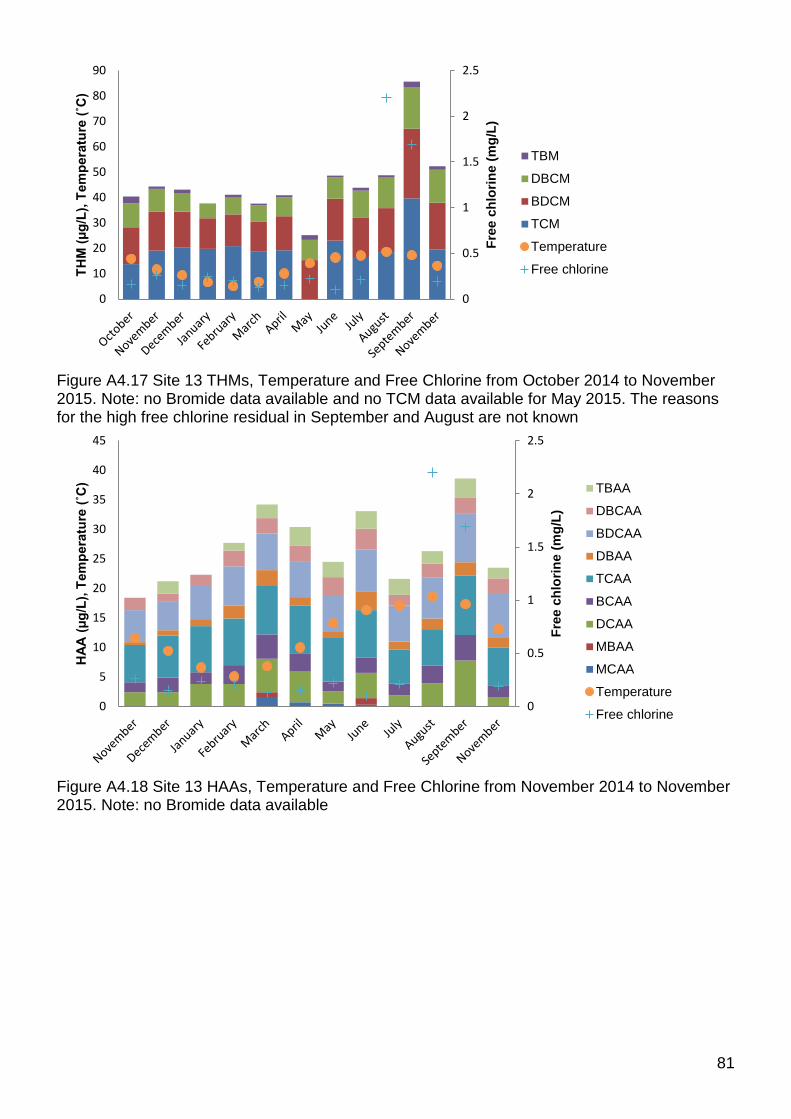
Figure A4.17 Site 13 THMs, Temperature and Free Chlorine from October 2014 to November 2015. Note: no Bromide data available and no TCM data available for May 2015. The reasons for the high free chlorine residual in September and August are not known
Figure A4.18 Site 13 HAAs, Temperature and Free Chlorine from November 2014 to November 2015. Note: no Bromide data available
0
0.5
1
1.5
2
2.5
0
10
20
30
40
50
60
70
80
90
Free
chl
orin
e (m
g/L)
THM
(µg/
L), T
empe
ratu
re (˚
C)
TBM
DBCM
BDCM
TCM
Temperature
Free chlorine
0
0.5
1
1.5
2
2.5
0
5
10
15
20
25
30
35
40
45
Free
chl
orin
e (m
g/L)
HAA
(µg/
L), T
empe
ratu
re (˚
C) TBAA
DBCAA
BDCAA
DBAA
TCAA
BCAA
DCAA
MBAA
MCAA
Temperature
Free chlorine
81
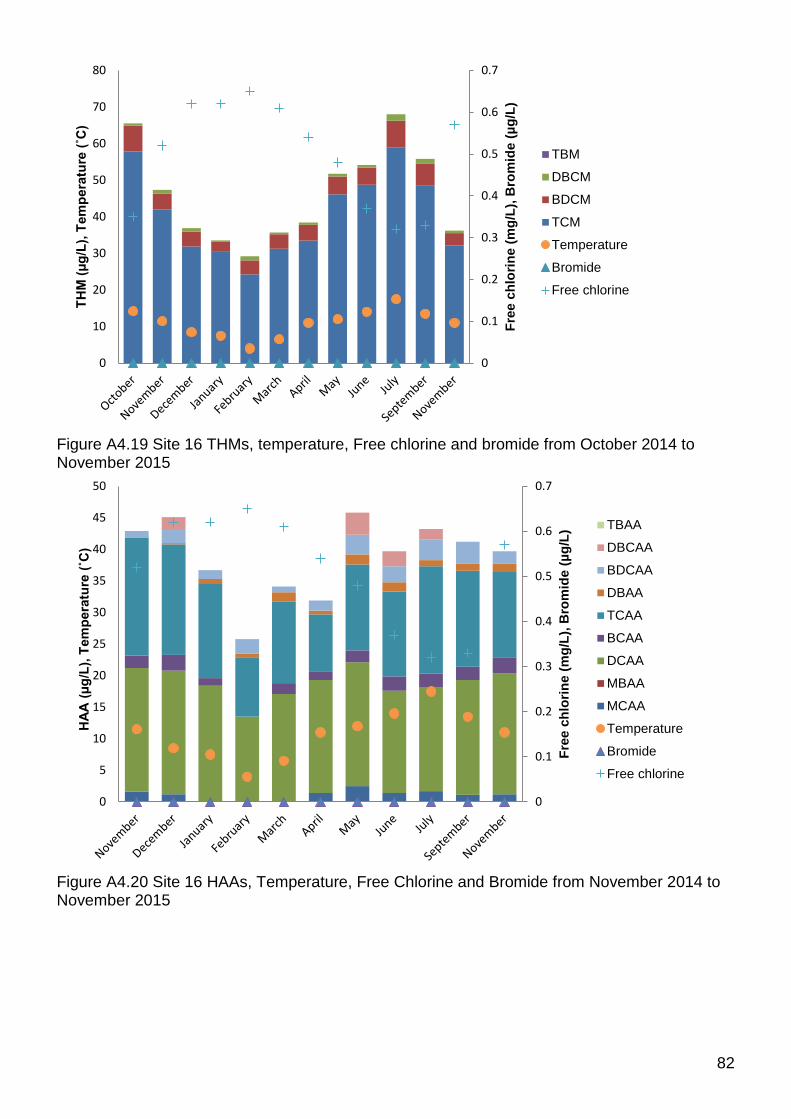
Figure A4.19 Site 16 THMs, temperature, Free chlorine and bromide from October 2014 to November 2015
Figure A4.20 Site 16 HAAs, Temperature, Free Chlorine and Bromide from November 2014 to November 2015
0
0.1
0.2
0.3
0.4
0.5
0.6
0.7
0
10
20
30
40
50
60
70
80
Free
chl
orin
e (m
g/L)
, Bro
mid
e (µ
g/L)
THM
(µg/
L), T
empe
ratu
re (˚
C)
TBM
DBCM
BDCM
TCM
Temperature
Bromide
Free chlorine
0
0.1
0.2
0.3
0.4
0.5
0.6
0.7
0
5
10
15
20
25
30
35
40
45
50
Free
chl
orin
e (m
g/L)
, Bro
mid
e (µ
g/L)
HA
A (µ
g/L)
, Tem
pera
ture
(˚C
)
TBAA
DBCAA
BDCAA
DBAA
TCAA
BCAA
DCAA
MBAA
MCAA
Temperature
Bromide
Free chlorine
82
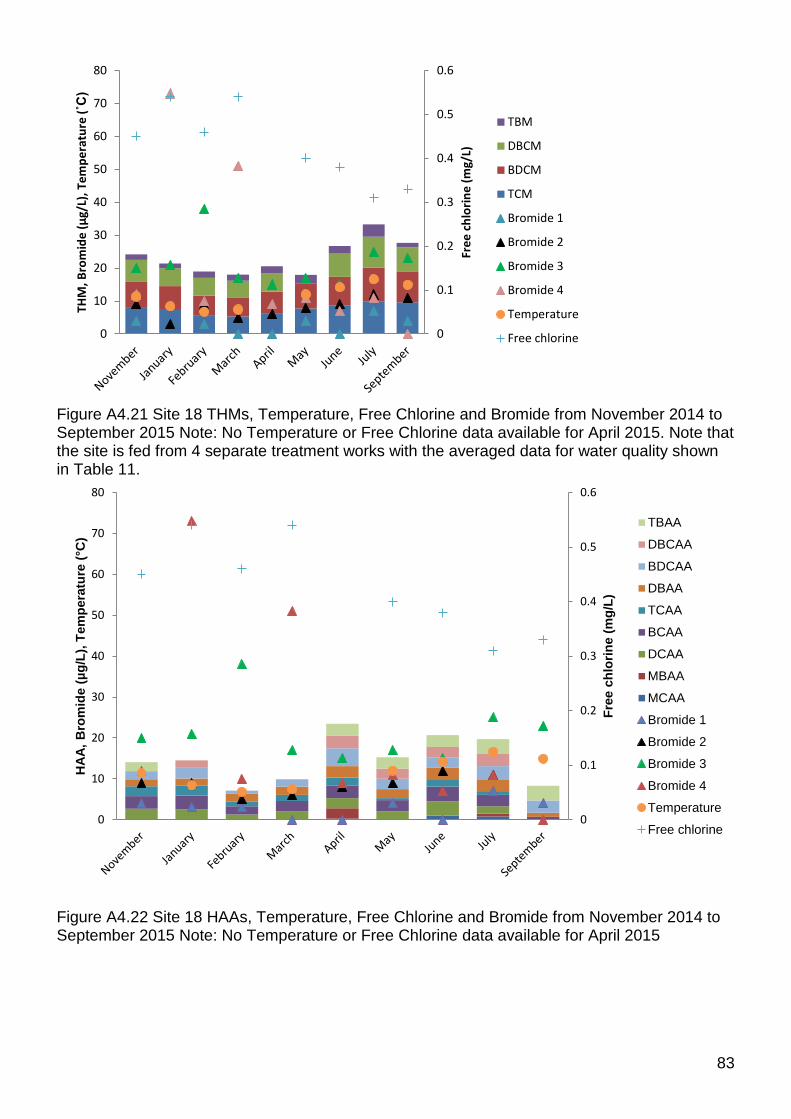
Figure A4.21 Site 18 THMs, Temperature, Free Chlorine and Bromide from November 2014 to September 2015 Note: No Temperature or Free Chlorine data available for April 2015. Note that the site is fed from 4 separate treatment works with the averaged data for water quality shown in Table 11.
Figure A4.22 Site 18 HAAs, Temperature, Free Chlorine and Bromide from November 2014 to September 2015 Note: No Temperature or Free Chlorine data available for April 2015
0
0.1
0.2
0.3
0.4
0.5
0.6
0
10
20
30
40
50
60
70
80
Free
chl
orin
e (m
g/L)
THM
, Bro
mid
e (µ
g/L)
, Tem
pera
ture
(˚C
)
TBM
DBCM
BDCM
TCM
Bromide 1
Bromide 2
Bromide 3
Bromide 4
Temperature
Free chlorine
0
0.1
0.2
0.3
0.4
0.5
0.6
0
10
20
30
40
50
60
70
80
Free
chl
orin
e (m
g/L)
HA
A, B
rom
ide
(µg/
L), T
empe
ratu
re (°
C)
TBAA
DBCAA
BDCAA
DBAA
TCAA
BCAA
DCAA
MBAA
MCAA
Bromide 1
Bromide 2
Bromide 3
Bromide 4
Temperature
Free chlorine
83
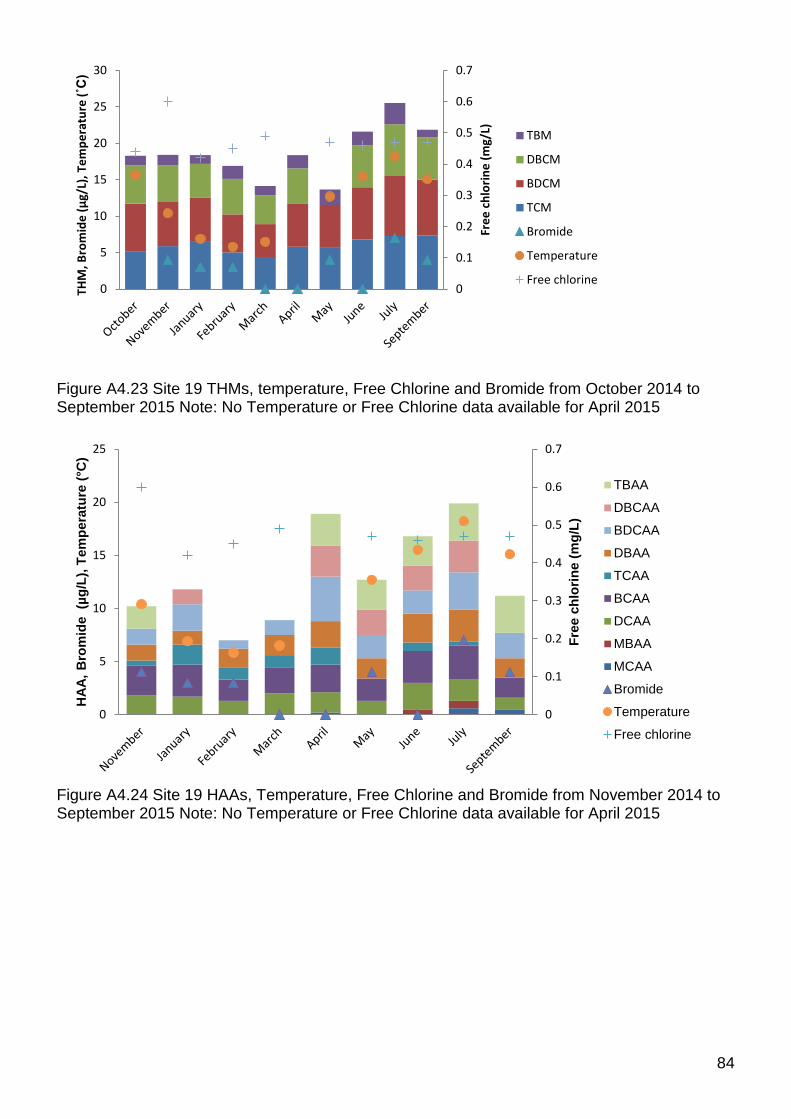
Figure A4.23 Site 19 THMs, temperature, Free Chlorine and Bromide from October 2014 to September 2015 Note: No Temperature or Free Chlorine data available for April 2015
Figure A4.24 Site 19 HAAs, Temperature, Free Chlorine and Bromide from November 2014 to September 2015 Note: No Temperature or Free Chlorine data available for April 2015
0
0.1
0.2
0.3
0.4
0.5
0.6
0.7
0
5
10
15
20
25
30
Free
chl
orin
e (m
g/L)
THM
, Bro
mid
e (µ
g/L)
, Tem
pera
ture
(˚C
)
TBM
DBCM
BDCM
TCM
Bromide
Temperature
Free chlorine
0
0.1
0.2
0.3
0.4
0.5
0.6
0.7
0
5
10
15
20
25
Free
chl
orin
e (m
g/L)
HA
A, B
rom
ide
(µg/
L), T
empe
ratu
re (°
C)
TBAA
DBCAA
BDCAA
DBAA
TCAA
BCAA
DCAA
MBAA
MCAA
Bromide
Temperature
Free chlorine
84
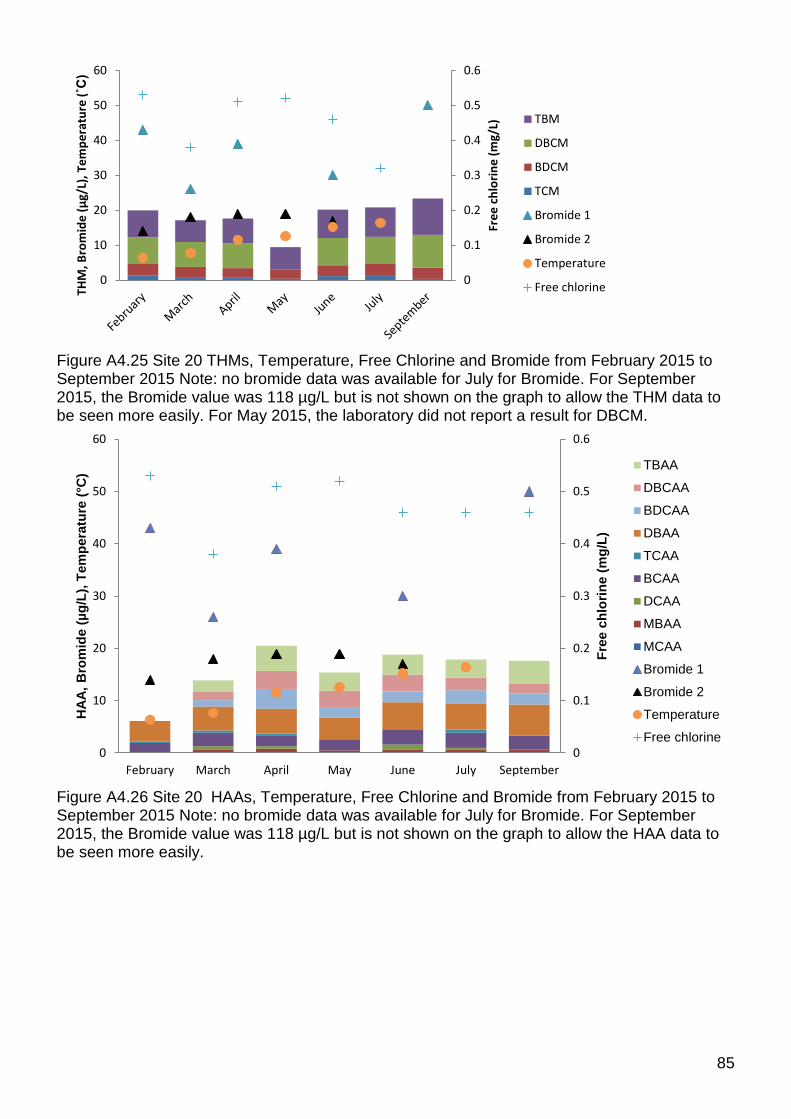
Figure A4.25 Site 20 THMs, Temperature, Free Chlorine and Bromide from February 2015 to September 2015 Note: no bromide data was available for July for Bromide. For September 2015, the Bromide value was 118 µg/L but is not shown on the graph to allow the THM data to be seen more easily. For May 2015, the laboratory did not report a result for DBCM.
Figure A4.26 Site 20 HAAs, Temperature, Free Chlorine and Bromide from February 2015 to September 2015 Note: no bromide data was available for July for Bromide. For September 2015, the Bromide value was 118 µg/L but is not shown on the graph to allow the HAA data to be seen more easily.
0
0.1
0.2
0.3
0.4
0.5
0.6
0
10
20
30
40
50
60
Free
chl
orin
e (m
g/L)
THM
, Bro
mid
e (µ
g/L)
, Tem
pera
ture
(˚C
)
TBM
DBCM
BDCM
TCM
Bromide 1
Bromide 2
Temperature
Free chlorine
0
0.1
0.2
0.3
0.4
0.5
0.6
0
10
20
30
40
50
60
February March April May June July September
Free
chl
orin
e (m
g/L)
HA
A, B
rom
ide
(µg/
L), T
empe
ratu
re (°
C) TBAA
DBCAA
BDCAA
DBAA
TCAA
BCAA
DCAA
MBAA
MCAA
Bromide 1
Bromide 2
Temperature
Free chlorine
85
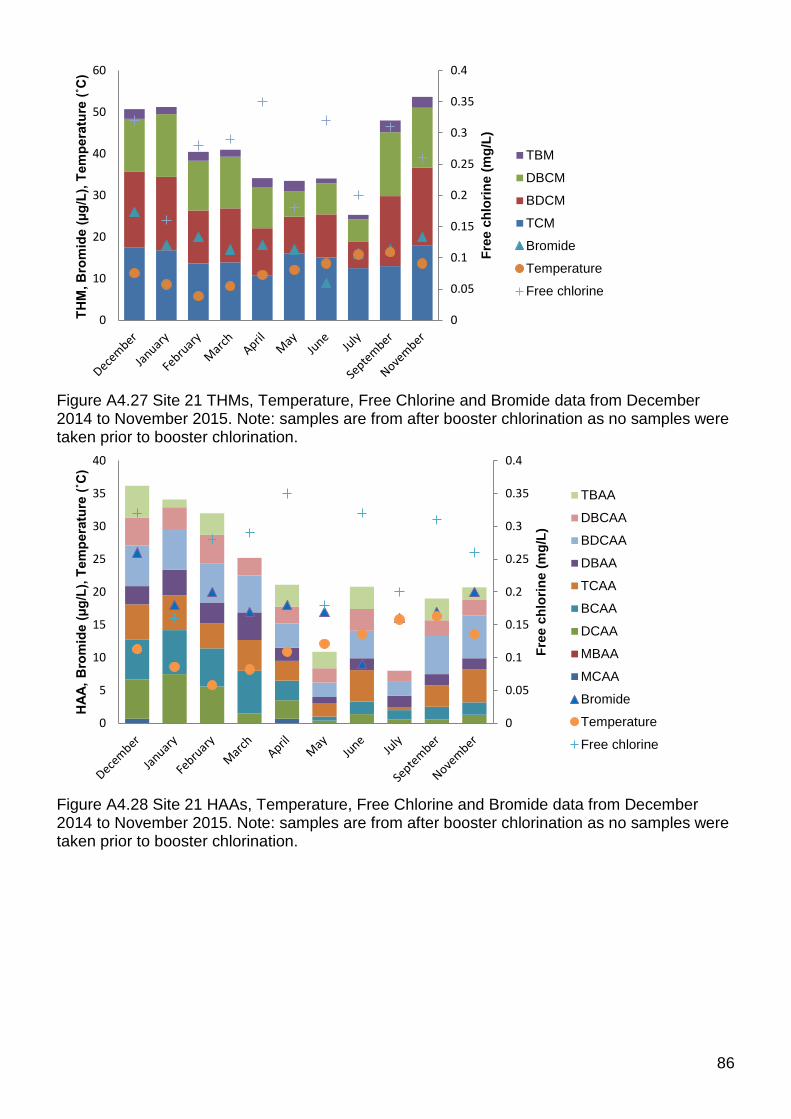
Figure A4.27 Site 21 THMs, Temperature, Free Chlorine and Bromide data from December 2014 to November 2015. Note: samples are from after booster chlorination as no samples were taken prior to booster chlorination.
Figure A4.28 Site 21 HAAs, Temperature, Free Chlorine and Bromide data from December 2014 to November 2015. Note: samples are from after booster chlorination as no samples were taken prior to booster chlorination.
0
0.05
0.1
0.15
0.2
0.25
0.3
0.35
0.4
0
10
20
30
40
50
60
Free
chl
orin
e (m
g/L)
THM
, Bro
mid
e (µ
g/L)
, Tem
pera
ture
(˚C
)
TBM
DBCM
BDCM
TCM
Bromide
Temperature
Free chlorine
0
0.05
0.1
0.15
0.2
0.25
0.3
0.35
0.4
0
5
10
15
20
25
30
35
40
Free
chl
orin
e (m
g/L)
HA
A, B
rom
ide
(µg/
L), T
empe
ratu
re (˚
C)
TBAA
DBCAA
BDCAA
DBAA
TCAA
BCAA
DCAA
MBAA
MCAA
Bromide
Temperature
Free chlorine
86
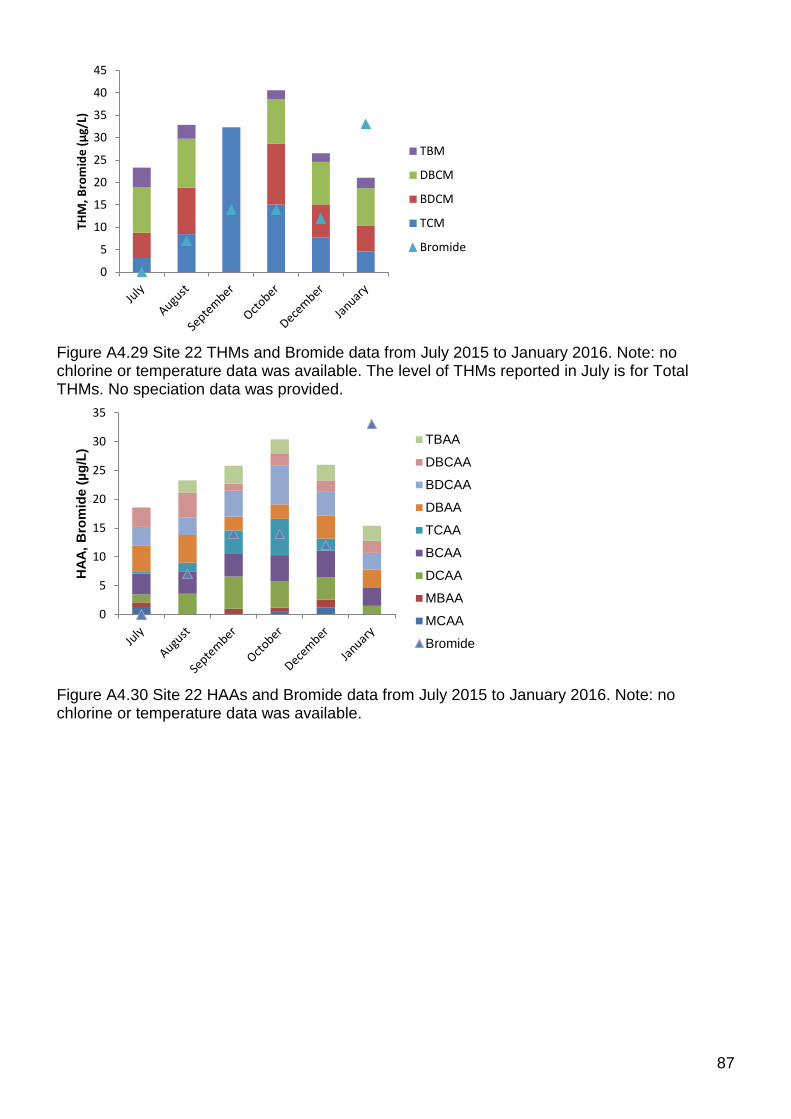
Figure A4.29 Site 22 THMs and Bromide data from July 2015 to January 2016. Note: no chlorine or temperature data was available. The level of THMs reported in July is for Total THMs. No speciation data was provided.
Figure A4.30 Site 22 HAAs and Bromide data from July 2015 to January 2016. Note: no chlorine or temperature data was available.
0
5
10
15
20
25
30
35
40
45TH
M, B
rom
ide
(µg/
L)
TBM
DBCM
BDCM
TCM
Bromide
0
5
10
15
20
25
30
35
HA
A, B
rom
ide
(µg/
L)
TBAA
DBCAA
BDCAA
DBAA
TCAA
BCAA
DCAA
MBAA
MCAA
Bromide
87

Appendix 5
88
89
90
91
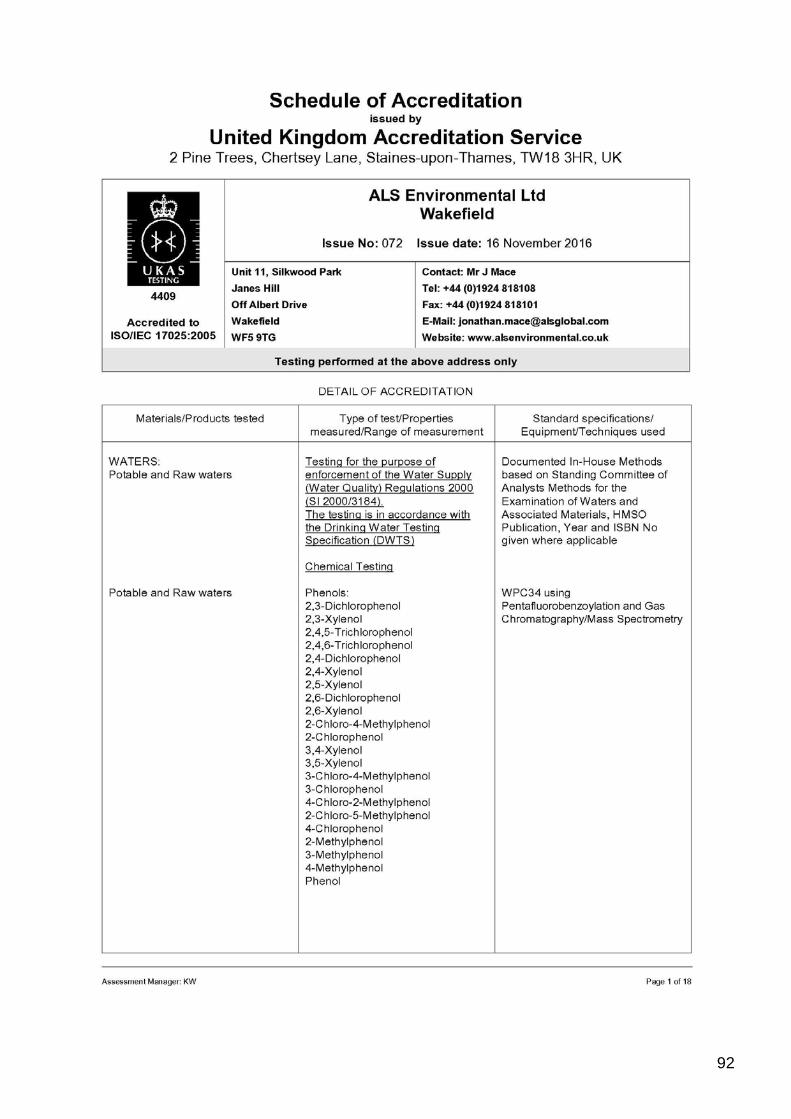
92
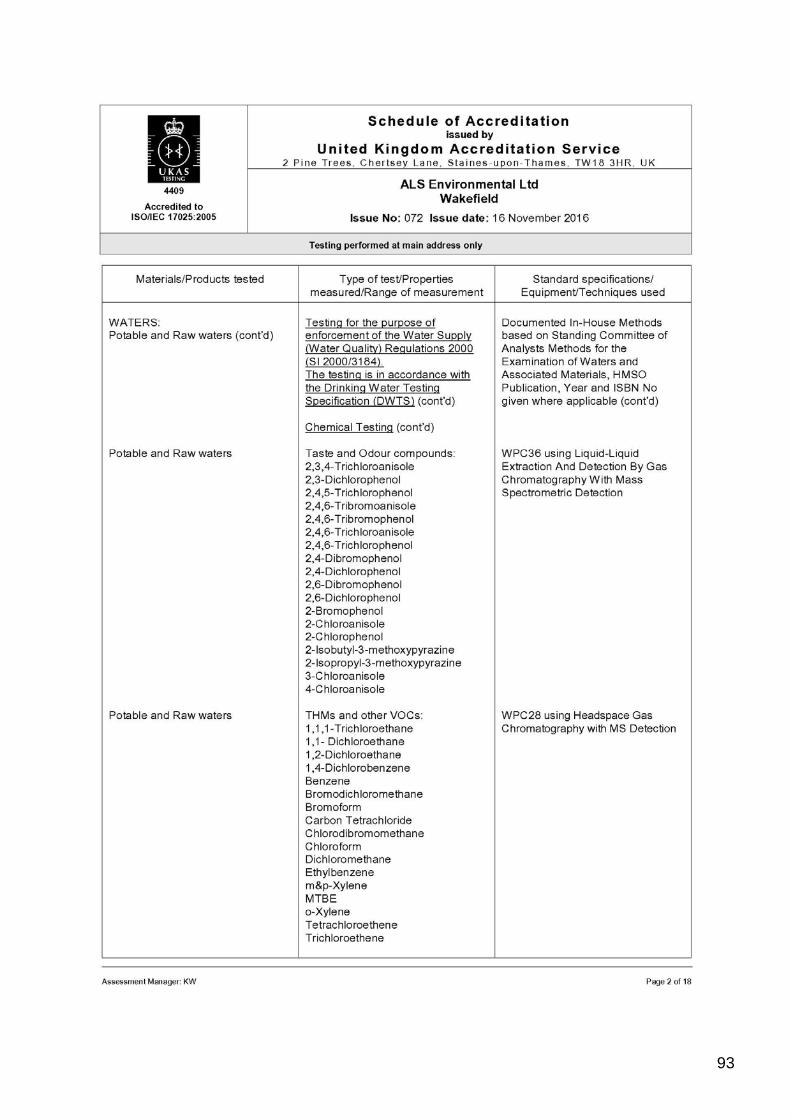
93
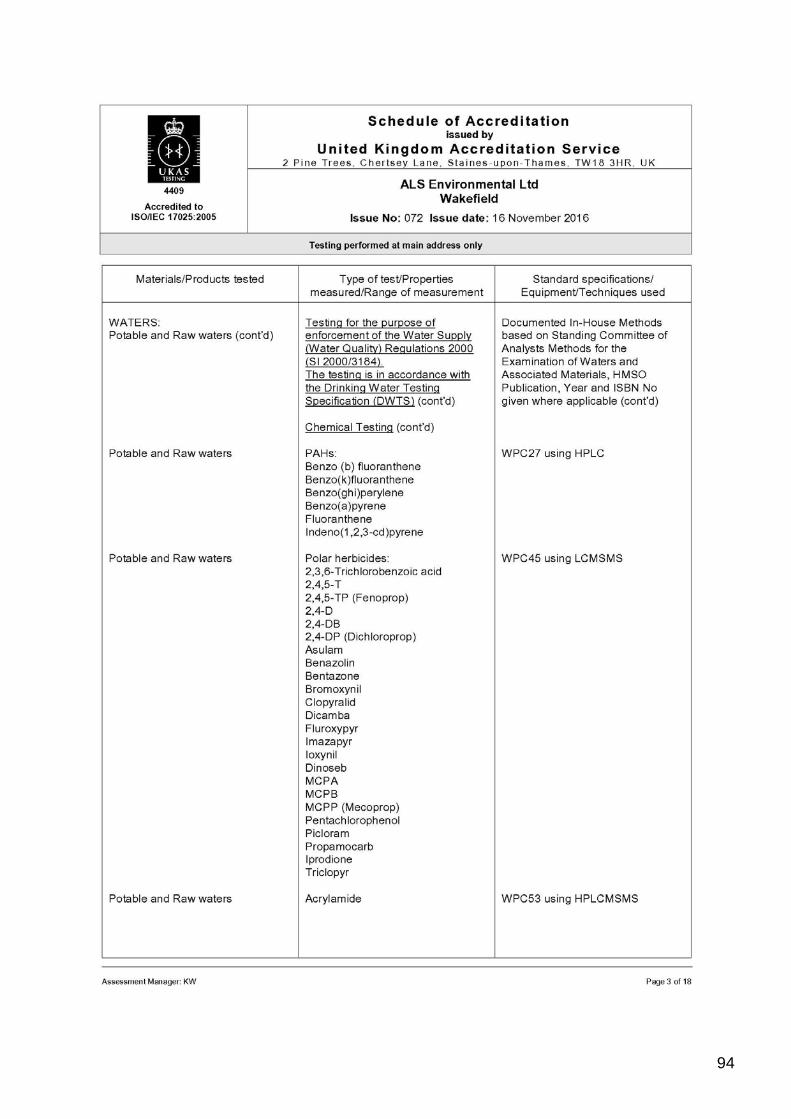
94
95
96
97
98
99
100
101
102
103
104
105
106
107
108
109