Embed Size (px)
Citation preview

Crisis, Stimulus and the Future of the P/C Insurance Industry
Challenges Amid theGlobal Economic Storm
Robert P. Hartwig, Ph.D., CPCU, PresidentInsurance Information Institute 110 William Street New York, NY 10038
Tel: (212) 346-5520 [email protected] www.iii.org
Commercial Lines Underwriting SeminarNational Association of Mutual Insurance Companies
Chicago, IL
February 24, 2009
Presentation Outline
• Financial Crisis & The Weakening Global Economy: Insurance Impacts• Recession, Growth & Insurance
• Economic Stimulus Package• Impacts & Implications for P/C Insurers
• Financial Strength & Ratings• P/C Insurance Industry Overview & Outlook
• Profitability• Premium Growth• Underwriting Performance• Financial Market Impacts
• Capital & Capacity• Regulatory Response to Crisis
• Emerging Blueprint of Regulatory Overhaul
• Important Threats Facing P/C Insurers in 2009Q & A

THE ECONOMIC STORM
What a Weakening Economy and Financial Crisis Mean for the
Insurance Industry
Exposure & Claim Cost Effects

3.7
%
0.8
% 1.6
% 2.5
% 3.6
%
3.1
%
2.9
%
0.1
%
4.8
%
4.8
%
0.9
%
2.8
%
-0.5
%
-1.5
%
0.8
% 2.0
%
2.4
%
2.9
%
3.1
%
3.1
%
-4.9%
-3.8%
-0.2%
-6%
-4%
-2%
0%
2%
4%
6%
2
00
0
2
00
1
2
00
2
2
00
3
2
00
4
2
00
5
2
00
6
07
:1Q
07
:2Q
07
:3Q
07
:4Q
08
:1Q
08
:2Q
08
:3Q
08
:4Q
09
:1Q
09
:2Q
09
:3Q
09
:4Q
10
:1Q
10
:2Q
10
:3Q
10
:4Q
Real GDP Growth*
*Yellow bars are Estimates/Forecasts from Blue Chip Economic Indicators.Source: US Department of Commerce, Blue Economic Indicators 2/09; Insurance Information Institute.
Recession began in December 2007. Economic toll of credit crunch, housing
slump, labor market contraction is growing
The Q4:2008 decline was the steepest since the
Q1:1982 drop of 6.4%
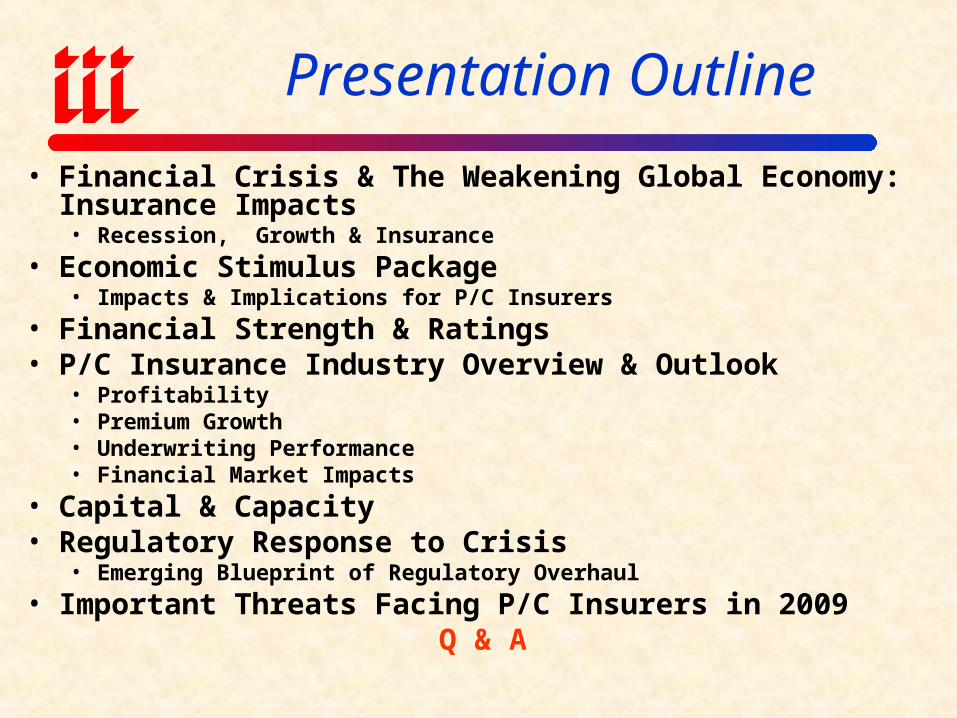
Length of US Recessions,1929-Present*
43
13
811 10
810 11
16
6
16
8 8
14
0
5
10
15
20
25
30
35
40
45
50
Aug.1929
May1937
Feb.1945
Nov.1948
July1953
Aug.1957
Apr.1960
Dec.1969
Nov.1973
Jan.1980
Jul.1981
Jul.1990
Mar.2001
Dec.2007
* As of February 2009
Sources: National Bureau of Economic Research; Insurance Information Institute.
Current recession began in Dec. 2007 and is already the
longest since 1981. If it extends beyond April, it will become the longest recession since the Great Depression.
Months in Duration
3.0
3.5
4.0
4.5
5.0
5.5
6.0
6.5
7.0
7.5
8.0
Jan
-00
Jan
-01
Jan
-02
Jan
-03
Jan
-04
Jan
-05
Jan
-06
Jan
-07
Jan
-08
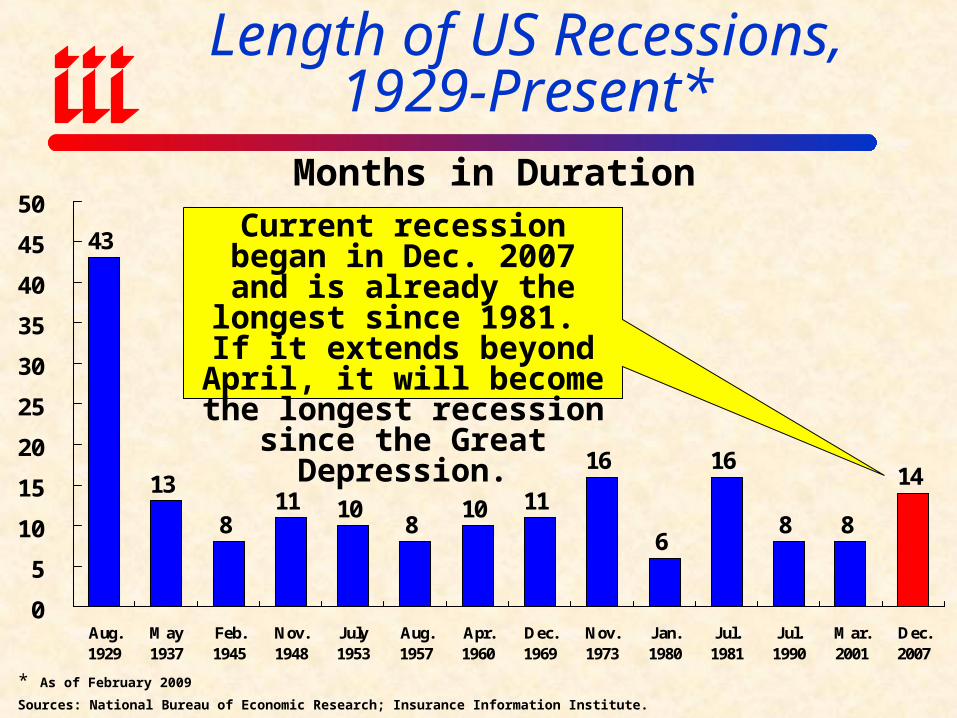
January 2000 through January 2009
Unemployment will likely peak above 8% or 9% during this cycle, impacting payroll
sensitive p/c and non-life exposures
Source: US Bureau of Labor Statistics; Insurance Information Institute.
Jan. 2009 unemployment jumped to 7.6%, exceeding the 6.3% peak during the previous cycle, and is now at it highest
level since Sept. 1992
Unemployment Rate:On the Rise
Average unemployment rate 2000-07 was 5.0%
Previous Peak: 6.3% in June 2003
Trough: 4.4% in March 2007
Jan
-09
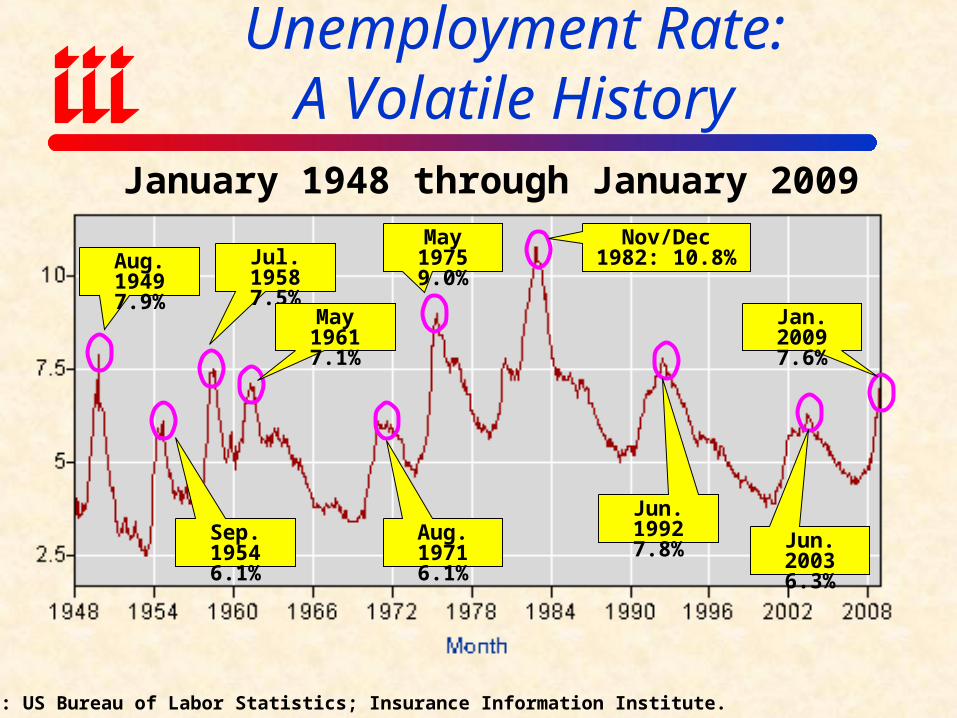
January 1948 through January 2009
Source: US Bureau of Labor Statistics; Insurance Information Institute.
Unemployment Rate:A Volatile History
Aug. 1949 7.9%
Sep. 1954 6.1%
Jul. 1958 7.5%
May 1961 7.1%
Aug. 1971 6.1%
May 1975 9.0%
Nov/Dec 1982: 10.8%
Jun. 1992 7.8% Jun. 2003
6.3%
Jan. 2009 7.6%
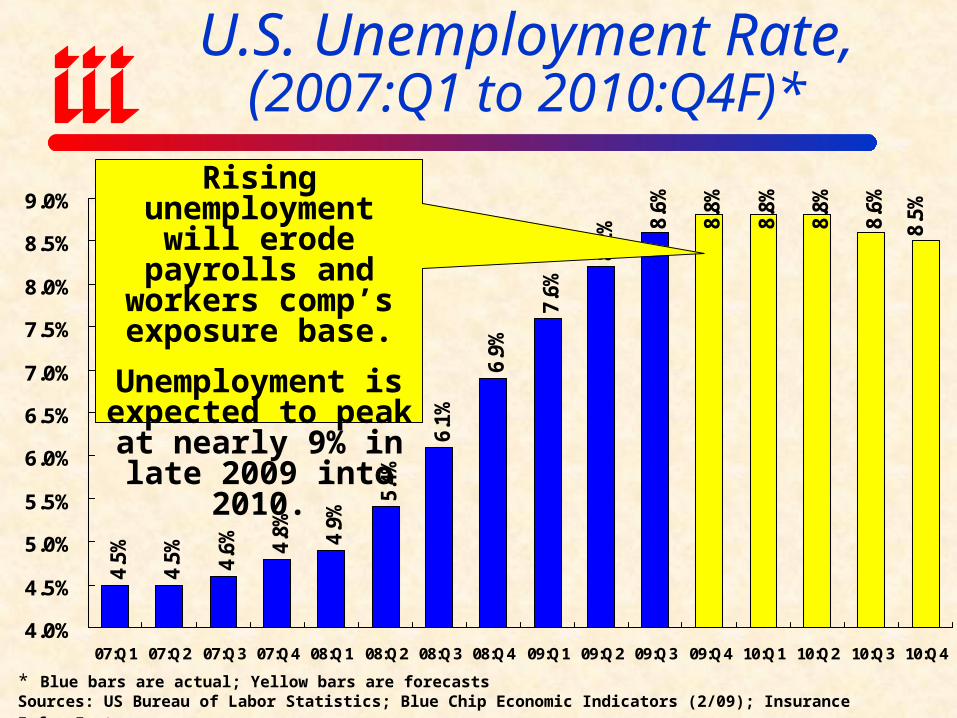
U.S. Unemployment Rate,(2007:Q1 to 2010:Q4F)*
4.5%
4.5% 4.6% 4.
8% 4.9%
5.4%
6.1%
6.9%
7.6%
8.2%
8.6%
8.8%
8.8%
8.8%
8.6%
8.5%
4.0%
4.5%
5.0%
5.5%
6.0%
6.5%
7.0%
7.5%
8.0%
8.5%
9.0%
07:Q1 07:Q2 07:Q3 07:Q4 08:Q1 08:Q2 08:Q3 08:Q4 09:Q1 09:Q2 09:Q3 09:Q4 10:Q1 10:Q2 10:Q3 10:Q4
* Blue bars are actual; Yellow bars are forecastsSources: US Bureau of Labor Statistics; Blue Chip Economic Indicators (2/09); Insurance Info. Inst.
Rising unemployment will erode payrolls
and workers comp’s exposure base.
Unemployment is expected to peak at
nearly 9% in late 2009 into 2010.
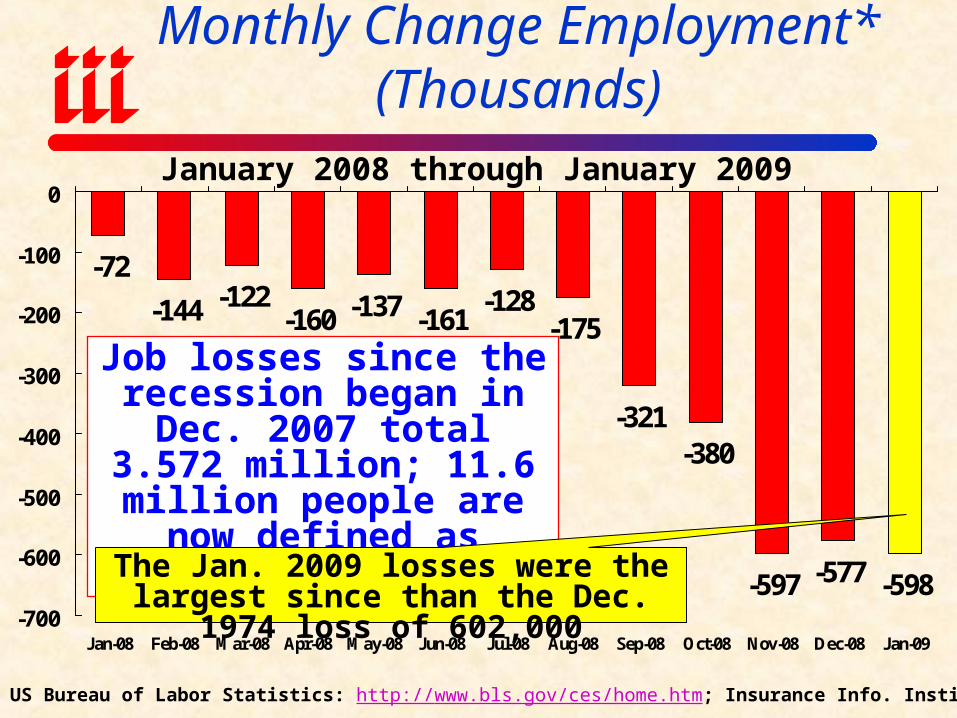
Monthly Change Employment*(Thousands)
-72
-144 -122-160 -137 -161
-128-175
-321-380
-597 -577 -598-700
-600
-500
-400
-300
-200
-100
0
Jan-08 Feb-08 Mar-08 Apr-08 May-08 Jun-08 Jul-08 Aug-08 Sep-08 Oct-08 Nov-08 Dec-08 Jan-09
Job losses since the recession began in Dec. 2007
total 3.572 million; 11.6 million people are now defined as unemployed.
Source: US Bureau of Labor Statistics: http://www.bls.gov/ces/home.htm; Insurance Info. Institute
The Jan. 2009 losses were the largest since than the Dec. 1974 loss of 602,000
January 2008 through January 2009
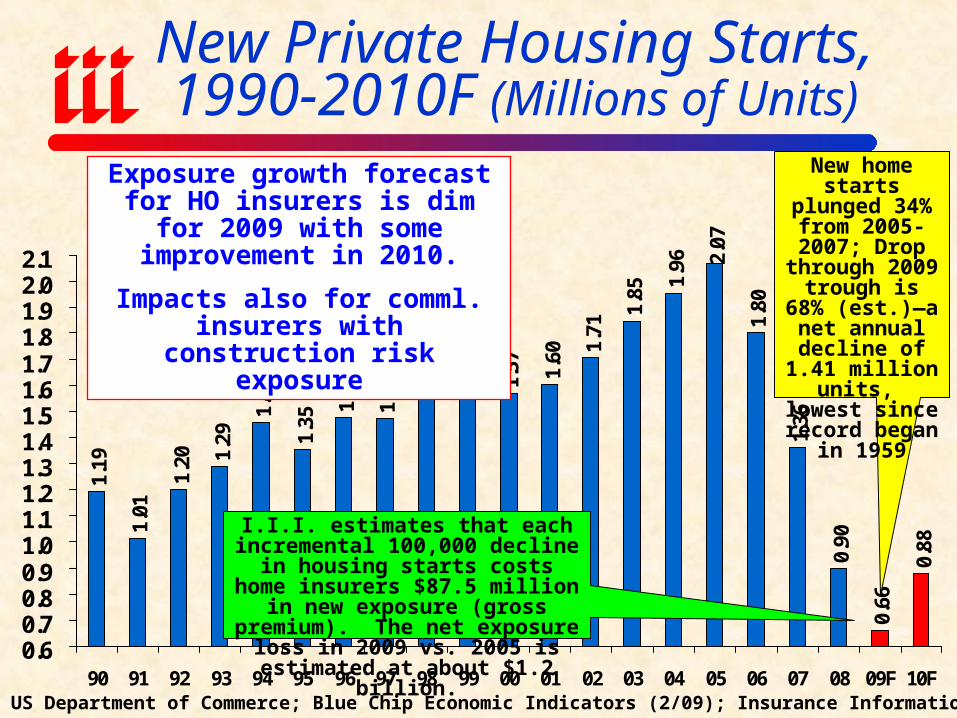
New Private Housing Starts,1990-2010F (Millions of Units)
2.07
1.80
1.36
0.90
0.66
0.88
1.48
1.351.
46
1.29
1.20
1.01
1.19
1.47
1.62 1.64
1.57 1.60 1.
71
1.85
1.96
0.60.70.80.91.01.11.21.31.41.51.61.71.81.92.02.1
90 91 92 93 94 95 96 97 98 99 00 01 02 03 04 05 06 07 08 09F 10F
Exposure growth forecast for HO insurers is dim for 2009 with some
improvement in 2010.
Impacts also for comml. insurers with construction risk exposure
New home starts plunged 34%
from 2005-2007; Drop through 2009 trough is 68% (est.)—a
net annual decline of 1.41 million units, lowest since
record began in 1959
I.I.I. estimates that each incremental 100,000 decline in housing starts costs
home insurers $87.5 million in new exposure (gross premium). The net
exposure loss in 2009 vs. 2005 is estimated at about $1.2 billion.
Source: US Department of Commerce; Blue Chip Economic Indicators (2/09); Insurance Information Inst.
14
SD
NDMT
ID
NV
CA
OR
WA
UT
WY
NE
CO
OK
TXLA
FL
MN
IA
IL
ME
AZNM
KS
WI
OH
MINY
VT
IN
MO
AR
KY
TN
NH
PA
RI
MS AL
SC
NC
GA
VAWV
MA
CT
AK
HI
NJ
DE
MD
DC
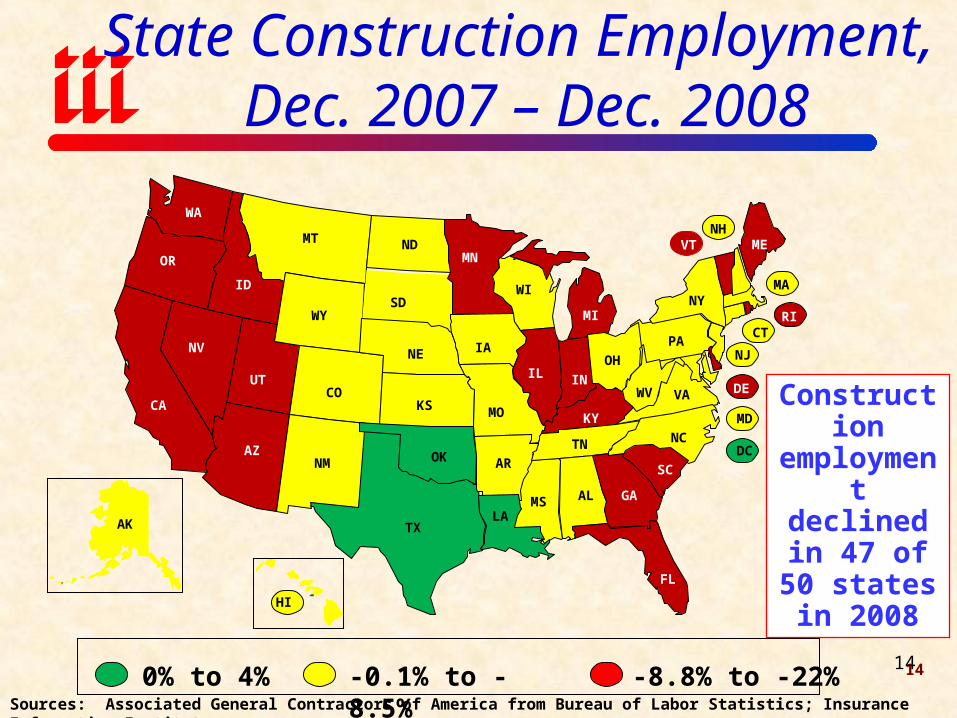
State Construction Employment, Dec. 2007 – Dec. 2008
0% to 4%
-0.1% to -8.5%
-8.8% to -22%
AK
14
Construction employment declined in
47 of 50 states in
2008
Sources: Associated General Contractors of America from Bureau of Labor Statistics; Insurance Information Institute.

16.916.916.6
17.117.5
17.817.4
16.516.1
13.1
10.9
12.7
10
11
12
13
14
15
16
17
18
19
99 00 01 02 03 04 05 06 07 08 09F 10F
Weakening economy, credit crunch are hurting auto sales; Gas prices less of a factor now.
New auto/light truck sales are expected to experience a net drop of 6.0 million units annually by 2009 compared
with 2005, a decline of 35.5% and the lowest level
since the late 1960s
Impacts of falling auto sales will have a less pronounced effect on auto insurance exposure growth
than problems in the housing market will on home insurers
Auto/Light Truck Sales,1999-2010F (Millions of Units)
Source: US Department of Commerce; Blue Chip Economic Indicators (2/09); Insurance Information Inst.
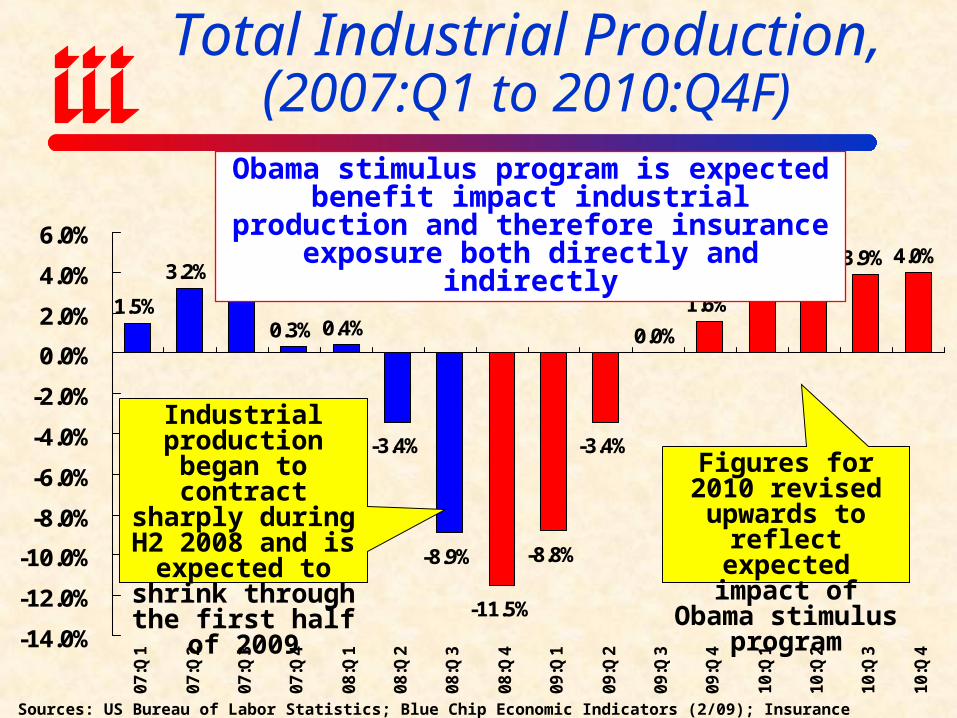
Total Industrial Production,(2007:Q1 to 2010:Q4F)
1.5%
3.2% 3.6%
0.3% 0.4%
-3.4%
-8.9%
-11.5%
-8.8%
-3.4%
2.6%3.3%
3.9%4.0%
0.0%
1.6%
-14.0%
-12.0%
-10.0%
-8.0%
-6.0%
-4.0%
-2.0%
0.0%
2.0%
4.0%
6.0%
07
:Q1
07
:Q2
07
:Q3
07
:Q4
08
:Q1
08
:Q2
08
:Q3
08
:Q4
09
:Q1
09
:Q2
09
:Q3
09
:Q4
10
:Q1
10
:Q2
10
:Q3
10
:Q4
Sources: US Bureau of Labor Statistics; Blue Chip Economic Indicators (2/09); Insurance Info. Inst.
Industrial production began
to contract sharply during H2 2008 and
is expected to shrink through the
first half of 2009
Obama stimulus program is expected benefit impact industrial production and therefore
insurance exposure both directly and indirectly
Figures for 2010 revised upwards to
reflect expected impact of Obama stimulus program
$0
$1,000
$2,000
$3,000
$4,000
$5,000
$6,000
$7,000
89 90 91 92 93 94 95 96 97 98 99 00 01 02 03 04 05 06 07 08*
$0
$5
$10
$15
$20
$25
$30
$35
$40
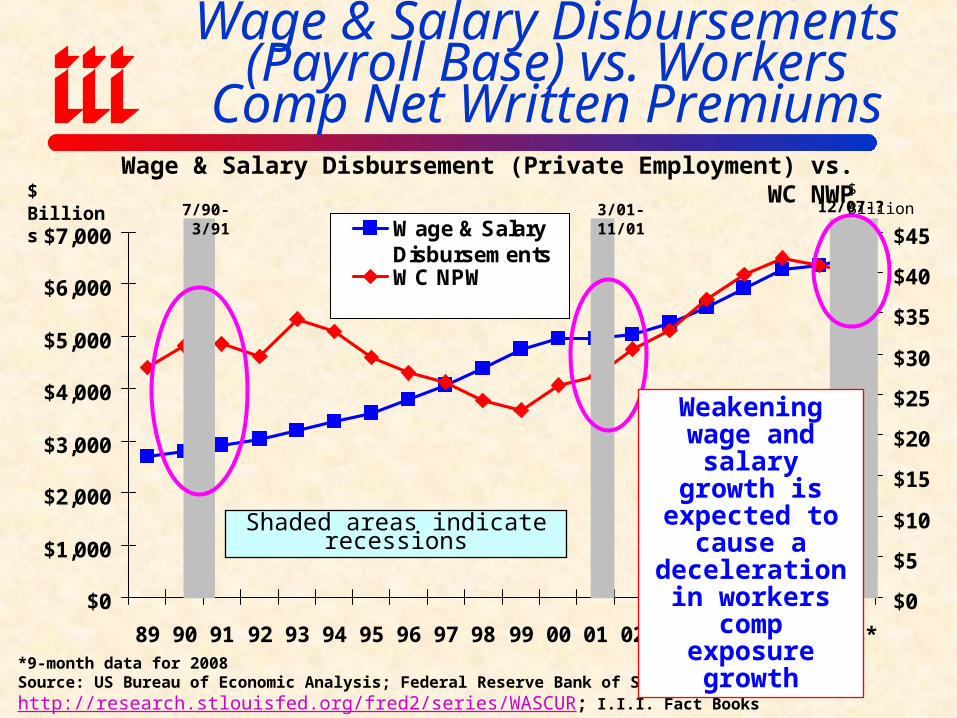
$45Wage & SalaryDisbursementsWC NPW
*9-month data for 2008Source: US Bureau of Economic Analysis; Federal Reserve Bank of St. Louis at http://research.stlouisfed.org/fred2/series/WASCUR; I.I.I. Fact Books
Wage & Salary Disbursements (Payroll Base) vs. Workers Comp
Net Written Premiums
7/90-3/91
Shaded areas indicate recessions
3/01-11/01
Wage & Salary Disbursement (Private Employment) vs. WC NWP$ Billions $ Billions
12/07-?
Weakening wage and salary growth is
expected to cause a deceleration in workers comp
exposure growth

5.2%
-0.9
%-7
.4%
-6.5
%-1
.5%
1.8%
4.3%
18.6
%20
.3%
5.8%
0.3%
-1.6
%-1
.0%
-1.8
%-1
.0%
3.1%
1.1%
0.8%
0.4%
0.6%
-0.4
%-0
.3%
1.6%
5.6%
13.7
%7.
7%1.
2%-2
.9% -0
.5%
-3.8
%-4
.2%
1.7%
-10%
-5%
0%
5%
10%
15%
20%
25%7
87
98
08
18
28
38
48
58
68
78
88
99
09
19
29
39
49
59
69
79
89
90
00
10
20
30
40
50
60
70
8E
09
F
Rea
l N
WP
Gro
wth
-4%
-2%
0%
2%
4%
6%
8%
Rea
l G
DP
Gro
wth
Real NWP Growth Real GDP
Real GDP Growth vs. Real P/C Premium Growth: Modest Association
P/C insurance industry’s growth is influenced modestly by growth
in the overall economy
Sources: A.M. Best, US Bureau of Economic Analysis, Blue Chip Economic Indicators, 2/09; Insurance Information Inst.
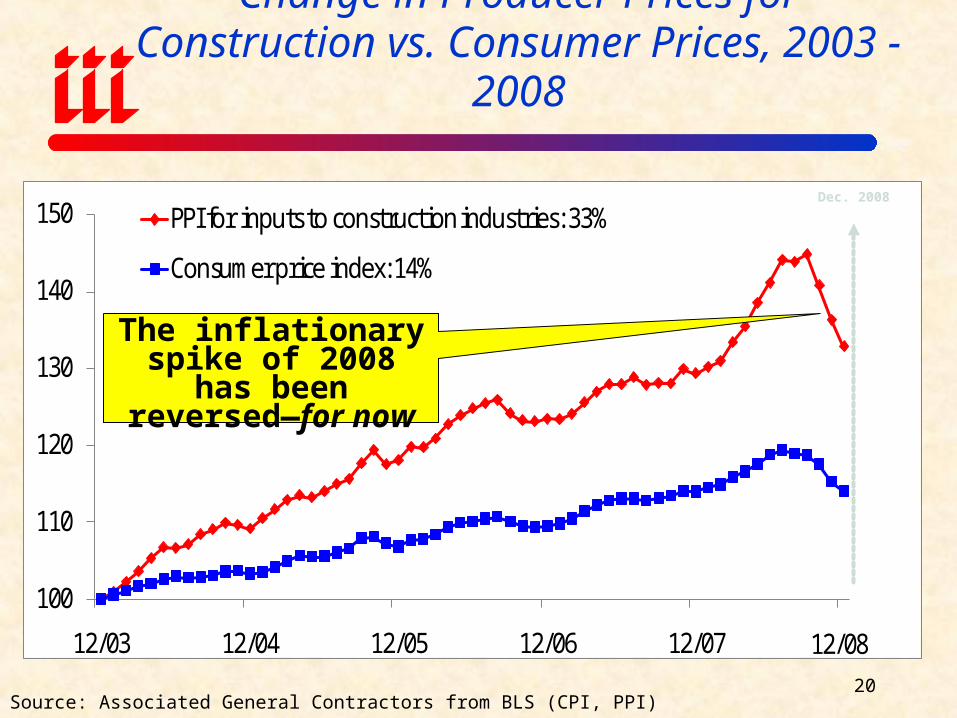
Change in Producer Prices for Construction vs. Consumer Prices, 2003 - 2008
100
110
120
130
140
150
12/03 12/04 12/05 12/06 12/07
PPI for inputs to construction industries: 33%
Consumer price index: 14%
12/08
Source: Associated General Contractors from BLS (CPI, PPI)20
Dec. 2008
The inflationary spike of 2008 has been
reversed—for now
THE $787 BILLION ECONOMIC STIMULUS
Sectoral Impacts & Implications for P/C
Insurance

Economic Stimulus Package: Where the $787B Goes
Tax Cuts, 38.0%
Aid, 37.9%
Spending, 24.1%
How much “stimulus” is actually in the stimulus
package is open to debate and dispute
Sources: Wall Street Journal , 2/13/09; House Ways and Means Committee; Senate Finance Committee.
Less than ¼ of the stimulus package is direct spending on
infrastructure

Economic Stimulus Package: Where the $787B Goes
Tax Relief, $288 , 38%
State & Local Fiscal Relief, $144 , 18%
Infrastructure & Science, $111 , 14%
Protecting the Vulnerable, $81 , 10%
Health Care, $59 , 7% Education & Training, $53 , 7%
Energy, $43 , 5%
Other, 8, 1%
Tax relief and aid to state and local
government account for 56% of stimulus. Actual
spending accounts for only about 25%
Source: http://www.recovery.gov/ accessed 2/18/09; Insurance Information Institute.
$ BillionsObjective is to create or preserve 3.5 million jobs
$ Billions
$165$144
$111$81
$8
$15 $61
$25
$43$53$59
$0
$20
$40
$60
$80
$100
$120
$140
$160
$180
Ta
x R
elie
f
Sta
te &
Lo
ca
lF
isc
al R
elie
f
Infr
as
tru
ctu
re&
Sc
ien
ce
Pro
tec
tin
gth
eV
uln
era
ble
He
alt
h C
are
Ed
uc
ati
on
&T
rain
ing
En
erg
y
Oth
er
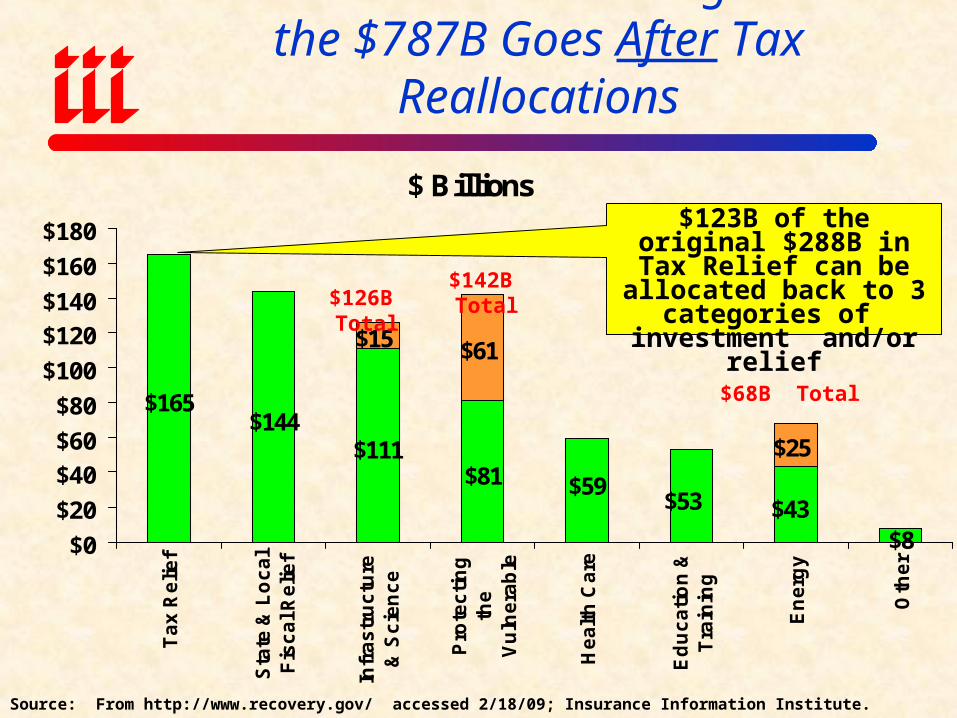
$126B Total$142B Total
$68B Total
Source: From http://www.recovery.gov/ accessed 2/18/09; Insurance Information Institute.
Economic Stimulus Package: Where the $787B Goes After Tax Reallocations
$123B of the original $288B in Tax Relief can be
allocated back to 3 categories of investment
and/or relief
$30
$19
$9$5
$8
$18
$8
$29
$6
$0
$5
$10
$15
$20
$25
$30
$35
Elec
tric
Grid
Heal
th In
fo.
Tech
nolo
gy
NIH
Rese
arch
Hom
eW
eath
eriza
tion
Fed.
Hou
sing
Ener
gyUp
grad
es
High
way
Infra
stru
ctur
e
Publ
ic tr
ansi
t
High
-spe
ed ra
il
Envi
ro. g
rant
s&
loan
s
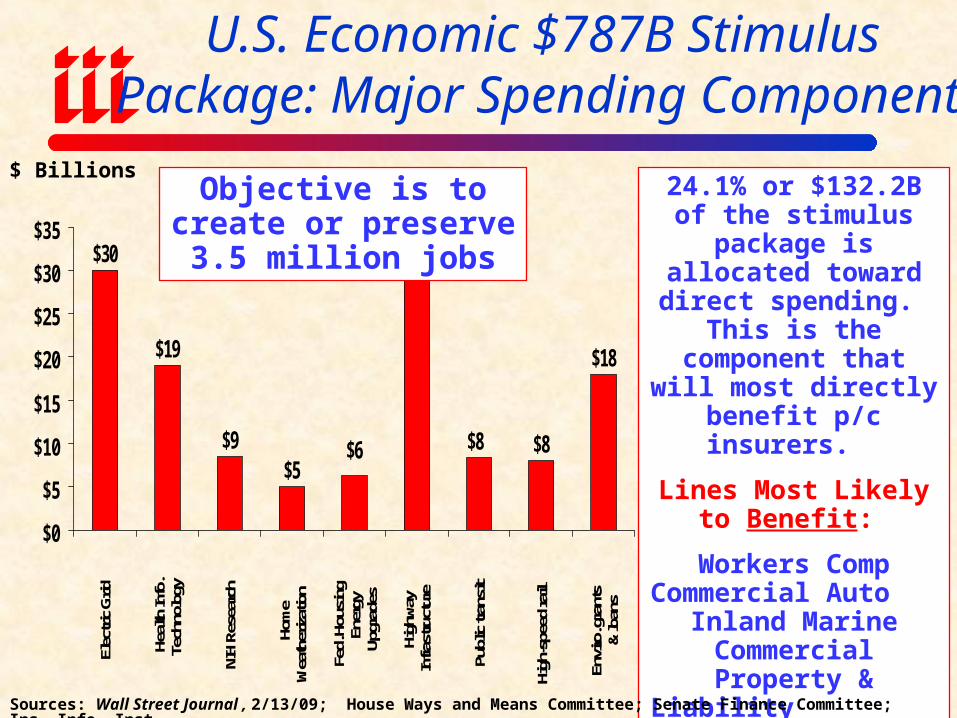
24.1% or $132.2B of the stimulus package is
allocated toward direct spending. This is the
component that will most directly benefit p/c
insurers.
Lines Most Likely to Benefit:
Workers Comp Commercial Auto
Inland Marine Commercial Property &
Liability Surety
U.S. Economic $787B Stimulus Package: Major Spending Components
Sources: Wall Street Journal , 2/13/09; House Ways and Means Committee; Senate Finance Committee; Ins. Info. Inst.
Objective is to create or preserve 3.5 million jobs
$ Billions
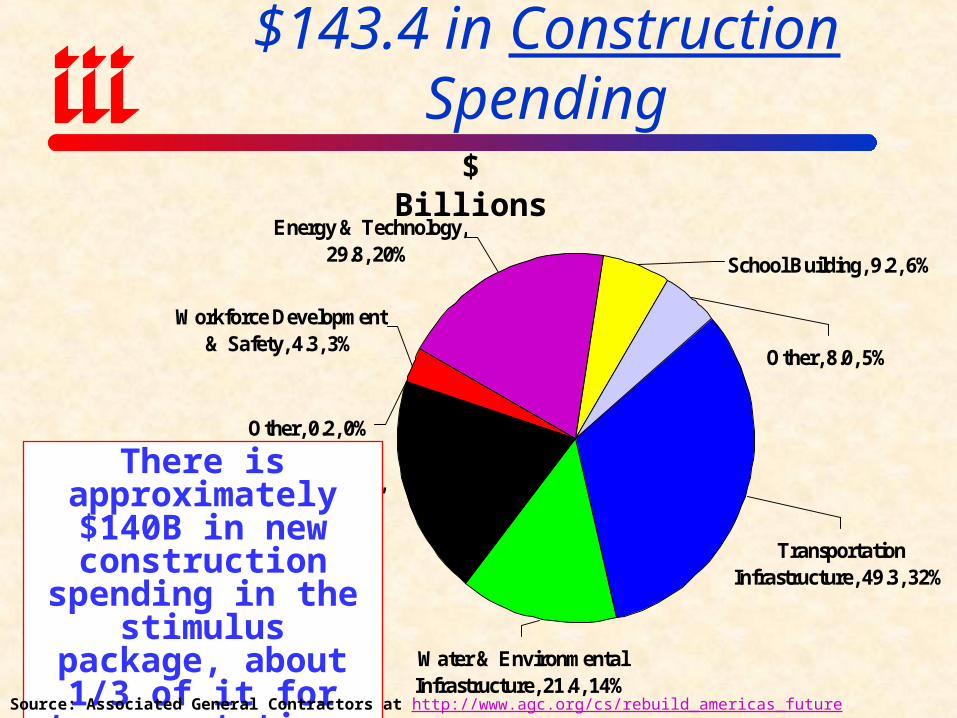
Economic Stimulus Package: $143.4 in Construction Spending
Transportation Infrastructure, 49.3, 32%
Water & Environmental Infrastructure, 21.4, 14%
Building Infrastructure, 29.6, 20%
Other, 0.2, 0%
Workforce Development & Safety, 4.3, 3%
Energy & Technology, 29.8, 20% School Building, 9.2, 6%
Other, 8.0, 5%
There is approximately $140B in new construction
spending in the stimulus package, about 1/3 of it for transportation.
Source: Associated General Contractors at http://www.agc.org/cs/rebuild_americas_future (2/18/09); Insurance Info. Inst..
$ Billions
$5.1 $6.6
$116.1
$69.8
$0
$20
$40
$60
$80
$100
$120
Business deductions Refundable Tax creditfor 1st-time
homeowners
Tax credit to low incomeworkers & married
couples
Middle-income taxexemption
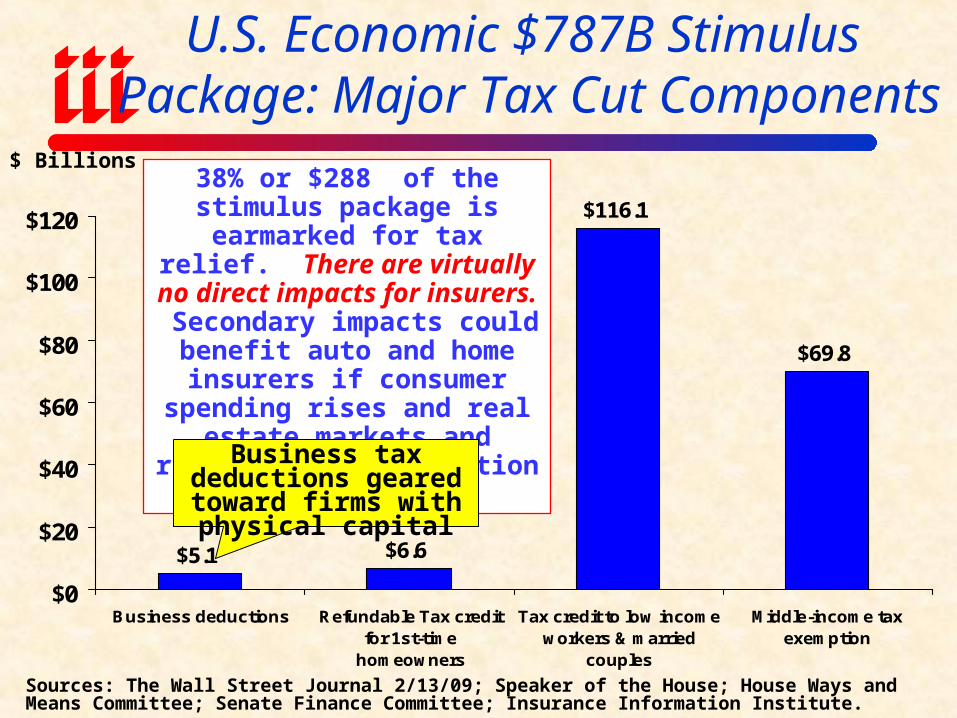
U.S. Economic $787B Stimulus Package: Major Tax Cut Components
Sources: The Wall Street Journal 2/13/09; Speaker of the House; House Ways and Means Committee; Senate Finance Committee; Insurance Information Institute.
$ Billions38% or $288 of the stimulus package is earmarked for tax relief. There are virtually no direct impacts for insurers.
Secondary impacts could benefit auto and home insurers if
consumer spending rises and real estate markets and residential
construction improve.
Business tax deductions geared toward firms with physical capital
$40.6
$87.0
$2.0$8.0
$1.4
$17.2
$0.20
$27
$0
$10
$20
$30
$40
$50
$60
$70
$80
$90
$100
State aid Medicaid Foreclosedproperty
investments
Publicsafety
Educationtax credit
Student aid Collegeprograms
Joblessbenefits
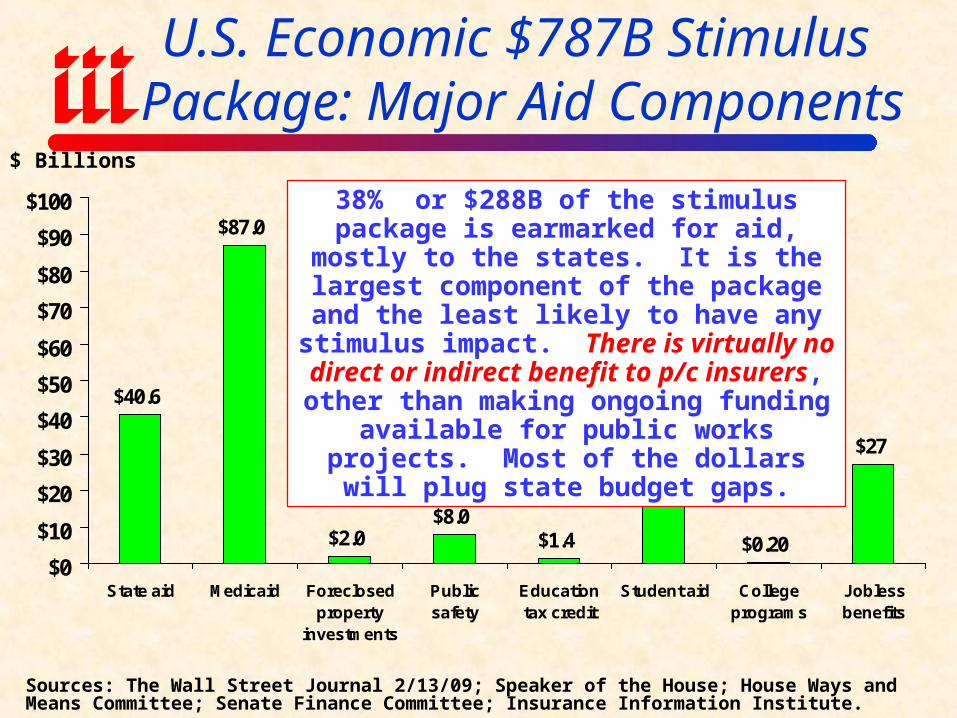
U.S. Economic $787B Stimulus Package: Major Aid Components
$ Billions
38% or $288B of the stimulus package is earmarked for aid, mostly to the states. It is the largest component of the package and the
least likely to have any stimulus impact. There is virtually no direct or indirect benefit to p/c
insurers, other than making ongoing funding available for public works projects. Most of
the dollars will plug state budget gaps.
Sources: The Wall Street Journal 2/13/09; Speaker of the House; House Ways and Means Committee; Senate Finance Committee; Insurance Information Institute.

$40.6
$87.0
$2.0$8.0
$1.4
$17.2
$0.20
$27
$0
$10
$20
$30
$40
$50
$60
$70
$80
$90
$100
State aid Medicaid Foreclosedproperty
investments
Publicsafety
Educationtax credit
Student aid Collegeprograms
Joblessbenefits
U.S. Economic $787B Stimulus Package: Major Aid Components
$ Billions
38% or $XXX.X of the stimulus package is earmarked for aid, mostly to the states. It is the largest component of the package and the
least likely to have any stimulus impact. There is virtually no direct or indirect benefit to p/c
insurers, other than making ongoing funding available for public works projects. Most of
the dollars will plug state budget gaps.
Sources: The Wall Street Journal 2/13/09; Speaker of the House; House Ways and Means Committee; Senate Finance Committee; Insurance Information Institute.

State-by-State Infrastructure
SpendingBigger States Get More, Should Benefit
Commercial Insurer Exposure

Infrastructure Stimulus Spending by State (Total = $38.1B)
State Allocation State Allocation State AllocationAL $603,871,807 LA $538,575,876 OK $535,407,908
AK $240,495,117 ME $174,285,111 OR $453,788,475
AZ $648,928,995 MD $704,863,248 PA $1,525,011,979
AR $405,531,459 MA $890,333,825 RI $192,902,023
CA $3,917,656,769 MI $1,150,282,308 SC $544,291,398
CO $538,669,174 MN $668,242,481 SD $213,511,174
CT $487,480,166 MS $415,257,720 TN $701,516,776
DE $158,666,838 MO $830,647,063 TX $2,803,249,599
DC $267,617,455 MT $246,599,815 UT $292,231,904
FL $1,794,913,566 NE $278,897,762 VT $150,666,577
GA $1,141,255,941 NV $270,010,945 VA $890,584,959
HI $199,866,172 NH $181,678,856 WA $739,283,923
ID $219,528,313 NJ $1,335,785,100 WV $290,479,108
IL $1,579,965,373 NM $299,589,086 WI $716,457,120
IN $836,483,568 NY $2,774,508,711 WY $186,111,170
IA $447,563,924 NC $909,397,136 U.S. Territories
$238,045,760
KS $413,837,382 ND $200,318,301
KY $521,153,404 OH $1,335,600,553 Total $38,101,898,173
Sources: USA Today, 2/17/09; House Transportation and Infrastructure Committee; the Associated Press.

Infrastructure Stimulus Spending By State: Top 25 States ($ Millions)
$890
.6$8
90.3
$836
.5$8
30.6
$739
.3$7
16.5
$704
.9$7
01.5
$668
.2
$648
.9$6
03.9
$544
.3$5
38.7
$538
.6
$1,3
35.8
$1,5
80.0
$909
.4$1
,141
.3
$1,1
50.3
$1,3
35.6
$1,5
25.0
$2,8
03.2
$2,7
74.5
$1,7
94.9
$3,9
17.7
$0
$500
$1,000
$1,500
$2,000
$2,500
$3,000
$3,500
$4,000
$4,500
CA TX NY FL IL PA NJ OH MI GA NC VA MA IN MO WA WI MD TN MN AZ AL SC CO LA
Stim
ulus
Dol
lars
($ M
ill)
Sources: USA Today 2/19/09; House Transportation and Infrastructure Committee; the Associated Press.
Infrastructure spending is in the stimulus package total
$38.1B, allocated largely by population size
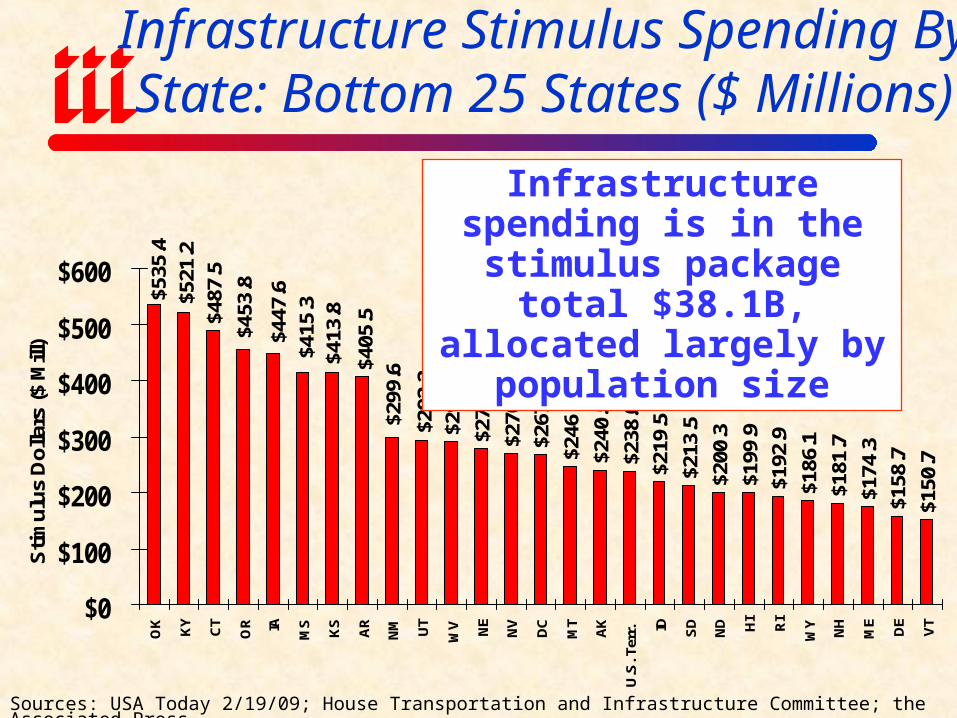
Infrastructure Stimulus Spending By State: Bottom 25 States ($ Millions)
$278
.9$2
70.0
$267
.6$2
46.6
$240
.5$2
38.0
$219
.5$2
13.5
$200
.3$1
99.9
$192
.9$1
86.1
$181
.7$1
74.3
$158
.7$1
50.7
$413
.8
$447
.6
$290
.5$2
92.2
$299
.6$405
.5
$415
.3$521
.2$4
87.5
$453
.8$535
.4
$0
$100
$200
$300
$400
$500
$600
OK KY
CT
OR IA MS
KS
AR
NM UT
WV NE
NV
DC
MT
AK
U.S
. Ter
r. ID SD
ND HI
RI
WY
NH
ME
DE
VT
Stim
ulus
Dol
lars
($ M
ill)
Sources: USA Today 2/19/09; House Transportation and Infrastructure Committee; the Associated Press.
Infrastructure spending is in the stimulus package total
$38.1B, allocated largely by population size
Expected Number of Jobs Gained or
Preserved by Stimulus Spending
Larger States = More JobsWorkers Comp Benefits

Estimated Job Effect of Stimulus: Jobs Created/Saved By State = 3.5 Mill Total
State Jobs Created State Jobs Created State Jobs CreatedAL 52,000 LA 50,000 OK 40,000
AK 8,000 ME 15,000 OR 44,000
AZ 70,000 MD 66,000 PA 143,000
AR 32,000 MA 79,000 RI 12,000
CA 396,000 MI 109,000 SC 50,000
CO 60,000 MN 66,000 SD 10,000
CT 41,000 MS 30,000 TN 71,000
DE 11,000 MO 69,000 TX 269,000
DC 12,000 MT 11,000 UT 32,000
FL 207,000 NE 23,000 VT 8,000
GA 107,000 NV 34,000 VA 93,000
HI 16,000 NH 16,000 WA 75,000
ID 17,000 NJ 100,000 WV 20,000
IL 148,000 NM 22,000 WI 70,000
IN 75,000 NY 215,000 WY 8,000
IA 37,000 NC 105,000
KS 33,000 ND 9,000
KY 48,000 OH 133,000 Total 3,467,000
Sources: http://www.recovery.gov/; Council of Economic Advisers; Insurance Information Institute.
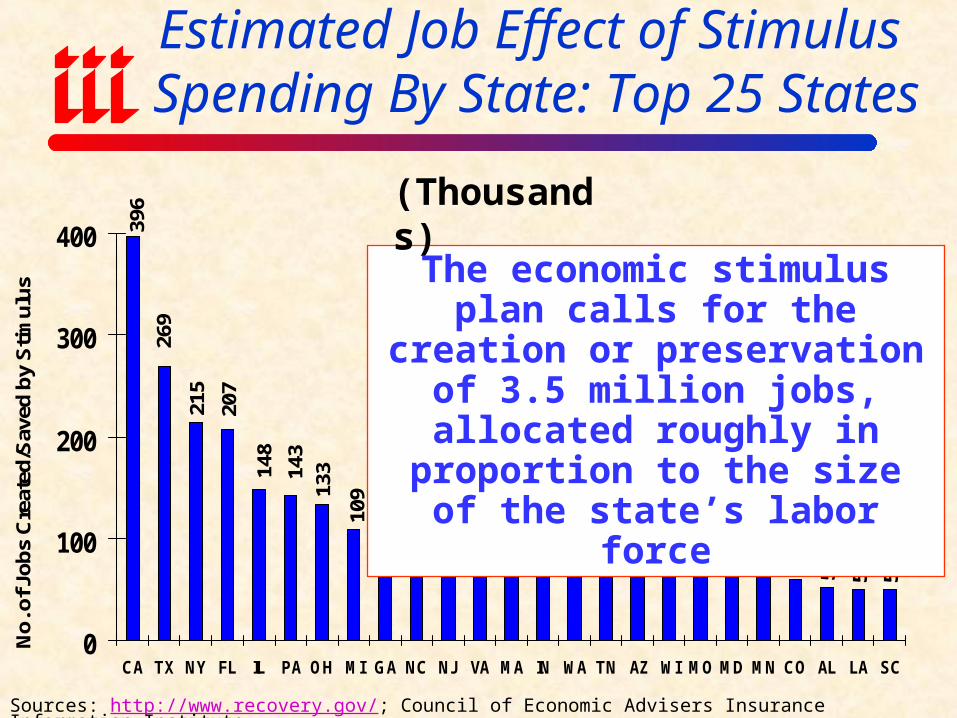
Estimated Job Effect of Stimulus Spending By State: Top 25 States
9379 75 75 71 70 70 69 66 66 60 52 50 50
13314
8
100
105
107
109
143
269
215
207
396
0
100
200
300
400
CA TX NY FL IL PA OH MI GA NC NJ VA MA IN WA TN AZ WI MO MD MN CO AL LA SC
No.
of J
obs
Cre
ated
/Sav
ed b
y S
timul
us
Sources: http://www.recovery.gov/; Council of Economic Advisers Insurance Information Institute.
The economic stimulus plan calls for the creation or preservation of 3.5 million jobs, allocated roughly
in proportion to the size of the state’s labor force
(Thousands)

2220
17 16 16 1512 12 11 11 10 9 8 8 8
33
37
2330
3232
34
44
41 40
48
0
10
20
30
40
50
KY OR CT OK IA NV KS AR UT MS NE NM WV ID HI NH ME DC RI DE MT SD ND AK VT WY
No.
of J
obs
Cre
ated
/Sav
ed b
y S
timul
usEstimated Job Effect of Stimulus
Spending By State: Bottom 25 States
(Thousands)
Sources: http://www.recovery.gov/; Council of Economic Advisers Insurance Information Institute.
The economic stimulus plan calls for the creation or
preservation of 3.5 million jobs, allocated roughly in
proportion to the size of the state’s labor force

Stimulus: Reading The Economic Tea Leaves for the Next 4 to 8 Years
Source: Insurance Information Institute
• Growing Role of Government: 2009 Stimulus Package and Other Likely Spending Initiatives Guarantee that Government Will Play a Much Larger Role Than at Any Other Time in Recent History Every industry, including insurance, will and must attempt to
maximize direct and indirect benefits from this paradigm shift• Obama Administration Priorities: Stimulus Package
Acts as “Economic Tea Leaf” on the Administration’s Fiscal Priorities for the Next Several Years
• These Include: Alternative Energy Health Care Education Aging/New Infrastructure Aid to States
• Stimulus is Only One Leg of the Stool (1) Stimulus; (2) Housing, and (3) Financial Services Reform
FINANCIAL STRENGTH &
RATINGS Industry Has Weathered
the Storms Well

P/C Insurer Impairment Frequency vs. Combined Ratio, 1969-2007
90
95
100
105
110
115
120
69
70
71
72
73
74
75
76
77
78
79
80
81
82
83
84
85
86
87
88
89
90
91
92
93
94
95
96
97
98
99
00
01
02
03
04
05
06
07
Co
mb
ined
Ratio
0
0.2
0.4
0.6
0.8
1
1.2
1.4
1.6
1.8
2
Imp
air
men
t R
ate
Combined Ratio after DivP/C Impairment Frequency
Impairment rates are highly correlated
underwriting performance and could reached a
record low in 2007
Source: A.M. Best; Insurance Information Institute
2007 impairment rate was a record low 0.12%, one-seventh the 0.8% average since 1969;
Previous record was 0.24% in 1972
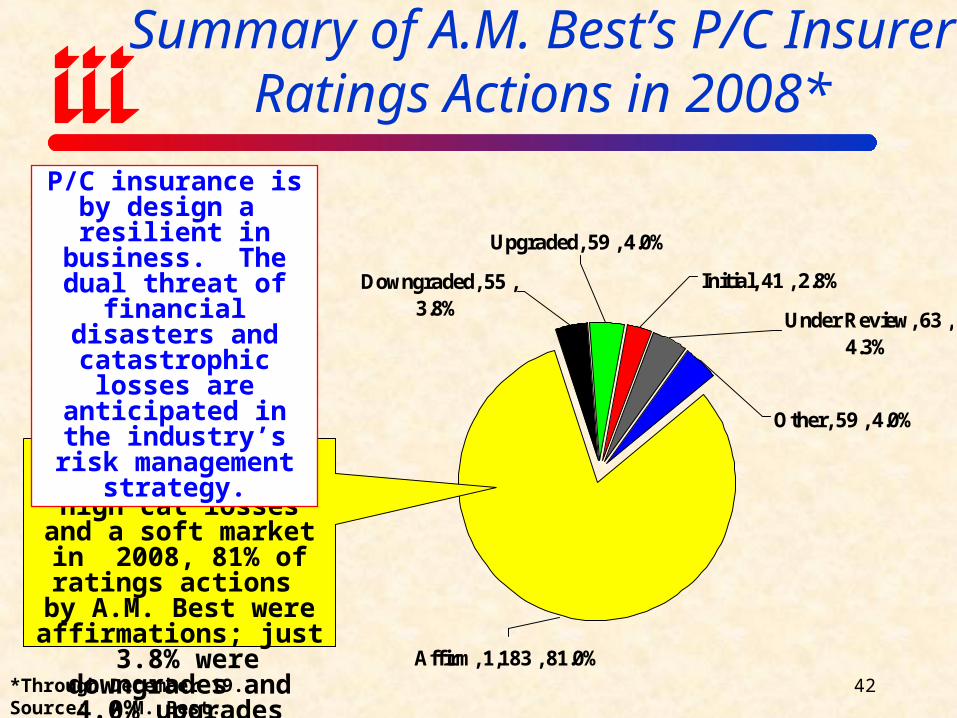
Summary of A.M. Best’s P/C Insurer Ratings Actions in 2008*
Under Review, 63 , 4.3%
Upgraded, 59 , 4.0%
Initial, 41 , 2.8%
Other, 59 , 4.0%
Affirm, 1,183 , 81.0%
Downgraded, 55 , 3.8%
*Through December 19.Source: A.M. Best.
42
Despite financial market turmoil, high cat losses and a soft market in 2008, 81% of ratings actions by A.M. Best
were affirmations; just 3.8% were downgrades
and 4.0% upgrades
P/C insurance is by design a resilient in business. The dual threat of financial
disasters and catastrophic losses are
anticipated in the industry’s risk
management strategy.

Reasons for US P/C Insurer Impairments, 1969-2005
*Includes overstatement of assets.
Source: A.M. Best: P/C Impairments Hit Near-Term Lows Despite Surging Hurricane Activity, Special Report, Nov. 2005;
Catastrophe Losses8.6%
Alleged Fraud11.4%
Deficient Loss
Reserves/In-adequate Pricing62.8%
Affiliate Problems
8.6%
Rapid Growth
8.6%
2003-2005 1969-2005
Deficient reserves,
CAT losses are more important factors in
recent years
Reinsurance Failure3.5%
Rapid Growth16.5%
Misc.9.2%
Affiliate Problems
5.6%
Sig. Change in Business
4.6%
Deficient Loss
Reserves/In-adequate Pricing38.2%
Investment Problems*
7.3%
Alleged Fraud8.6%
Catastrophe Losses6.5%
Critical Differences Between P/C
Insurers and BanksSuperior Risk Management Model
& Low Leverage Makea Big Difference
How Insurance Industry Stability Has Benefitted Consumers
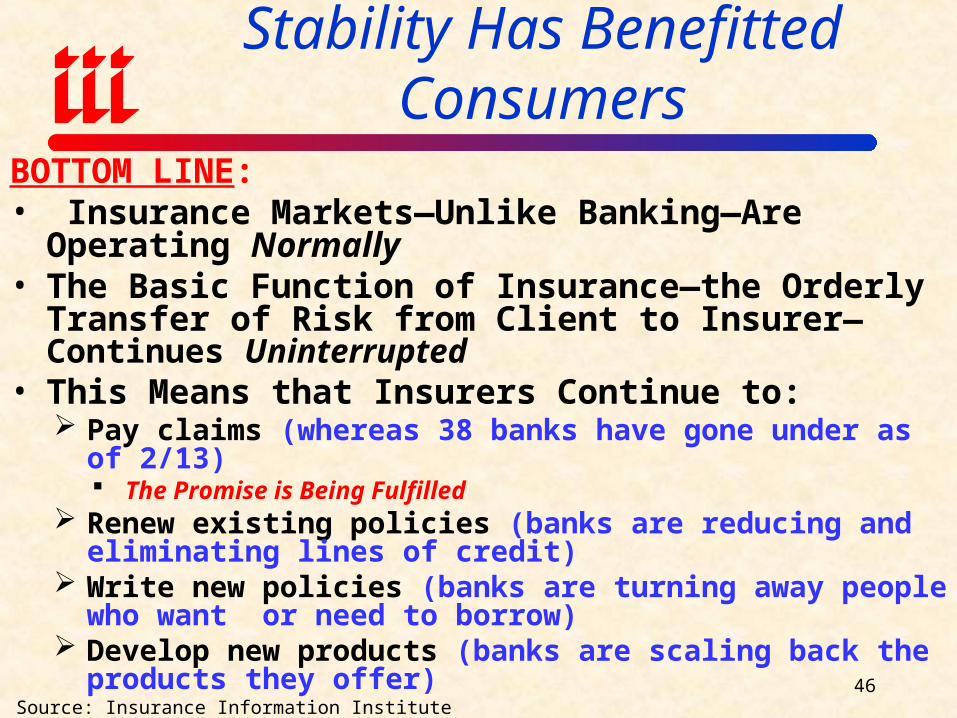
BOTTOM LINE:• Insurance Markets—Unlike Banking—Are Operating
Normally• The Basic Function of Insurance—the Orderly Transfer
of Risk from Client to Insurer—Continues Uninterrupted• This Means that Insurers Continue to:
Pay claims (whereas 38 banks have gone under as of 2/13) The Promise is Being Fulfilled
Renew existing policies (banks are reducing and eliminating lines of credit)
Write new policies (banks are turning away people who want or need to borrow)
Develop new products (banks are scaling back the products they offer)
Source: Insurance Information Institute46
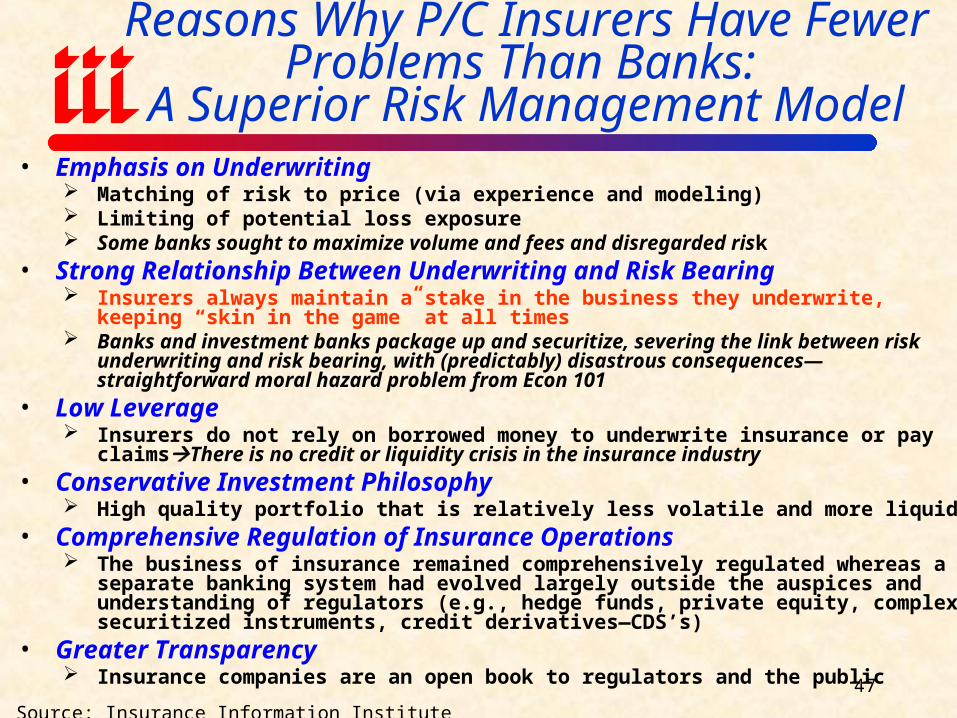
• Emphasis on Underwriting Matching of risk to price (via experience and modeling) Limiting of potential loss exposure Some banks sought to maximize volume and fees and disregarded risk
• Strong Relationship Between Underwriting and Risk Bearing Insurers always maintain a stake in the business they underwrite, keeping “skin in the game”
at all times Banks and investment banks package up and securitize, severing the link between risk
underwriting and risk bearing, with (predictably) disastrous consequences—straightforward moral hazard problem from Econ 101
• Low Leverage Insurers do not rely on borrowed money to underwrite insurance or pay claimsThere is no
credit or liquidity crisis in the insurance industry• Conservative Investment Philosophy
High quality portfolio that is relatively less volatile and more liquid• Comprehensive Regulation of Insurance Operations
The business of insurance remained comprehensively regulated whereas a separate banking system had evolved largely outside the auspices and understanding of regulators (e.g., hedge funds, private equity, complex securitized instruments, credit derivatives—CDS’s)
• Greater Transparency Insurance companies are an open book to regulators and the public
Source: Insurance Information Institute47
Reasons Why P/C Insurers Have Fewer Problems Than Banks:
A Superior Risk Management Model
The Financial Crisis in PerspectiveBank vs. Insurer Impacts
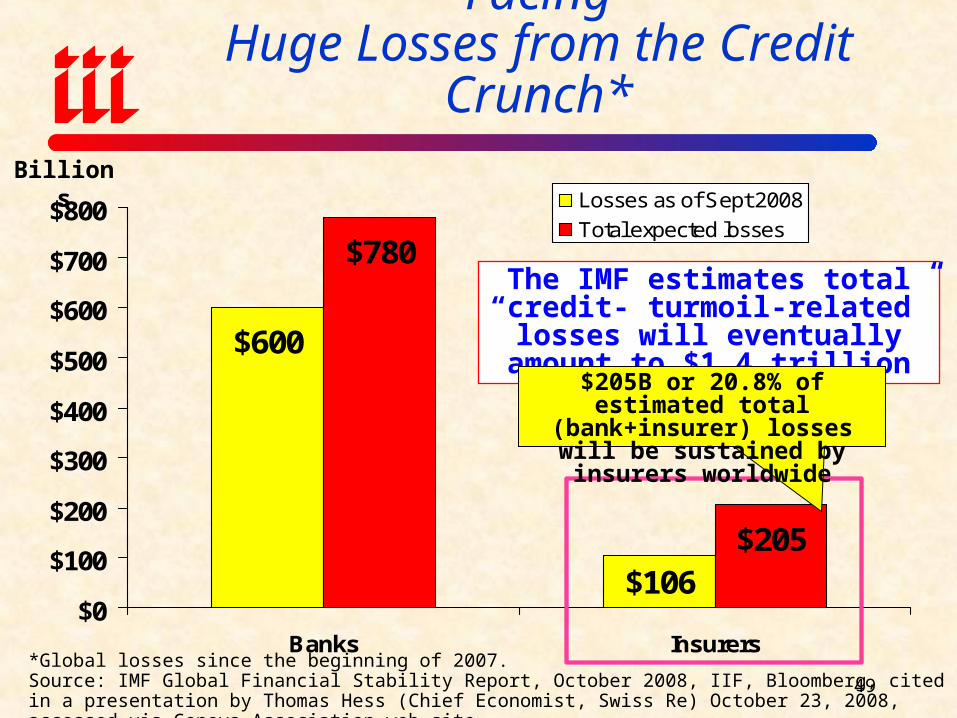
$600
$106
$780
$205
$0
$100
$200
$300
$400
$500
$600
$700
$800
Banks Insurers
Losses as of Sept 2008
Total expected losses
Financial Institutions Globally FacingHuge Losses from the Credit Crunch*
*Global losses since the beginning of 2007.Source: IMF Global Financial Stability Report, October 2008, IIF, Bloomberg, cited in a presentation by Thomas Hess (Chief Economist, Swiss Re) October 23, 2008, accessed via Geneva Association web site.
Billions
The IMF estimates total “credit- turmoil-related” losses will
eventually amount to $1.4 trillion
$205B or 20.8% of estimated total (bank+insurer) losses will be
sustained by insurers worldwide
49
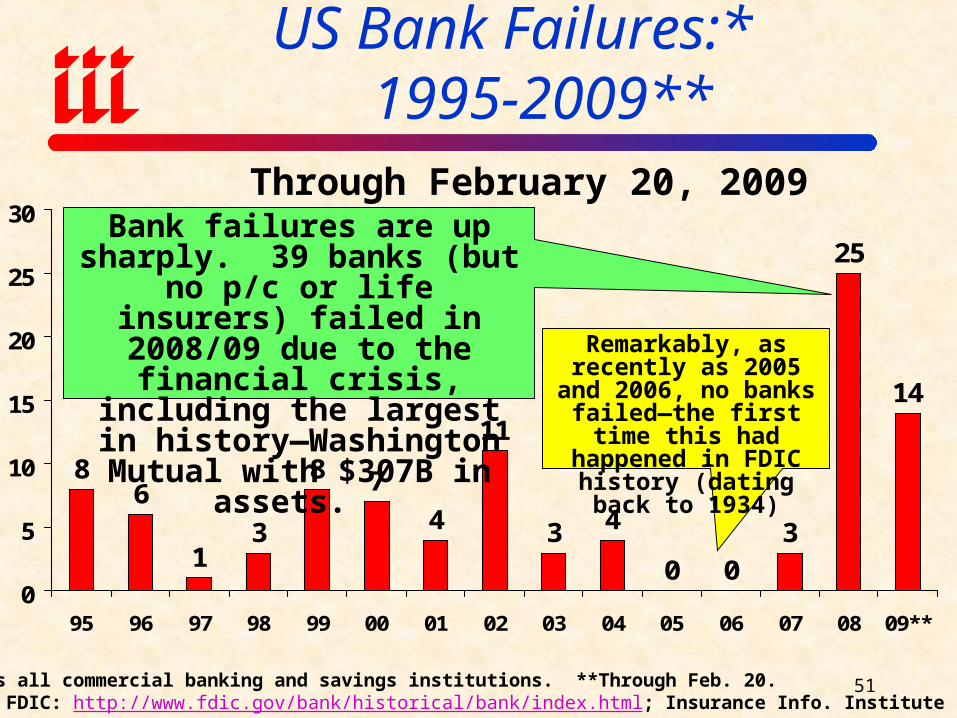
US Bank Failures:* 1995-2009**
86
13
8 7
4
11
3 4
0 0
3
25
14
0
5
10
15
20
25
30
95 96 97 98 99 00 01 02 03 04 05 06 07 08 09**
Through February 20, 2009
Remarkably, as recently as 2005 and 2006, no
banks failed—the first time this had happened in
FDIC history (dating back to 1934)
*Includes all commercial banking and savings institutions. **Through Feb. 20. Source: FDIC: http://www.fdic.gov/bank/historical/bank/index.html; Insurance Info. Institute
Bank failures are up sharply. 39 banks (but no p/c or life
insurers) failed in 2008/09 due to the financial crisis, including the largest in history—Washington Mutual with $307B in assets.
51

Top 10 P/C Insolvencies, Based Upon Guaranty Fund Payments*
$2,265.8
$1,272.7
$1,049.7$843.4
$699.4$566.5 $555.8 $543.1 $531.6 $516.8
$0
$500
$1,000
$1,500
$2,000
$2,500
* Disclaimer: This is not a complete picture. If anything the numbers are understated as some states have not reported in certain years.
Source: National Conference of Insurance Guaranty Funds, as of September 17, 2008.
$ MillionsThe 2001 bankruptcy of Reliance Insurance was the largest ever among p/c insurers
53
P/C INSURANCE FINANCIAL
PERFORMANCE
A Resilient Industry in Challenging Times

Profitability
Historically Volatile

P/C Net Income After Taxes1991-2009F ($ Millions)*
$14,
178
$5,8
40
$19,
316
$10,
870
$20,
598
$24,
404 $3
6,81
9
$30,
773
$21,
865
$3,0
46
$30,
029
$61,
940
$5,4
21
-$6,970
$65,
777
$44,
155
$20,
559
$38,
501
-$10,000
$0
$10,000
$20,000
$30,000
$40,000
$50,000
$60,000
$70,000
91 92 93 94 95 96 97 98 99 00 01 02 03 04 05 06 07
08F
*ROE figures are GAAP; 1Return on avg. surplus. 2008 numbers are annualized based on 9-mos. Actual of $4.066 billion.Sources: A.M. Best, ISO, Insurance Information Inst.
2001 ROE = -1.2%2002 ROE = 2.2%2003 ROE = 8.9%2004 ROE = 9.4%2005 ROE= 9.4%2006 ROE = 12.2%2007 ROAS1 = 12.3%2008 ROAS = 1.1%*
Insurer profits peaked in 2006.
56
-5%
0%
5%
10%
15%
20%
25%
75 76 77 78 79 80 81 82 83 84 85 86 87 88 89 90 91 92 93 94 95 96 97 98 99 00 01 02 03 04 05 06 0608
F09
F10
F
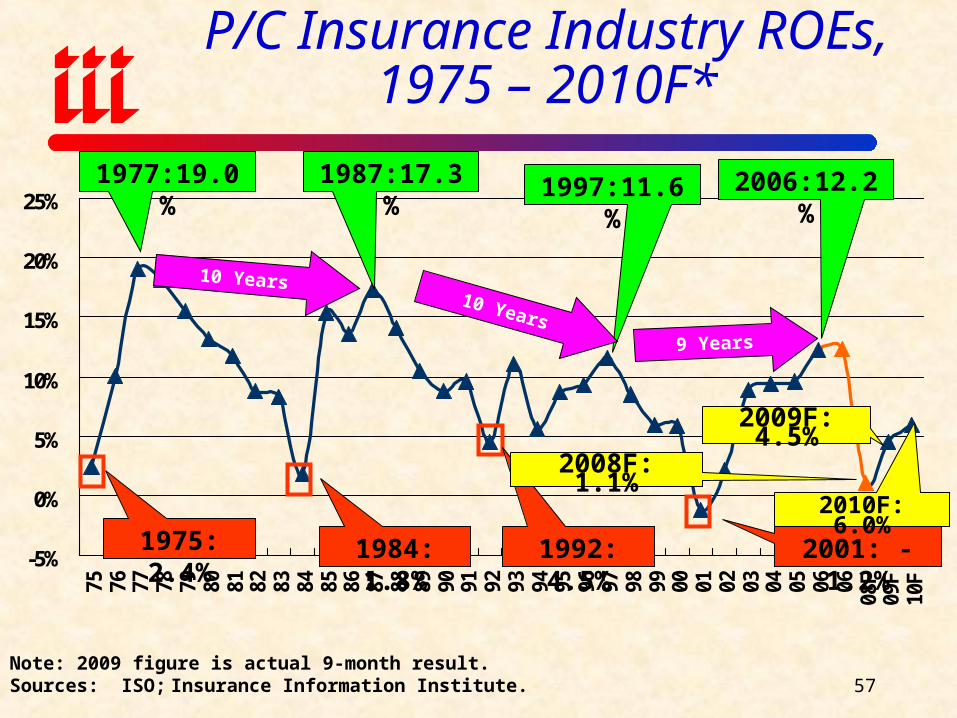
1975: 2.4%
1977:19.0% 1987:17.3% 1997:11.6% 2006:12.2%
1984: 1.8% 1992: 4.5% 2001: -1.2%
10 Years10 Years
9 Years
Note: 2009 figure is actual 9-month result.Sources: ISO; Insurance Information Institute.
2008F: 1.1%
P/C Insurance Industry ROEs,1975 – 2010F*
2010F: 6.0%
2009F: 4.5%
57

-4%
-2%
0%
2%
4%
6%
8%
10%
12%
14%
16%
18%
91 92 93 94 95 96 97 98 99 00 01 02 03 04 05 06 07 08*
ROE Cost of Capital
ROE vs. Equity Cost of Capital:US P/C Insurance:1991-2008:Q3
*Excludes mortgage and financial guarantee insurers.Source: The Geneva Association, Ins. Information Inst.
The p/c insurance industry fell well short of is cost of capital in 2008
-13.
2 p
ts
US P/C insurers missed their cost of capital by an average 6.7 points from 1991 to 2002, but on
target or better 2003-07
-1.7
pts
+2.
3 p
ts
-9.0
pts
The cost of capital is the rate of return
insurers need to attract and retain
capital to the business
-9.7
pts
58

Presidential Politics & P/C Insurance
How is Profitability Affected by the President’s Political Party?
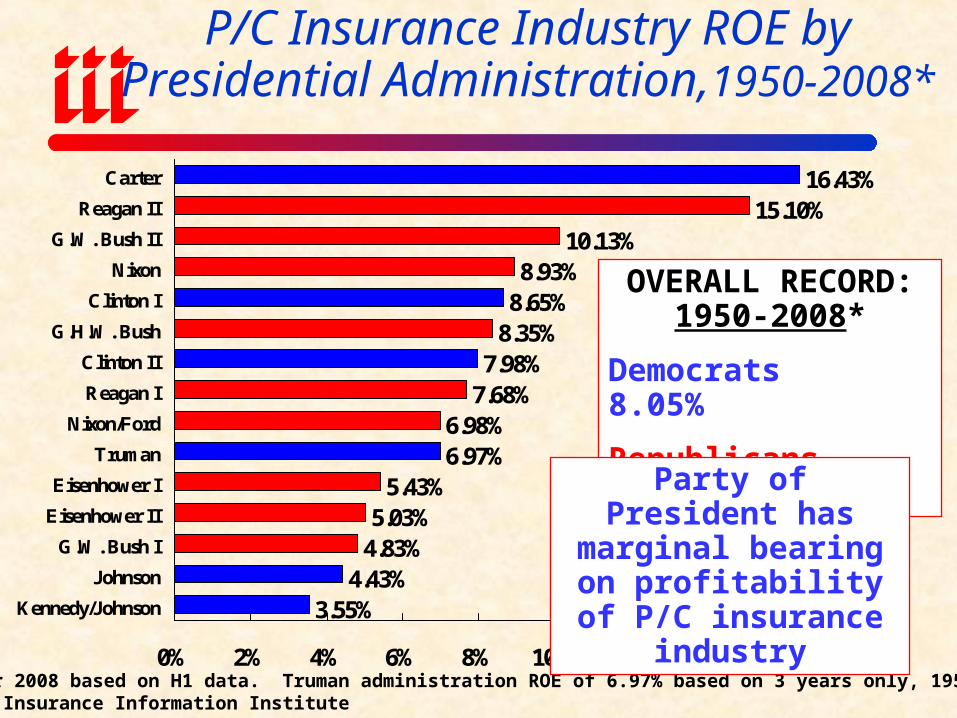
15.10%10.13%
8.93%8.65%
8.35%7.98%
7.68%6.98%6.97%
5.43%5.03%
4.83%4.43%
3.55%
16.43%
0% 2% 4% 6% 8% 10% 12% 14% 16% 18%
Carter
Reagan II
G.W. Bush II
Nixon
Clinton I
G.H.W. Bush
Clinton II
Reagan I
Nixon/Ford
Truman
Eisenhower I
Eisenhower II
G.W. Bush I
Johnson
Kennedy/Johnson
*ROE for 2008 based on H1 data. Truman administration ROE of 6.97% based on 3 years only, 1950-52.Source: Insurance Information Institute
OVERALL RECORD: 1950-2008*
Democrats 8.05%
Republicans 8.02%
Party of President has marginal bearing on profitability of P/C insurance industry
P/C Insurance Industry ROE byPresidential Administration,1950-2008*
P/C Premium Growth
Primarily Driven by the Industry’s Underwriting Cycle, Not the Economy

-2%
0%
2%
4%
6%
8%
10%
12%
14%
16%
18%
20%
22%
24%
1971
1972
1973
1974
1975
1976
1977
1978
1979
1980
1981
1982
1983
1984
1985
1986
1987
1988
1989
1990
1991
1992
1993
1994
1995
1996
1997
1998
1999
2000
2001
2002
2003
2004
2005
2006
2007
2008
F20
09F
Sources: A.M. Best (historical and forecast), ISO, Insurance Information Institute
Strength of Recent Hard Marketsby NWP Growth
1975-78 1984-87 2000-03Shaded areas denote “hard
market” periods
Net written premiums fell 1.0%
in 2007 (first decline since 1943)
and by 0.4% in 2008, the first back-
to-back decline since 1930-33
63

Year-to-Year Change in Net Written Premium, 2000-2009F*
*2008 figure is 9-month actual result from ISO.Source: A.M. Best (historical and forecast)
5.0%
8.4%
15.3%
10.0%
3.9%
0.5%
4.2%
-1.0% -0.4%
0.9%
2000 2001 2002 2003 2004 2005 2006 2007 2008F 2009F
P/C insurers are experiencing their
slowest growth rates since 1930-33
Slow growth means retention is critical
Protracted period of
negative or slow growth is possible due to soft
markets and slow
economy
64

Personal/Commercial Lines & Reinsurance NPW Growth, 2006-2009F
2.0% 3.5%
2.5% 5.
0%
28.1%
-0.3
%
0.0%
-11.9%-3.8
%
1.0%
7.6%
-1.4
%-15%
-10%
-5%
0%
5%
10%
15%
20%
25%
30%
35%
Personal Commercial Reinsurance
2006 2007 2008E 2009F
Sources: A.M. Best Review & Preview, Feb. 2009
Declines in premium growth began to stabilize in later 2008 and are firming to some extent as we move into 2009, but are partly offset by flat/declining exposures due to the recession

Capital/Policyholder
Surplus
Shrinkage, but Capital is Within Historic Norms

$0
$50
$100
$150
$200
$250
$300
$350
$400
$450
$500
$550
75 76 77 78 79 80 81 82 83 84 85 86 87 88 89 90 91 92 93 94 95 96 97 98 99 00 01 02 03 04 05 06 07 08
U.S. Policyholder Surplus: 1975-2008*
Source: A.M. Best, ISO, Insurance Information Institute. *Towers Perrin estimate as of 12/31/08
$ B
illi
ons
“Surplus” is a measure of underwriting capacity. It is analogous to “Owners Equity” or “Net Worth” in non-insurance organizations
Actual capacity as of 9/30/08 was $478.5, down 7.6% from 12/31/07 at $517.9B, but 68% above its 2002
trough. Recent peak was $521.8 as of 9/30/07. Estimate as of 12/31/08 is $438B is 16% below 2007
peak.
The premium-to-surplus ratio stood at $0.94:$1 at year end 2008, up from
near record low of $0.85:$1 at year-end 2007
67
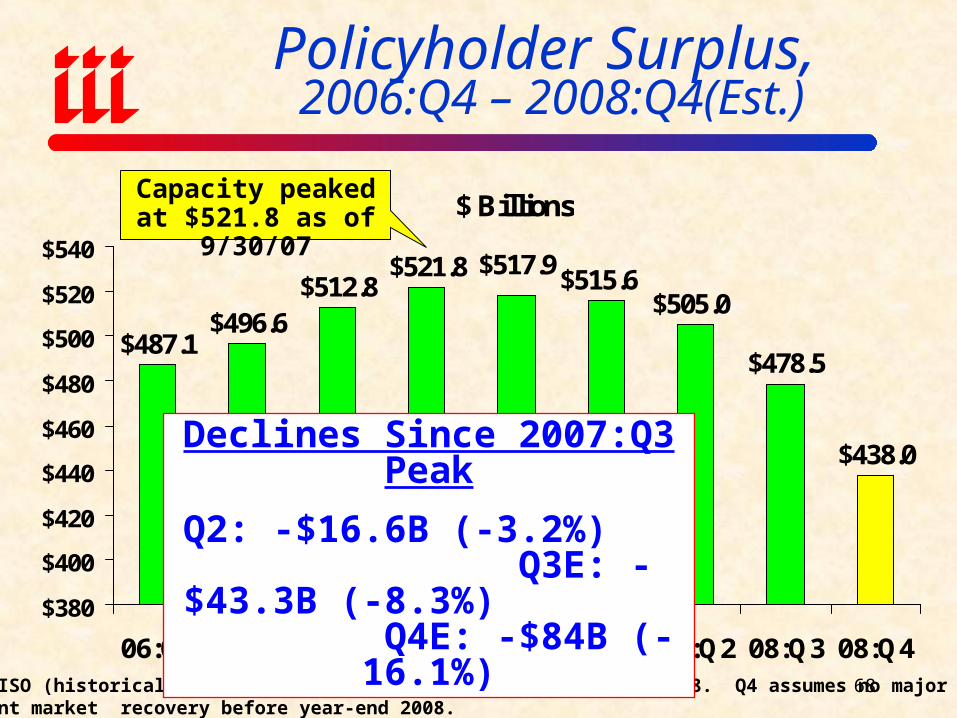
Policyholder Surplus, 2006:Q4 – 2008:Q4(Est.)
$ Billions
$487.1$496.6
$512.8$521.8
$478.5
$438.0
$505.0$515.6
$517.9
$380
$400
$420
$440
$460
$480
$500
$520
$540
06:Q4 07:Q1 07:Q2 07:Q3 07:Q4 08:Q1 08:Q2 08:Q3 08:Q4
Source: ISO (historical); Towers Perrin (Oct. 21) estimates for Q4 2008. Q4 assumes no major Investment market recovery before year-end 2008.
Declines Since 2007:Q3 Peak
Q2: -$16.6B (-3.2%) Q3E: -$43.3B (-8.3%)
Q4E: -$84B (-16.1%)
Capacity peaked at $521.8 as of 9/30/07
68
0.8
1.0
1.2
1.4
1.6
1.8
2.0
85 86 87 88 89 90 91 92 93 94 95 96 97 98 99 00 01 02 03 04 05 06 0708:Q3
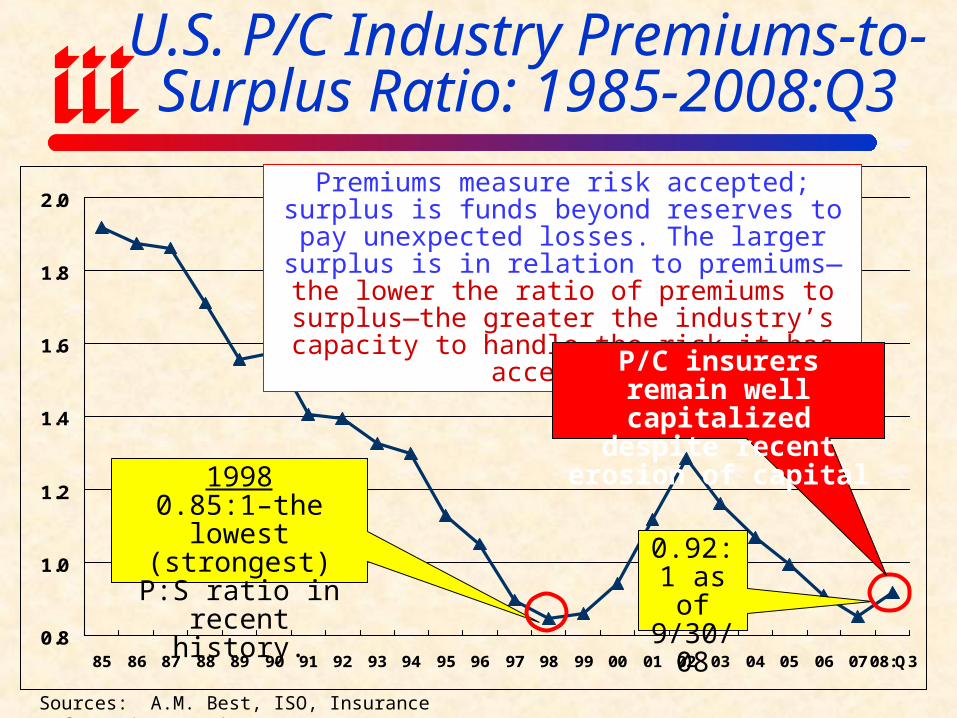
U.S. P/C Industry Premiums-to-Surplus Ratio: 1985-2008:Q3
Sources: A.M. Best, ISO, Insurance Information Institute.
19980.85:1–the lowest
(strongest) P:S ratio in recent history.
Premiums measure risk accepted; surplus is funds beyond reserves to pay unexpected losses. The larger
surplus is in relation to premiums—the lower the ratio of premiums to surplus—the greater the
industry’s capacity to handle the risk it has accepted.
0.92:1 as of
9/30/08
P/C insurers remain well capitalized despite recent
erosion of capital

-10%
-5%
0%
5%
10%
15%
20%
25%
30%
19
78
19
79
19
80
19
81
19
82
19
83
19
84
19
85
19
86
19
87
19
88
19
89
19
90
19
91
19
92
19
93
19
94
19
95
19
96
19
97
19
98
19
99
20
00
20
01
20
02
20
03
20
04
20
05
20
06
20
07
20
08
*
NWP % changeSurplus % change
*Actual 9-month 2008 result.Sources: A.M. Best, ISO, Insurance Information Institute
Historically, Hard Markets Follow When Surplus “Growth” is Negative
Sharp decline in capacity is a necessary but not sufficient
condition for a true hard market

Investment Performance
Investments are the Principle Source of Declining
Profitability
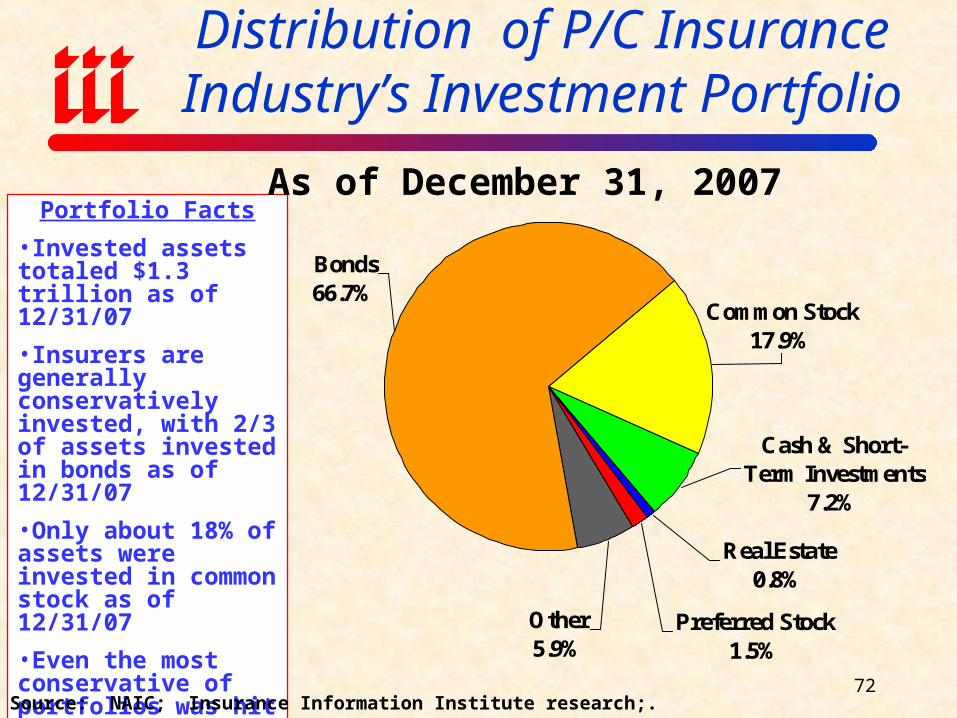
Distribution of P/C Insurance Industry’s Investment Portfolio
Cash & Short-Term Investments
7.2%
Common Stock17.9%
Bonds66.7%
Preferred Stock1.5%
Real Estate0.8%
Other5.9%
Portfolio Facts
•Invested assets totaled $1.3 trillion as of 12/31/07
•Insurers are generally conservatively invested, with 2/3 of assets invested in bonds as of 12/31/07
•Only about 18% of assets were invested in common stock as of 12/31/07
•Even the most conservative of portfolios was hit hard in 2008
Source: NAIC; Insurance Information Institute research;.
As of December 31, 2007
72

Property/Casualty Insurance Industry Investment Gain:1994- 2008:Q3 1
$ Billions
$35.4
$42.8$47.2
$52.3
$44.4
$36.0
$45.3$48.9
$59.4$55.7
$63.6
$28.3
$56.9$51.9
$57.9
$0
$10
$20
$30
$40
$50
$60
1Investment gains consist primarily of interest, stock dividends and realized capital gains and losses. 2006 figure consists of $52.3B net investment income and $3.4B realized investment gain. *2005 figure includes special one-time dividend of $3.2B.Sources: ISO; Insurance Information Institute.
Investment gains are off sharply in 2008 due to lower yields and poor equity market conditions.
73
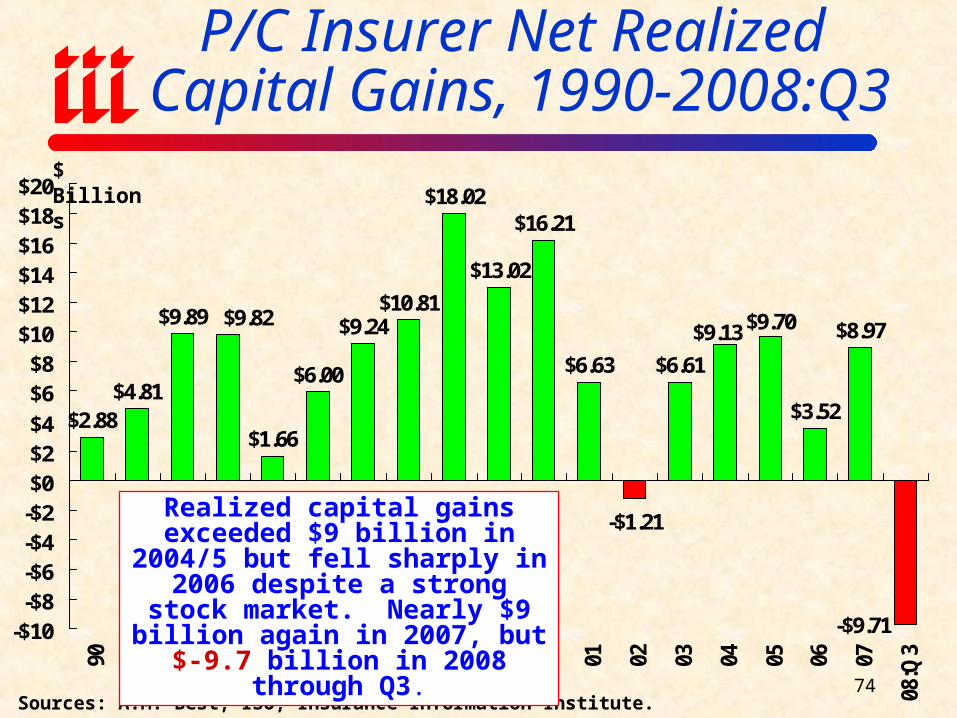
P/C Insurer Net Realized Capital Gains, 1990-2008:Q3
$2.88$4.81
$9.89
$1.66
$6.00
$9.24$10.81
$13.02
$16.21
$6.63
-$1.21
$6.61
$8.97
-$9.71
$18.02
$3.52
$9.70$9.13$9.82
-$10-$8-$6-$4-$2$0$2$4
$6$8
$10$12$14$16$18$20
90 91 92 93 94 95 96 97 98 99 00 01 02 03 04 05 06 07
08:Q
3
Sources: A.M. Best, ISO, Insurance Information Institute.
Realized capital gains exceeded $9 billion in 2004/5 but fell sharply in
2006 despite a strong stock market. Nearly $9 billion again in 2007, but
$-9.7 billion in 2008 through Q3.
$ Billions
74

Credit Default Swaps: Notional Value Outstanding, 2002:H2 – 2008:H1*
*End of calendar half (H1 = June 30, H2 = December 31).
Source: International Swaps and Derivatives Association: http://www.isda.org/statistics/recent.html
$1.6 $2.7 $3.8 $5.4$8.4
$12.4$17.1
$26.0
$34.4
$45.5
$62.2
$54.6
$0
$10
$20
$30
$40
$50
$60
$70
02:H2 03:H1 03:H2 04:H1 04:H2 05:H1 05:H2 06:H1 06:H2 07:H1 07:H2 08:H1
$ TrillionsAt year end 2007, the
notional value of CDS’s outstanding was $62.2
trillion or 4.5 times US GDP, up nearly 40 fold from 2002.
The 12% decline in 08:H1 was the first since 2001.
The NY DOI has proposed regulated some CDS’s as
insurance. Not all states feel they have this authority. NAIC is less interested.

Underwriting Trends
Financial Crisis Does Not Directly Impact Underwriting
Performance: Cycle, Catastrophes Were 2008’s Drivers

90
95
100
105
110
115
120
70
71
72
73
74
75
76
77
78
79
80
81
82
83
84
85
86
87
88
89
90
91
92
93
94
95
96
97
98
99
00
01
02
03
04
05
06
07
08
F
Combined Ratios
1970s: 100.3
1980s: 109.2
1990s: 107.8
2000s: 102.0*
Sources: A.M. Best; ISO, III *A.M. Best year end estimate of 103.2; Actual 9-mos. result was 105.6.
P/C Insurance Combined Ratio, 1970-2008F*
80

115.8
107.5
100.198.4
100.8
92.6
101
103.3101.2
95.7
90
100
110
120
2001 2002 2003 2004 2005 2006 2007 2008 2008* 2009F
P/C Insurance Industry Combined Ratio, 2001-2009E
*Includes Mortgage & Financial Guarantee insurers. Sources: A.M. Best.
Best combined ratio since 1949
(87.6)
As recently as 2001, insurers paid out nearly $1.16 for every
$1 in earned premiums
Relatively low CAT
losses, reserve releases
Including Mortgage
& Fin. Guarantee insurers
Cyclical Deterioration
81
2005 ratio benefited from heavy use of reinsurance which lowered net losses
-55-50-45-40-35-30-25-20-15-10-505
101520253035
75
76
77
78
79
80
81
82
83
84
85
86
87
88
89
90
91
92
93
94
95
96
97
98
99
00
01
02
03
04
05
06
07
08
Source: A.M. Best, ISO; Insurance Information Institute * Includes mortgage & finl. guarantee insurers
$ B
illi
ons
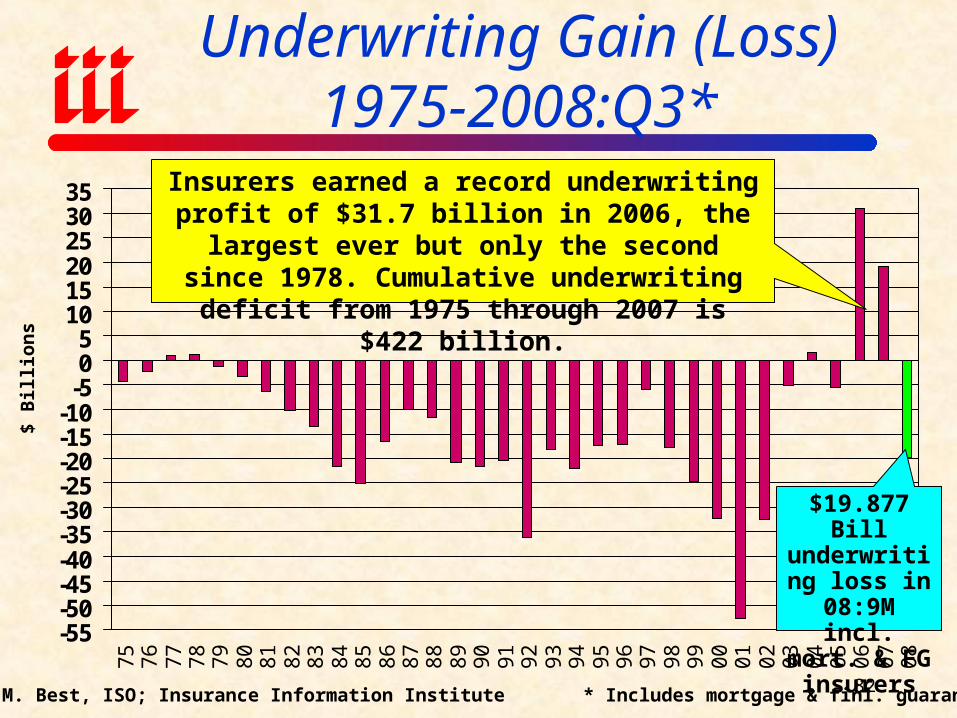
Insurers earned a record underwriting profit of $31.7 billion in 2006, the largest ever but only the
second since 1978. Cumulative underwriting deficit from 1975 through 2007 is $422 billion.
Underwriting Gain (Loss)1975-2008:Q3*
$19.877 Bill underwriting loss in 08:9M incl. mort. & FG insurers
82

Number of Years With Underwriting Profits by Decade, 1920s –2000s
67
10
8
45
0 0
3
0
2
4
6
8
10
1920s 1930s 1940s 1950s 1960s 1970s 1980s 1990s 2000s*
Note: Data for 1920 – 1934 based on stock companies only.Sources: Insurance Information Institute research from A.M. Best Data. *2000 through 2008.
Number of Years with Underwriting ProfitsUnderwriting profits were common before the 1980s (40 of the 60 years
before 1980 had combined ratios below 100)—but then they vanished. Not a single underwriting profit was recorded in the 25 years from 1979
through 2003.
83

Commercial Lines
110.
3
110.
2
107.
6
103.
9
109.
7
112.
3
111.
1
122.
3
110.
2
102.
5
105.
4
91.1
95.1
106.
5
105.
1
102.
0
112.
5
85
90
95
100
105
110
115
120
125
93 94 95 96 97 98 99 00 01 02 03 04 05 06 07 08E 09F
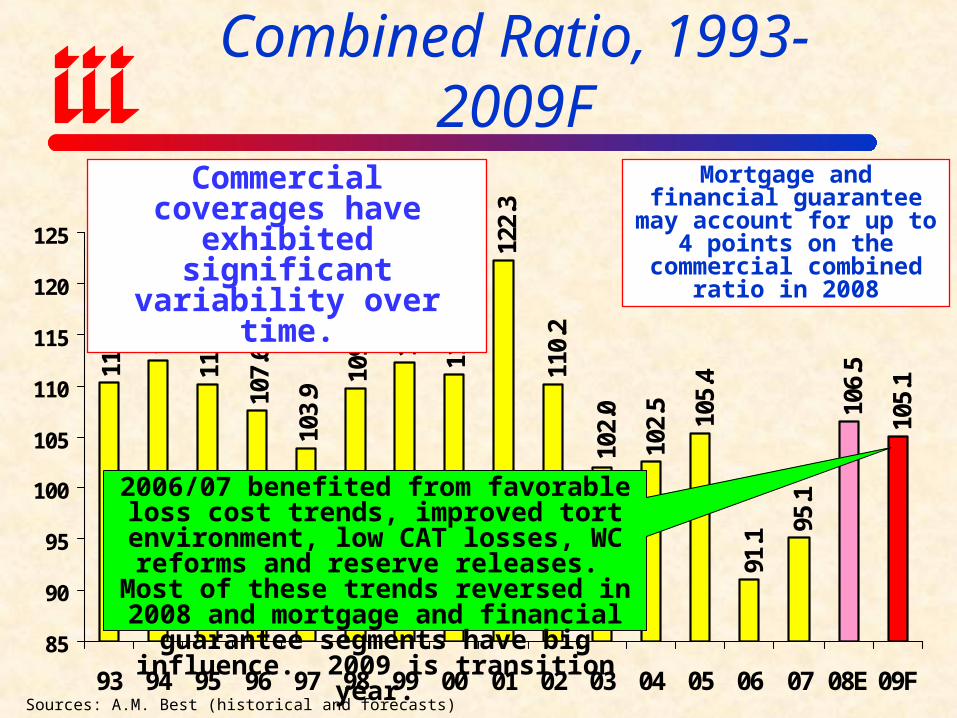
2006/07 benefited from favorable loss cost trends, improved tort environment, low CAT
losses, WC reforms and reserve releases. Most of these trends reversed in 2008 and
mortgage and financial guarantee segments have big influence. 2009 is transition year.
Commercial coverages have exhibited significant
variability over time.
Commercial Lines Combined Ratio, 1993-2009F
Mortgage and financial guarantee may account for up to 4 points on the commercial
combined ratio in 2008
Sources: A.M. Best (historical and forecasts)

Average Commercial Rate Change,All Lines, (1Q:2004 – 4Q:2008)
-3.2
%
-5.9
%
-7.0
%
-9.4
%
-9.7
% -8.2
%
-4.6
% -2.7
%
-3.0
%
-5.3
%
-9.6
%
-11.
3%
-11.
8%
-13.
3% -12.
0%
-13.
5%
-12.
9% -11.
0%
-6.0
%
-16%
-14%
-12%
-10%
-8%
-6%
-4%
-2%
0%
1Q04
2Q04
3Q04
4Q04
1Q05
2Q05
3Q05
4Q05
1Q06
2Q06
3Q06
4Q06
1Q07
2Q07
3Q07
4Q07
1Q08
2Q08
3Q08
4Q08
Source: Council of Insurance Agents & Brokers; Insurance Information Institute
KRW Effect
-0.1
% Magnitude of price declines is now
shrinking. Reflects shrinking capital,
reduced investment gains, deteriorating
underwriting performance and
costlier reinsurance

119.0
119.8
10
8.5
12
5.0
113.1
115.0
12
1.0
116.2
116.1
10
4.9
10
1.9 10
5.5
92
.1
10
6.0
10
6.5
10
0.7
116.8
113.6
115.3
12
2.4
115.0
117.0
97
.3
89
.0
97
.7
93
.8
83
.6
80
85
90
95
100
105
110
115
120
125
130
95 96 97 98 99 00 01 02 03 04 05 06 07 08E 09F
CMP-Liability
CMP-Non-Liability
Commercial Multi-Peril Combined (Liability vs. Non-Liability Portion)*
CMP- has improved recently
Sources: A.M. Best (historical and forecasts) *Includes both liability and property damage for years 2007-2009F.

112.1
112
113 11
5.9
12
0.5
12
0.1
12
2.5
10
5.6
99
.4
92
.9
92
.1
92
.4 94
.2
98
.5 10
1.5
90
95
100
105
110
115
120
125
95 96 97 98 99 00 01 02 03 04 05 06 07 08E 09F
Commercial Auto Combined Ratio (1995-2009F)
Average
1995 to 2008 = 106.5
CMP improved dramatically from 2001 to
2006, but has since experienced deteriorating results due primarily to soft market conditions
Sources: A.M. Best (historical and forecasts) *Includes both liability and property damage.

82.5
89.8
77.2
79.5
90.5
82.5
70
75
80
85
90
95
04 05 06 07 08E 09F
Inland Marine Combined Ratio (2004-2009F)
Average
2004 to 2008E = 83.9
Inland Marine is consistently among the most profitable of all
commercial lines. The line will benefit from
infrastructure spending in the $787B
stimulus package
Sources: A.M. Best (historical and forecasts)
94
102
97
111 110107
103
93
99102
106
100 101
107
115118
122
80
85
90
95
100
105
110
115
120
125
1994 1995 1996 1997 1998 1999 2000 2001 2002 2003 2004 2005 2006 2007 2008P 2009F
Percent
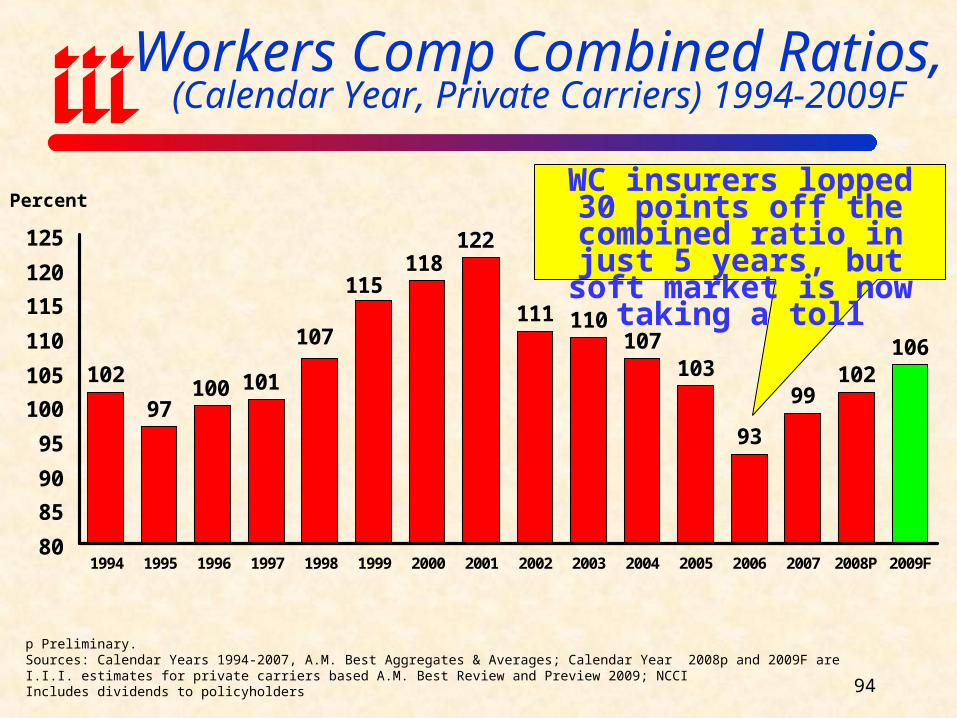
Workers Comp Combined Ratios, (Calendar Year, Private Carriers) 1994-2009F
WC insurers lopped 30 points off the combined
ratio in just 5 years, but soft market is now taking a toll
p Preliminary. Sources: Calendar Years 1994-2007, A.M. Best Aggregates & Averages; Calendar Year 2008p and 2009F are I.I.I. estimates for private carriers based A.M. Best Review and Preview 2009; NCCIIncludes dividends to policyholders
95
Workers Compensation Medical Claim Trends
96
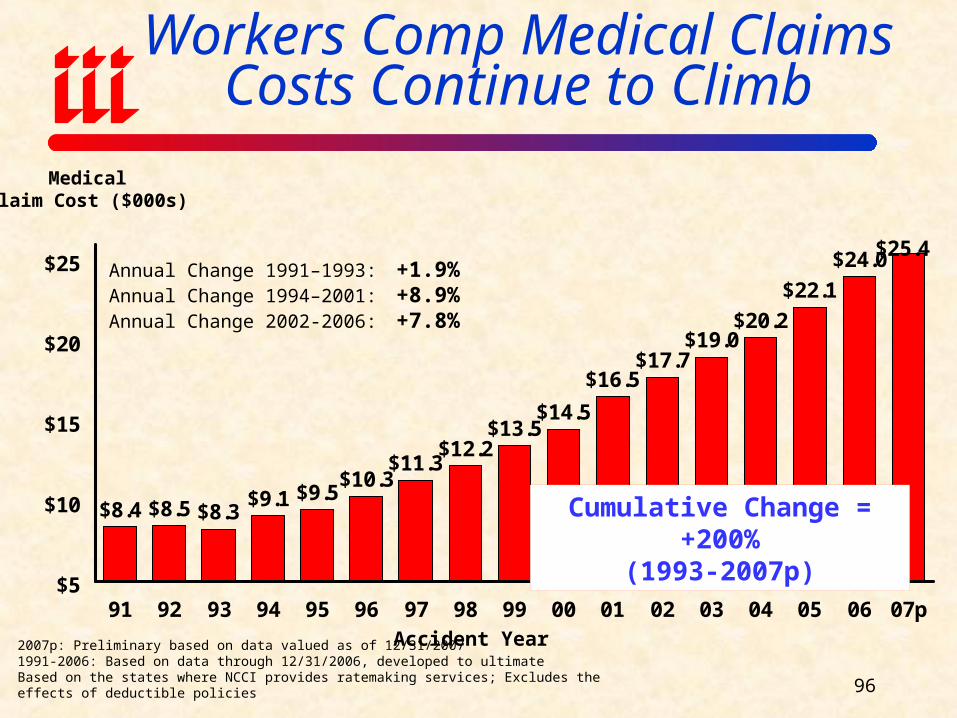
$8.4 $8.5 $8.3$9.1 $9.5
$10.3$11.3
$12.2$13.5
$14.5
$16.5$17.7
$19.0$20.2
$22.1
$24.0$25.4
$5
$10
$15
$20
$25
91 92 93 94 95 96 97 98 99 00 01 02 03 04 05 06 07p
Annual Change 1991–1993: +1.9%Annual Change 1994–2001: +8.9%Annual Change 2002-2006: +7.8%
Accident Year
MedicalClaim Cost ($000s)
2007p: Preliminary based on data valued as of 12/31/20071991-2006: Based on data through 12/31/2006, developed to ultimateBased on the states where NCCI provides ratemaking services; Excludes the effects of deductible policies
Workers Comp Medical Claims Costs Continue to Climb
Cumulative Change = +200%(1993-2007p)
97
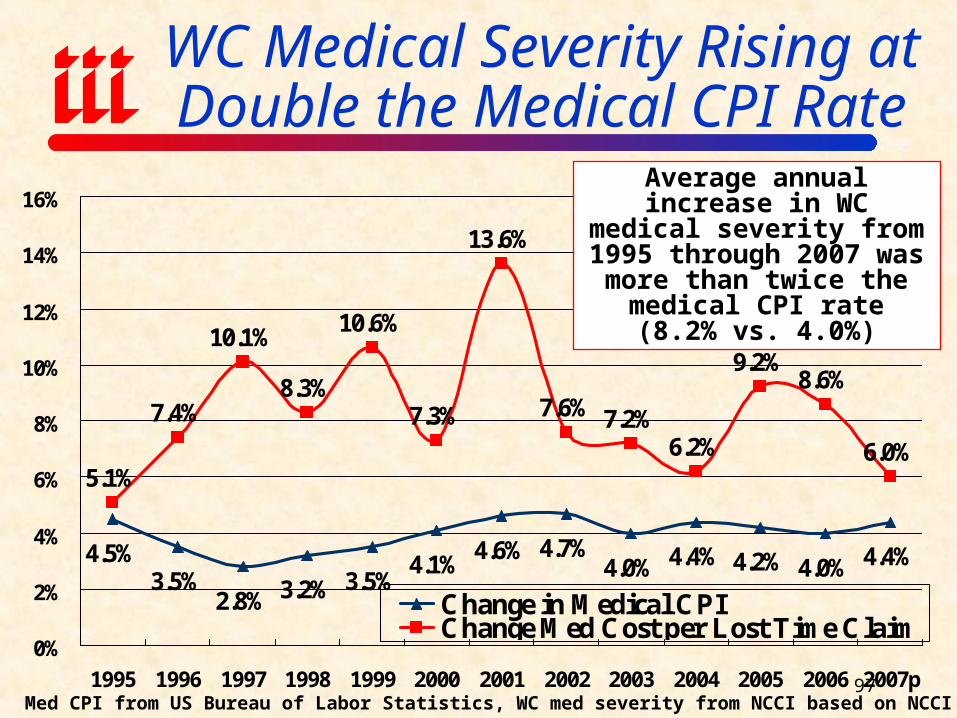
4.5%3.5%
2.8% 3.2% 3.5%4.1%
4.6% 4.7%4.0% 4.4% 4.2% 4.0% 4.4%
5.1%
7.4%
10.1%
8.3%
10.6%
7.3%
13.6%
7.6% 7.2%6.2%
9.2%8.6%
6.0%
0%
2%
4%
6%
8%
10%
12%
14%
16%
1995 1996 1997 1998 1999 2000 2001 2002 2003 2004 2005 2006 2007p
Change in Medical CPIChange Med Cost per Lost Time Claim
WC Medical Severity Rising at Double the Medical CPI Rate
Sources: Med CPI from US Bureau of Labor Statistics, WC med severity from NCCI based on NCCI states.
Average annual increase in WC medical severity from
1995 through 2007 was more than twice the medical CPI
rate (8.2% vs. 4.0%)

98
Med Costs Share of Total Costs is Increasing Steadily
Indemnity54%
Medical46%
Source: NCCI (based on states where NCCI provides ratemaking services).
Indemnity47% Medical
53%
Indemnity41%
Medical59%1987
1997
2007p
99
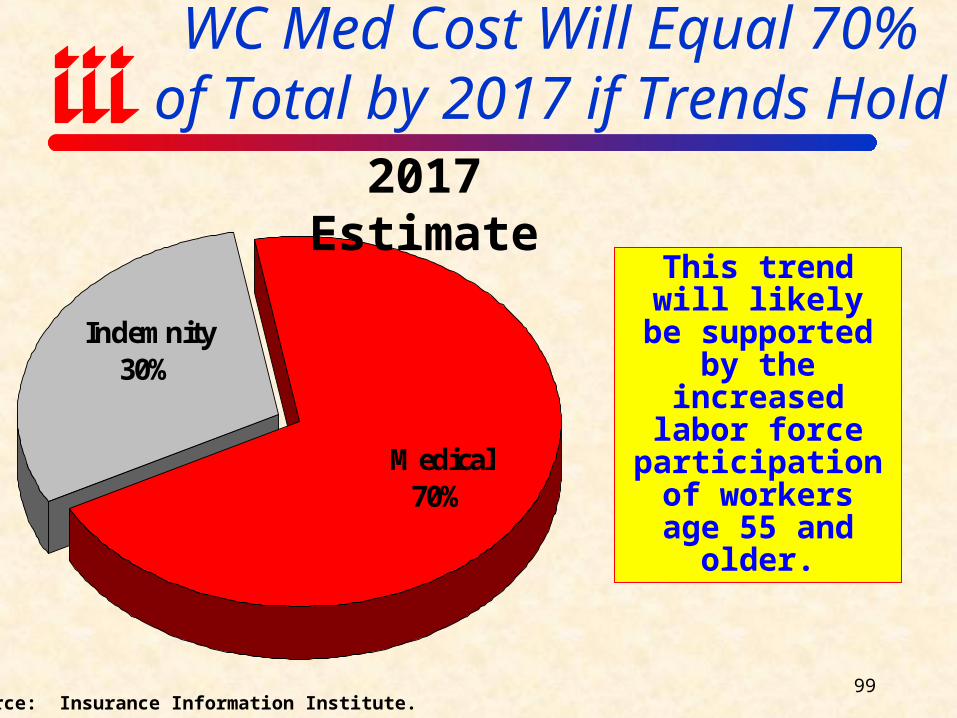
WC Med Cost Will Equal 70% of Total by 2017 if Trends Hold
Source: Insurance Information Institute.
Indemnity30%
Medical70%
2017 Estimate
This trend will likely be supported
by the increased labor force
participation of workers age 55 and
older.

Advertising
Unlike in Post 9/11 Period, Insurer Advertising Likely to
Remain Strong

Advertising Expenditures by P/C Insurance Industry, 1999-2007
$ Billions
$1.736 $1.737 $1.803 $1.708
$3.426
$4.102
$2.975
$2.111$1.882
$1.5
$2.0
$2.5
$3.0
$3.5
$4.0
$4.5
99 00 01 02 03 04 05 06 07
Source: Insurance Information Institute from consolidated P/C Annual Statement data.
Ad spending by P/C insurers is at a record high, signaling
increased competition
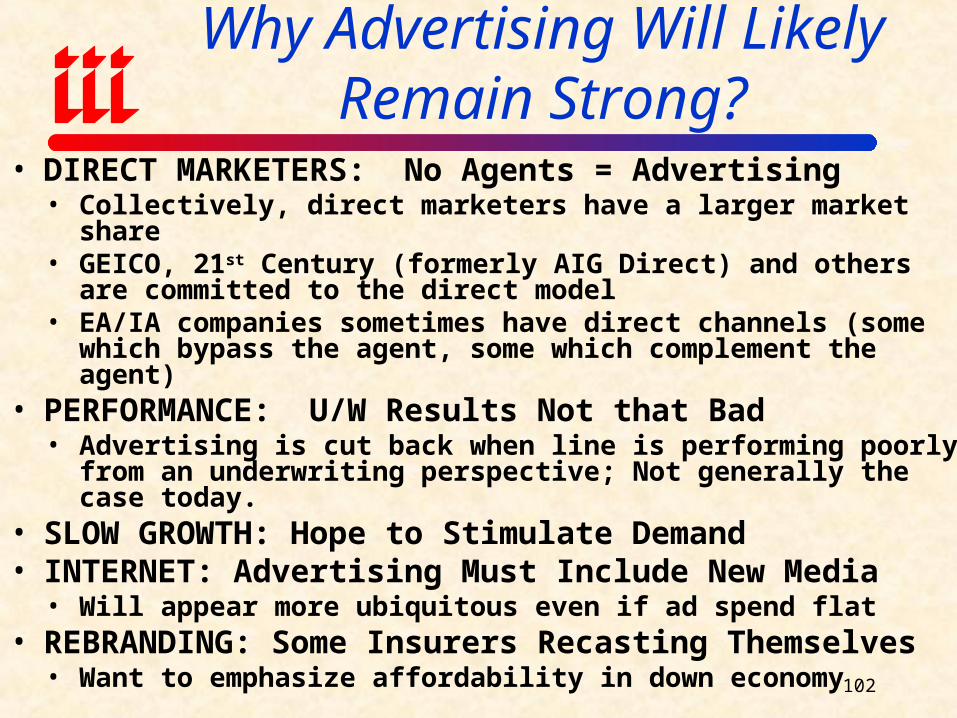
Why Advertising Will Likely Remain Strong?
• DIRECT MARKETERS: No Agents = Advertising• Collectively, direct marketers have a larger market share• GEICO, 21st Century (formerly AIG Direct) and others are
committed to the direct model• EA/IA companies sometimes have direct channels (some which
bypass the agent, some which complement the agent)• PERFORMANCE: U/W Results Not that Bad
• Advertising is cut back when line is performing poorly from an underwriting perspective; Not generally the case today.
• SLOW GROWTH: Hope to Stimulate Demand• INTERNET: Advertising Must Include New Media
• Will appear more ubiquitous even if ad spend flat• REBRANDING: Some Insurers Recasting Themselves
• Want to emphasize affordability in down economy 102
Catastrophe Losses
Impacting Underwriting Results and the Bottom Line

U.S. Insured Catastrophe Losses*$7
.5
$2.7
$4.7
$22.
9
$5.5 $1
6.9
$8.3
$7.4
$2.6 $1
0.1
$8.3
$4.6
$26.
5
$5.9 $1
2.9 $2
7.5
$6.7
$25.
2$1
00.0
$61.
9
$9.2
$0
$20
$40
$60
$80
$100
$120
89 90 91 92 93 94 95 96 97 98 99 00 01 02 03 04 05 06 07
08**
20??
*Excludes $4B-$6b offshore energy losses from Hurricanes Katrina & Rita.**Based on PCS data through Dec. 31. PCS $2.1B loss of for Gustav. $10.655B for Ike of 12/05/08.Note: 2001 figure includes $20.3B for 9/11 losses reported through 12/31/01. Includes only business and personal property claims, business interruption and auto claims. Non-prop/BI losses = $12.2B.Source: Property Claims Service/ISO; Insurance Information Institute
$ Billions2008 CAT losses exceeded
2006/07 combined. 2005 was by far the worst year ever for
insured catastrophe losses in the US, but the worst has yet to come.
$100 Billion CAT year is coming soon
104
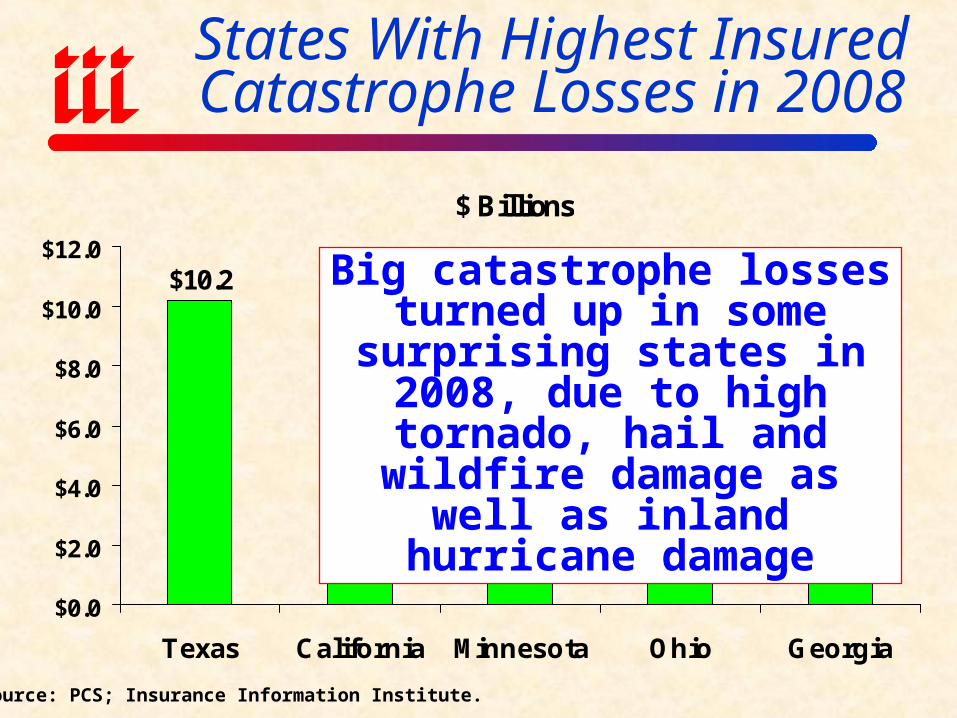
States With Highest Insured Catastrophe Losses in 2008
$ Billions
$10.2
$2.2$1.6 $1.3 $1.0
$0.0
$2.0
$4.0
$6.0
$8.0
$10.0
$12.0
Texas California Minnesota Ohio Georgia
Source: PCS; Insurance Information Institute.
Big catastrophe losses turned up in some surprising states in 2008, due to high tornado, hail and wildfire damage as well as
inland hurricane damage
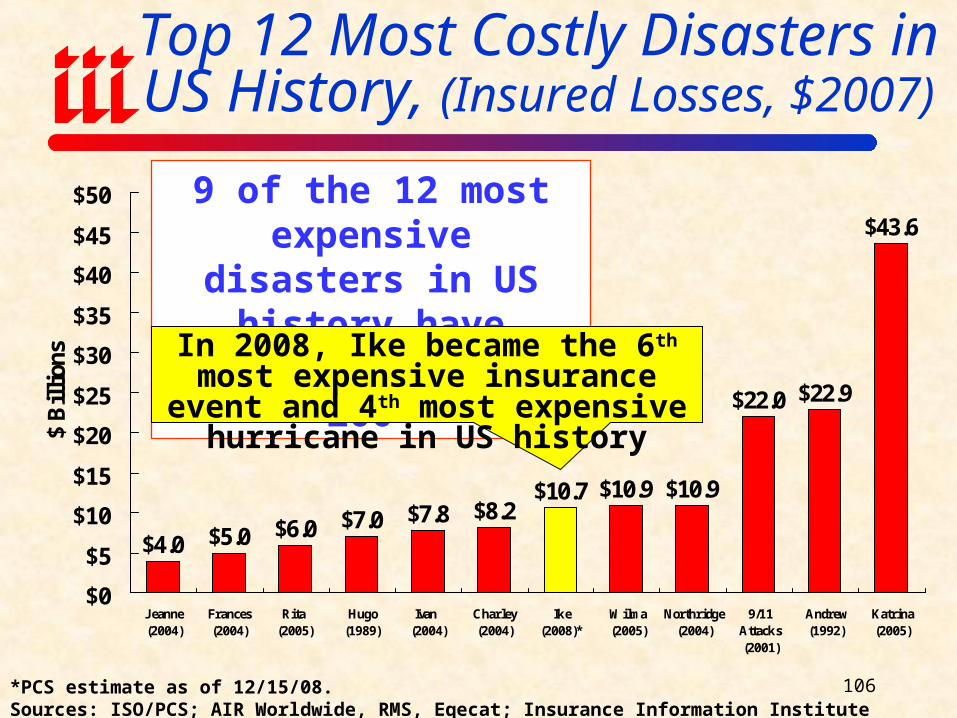
Top 12 Most Costly Disasters in US History, (Insured Losses, $2007)
$4.0 $5.0 $6.0 $7.0 $7.8 $8.2$10.7 $10.9 $10.9
$22.0 $22.9
$43.6
$0
$5
$10
$15
$20
$25
$30
$35
$40
$45
$50
Jeanne(2004)
Frances(2004)
Rita (2005)
Hugo(1989)
Ivan (2004)
Charley(2004)
Ike(2008)*
Wilma(2005)
Northridge(2004)
9/11Attacks(2001)
Andrew(1992)
Katrina(2005)
$ B
illi
ons
*PCS estimate as of 12/15/08.Sources: ISO/PCS; AIR Worldwide, RMS, Eqecat; Insurance Information Institute inflation adjustments.
9 of the 12 most expensive disasters in US history
have occurred since 2004
In 2008, Ike became the 6th most expensive insurance event and 4th most
expensive hurricane in US history
106
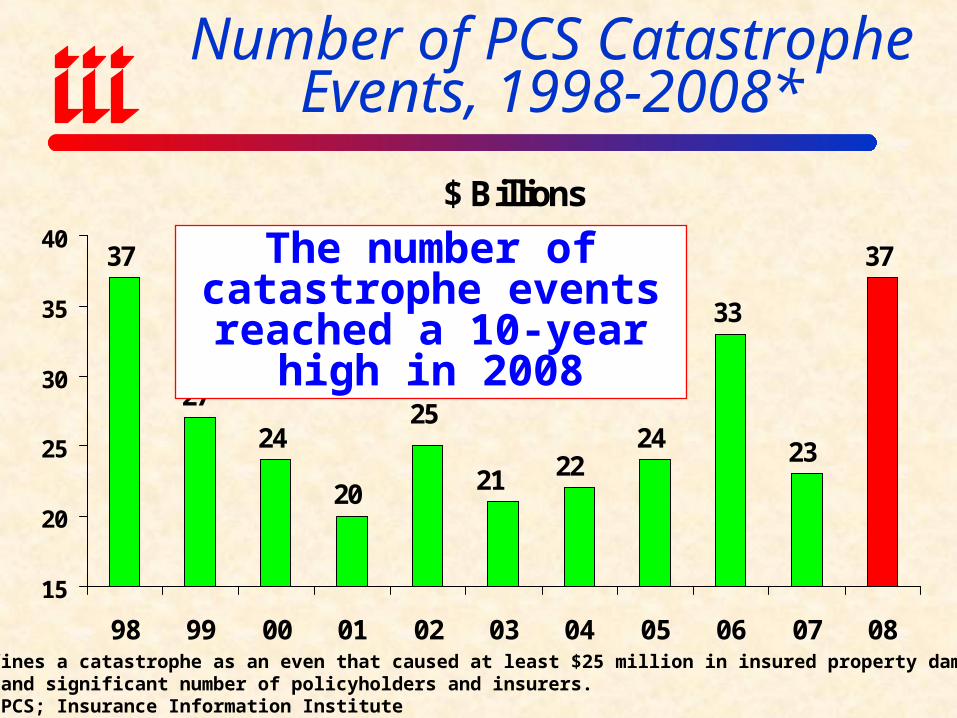
Number of PCS Catastrophe Events, 1998-2008*
$ Billions
37
27
24
20
24
33
23
37
2221
25
15
20
25
30
35
40
98 99 00 01 02 03 04 05 06 07 08*PCS defines a catastrophe as an even that caused at least $25 million in insured property damage andaffects and significant number of policyholders and insurers.Source: PCS; Insurance Information Institute
The number of catastrophe events
reached a 10-year high in 2008

2008 Insured Catastrophe Loss Distribution by Category
Commercial, $6,804 , 27%
Personal*, $16,128 , 64%
Vehicle**, $2,268 , 9%
2008 CAT FACTS
•The $25.2 billion in insured losses was the 4th highest ever, behind only, 2005, 2004 and 2001
•There were 37 designated catastrophes in 2008, the highest since 1998 (also 37)
•Commercial losses accounted for 27% of insured losses but just 9% of claims
*Includes homeowers, condominium and rental policies.**Includes commercial and private passenger vehiclesSource: PCS; Insurance Information Institute research.
$ Millions
108
Key Issues & Threats Facing P/C
Insurers Amid Financial Crisis
Manageable Challenges
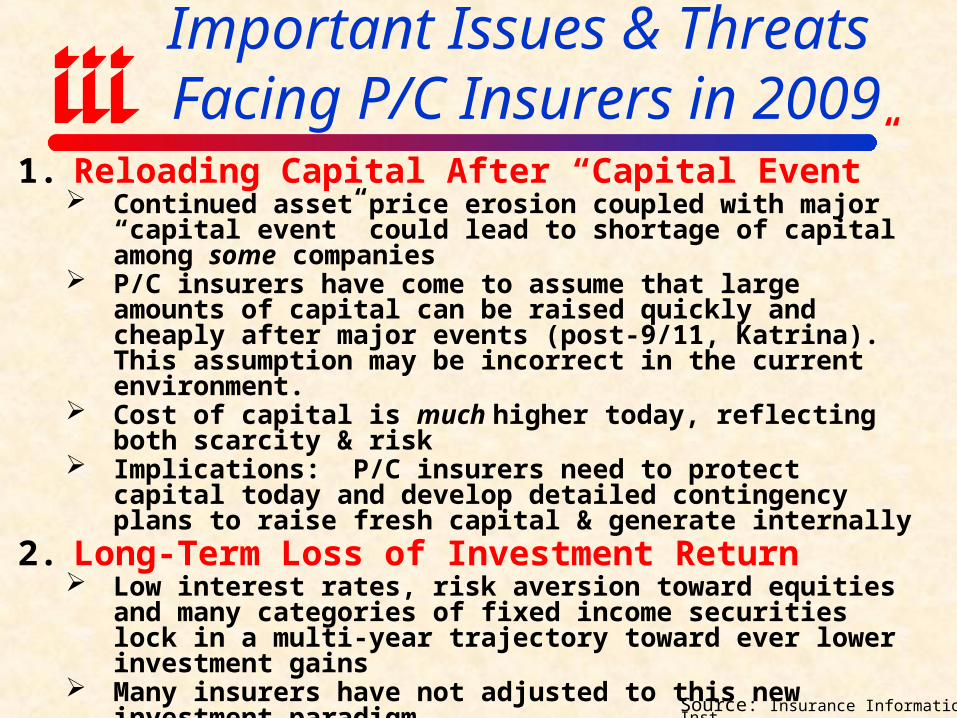
Important Issues & Threats Facing P/C Insurers in 2009
Source: Insurance Information Inst.
1. Reloading Capital After “Capital Event” Continued asset price erosion coupled with major “capital event”
could lead to shortage of capital among some companies P/C insurers have come to assume that large amounts of capital can be
raised quickly and cheaply after major events (post-9/11, Katrina). This assumption may be incorrect in the current environment.
Cost of capital is much higher today, reflecting both scarcity & risk Implications: P/C insurers need to protect capital today and develop
detailed contingency plans to raise fresh capital & generate internally2. Long-Term Loss of Investment Return
Low interest rates, risk aversion toward equities and many categories of fixed income securities lock in a multi-year trajectory toward ever lower investment gains
Many insurers have not adjusted to this new investment paradigm Regulators will not readily accept it; Many will reject it Implication 1: Industry must be prepared to operate in environment
with investment earnings accounting for a smaller fraction of profits Implication 2: Implies underwriting discipline of a magnitude not
witnessed in this industry in more than 30 years Lessons from the period 1920-1975

Source: Insurance Information Inst.
3. Regulatory Overreach P/C insurers get swept into vast federal regulatory overhaul and
subjected to inappropriate , duplicative and costly regulation
4. Tort Threat No tort reform (or protection of recent reforms) is forthcoming from
the current Congress or Administration Erosion of recent reforms is a certainty (already happening) Innumerable legislative initiatives will create opportunities to
undermine existing reforms and develop new theories and channels of liability
Historically extremely costly to p/c insurance industry
5. Disintermediation Alternative forms of risk transfer are taking an ever-larger share of
the (commercial) p/c insurance pie (e.g., 40%+ of workers comp) Soft market did not bring it back Trend toward state-sponsored insurance and reinsurance (e.g., FL)
drains premium out of private insurance markets
Important Issues & Threats Facing P/C Insurers in 2009 (cont’d)

AFTERSHOCK: Regulatory Response
Could Be Harsh
All Financial Segments Including InsurersWill Be Impacted
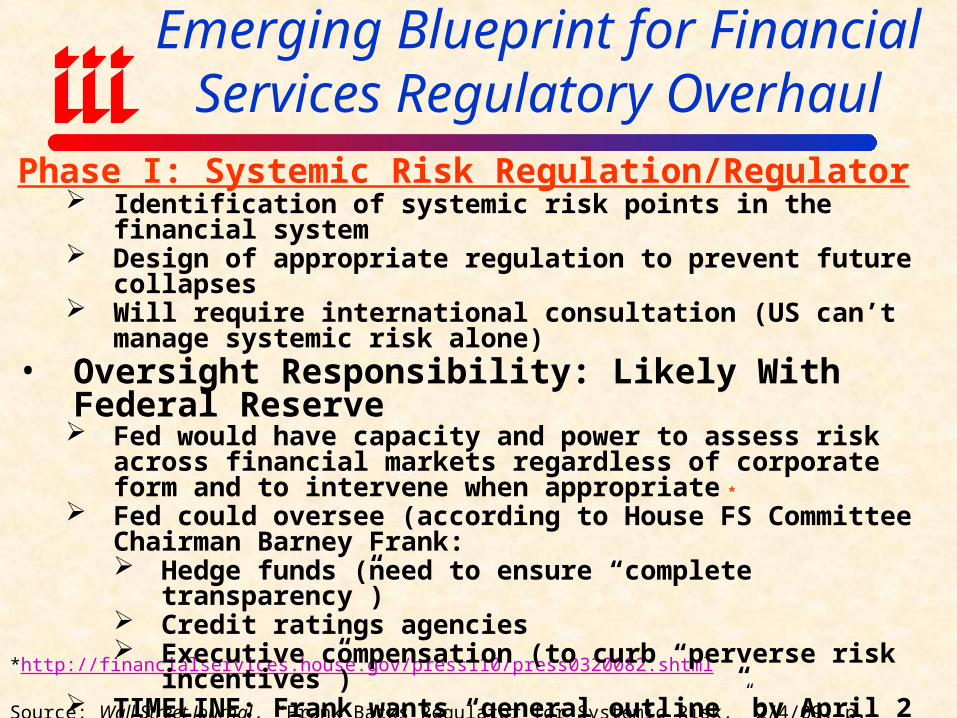
Emerging Blueprint for Financial Services Regulatory Overhaul
*http://financialservices.house.gov/press110/press0320082.shtml
Source: Wall Street Journal, “Frank Backs Regulator for Systemic Risk,” 2/4/09, p. C3; I.I.I. research.
Phase I: Systemic Risk Regulation/Regulator Identification of systemic risk points in the financial system Design of appropriate regulation to prevent future collapses Will require international consultation (US can’t manage systemic risk
alone) • Oversight Responsibility: Likely With Federal Reserve
Fed would have capacity and power to assess risk across financial markets regardless of corporate form and to intervene when appropriate *
Fed could oversee (according to House FS Committee Chairman Barney Frank: Hedge funds (need to ensure “complete transparency”) Credit ratings agencies Executive compensation (to curb “perverse risk incentives”)
TIMELINE: Frank wants “general outline” by April 2 meeting of G20 industrialized and developing nations

Emerging Blueprint for Financial Services Regulatory Overhaul (cont’d)
Phase I: Systemic Risk Regulation/Regulator: OTHER (cont’d)
• Unification of federal bank regulatory agencies• Creation of a Financial Products Safety Commission to vet products
before sold to investors• Creation of federal insurance program for muni bonds paid via premiums• Support for status quo on mark-to-market
Phase II: Sectoral Reform/Overhaul• Each segment of the financial services industry will be examined and
subject to regulation specific to its function, risks and other factors• TIMELINE: August 2009 or later
Source: Wall Street Journal, “Frank Backs Regulator for Systemic Risk,” 2/4/09, p. C3; I.I.I. research.
Possible Regulatory Scenarios for P/C Insurers as of Year-End 2009
Source: Insurance Information Inst.
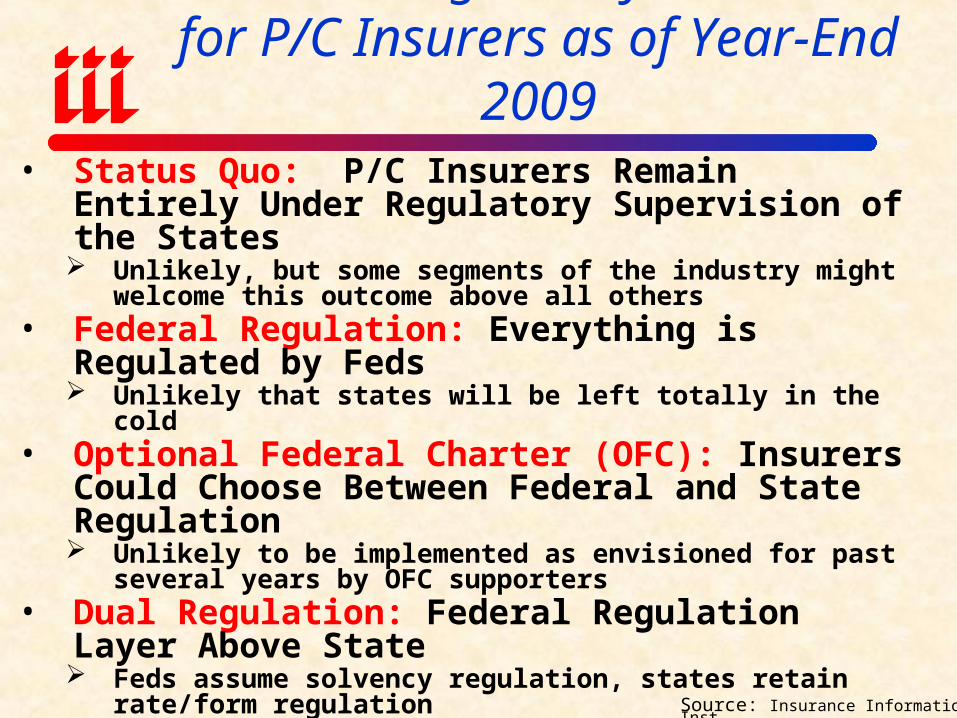
• Status Quo: P/C Insurers Remain Entirely Under Regulatory Supervision of the States Unlikely, but some segments of the industry might welcome this
outcome above all others• Federal Regulation: Everything is Regulated by Feds
Unlikely that states will be left totally in the cold• Optional Federal Charter (OFC): Insurers Could Choose
Between Federal and State Regulation Unlikely to be implemented as envisioned for past several years by
OFC supporters• Dual Regulation: Federal Regulation Layer Above State
Feds assume solvency regulation, states retain rate/form regulation• Hybrid Regulation: Feds Assume Regulation of Large
Insurers at the Holding Company Level• Systemic Risk Regulator: Feds Focus on Regulation of
Systemic Risk Points in Financial Services Sector What are these points for insurers? P/C vs. Life?

Insurance Information Institute On-Line
THANK YOU FOR YOUR TIME AND
YOUR ATTENTION!
121