Embed Size (px)
Citation preview

The Netherlands Energy Research Foundation ECNis the leadin~l institute in the Netherlands for energyresearch. ECN carries out pure and applied researchin the fields of nuclear energy, fossil fuels, renewableenergy sources, environmental aspects of energysupply, computer science and the development andapplication of new materials. Energy studies are alsoa part of the research programme.
ECN employs more than 900 staff. Contracts areobtained from the government and from national andforeign organizations and industries.
ECN’s research results are published in a number ofreport series, each series serving a different publicfrom contractors to the international scientific world.
The C-series is for contract reports that contain theresults of contract research. The contractor’s namecan be found on page 2.
Netherlands Energy Research Foundation ECNService Unit General ServicesP.O. Box 1NL- 1755 ZG PettenThe NetherlandsTelephone: +31 2246 43 23Fax : +31 2246 34 83
This report is available on remittance of Dfl. 20 to:IZCiN, SU General Services, Petten,The Netherlands.Giro account (postal account) No. 3977703.Please quote the report number.
© Netherlands Energy Research Foundation ECN
OCTOBER 1992 ECN-C--92-061
CREEP OF NKA A16SG.cip ALUMINA2: Evaluation
B.J. DESMETP,W. BACHH. BRAAM

This report contains the evaluation of creep experiments on NKA AI6SG.CIP
alumina.
The work is partly sponsored by the Commission for the Innovative Research
Program Technical Ceramics of the Ministry of Economic Affairs in the
Netherlands.
Contract numbers
Subcontract : TPD-89-1006-FEZ-KZ
to IOP-TK contract : 88-B040
CO~TENT~
ABSTRACT
1. INTRODUCTION
2. THEORY
2.1
2.2
2.3
Creep laws
2.1 1 In general
2.1.2 Fett and Munz equatlons
2.1.3 Time dependent power law creep
2.1.4 Temperature dependent Norton’s law
Stress-strain distribution
Parameter derivation
2.3.1 Fett and Munz parameters
2.3.2 Time dependent power law parameters
2.3.3 Parameters of the temperature dependent Norton’s law.
5
8
8
8
9
10
ii
ii
13
13
16
16
RESULTS
3.1 Experiments
3.2 Creep parameters
3.3 Parameter sensitivity
DISCUSSION
18
18
18
21
24
5. CONCLUSIONS AND RECOMMENDATIONS 27
6. ACKNOWLEDGEMENTS 28
7. REFERENCES 29
APPENDICES
A. Determining the Elongation of the Bending Bar
Due to Asymmetrical Creep Behaviour
49
49

B. Parameter Sensitivit~ of the Fett and Munz Equations
BI. Primary Creep Parameters
B2. Secondary Creep Parameters
C. Friction
D. Roller Movement
E. Contact Point Tangency Shift
5O
5O
56
60
61
62
ABSTRACT
Ceramic components loaded thermo-mechanically at high temperatures are
subject to creep deformation and creep damage. For the evaluation of the
high temperature behavioury of ceramic components it is important to know
the creep behaviour of ceramics. At ECN, research is directed to the
development of strong fine grained ceramics. The problem is, however, that
the strength is usually improved at the cost of a higher creep strain rate.
Creep experiments in a 4-point bending device were performed at I000, 1077
and 1150 °C on a rather fine grained alumina fabricated by cold isostatic
pressing. The tests were limited to the primary and secondary creep regimes
since lifetime evaluation is beyond the scope of the research.
The experiments and test results have been described in the previous report
[3]. This report gives the evaluation. Parameters are derived for a
Nadai/McVetty type primary creep law and a Norton type secondary creep law.
Computer calculations with the i000 °C parameter set show rather good
agreement with the experiments. The major problem is that the experiments
do not exhibit stationary creep within the testing time of 500 hours due to
stress redistribution. Further the determination of asymmetrical creep
behaviour by measuring the position of Vickers indentations on the
compressive face of the bending bar is a weak point in the applied graphi-
cal procedure for deriving the parameters.
The tests at 1150 °C demonstrate that the rollers of the bending fixtures
should be allowed to move freely in order to prevent frictional effects.
Even at large creep strains the effect of roller movements on the bending
moment is only small and partly compensated by contact point tangency
shift
It is concluded that for the present time, creep parameters from creep
tests in bending do not yield values that can be used for design purposes.
The application is restricted to characterization, quality control and
material research

1 INTRODUCTION
6
The objective of the IOP-TKI project "Advanced Ceramics Testing and
Design" is to develop and validate experimental and numerical methods for
the failure probability and lifetime prediction of ceramlc components.
For the evaluation of ceramic components subjected to thermal-mechanical
loading at high temperatures it is important to know the degradation
behaviour of the material at high temperatures. The most important failure
modes at high temperatures are:
- fracture
- subcritical crack growth
- creep
- cyclic fatigue
- corrosion
Often a combination of these failure modes is involved in the degradation
of ceramic components. Even without catastrophic failure pronounced creep
effects can occur at high temperatures, which can restrict the application
of a component since it can lead to deformations beyond the design limits.
Lifetime evaluation is beyond the scope of this report.
point bending jig. This alumina ~NKA AI6SG.CIP) is also used in the IOP-TK
project for the evaluation of failure probability prediction models [2].
The creep experiments and the test results were described in [3]. Creep
tests have been performed at three temperatures (I000. [077 and 1150 °C)
and three stress levels (25. 50 and i00 MPa). In [3] the follow~ng curves
were derived from the measured creep curves (A)
- creep strain versus time on log-log scale (B)
- creep strain rate versus time on linear scales (C)
- creep strain rate versus time on log-log scale (D)
- creep strain rate versus creep strain on log-log scale (E) .
In the present report the creep curves are evaluated. Parameters are
derived for the creep law mentioned above. The sensitivity of this creep
law to variations of the parameters is investigated. Further the influence
of any possible friction, roller movements and contact point tangency shift
on the test results is discussed
From a theoretical point of view the best way to investigate uniaxial creep
is to perform creep tests under a uniform and constant tensile stress From
the experimental point of view a tensile creep test is a complex test
involving large complex shaped specimens, which have to be carefully
machined and thus are very expensive This test also makes very high
demands on the alignment and the precision of the test rig.
Uniaxial creep tests can also be carried out in A-point bending with small
bending bars. Then the determination of the creep parameters is complex due
to the stress redistribution during creep. With a method recently developed
by Fettet al [i] the creep parameters of a Norton and Nadai/McVetty type
creep law can be determined from a set of creep tests at different stress
levels.
In the present investigation, the deformation of an alumina produced on a
lab scale under a constant load at high temperature is studied with a 4-
IOP-TK stands for Innovative Research Project Technical Ceramics

2. THEOR~
2.1 Creep laws
2.1.1 In ~eneral
A typical uniaxial creep curve is given in figure 2.1 showing the creep
strain as a function of time. Generally a creep curve of a uniformly loaded
specimen can be divided in three stages, the primary, secondary and
tertiary creep stage, In the primary creep stage the creep strain rate
decreases with time The secondary creep stage is characterized by a
constant creep straln rate and the tertiary creep stage by an increasing
creep strain ~ate, A similar behaviour can be observed considering the
creep deformation of a loaded component. If at t=0 the stress distribution
In a component is not equal to the stationary stress distribution.
transient creep behaviour (non-linear. non-constant creep strain rate) can
be observed due uo the occurrence of stress redistributions, while the
material itself is in the secondary creep stage (it exhibits the mlcrostuc-
tural features which are charateristic for this stage). If a component
shows stationary creep behaviour (constant creep strain rate) then it is
evident that the material is in the secondary creep stage
For design purposes creep deformation and creep lifetime are important,
depending on the application. The current research is restricted to creep
deformation therefore tertiary creep will not be considered.
The creep strain is generally described as the sum of a primary and a
stationary part:
(2.1.11
and
In literature uniaxial creep behaviour has been described by numerous
equations, which can be subdivided into two main catogories, time dependent
and strain dependent creep equations. Time dependent creep equations are of
the form
�= = f(t,a,T) (2.1.3)
9
The creep strain is gzven as s function of tzme t, stress ~ and temperature
T Frequently the creep suraln rate is given as a function of these parame-
ters
~e = g(t,g,T) (2.1.4)
but also as a strain dependent equation of the form
~c = h(~,a,T) (2.1.5)
The physical difference between the strain dependent and time dependent
equations is shown graphically in figure 2.2. A component is subjected to a
uniform stress ~I up to a time t’. and then the stress is abruptly
increased to oz. At the time t’ the component has achieved a creep strain
e. which will now increase accord{ng ~o the creep curve belonging to ~.
This can be realized in to ways. According to the time dependent equations
path A is followed and then it is said that the material exhibits time
hardening. According ~o the strain dependent equations path B is followed
and it is said that t~e material exhibits strain hardening. Strain harden-
ing ¯ s more likely ~o be representative for describing creep behaviour as
is explained in figure 2.3, After creep of a component under the small
stress o~ << ~2, xt is usually observed that path B is followed rather than
path A Nevertheless. time dependent equations are sometimes applied
because they are simpler.
In this report a strain dependent equation is studied in section 2.1.2 and
a time dependent equation in section 2.].3 In section 2.1.4, the tempera-
ture dependence of Norton’s law comes up for discussion. Norton’s law is
based on a cons~an~ stationary creep rate so that the difference between
time and strain hardening disappears.
2.1.2 Fett and Munz equations
The primary creep strain rate is described by a combined Nadai and McVetty
creep law
(2.1.6)
It is assumed tha~ this equation holds for tensile as well as compressive
stresses so that the primary creep stage is symmetrical under four point

i0
bending. This was confirmed in [i] by measurements on hot pressed silicon
nitride.
The secondary creep straln rate is described by Norton’s law. modified by s
factor a, in order to take asymmetrical creep behaviour into account
(2.1.7)
where
for ~ > 0
O<as<l fol o<0
and o
Equation 2.1.7 takes into consideration that the secondary creep rates are
significantly higher in the tensile part than in the compressive part of
the bending bar.
Equations 2.1.6 and 2.1.7 contain eight creep parameters three secondary
creep parameters (a,, C, and ns) and five primary creep parameters (CI, C2,
n~, n2 and p). The creep parameters cannot be determined directly from the
creep curves since the stresses in the bending bar are not constant with
time. They can be determined in an iterative way which, however, would be
rather expensive in terms of computer time [i]. Therefore the parameters
are determined in an approximatlve way outlined in [i]. see section 2.3.
2.1.3 Time dependent power law creep
For constant stress tests (tension or compression) the total creep strain
can also be described by a time dependent power law ~Andrade type of
equation)
(2,1.8)
so that the creep strain rate xs
(2.1.9)
i]
When time ~s extracted from this equation and substituted into equation
2.1.8. the original Nadai equation is obtained:
~ = C "~ .m. o" " . ~"N- = C". ,~’~ . ~’ (2.1. 10)
This excercise shows that a strain dependent equation can be derived from a
time dependent equation by extracting parameter t
The time dependent creep equation contains three parameters. Cm, np and m.
The time dependent power law creep equation is not suitable to fit the
creep curves g~ven in this report since these curves are obtained from four
point bending tests with non-constant stresses.
2.1.4 Temperature dependent Norton’s law
The temperature dependence of the stationary creep rate
sented in Norton’s law by the so-called Arrhenius term
is often repre-
(2.1.11)
where R is the gas constant. T the temperature and ~ the applied stress.
The equatlon contains three parameters A. ns and Q. A is a constant, n, the
stress exponent and Q the activation energy for creep xn kJ/mol.
2.2 Stress-strain distribution
According to Bernoulli’s hypothesis the total strain rate zn a bending bar
is linearly distributed accross the thickness. It can be written as the sum
~ and the creep strain rateof the elastic deformation rate ~
~(Y) = e(Y) - ~c(Y) = c~ - cz.y (2.2.1)E
where E is Young’s modulus and y the normalized distance from the middle of
the bending bar.
From this equation the stress-strain history of an arbitrarily time
independent loaded bending bar can be derived [i]

12
From this equation the stress-strain history of an arbitrarily time
independent loaded bending bar can be derived [I]
(2.2.2)
where
3. f i:¢ydy = C22
(2.2.3)
and
f ~=dy = ci2(2.2.4)
and c2 represent the elongation rate of the bending bar during creep as
result of the asymmetrical creep behaviour and the outer fibre bending
strain rate ~ respectively.
Figure 2.4 shows the total strain et according to Sernoulli’s hypothesis as
the sum of the pure elongatlon �E and the linearly distributed strain due
to pure bending in the absence of asymmetrical creep behaviour ~B.
The outer fibre bending strain s~ is related to the deflection 6 of the
specimen with respect to the inner rollers of the four point bending
fixture as
(2.2.5)
13
2.3 Parameter derivation
2.3.1 Fett and Munz parameters
For deriving the parameters, the following asymptotic conditions are
assumed [I]
For short-tlme primary creep:
a) The primary creep strain is still very small compared with the
Mb) The stresses are still equal to the initial values o(y) = ~.y
where M is the bending moment and W the section modulus (W = I/e, I
is moment of inertia and e = h/2 the distance from the neutral axis
to the outer fibre of the bending bar.
c) The secondary creep strain is still negligible ss << e~
For lon~-time primary creep:
d) The primary creep strain rate approaches zero
~ - 0 so that [equation 2.1.3) ~,~ = C2,~n~
e) The stress distribution approaches the stationary distribution
~(y) - ~.(y) = xH y-yo, n,¯ ~M w(2.3.1)
where
(2.3.2)
for y-y¢ m 0for Y-Yo < 0
(~~0)(~<0!
(2.3.3)

14
YO =(2.3.4)
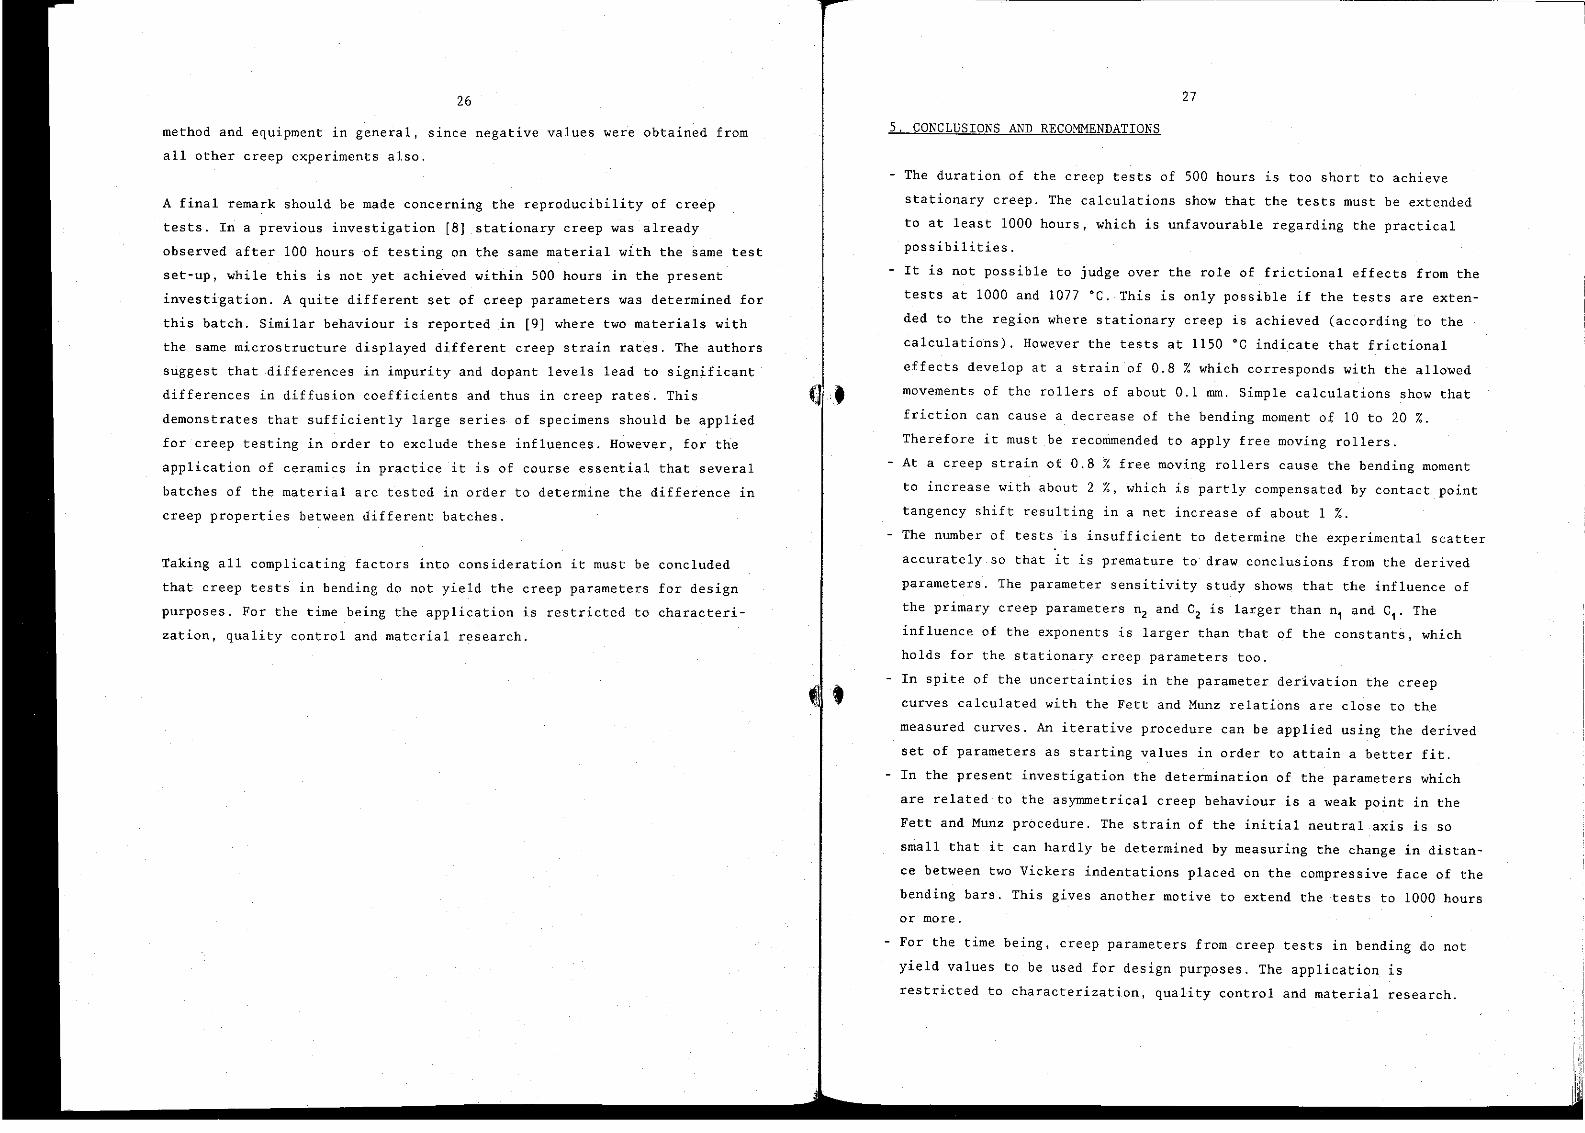
Y0 represents the shift of the neutral axis to the compressive part of the
bending bar. The initial (elastic) ~nd stationary stress distribution is
plotted in figure 2.5.
With condition a~ the primary creep rate (equation 2.1.6) becomes
~p = CiC2an’s~p (2.3,5)
where n" = nI - n2
Inserting equation 2.3.5 in[o equation 2.2.3.
conditions b~ and c) into account yields [i]
n’+2(l÷p)
integrating and taking
(2.3.6)
Inserting the stationary stress distribution
2.2.3 and integrating yields
B 3~ir~
m~p,max = ~ .C~.I-- .Hn~.~s. f(~s,ns,n~)
(equatxon 2.3.1) into equation
(2.3.7)
where
f (~s,ns, n2)1 ~ (l+y0)m+~. (m+l-yo)
(re+l) (m+2) ’[ ~ - [l-y~)m+~. (m+l÷yo))
and
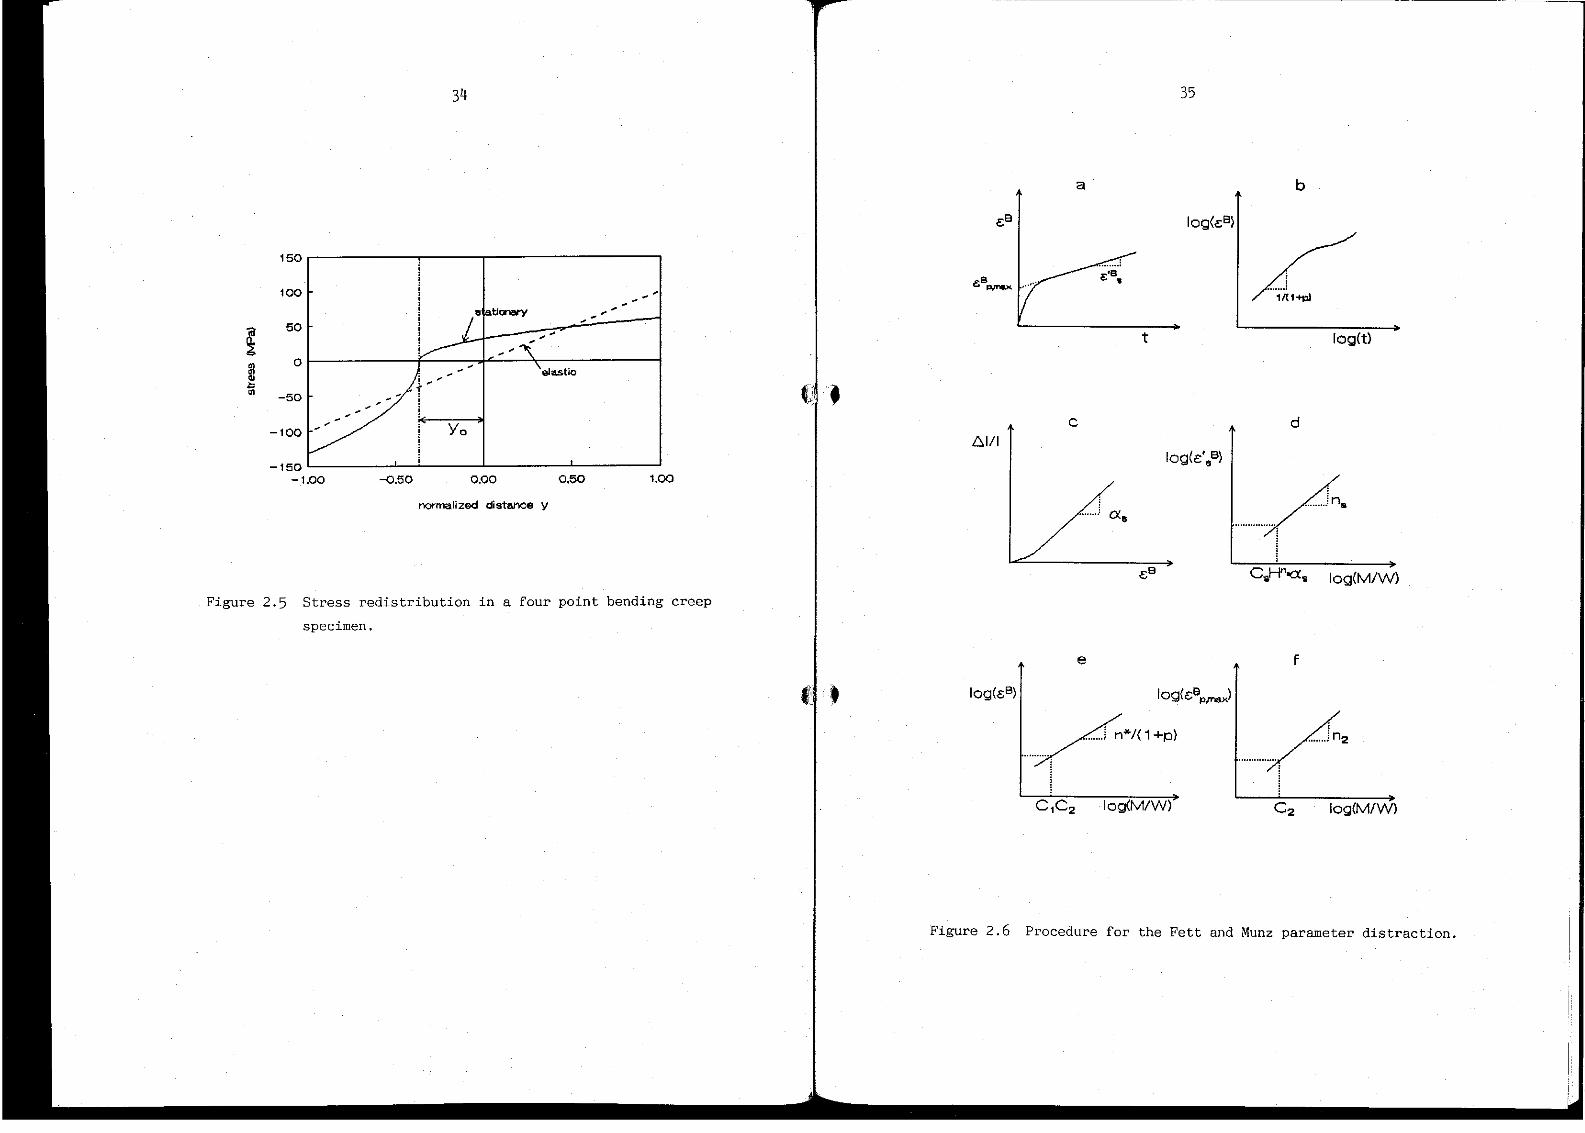
The creep parameters can now be derived from the diagrams shown in figure
2.6.
15
Creep parameters for secondary creep
In figure 2.6a the creep strain ~s is plotted as a function of time.
stationary creep rate is the slope of the tangent to the stationary
(linear) part of the creep curve
Inserting equation 2.1.7 into 2.2.3 gives
The
(2.3.8)
This equation shows that the slope of the line in figures 2.6d. in which
the stationary creep strain rare is plotted as a function of the initial
outer fibre bending stress on a log-log scale gives the stress exponent ns
and the intercept with the ordinate the factorCsHn’=s
Us is obtained from figure 2.6c in which the pure elongation Al/l of the
bending bar measured after the creep test is plotted as a function of the
creep strain in the outer fibre at the end of the test (i.e. 500 hours).
The elongation is caused by the asymmetrical creep behav{our and is
determined by measuring the curvature of the bending bar and the distance
between two Vickers indentations on the compressive face before and after
the creep rest. The measurements and calculations are visualized in
appendix A. Solving equation 2.2.4 using the stationary stress distribution
[equation 2.3.1) and combining the solution with equation 2.3.8 yields [I]
(2.3.9)
For long times it is assumed that ~ ’B - ~ so that ~ is given by [i]
(2.3.10)

16
C, can be determined from the values of n, C~H ~s together with that of us and
Creep parameters for primary creep
The exponent p can be determined from the slope of the line in figure 2.6b
at low strains. Under the assumption that the stress redistribution is
still negligible the parameters are representative for primary creep. In
this figure the creep curve is given on ~ log-log scale.
The exponent n~ (see equation 2.3.5~ is determined from the slope of the
line in figure 2.6e in which the creep strain at t = 0.] hour is plotted
against the initial outer fibre bending stress on a log-log scale. The
factor CI.C2 is evaluated from the intersection with the ordinate.
The exponent n2 (see condition d of section 2.3) is equal to the slope of
the line in figure 2.6f in which the maximum prlmary creep strain is
plotted against the initial outer fibre bending stress on a log-log scale¯
The maximum primary creep strains are determined from the original creep
curves (figure 2.6a). It is represented by the intercept of the straight
line through the stationary part of the creep curve with the ordinate
Together with n~, the value of nl can be determined from n" = nI + n~.
The coefficient Cz can also be evaluated from figure 2.6f by determining
the intercept with the ordinate.
2.3.2 Time dependent power law parameters
For a constant stress tensile or compression test (equation 2.1.8). m is
the slope of the creep curve on log-log scales and B ( = C~a% the
intercept of this curve with the ordinate n~ and G~ are determined from
the diagram in which B is plotted versus the applied stress ~. n~ is the
slope of this curve and C~ the intercept with the ordinate.
2¯3.3 Parameters of the temperature dependent Norton’s law.
For the Norton law (equation 2.1¯11) the stress exponent n~ is the average
slope of the curves in the diagram in which the stationary creep strain
rate is plotted versus the initial outer fibre stress on in-In scales for
17
different temperatures The activation energy Q is the negative value of
the slope of the curve in the diagram in which the natural log of the
stationary creep strain rate divided by the stationary outer fibre s~ress
to the power n,, is plotted versus [/(RT).

3. RESULTS
18
3.1 Experiments
Creep tests have been performed in four point bending at three temperatures
(1000, 1077 and 1150 °C) and three outer fibre stress levels (25, 50 and
100 MPa). The test results are reported in [3], from which figures 3.1. 3.2
and 3.3 are taken for the tests at 1000, 1077 and 1150 °C respectively. The
diagrams show that stationary creep is not achieved within 100 hours and in
a majority of the tests not even within 500 hours.
Nevertheless the tests at I000 °C and 1077 °C are used co determine sets of
creep parameters for the Fett and Munz creep equations and the temperature
dependent Norton’s law. The tests at 1150 °C are obviously not suitable for
this purpose because the curves at 25 and 50 MPa show an abrupt deviation
at an outer fibre creep strain of about 0.8%. This feature will be
explained in section 4. Further the creep curves are still very far from
stationary at 500 hours. The test at 100 MPa at this temperature resulted
in premature fracture, probably due to the occurrence of subcritical crack
growth.
For the set of parameters at 1077 °C the parameter as was taken from the
i000 °C set and a previous creep investigation with this material [8]
because measuring the shift of the neutral axis did non yield meaningful
values (negative values) at 1077 °C. This problem occurred for all the
tests at 1077 °C land all other zests except for the I00 MPa test at 1000
°C) and will be discussed in more detail in chapter a.
The constant, the stress exponent and the activation energy of the Arrhe-
nius term of the temperature dependent Norton’s law are determined for the
i000 and 1077 °C tests.
3.2 Creep parameters
Fett and Munz
The Eett and Munz creep parameters of the NKA AI6SG.CIP alumina were
determined from the tests at 1000 °C and 1077 °C according to the procedure
outlined in section 2.3. The results are listed in the tables 3.1 and 3~2
(below). As it is mentioned
value from other tests.
19
in section 3.1. a, was taken as an estimated
Table 3.1 Fett and Munz parameters for T = i000 °C.
Primary Secondary
0.77 n 1.44
n2 0.61 1.6.10-~
4.0.10-8 0.57
C24.4.i0"s
P 1.37
Table 3.2 Fett and Munz parameters for T = 1077 °C.
Primary Secondary
nI 0.88 n 0.90
n2 i .25 C$ 1.7.i0-7
3.7.10-70.6*
1.3.i0-5
P .07
estimated value
For the I000 °C set ns was determined from only the creep curves at 50 and
i00 MPa as the 25 MPa test resulted in a stationary creep strain near the
experimental resolution and was therefore rejected. In contrast n2 was
determined using the values of the maximum primary creep strain from all
tests.
With the i000 °C set of parameters the creep curves were calculated and
compared with the measured creep curves (figure 3.4). The calculations were
performed with a Fortran computer programme developed at ECN. The figure
shows that good approximation is obtained in the (near) stationary creep
region, but that there zs a deviation in the primary creep region. The
absolute value of this deviation ~s in the order of the experimental
scatter, so better agreement could not be expected. An adjustment of the
calculated curves can be made by an iteration on the parameters, but that

20
is not performed here as the scatter in the measurements is not fully
known.
With the parameter see also the stress distribution in the I00 MPa creep
test was calculated as a function of time. The results are plotted in
figure 3.5 The straight line represents the initial (elastic) stress
distribution. Further the stress distribution was calculated with the
computer programme at 3.4 hours and [502 hours and with equation 2.3.1 for
the analytically determined stationary stress distribution. At 1502 hours
the stresses correspond with the stationary stress distribution.
In figure 3.6 the stresses in the outer fibres according to the computer
calculations are divided by the stationary stresses and plotted as a
function of time. The conclusion is that it could not be expected that the
stationary stress state is reached in 500 hours. At 500 hours the stresses
in the tensile and compressive face of the specimen are still about 8% and
4% higher than the stationary stresses respectively. Notice that, according
to the calculations, the stresses first increase whereafter they decrease
to the stationary values
Temperature dependent Norton’s law
The parameters ol the temperature dependent Norton’s law were determined
according to the procedure described in section 2.3.3. The stress exponent
n, is determined from figure 3.7 and the activation energy Q from figure
3.8 which is called ’the’ Arrhsnius plot. From tests at I000 °C and 1077 °C
(25 50 and i00 MPa). stress exponents of 1.44 and 0.90 were determined
respectively. A negative stress exponent was derived for the tests at 1150
°C (25 and 50 MPa) and has therefore to be rejected. The constant A is
equal to 2.3"1027. An activation energy of 884 kJ/mol is calculated in
conslstence with activation energies of 400 to i000 kJ/mol reported in the
literature for creep of high density aluminas [5]. Apparently the Arrhenius
term is not sufficient for taking the temperature dependence into account
in the Norton’s law, as the measurements reveal that also the stress
exponent depends on the temperature. However, regarding the small number of
tests and the experimental scatter, more tests should be performed to
confirm this statement.
3.3 Parameter sensitivity
21
With the Fett and Munz equation, the sensitivity of the calculated creep
curves to variations in the parameters was investigated in order to obtain
information about the desired accuracy for determining the parameters. At
this point it must be emphasized that it cannot be expected that the
accuracy of the parameters given in section 3.2 is high Tests were
performed at only three load levels so that most of the parameters were
determined from plots in which straight lines were constructed through only
three points. Further it was already noticed that full stationary creep was
not always obtained.
In order to study the parameter sensitivity, variations were applied on the
creep parameters. Each parameter was varied keeping the other parameters
constant. Sets of creep curves were calculated and plotted in figures
together with the measured creep curves and the creep curve calculated with
the unchanged set of parameters. This was done for the tests at 1000 °C and
100 MPa. A normalisation was performed in order to quantify the influences.
The calculated creep ~tra~ns at 500 hours were divided by the creep strain
at 500 hours determined with the original set of parameters and plotted as
a function of the percentage variation applied on the parameter. Further
the calculated t~me to reach the creep strain at 500 hours was divided by
this time determined with the original set of parameters and also plotted
as a function of the percentage variation applied on-the parameter.
The results are given in appendix B1 and B2 for the primary and stationary
parameters respectively.
In table 3.4 the variation in the creep strain at 500 hours calculated with
the Fett and Munz relations, is given for variations of the parameters of
plus and minus 20% (see also appendix B).

22
Table 3.4 Parameter sensitivity of the
Fett and Munz equations.
Parameter Variation Variation Estimatedin Accuracy
� (Z) (z)
+20 +2.5 _+ 8o-20 -3.5
n2+2O +43 -+5-20 -18
CI+20 +0.6 ¯ + 80-20 -1.2
C2 +2O +13 ± 15-20 -13
P +2O +5 + 20-20 -15
n +20 +70 ± 15-20 -20
C +20 +5.8 ± 60-20 -5.8
+20 +2.3 ¯ + 15-20 -2.3
Table 3.4 shows that the sensitivity of the calculated creep curves to the
parameters n2 and C2 is much higher than to n. and C~. As it is expected,
the influence of the stress exponents n. and n2 is higher than the corres-
ponding factors CI and C2. This holds for the influence of the stressexponent ns for stationary creep which is much larger than the influence of
the constants Cs and ~,. The determination of ~s is not accurate because the
elongation of the bending bar could only be measured for the i00 MPa test
at i000 °C. The elongations of the 25 and 50 MPa tests were set to zero
because small negative values were calculated from the measurements. The
inaccuracy in ~, influences C$. Besides the stationary creep parameter n,
also the primary creep parameters n~, n~, C. and CZ are not determined very
precisely because the values of the maximum primary creep strain could not
be derived accurately as a result of the absence of a full stationary creep
region. A rough estimate of the accuracy of the derived parameters is given
in the last column of table 3.4 The estimation takes into account experi-
mental scatter, which is determined from the i00 MPa tests (I00 and 500
hours) at 1077 °C [3] and scatter in evaluating the stationary creep strain
23
~ate and the maximum primary creep strain (see figure 2.6). The estimationshows that the inaccuracy of nl. CI and Cs is largest. Fortunately the
sensitivity of the calculations to these parameters is not very large, in
contradiction to the sensitivity to n,. It is concluded that it is of
utmost importance to determine n, accurately. This requires more tests at
various stress levels and creep curves with a sufficiently large stationary
creep region.
In spite of the poor accuracy of the parameter derivation the calculations
fit the experiments fairly well in the stationary region, which emphasizes
(table 3.4) that variations in the parameters ~s and C, do not have a large
Impact on the calculated creep curves. The deviation in the primary region
is much larger, but small compared to the experimental scatter.
In order to reveal the scatter and to quantify the value of the derived
parameter sets. the 500 hours creep curves are normalized according
to for the primary creep region and for the stationary
creep region. The normalization for the primary creep region is only valid
for short times as it assumes that ~<<C~g~ (see equation 2.1.6). For the
1000 °C tests the normalized creep strain rates are given in figures 3.9
and 3.10 for the primary and secondary creep region respectively, and in
figures 3.11 and 3.12 for the 1077 °C tests. Figure 3.9 shows that there is
a large fluctuation in the creep strain rate at short times and that the
deviation from i is considerable, which indicates that the parameter set is
not very succesful in predicting the creep curves. Figure 3.10 shows that
this zs much better for the secondary creep region except for the results
of the 25 MPa tests which display very large fluctuations. With the primary
parameters for 1077 °C a much better prediction is obtained for the 25 and
50 MPa tests as is shown in figure 3.11. The 100 MPa test gives a large
deviation. The statlonary region is predicted very well as is shown in
figure 3.12. This figure demonstrates again that full stationary creep is
not achieved within 500 hours because the deviation of the normalized creep
strain rate from I increases with time. It should be noticed here that it
cannot be expected that the values are equal to 1 exactly as asymmetrical
creep is not accounted for (~, is not used in the normalization).

4. DISCUSSION
24
Two major problems have been noticed concerning the determination of the
creep parameters for the Fett and Munz creep relations.
i. Full stationary creep was not yet achieved in all tests within 500
hours.
2. Negative values were obtained for the elongation of the bending bars
most of the tests.
ad I. According to the calculations of the stress redistribution in the
bending bar during creep, it is not surprising that full statlonary creep
is not achieved within 500 hours. Therefore it should be recommended to
extend the testing time to I000 hours or more. However, according to
literature [4], achieving full stationary creep can still be problematic
even after 1000 hours of testing. From [4] it Is cited for creep tests in
bending: "True steady-state creep rates are often not achieved in hundreds
or even thousands of hours", and in addition: "Virtually no consideration
has been given to experimental errors in such testing and. specifically, to
frictional constraints of fixed load points and contact point shifts in
specimens that have crept more than a few tenths of a percent strain". The
1150 °C creep curves of the present investigation show an abrupt deviation
at an outer fibre creep strain of about 0.8 %. which can probably be
attributed to a frictional bending moment developing at this creep strain.
In the applied four point bending fixtures the rollers are ~ble to move
freely over a distance of about 0.i mm. which will be shown to correspond
with the strain of 0.8%. Beyond this strain level the rollers cannot move
any further and must be considered as fixed supports. In the 1000 and 1077
°C tests this creep strain is never reached so that it may be assumed that
frictional effects do not play an important role in these tests. Frictional
forces can originate from sliding of the bending bar on the rollers and are
determined by the unknown friction coefficient ~. Due to the deflection of
the bending bar, the tensile face of the bar elongates, while the
compressive face shortens. Further there is an overall elongation of the
bending bar due to the asymmetrical behaviour of creep in bending. For
fixed supports the reduction of the bending moment due to the frictional
effect is approximated in appendix C as s function of the friction coeffi-
25
cient It is shown that the reduction of the bending moment can be 20% if a
friction coefficient of 0.4 is assumed [6,7]. This is of course intolerable
for creep experiments as is demonstrated by the 1150 °C tests.
As it is already mentioned, the rollers of the bending fixture actually do
have the possibility to move over a distance of about 0.i mm. The unpropi-
tious effect of applying free moving rollers is that the bending moment
increases with increasing creep strain as the outer rollers move outward
and the inner rollers inward. In appendix D it is calculated that the
bending moment can incresse by about 2% if the creep strain is 0.8%. In
this case the outer rollers and inner rollers move 0.12 mm outward and 0.08
mm inward respectively. The increase of the bending moment is partly
compensated by contact point tangency shift, which leads to a decreasing
bending moment with increasing creep strain. Due to the deflection of the
bending bar the contact points of the bending bar on the outer rollers move
inward and on the inner rollers outward. In appendix E, the reduction of
the bending moment due to this effect is approximated. For the test at 1077
°C and i00 MPa. the reduction is about i% at a creep strain of 0.8 %. Hence
the net increase of the bending moment is only 1% which leads to the
conclusion that free movlng rollers should be applied in four point bending
creep testing.
ad 2. The elongation of the bending hats due to the asymmetrical creep
behaviour was determined from the position of Vickers indentations placed
on the compressive face of the bending bar and the curvature of the bending
bar lappendix A). Negative values were obtained except for the i000 °C/100
MPa test, which cannot be realistic according to the theory. This is
probably caused by the small extent of the elongation of the bending bars.
The asymmetrical creep behaviour is limited so that the shift of the
neutral axis is only small. For the test at I00 MPa and 1000 °C a change in
the distance between the Vickers indentations of 20 ~m was measured so that
an elongation on the initial neutral axis of only 1 ~m ,a strain of
6.3"10.5 and s shift of the neutral axis of 0.26 mm was calculated. With
the computer programme the strain was calculated as a function of the
testing time ~see figure 3.9). At 500 hours a strain of 5.5"10.5 was
calculated which is in good agreement with the measurement. Probably the
strain ~s too small to be measured accurately with the applied measuring
26
method and equipment in general, since negative values were obtained from
all other creep experiments also.
A final remark should be made concernlng the reproducibility of creep
tests In a previous investigation [8] stationary creep was already
observed after i00 hours of testing on the same material with the same test
set-up, while this is not yet achieved within 500 hours in the present
investigation. A quite different set of creep parameters was determined for
this batch. Similar behaviour is reported in [9] where two materials with
the same microstrucrure displayed different creep strain rates. The authors
suggest that differences in ~mpurity and dopant levels lead to significant
differences in diffusion coefficients and thus in creep rates This
demonstrates that sufficiently large series of specimens should be applied
for creep testing in order to exclude these influences. However. for the
application of ceramics in practice it is of course essential that several
batches of the material are tested in order to determine the difference ~n
creep properties between different batches.
Taking all complicating factors into consideration it must be concluded
that creep tests in bending do not yield the creep parameters for design
purposes For the time being the application is restricted to characteri-
zation, quality control and material research.
27
5. CONCLUSIONS AND RECOMMENDATIONS
- The duration of the creep tests of 500 hours is too short to achieve
stationary creep. The calculations show that the tests must be extended
to at least [000 hours, which is unfavourable regarding the practical
possibilities.
- It is not possible to judge over the role of frictional effects from the
tests at I000 and 1077 °C¯ This is only possible if the tests are exten-
ded to the region where stationary creep is achieved (according to the
calculations). However the tests at 1150 °C indicate that frictional
effects develop a~ a strain of 0.8 % which corresponds with the allowed
movements of the rollers of about 0.1 mm. Simple calculations show that
friction can cause a decrease o5 the bending moment of i0 to 20 %.
Therefore it must be recommended to apply free moving rollers.
- At a creep strain of 0.8 % free moving rollers cause the bending moment
to increase with about 2 %, which is partly compensated by contact point
tangency shift resulting in a net increase of about 1%.
- The number of tests is insufficient to determine the experimental scatter
accurately so that it is premature to draw conclusions from the derived
parameters. The parameter sensitivity study shows that the influence of
the prlmary creep parameters n2 and C2 is larger than nI and CI. The
influence of the exponents is larger than that of the constants, which
holds for the stationary creep parameters too.
- In spite of the uncertainties ~n the parameter derivation the creep
curves calculated with the Fett and Munz relations are close to the
messured curves. An iterative procedure can be applied using the derived
set of parameters as starting values in order to attain a better fit.
- In the present investigation the determination of the parameters which
are related to the asymmetrical creep behaviour is a weak point in the
Fett and Munz ~rocedure. The strain of the initial neutral axis is so
small that it can hardly be determined by measuring the change in distan-
ce between two Vickers indentations placed on the compressive face of the
bending bars. This gives another motive to extend the tests to I000 hours
or more¯
For the time being, creep parameters from creep tests in bending do not
yield va]ues to be used for design purposes. The ~pplication is
restricted to characterization, quality control and material research.

6. ACKNOWLEDGEMENTS
28
The authors like to thank Mr. N.P.G. van der Burg for performing the creep
experiments and the Commission of the Innovative Research Program Technical
Ceramics of the Ministry of Ecomomic Affalrs in the Netherlands for partly
sponsorlng this work (IOP-TK research grant 88,B040).
7. REFERENCES
29
i. Fett, T.. Keller K. and Munz .D.. An Analysis of the Creep of Hot
Pressed Silicon Nitride in Bending. J. Mater. Sci. 23, 1988, 467-474.
2. De Smet B.J.. Bach P,W., Scholten H.F., Dortmans L.J.G.M. and de With
G., Weakest-Link Failure Predictions for Ceramics III: Uniaxial and
Biaxial Bending Tests on Alumina. to be published in J.Eur. Cer. S.
Bach, P.W and de Smet, B.Jo. Creep of NKA AI6SG.CIP Alumina I Experim-
ents. ECN-C--92-012.
4. Quinn G.D. and Morell R . Design Data for Englneering Ceramics: A Review
of the Flexure Test. J Am. Ceram. Soc. 74 (9), 1991. 2037-66.
5. Cannon W.R. and Langdon T.G.. Review Creep of Ceramics. J Materials
Science 18, 1983, 1-50.
6. Stanley P., Fessler H. and Sivi11A.D., The Unit Strength Concept in the
Interpretation of Beam Test Results for Brittle Materials, Proceedings
of the Intstution for Mechanical Engineers. 190 (49/76). 1976. 585-95.
7. Baratra F.I.. Requirements for Flexure Testing of Brittle Materials,
Army Materials and Mechanics Research Center. AMMRC TR 82-20~ 1982.
8. Bach P.W. and Correia L.A.. The Effect of the Microsuructure on the
Creep Properties of Dense Alumina, In proc 11t" Ris6 Int. Symp. on
Metallurgy and Material Science. ed. Bentzen et alm 1990, 181-187
9. Robertson A.G.. Wilkinson D.S. and Caceres H C., Creep an Dreep Fracture
in Hot-Pressed Alumina, J. Am. Ceram. Soc 74 [5]. 1991 915-21.

FIGURES
~C
Fig-are 2.1
30
2 3
t
Creep strain curve from constant stress experlment.
2.2a
2.2b
~c
02
Figure 2.2
31
O2
/(B)
/
/ 01
t
Time dependent (A) and strain dependent creep (B)0 ex-
plained by an abrupt stress increase during a creep
experiment.

32
t!
8B
Figure 2.4 Tot’al strain �t as the sum of pure elongation cE and pure
bending eB.
Figure 2.3 Strain hardening (B) is more cepresentative to describe
creep behaviour ~han time hardening (A).
5O
-50
-100
-150
Figure 2.5
34
- I.O0 -0.50 0.00 0.,50 1.00
Stress redistribution in a ~our point bending creep
specimen.
AI/I
Figure 2.6
35
b
log(t)
C d
Iog(~’~B)
log(M/W)
e F
/nw/( 1 +p)
C1C2 ~og(M/w)~C2 Iog(M/V~)
Procedure for the Fett and Munz parameter distraction.

<gZ
z8C
36
.>
I
.... O O O O O O O D OO O O O O O O O O O O O OO O O O O D O O O O O ~ O
d o d d o o o o d o o o
Figure 3.1 Creep curves of the tests at i000 °C,
000
oo
<{
Q)
37
I I I
Figure Creep curves of the tests at 1077 "C.
oo

<{Z
<~
Z
Z0
38
~ -- -- 0 0 0 0 0 0 0 0 0 0~D 0 0 0 0 0 0 0 0 0 0 0 0 0
o ci o ci o o 6 o o o o o o
Figure 3.3 Creep curves of the tests at 1150 °C.
(D
(D
0.14
0.12
0.10
0.08
o.o~0.04
0.02
0.00
Figure
59
NKA A16SG.GIP ALUMINAT " 1000 °C
exp. 50 MPI~
exp. 100 MPa
calc. 50 MPa.
oalc.lO0 MPa
0 100 200 300 400 500
time [hi
Calculated and measured creep curves for the i000 °C
tests at lOO and 50 MPa.

4O
NKA A16SG.CIP ALUMINAT - 1000 °C,o- 100 MP==
120
80
40
-40
-80
-120-1.00
%%
-0.50 0.00 0.50 1.00
elastic
- o-- stationary
..... t=9.4h
t = 1502 h
y [-]
Figure 3.5 Stress distribution in the cross section of the bending
bar according co the analytical solution and the computer
programme,
1.40
1.30
1.20
1.10
1.00
0.90
Figure 3.6
41
NKA A16SG.CIP ALUMINAt= 1000°c,o-100MPa
tsnsion
compression
0 250 500 750 100012501500
time [hi
Normalized outer fibre stress as a function of time
calculated with the computer programme.

-10
-12
-14
-16
-18
Figure 3.7
42
4
-i- IO00eC
,~ 1077eC
0 1150
5
In(a)
Stationary stress exponent n, for the different test
temperatures.
-14
-16
-20
-22 ’0.72
Figure 3.8
0.74 0.75 0.71 0.70
lIT [l/K]
0.80(E-3)
ARRHENIUS plot, determination of the activation energy Q.

1000 °C
0.00 0.20 0.40 0.60 0.00 1.00
time [hours]~ 28 MPa --/% -- 80 MPm ---~--- 100 MPo
Figure 3.9 Normalized primary creep strain rate for the 1000
tests at 25, 50 and i00 MPa.
°C
1000 °C
4
3
2
0
-1
-2
///
-5 i
800 850 400 450 500
time [hours]
Figure 3.10 Normalized stationary creep strain raEe for
1000 °C tests at 25, 50 and 100 MPa.
the

46
1077 °C
15
i10
00.20 0.40 0.80 0.80 1.00
time [hours]~ 2~ MP& - -,~-- 80 MP, ---~-- 100 MPa,
Figure 3.11 Normalized primary creep strain rate for the
°C ~es~s at 25, 50 and 100 HPa.
i077
2.00
1.50
1,00
0.50
47
Figure 3.12
1077 °C
0.00 ’ ’ ’300 350 400 450 500
time [hours]~ 28 MPI - - A- - 60 MPI, --~)--’ 100 MP~
Normalized stationary creep strain rate for
1077 °C tests at 25, 50 and i00 MPa.
the

~8
0.20
0.16
0.12
0.08
0.04
0.00
NKA A16SG,CIP ALUMINAT - 1000 °C, o - 100 MP~,
0 250 500 750 1000 1250 1500
time [h]
Figure 3.13 Calculated elongation of the bending bar (eE) due to
asymmetrical creep.
APPENDICES
49
APPENDIX A
Determinin~ the Elon~ation of the Bendin~ Bar Due to Asymmetrical Cr~,
Two Vickers indentations are placed on the compressive face of the bending
bar (figure AI) and their distance (L0) is measured accurately. After the
creep test the distance LI is measured, together with the curvature R of
the bending bar {figure A2).
Figure A1
Figure A2
For small angles e the strain on the original neutral axis is
~m = i2-LoLo
where
L~ = ~. (R+~)
with
g = 2.arcsin(L~)2R

APPENDIX B
5O
Parameter S~nsitiviDy Qf the Fett and Munz Eouations.
In this appendix each creep parameter is varied keeping the other parame-
ters constant. The varied parameter is divided by its original value from
table 3.i and assigned with an as~erix.
B1 Primary Creed Parameters
0.20
0.18
0.15
0.13
0.10
0.08
0.05
0.03
0.00
1.50
1.40
1.30
1.20
1.10
1.00
0.90
0.800.1
51
T= 1000°C, o= 100 MPaInfluence of G,
250 500 750 1000
time [hi
T= 1000°0, o= 100 MPaInfluence of C1
1 10
01" [-]
exp.
C,*=10
C1"-3,1 5
C,*-1.0
C~*-0.31
0,*=0.1
---e-- oreep strain
--a-- time

52
T- lO00°O, o- IOOMPaInfluence of C,
0.20
0.18
0.15
0.13
0.10
0.08
0.05
0.03
0.000 250 500 750 1000
time
T= 1000°C, o= 100 MPaInfluence of C=
1.40 ×
~1.20
¯ ~ 1.00
0.80
0.60 "0.80 0.90 1.00 1.10
C2" [’]
-- exp.
..... C= -0.9
C=*’1.0
C=*-1.1
C=o.1.2
1.20
"1"= 1000°C, o= 100 MPaInfluence of n,
0.20
0.18
0.15
0.13
0.10
0.080.05
0.03
0.00250 500 750 1000
time [hi
T= 1000°C,o= 100 MPaInfluence of n~
1,40
1.30
1.20
1.10
1.00
0.90
0.800.50 0.75 1.00 1.25 1.50
n~ [-]
exp.
n1"-0.5
n,’=0.8
n1"=1.0
n1,=1.2
.............

T= 1000°C, o= 100 MPaInfluence of n=
0.20
0.18
0.15
0.13
0.10 .,~/oo8.
0.05
0.03
0.000 250 500 750 1000
exp.
n=*-0.8
.....
n=*-1.0
n=*-1.1
n=*-1.2
time [h]
T = 1000 °C, o = 100 MPaInfluence of n=
2.00
1.50
1.00
0.50
0.000.80 0.90 1.00 1.10 1.20
creep strain
time
0.20
0.18
0.15
0.13
0.10
0.08
0.05
0.03
0.00
1.50
1.40
1.30
1.20
1.10
1.00
0.90
0.80
55
T= 1000°C, o-100 MPaInfluence of p
0 250 500 750 1000
time [hi
T= 1000°C, o= 100 MPaInfluonco of p
0.80 0.90 1.00 1.10 1.20
p* [-]
-- exp.
p*-0.8
p*-0.g
p"-l.0
p"-1.1
p"-1.2
creep strain
time

B2 Secondary Creed Parameters
56
57
0.20
0.18
0.15
0.13
0.10
0.08
0.05
0.03
0.00
T= 1000°C, o- 100 MPaInfluence of Co
~ ,,.
/
0 250 500 750 1000
time [h]
T= 1000°0, o= 100 MPaInfluence of C,
1.30
1.20
1.10
1.00
0.90
0.800.80 0.90 1.00 1.10 1.20
C," [-I
exp.
0,*=0.8
0,*-0.9
C,*’1.0
C,*=1,1
Co*=1.2

0.20
0.18
58
T= 1000°C, o = 100 MPaInfluence of no
0.15
0.13
0.10
0.08
0.05
1.75
1.00
O 0,75
0.03
0.000
0.500.80
250 500 750 1000
exp.
11,*=0.9
n,*-0.95
no*-1.0
n,*-1.05
n,*-1.1
time [hi
T= 1000°0, o= 100 MPaInfluence of n=
0.90 1.00 1.10 1.20
0.20
0.18
0.15
0.13
0.10
0.08
0.05
0.03
0,000
1.10
1.05
1.00
0.95
0.90
0.85
0.800.80
59
T- 1000 °C, o- 100 MPaInfluence of o,
250 500 750 1000
time [hi
T = 1 000 °C =, o 100 MPBInfluence of o=
1.00 1.20 1.40 1.60 1.80
ao [-]
exp.
.....
................. a,*=,0.9
............ a,*,= 1.1
............ 0,*-1.2
0,*=1.76

APPENDIX C
60
APPENDIX D
61
Fig~re CI shows that a counteracting moment develops if frictional forces
are introduced at the supports. The frictional forces depend on the
friction coefficient p and the contact force F/2 according to
If roller movements are not allowed (fixed
fully develop. The maximum error in the ben-
ding moment due to the maximum frictional
effect is defined as
Figure C1
¯ 100% = - i 100% = . 100%(sl-s2) -2~h " (s~-s2)
where M is the actual bending moment. M~ the initial bending moment. ~ the
friction coefficient, sI the outer support distance, s2 the inner support
distance and h the height of the bending bar.
This equation does not account for the geometrical change which occurs
during bending. In the literature friction coefficients of about 0.4 are
reported for fixed silicon nitride supports [6,7]. With h = 4.5 mm. sI =
mm and s2 = 20 mm, then the maximum error becomes 22 ~.
The error due to friction will be negligible if free moving rollers are
applied. In this case, however, an error is introduced due to the changing
support distances (see appendix D).
Roller Movement
Due to the deflection of the bending bar the outer and inner support
rollers of the bending fixture are inclined to move outward and inward
respectively. If these movements are allowed the bending moment is increa-
sed, leading to an error according to
¯100% = - 1 ¯ 100% = -
where M is the actual bending moment, M~ the initial bending moment, s~ the
outer support distance, s2 the inner support distance and ~ the outer fibre
creep strain.
With supports sl and sz of 40 and 20 mm respectively and a outer fibre
creep strain of 0.8 ~ (corresponding with the creep strain in the 1150 °C
tests where the deviation in the creep curve occurs), the error is -2 % and
i i (s~+s~) g = 0.12 nnnthe roller movements of the outer and inner rollers ~ . ~ .
1and ~ . s2. z = 0.08 mm respectively.

62
APPENDIXE_
Contact Point Tan~encv Shift
In the fig-dre below it is shown chat the bending moment decreases as a
result of the increasing deflection of the bending bar.
Figure E1
The error xs calculated according to
(~1 (sl-s2) _i).i00% = ( 2(xl+x2) ) 100%.i00% = (sl-s2;-2(x~+x~) (s~-s2) -2(x1+x2)
M is the actual bending moment. Mr the initial bending moment, sI the outer
support distance and s2 the inner support distance. For simplicity it is
assumed that x~ is equal co x2. All symbols are defined in figure El. At
the outer fibre creep strain of 0.8 % it was measured that the curvature R
of the bending bar is 280 mm. With roller radius e = 1.5 mm and inner
support distance s2 = 20 mm it follows that x~ = xz
= 0.05 mm. This results
in an erroF of 1%,