Embed Size (px)
Citation preview
1Q21 CREDIT UPDATE
_____
BCC Grupo Cooperativo Cajamar
7 May 2021
_____
www.bcc.es/en/informacion-para-inversores/

TABLE OF CONTENTS
_____
1. Overview of Grupo Cajamar
2. Key Highlights
3. Asset Quality
4. COVID-19 response
5. Capital, Funding & Liquidity
6. Business & Results
7. Conclusions
8. Annex
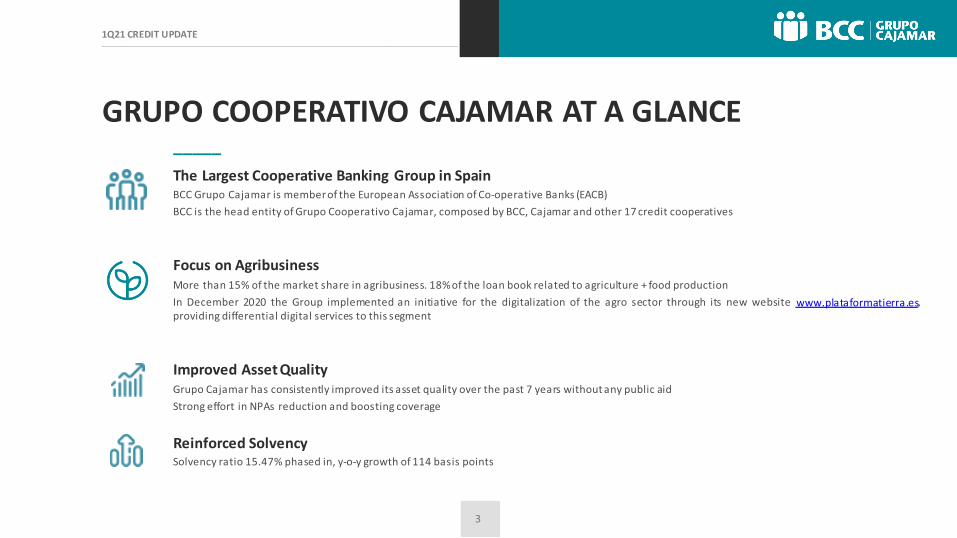
GRUPO COOPERATIVO CAJAMAR AT A GLANCE_____
The Largest Cooperative Banking Group in Spain
Focus on Agribusiness
www.plataformatierra.es
Improved Asset Quality
Reinforced Solvency
3,8
1,3
1,2
6,3
FARMERS MANUFACTURERS COMMERCE
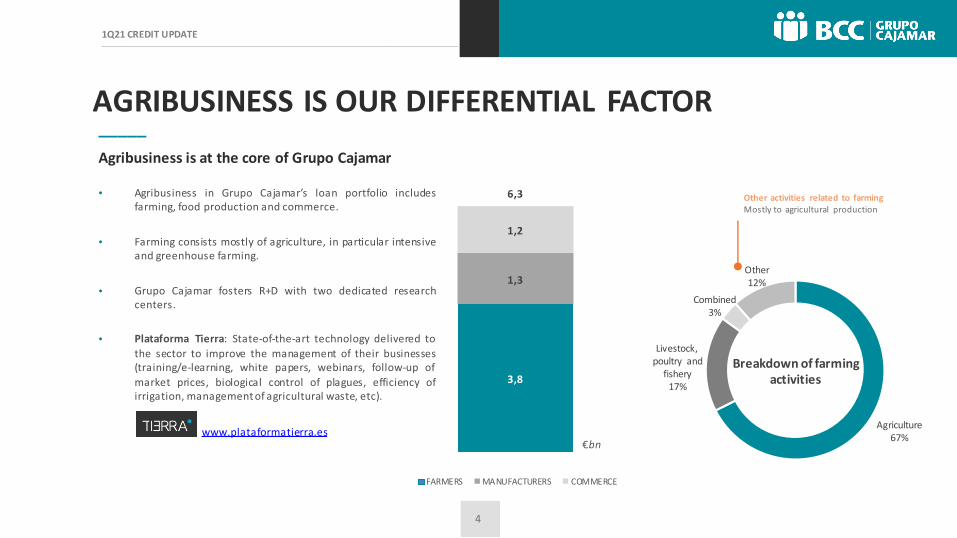
AGRIBUSINESS IS OUR DIFFERENTIAL FACTOR_____
Agribusiness is at the core of Grupo Cajamar
•
•
•
•
www.plataformatierra.esAgriculture
67%
Livestock, poultry and
fishery17%
Combined3%
Other12%
Breakdown of farmingactivities
€bn
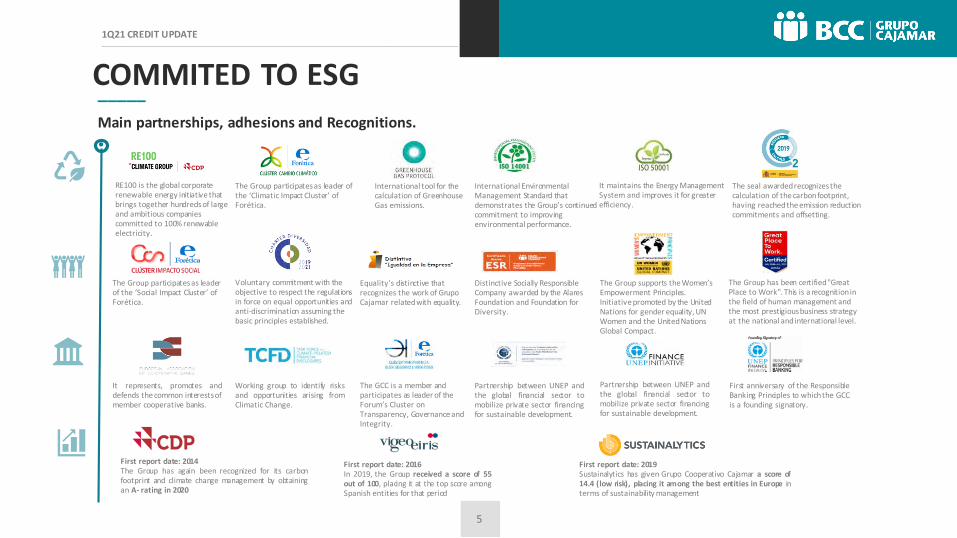
COMMITED TO ESG_____
Main partnerships, adhesions and Recognitions.
RE100 is the global corporate renewable energy initiative that brings together hundreds of large and ambitious companies committed to 100% renewable electricity.
The Group participates as leader of the ‘Climatic Impact Cluster’ of Forética.
International tool for the calculation of Greenhouse Gas emissions.
International Environmental Management Standard that demonstrates the Group’s continued commitment to improving environmental performance.
It maintains the Energy Management System and improves it for greater efficiency.
The seal awarded recognizes the calculation of the carbon footprint, having reached the emission reduction commitments and offsetting.
The Group participates as leader of the ‘Social Impact Cluster’ of Forética.
Voluntary commitment with the objective to respect the regulations in force on equal opportunities and anti-discrimination assuming the basic principles established.
Equality's distinctive that recognizes the work of Grupo Cajamar related with equality.
Distinctive Socially Responsible Company awarded by the Alares Foundation and Foundation for Diversity.
The Group supports the Women’s Empowerment Principles. Initiative promoted by the United Nations for gender equality, UN Women and the United Nations Global Compact.
Partnership between UNEP andthe global financial sector tomobilize private sector financingfor sustainable development.
First anniversary of the ResponsibleBanking Principles to whichthe GCCis a founding signatory.
It represents, promotes anddefends the common interestsofmember cooperative banks.
Working group to identify risksand opportunities arising fromClimatic Change.
The GCC is a member and participates as leader of the Forum’s Cluster on Transparency, Governance and Integrity.
Partnership between UNEP andthe global financial sector tomobilize private sector financingfor sustainable development.
The Group has been certified "Great Place to Work". This is a recognition in the field of human management and the most prestigious business strategy at the national and international level.
First report date: 2014The Group has again been recognized for its carbonfootprint and climate change management by obtainingan A- rating in 2020
First report date: 2016In 2019, the Group received a score of 55out of 100, placing it at the top score amongSpanish entities for that period
First report date: 2019Sustainalytics has given Grupo Cooperativo Cajamar a score of14.4 (low risk), placing it among the best entities in Europe interms of sustainability management
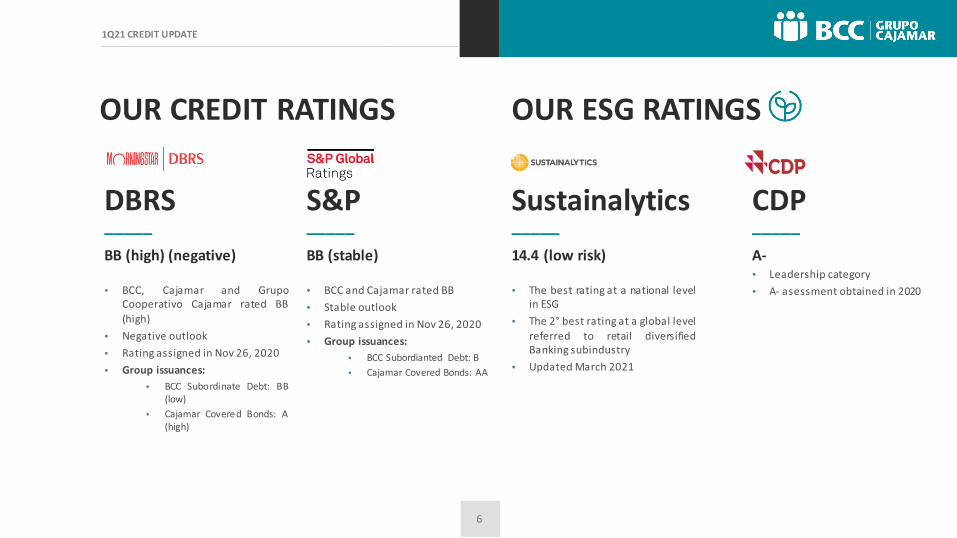
OUR CREDIT RATINGS
S&P_____
BB (stable)
•
•
•
•
•
•
DBRS_____
BB (high) (negative)
•
•
•
•
•
•
OUR ESG RATINGS
Sustainalytics_____
14.4 (low risk)
•
•
•
CDP_____
A-•
•
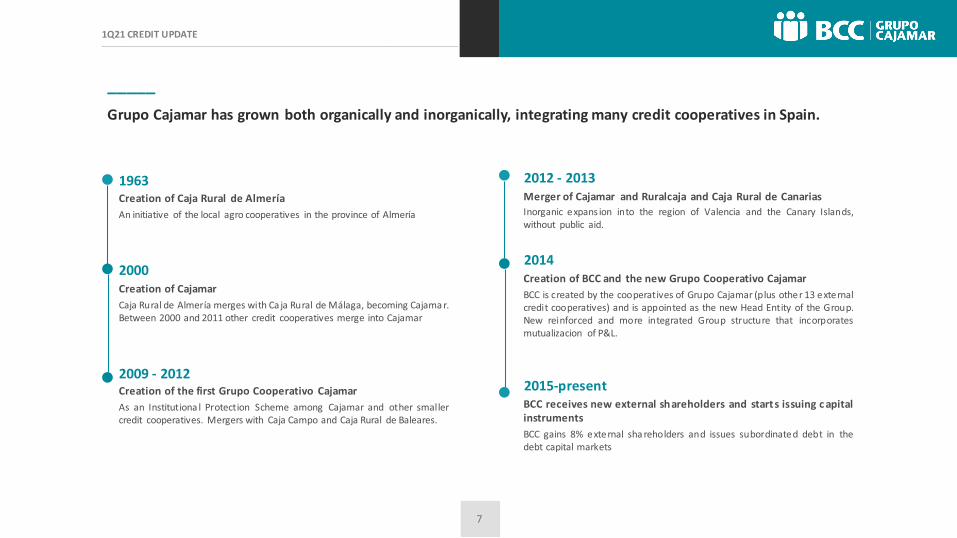
2012 - 2013
2014
2015-present
1963
2000
2009 - 2012
_____
Grupo Cajamar has grown both organically and inorganically, integrating many credit cooperatives in Spain.
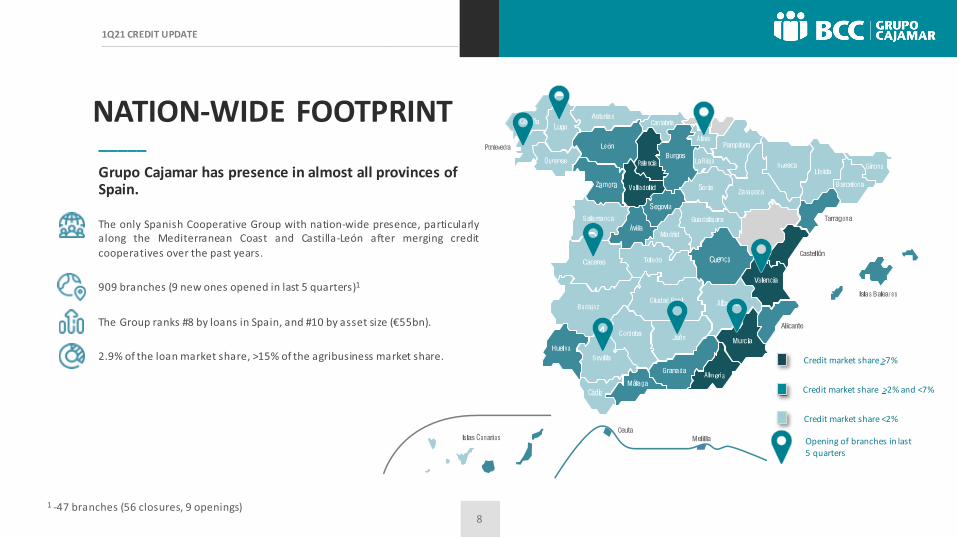
NATION-WIDE FOOTPRINT_____
Grupo Cajamar has presence in almost all provinces of Spain.
1 -47 branches (56 closures, 9 openings)
Credit market share >7%
Credit market share >2% and <7%
Credit market share <2%
Opening of branches in last 5 quarters
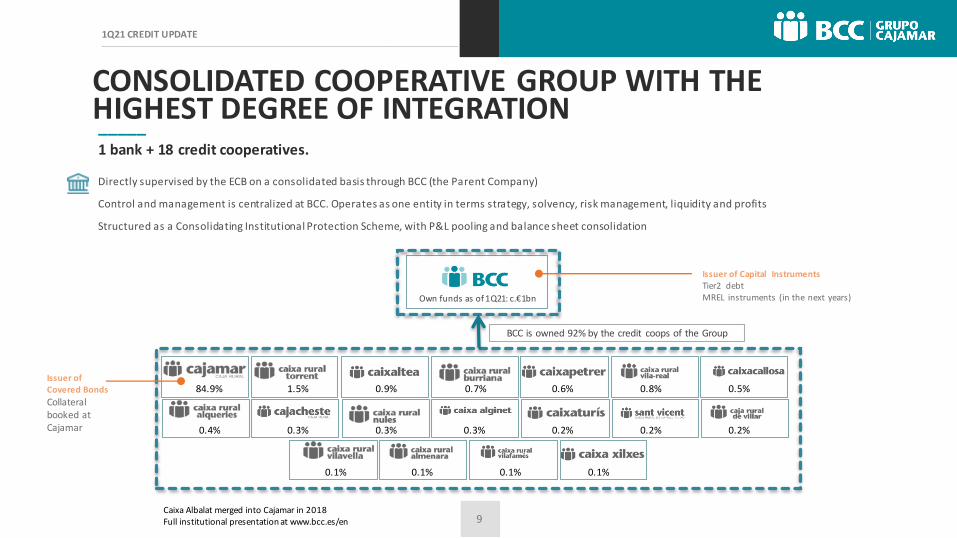
CONSOLIDATED COOPERATIVE GROUP WITH THE HIGHEST DEGREE OF INTEGRATION_____1 bank + 18 credit cooperatives.
84.9% 1.5% 0.9% 0.7% 0.6% 0.8% 0.5%
0.4% 0.3% 0.3% 0.3% 0.2% 0.2% 0.2%
0.1% 0.1% 0.1% 0.1%
Own funds as of 1Q21: c.€1bn
BCC is owned 92% by the credit coops of the Group
Caixa Albalat merged into Cajamar in 2018Full institutional presentation at www.bcc.es/en
TABLE OF CONTENTS
_____
1. Overview of Grupo Cajamar
2. Key Highlights
3. Asset Quality
4. COVID-19 response
5. Capital, Funding & Liquidity
6. Business & Results
7. Conclusions
8. Annex
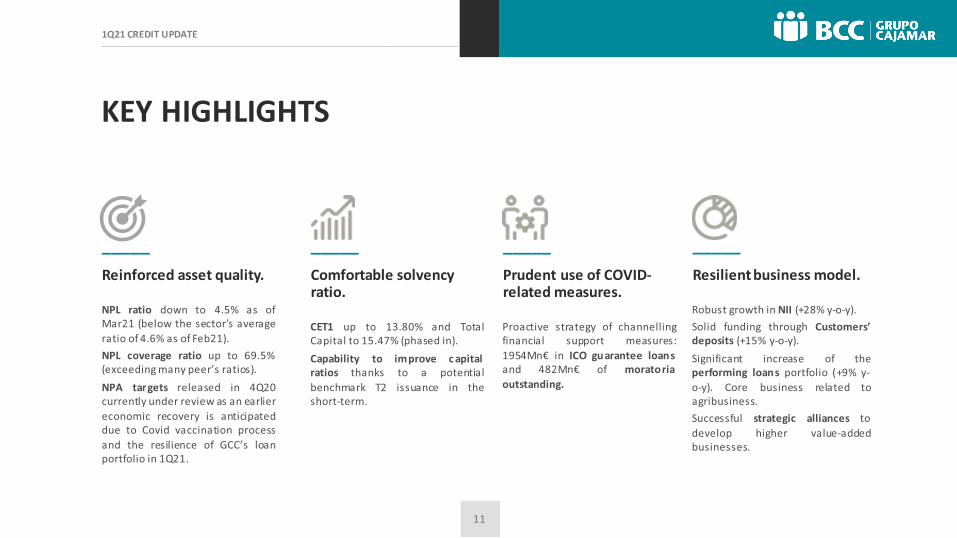
KEY HIGHLIGHTS
_____
Reinforced asset quality.
_____
Comfortable solvency ratio.
_____
Prudent use of COVID-related measures.
_____
Resilient business model.
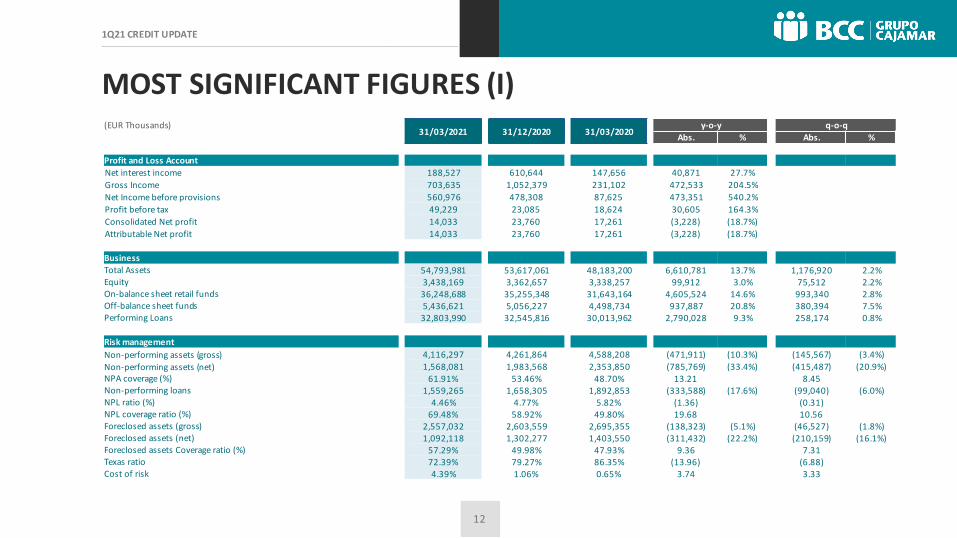
MOST SIGNIFICANT FIGURES (I)(EUR Thousands)
31/03/2021 31/12/2020 31/03/2020y-o-y q-o-q
Abs. % Abs. %
Profit and Loss Account
Net interest income 188,527 610,644 147,656 40,871 27.7%
Gross Income 703,635 1,052,379 231,102 472,533 204.5%
Net Income before provisions 560,976 478,308 87,625 473,351 540.2%
Profit before tax 49,229 23,085 18,624 30,605 164.3%
Consolidated Net profit 14,033 23,760 17,261 (3,228) (18.7%)
Attributable Net profit 14,033 23,760 17,261 (3,228) (18.7%)
Business
Total Assets 54,793,981 53,617,061 48,183,200 6,610,781 13.7% 1,176,920 2.2%Equity 3,438,169 3,362,657 3,338,257 99,912 3.0% 75,512 2.2%On-balance sheet retail funds 36,248,688 35,255,348 31,643,164 4,605,524 14.6% 993,340 2.8%Off-balance sheet funds 5,436,621 5,056,227 4,498,734 937,887 20.8% 380,394 7.5%Performing Loans 32,803,990 32,545,816 30,013,962 2,790,028 9.3% 258,174 0.8%
Risk management
Non-performing assets (gross) 4,116,297 4,261,864 4,588,208 (471,911) (10.3%) (145,567) (3.4%)
Non-performing assets (net) 1,568,081 1,983,568 2,353,850 (785,769) (33.4%) (415,487) (20.9%)NPA coverage (%) 61.91% 53.46% 48.70% 13.21 8.45Non-performing loans 1,559,265 1,658,305 1,892,853 (333,588) (17.6%) (99,040) (6.0%)NPL ratio (%) 4.46% 4.77% 5.82% (1.36) (0.31)NPL coverage ratio (%) 69.48% 58.92% 49.80% 19.68 10.56Foreclosed assets (gross) 2,557,032 2,603,559 2,695,355 (138,323) (5.1%) (46,527) (1.8%)Foreclosed assets (net) 1,092,118 1,302,277 1,403,550 (311,432) (22.2%) (210,159) (16.1%)Foreclosed assets Coverage ratio (%) 57.29% 49.98% 47.93% 9.36 7.31Texas ratio 72.39% 79.27% 86.35% (13.96) (6.88)Cost of risk 4.39% 1.06% 0.65% 3.74 3.33
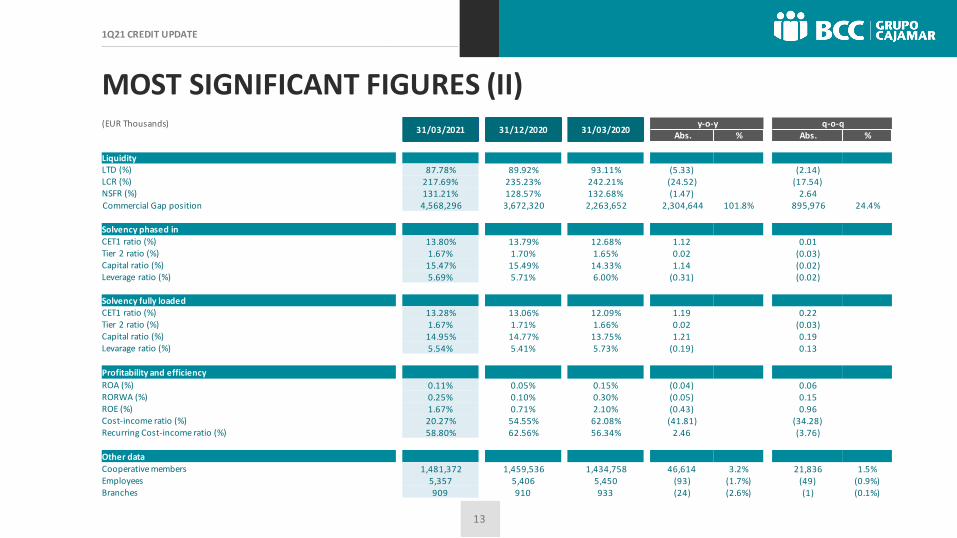
MOST SIGNIFICANT FIGURES (II)(EUR Thousands)
31/03/2021 31/12/2020 31/03/2020y-o-y q-o-q
Abs. % Abs. %
LiquidityLTD (%) 87.78% 89.92% 93.11% (5.33) (2.14)LCR (%) 217.69% 235.23% 242.21% (24.52) (17.54)NSFR (%) 131.21% 128.57% 132.68% (1.47) 2.64Commercial Gap position 4,568,296 3,672,320 2,263,652 2,304,644 101.8% 895,976 24.4%
Solvency phased in
CET1 ratio (%) 13.80% 13.79% 12.68% 1.12 0.01Tier 2 ratio (%) 1.67% 1.70% 1.65% 0.02 (0.03)Capital ratio (%) 15.47% 15.49% 14.33% 1.14 (0.02)Leverage ratio (%) 5.69% 5.71% 6.00% (0.31) (0.02)
Solvency fully loadedCET1 ratio (%) 13.28% 13.06% 12.09% 1.19 0.22Tier 2 ratio (%) 1.67% 1.71% 1.66% 0.02 (0.03)Capital ratio (%) 14.95% 14.77% 13.75% 1.21 0.19Levarage ratio (%) 5.54% 5.41% 5.73% (0.19) 0.13
Profitability and efficiency
ROA (%) 0.11% 0.05% 0.15% (0.04) 0.06RORWA (%) 0.25% 0.10% 0.30% (0.05) 0.15ROE (%) 1.67% 0.71% 2.10% (0.43) 0.96Cost-income ratio (%) 20.27% 54.55% 62.08% (41.81) (34.28)Recurring Cost-income ratio (%) 58.80% 62.56% 56.34% 2.46 (3.76)
Other data
Cooperative members 1,481,372 1,459,536 1,434,758 46,614 3.2% 21,836 1.5%Employees 5,357 5,406 5,450 (93) (1.7%) (49) (0.9%)Branches 909 910 933 (24) (2.6%) (1) (0.1%)

TABLE OF CONTENTS
_____
1. Overview of Grupo Cajamar
2. Key Highlights
3. Asset Quality
4. COVID-19 response
5. Capital, Funding & Liquidity
6. Business & Results
7. Conclusions
8. Annex
STEADY IMPROVEMENT OF ASSET QUALITY WITHOUT PUBLIC AID_____
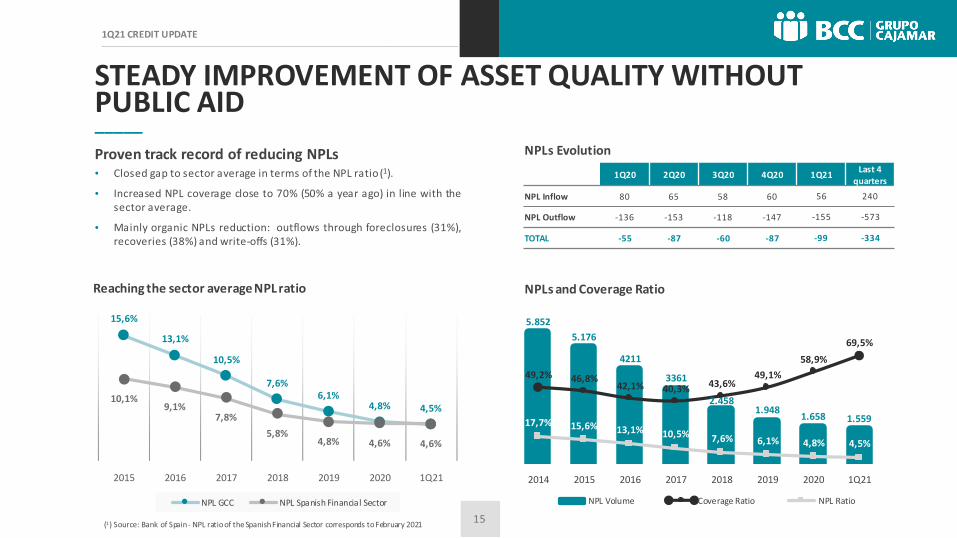
Proven track record of reducing NPLs•
•
•
NPLs Evolution
1Q20 2Q20 3Q20 4Q20 1Q21Last 4
quarters
NPL Inflow 80 65 58 60 56 240
NPL Outflow -136 -153 -118 -147 -155 -573
TOTAL -55 -87 -60 -87 -99 -334
15,6%
13,1%
10,5%
7,6%6,1%
4,8% 4,5%10,1%
9,1%7,8%
5,8%4,8% 4,6% 4,6%
2015 2016 2017 2018 2019 2020 1Q21
Reaching the sector average NPL ratio
NPL GCC NPL Spanish Financial Sector
5.852
5.176
4211
3361
2.4581.948
1.658 1.559
49,2% 46,8%42,1% 40,3% 43,6%
49,1%
58,9%
69,5%
17,7% 15,6% 13,1% 10,5% 7,6% 6,1% 4,8% 4,5%
0
1.000
2.000
3.000
4.000
5.000
6.000
7.000
0%
20%
40%
60%
80%
100%
2014 2015 2016 2017 2018 2019 2020 1Q21
NPLs and Coverage Ratio
NPL Volume Coverage Ratio NPL Ratio
Gross loans NPL NPL RatioCoverage
RatioCoverage+ Collateral
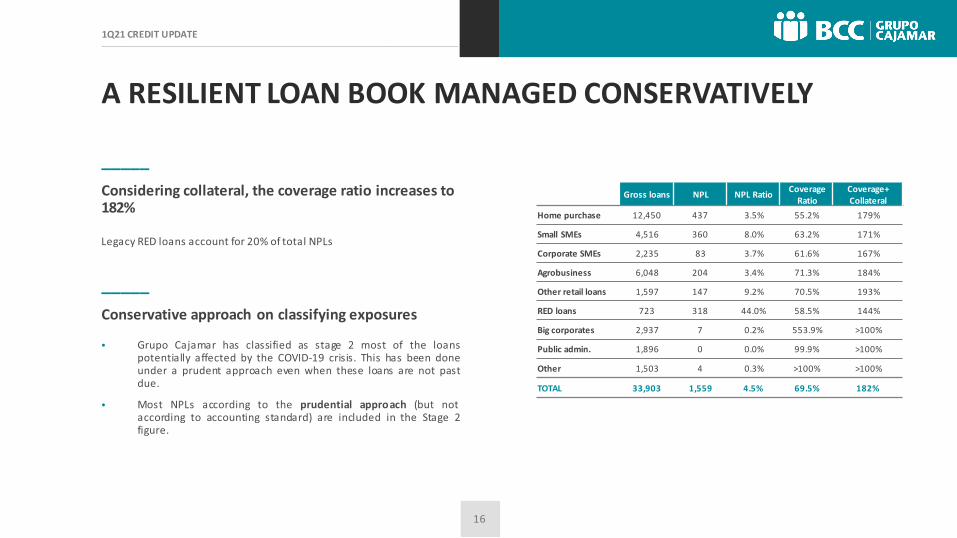
Home purchase 12,450 437 3.5% 55.2% 179%
Small SMEs 4,516 360 8.0% 63.2% 171%
Corporate SMEs 2,235 83 3.7% 61.6% 167%
Agrobusiness 6,048 204 3.4% 71.3% 184%
Other retail loans 1,597 147 9.2% 70.5% 193%
RED loans 723 318 44.0% 58.5% 144%
Big corporates 2,937 7 0.2% 553.9% >100%
Public admin. 1,896 0 0.0% 99.9% >100%
Other 1,503 4 0.3% >100% >100%
TOTAL 33,903 1,559 4.5% 69.5% 182%
A RESILIENT LOAN BOOK MANAGED CONSERVATIVELY
_____
Considering collateral, the coverage ratio increases to 182%
_____
Conservative approach on classifying exposures
•
•
_____
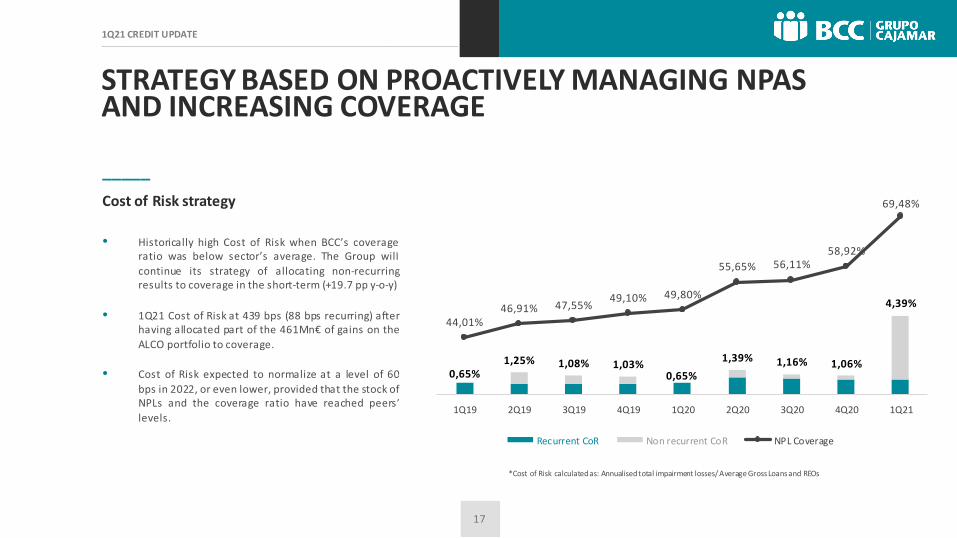
Cost of Risk strategy
•
•
•
STRATEGY BASED ON PROACTIVELY MANAGING NPAS AND INCREASING COVERAGE
0,65% 0,65%
1,25% 1,08% 1,03%1,39% 1,16% 1,06%
4,39%
44,01%46,91% 47,55%
49,10% 49,80%
55,65% 56,11%58,92%
69,48%
32,00%
37,00%
42,00%
47,00%
52,00%
57,00%
62,00%
67,00%
0,00%
1,00%
2,00%
3,00%
4,00%
5,00%
6,00%
7,00%
8,00%
9,00%
10,00%
1Q19 2Q19 3Q19 4Q19 1Q20 2Q20 3Q20 4Q20 1Q21
Recurrent CoR Non recurrent CoR NPL Coverage
IMPULSING SALES OF FORECLOSED ASSETS_____
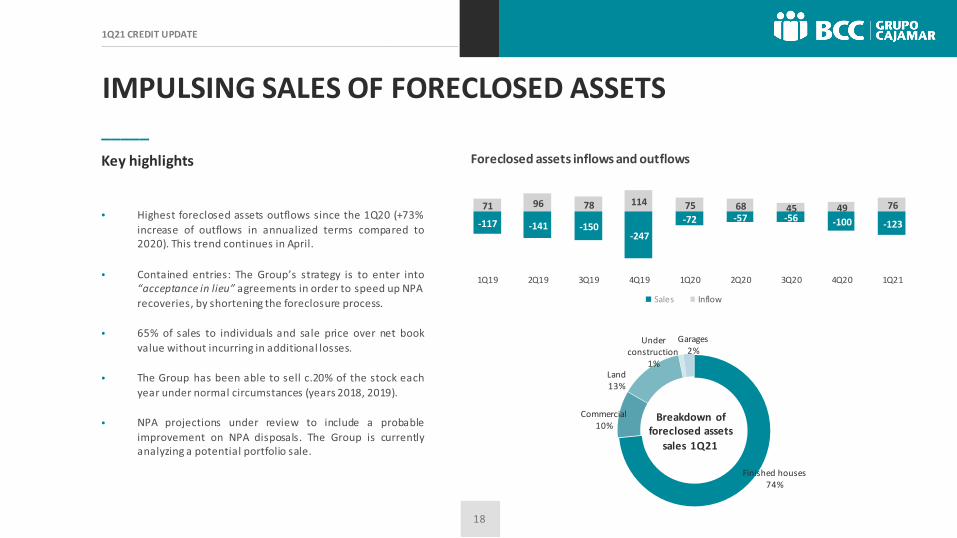
Key highlights
•
•
•
•
•
Finished houses74%
Commercial10%
Land13%
Under construction
1%
Garages 2%
Breakdown of foreclosed assets
sales 1Q21
71 96 78 114 75 68 45 49 76
-117 -141 -150-247
-72 -57 -56 -100 -123
1Q19 2Q19 3Q19 4Q19 1Q20 2Q20 3Q20 4Q20 1Q21
Foreclosed assets inflows and outflows
Sales Inflow
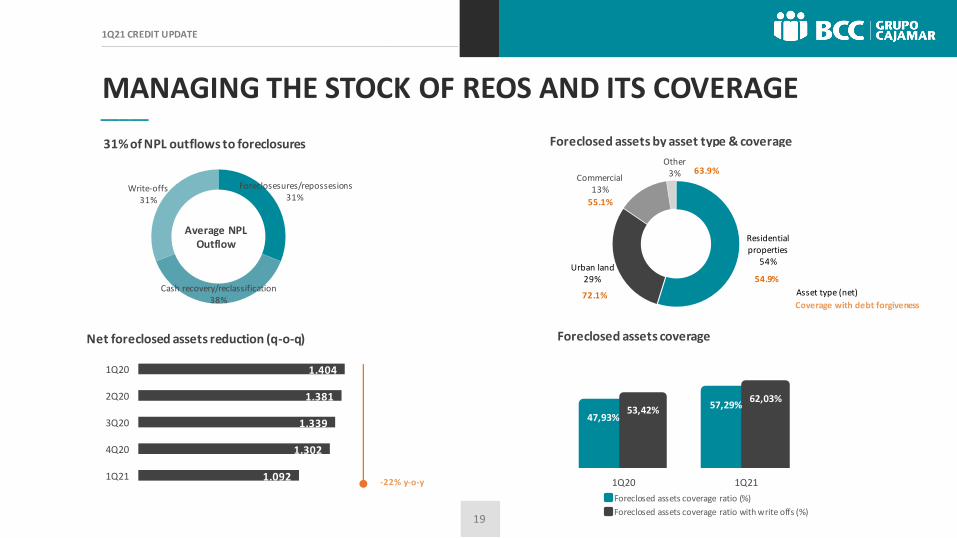
1.404
1.381
1.339
1.302
1.092
1Q20
2Q20
3Q20
4Q20
1Q21
Net foreclosed assets reduction (q-o-q)
Residential properties
54%Urban land
29%
Commercial13%
Other3%
Foreclosed assets by asset type & coverage
54.9%
55.1%
63.9%
72.1% Asset type (net)
MANAGING THE STOCK OF REOS AND ITS COVERAGE_____
Foreclosesures/repossesions31%
Cash recovery/reclassification38%
Write-offs31%
31% of NPL outflows to foreclosures
Average NPL Outflow
47,93%57,29%53,42%
62,03%
1Q20 1Q21
Foreclosed assets coverage
Foreclosed assets coverage ratio (%)
Foreclosed assets coverage ratio with write offs (%)
_____
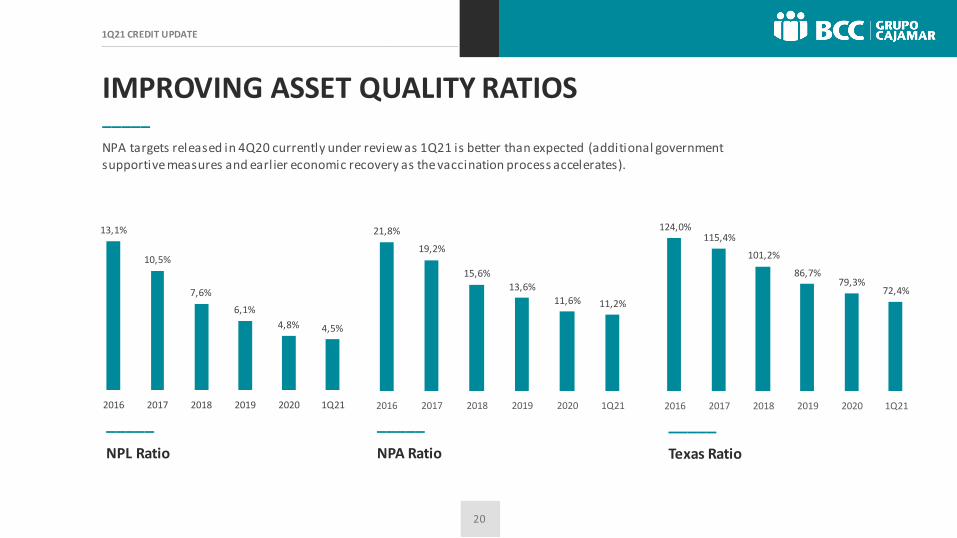
NPA Ratio
_____
Texas Ratio
IMPROVING ASSET QUALITY RATIOS
13,1%
10,5%
7,6%
6,1%
4,8% 4,5%
2016 2017 2018 2019 2020 1Q21
124,0%115,4%
101,2%
86,7%79,3%
72,4%
00%
20%
40%
60%
80%
100%
120%
140%
2016 2017 2018 2019 2020 1Q21
21,8%
19,2%
15,6%
13,6%
11,6% 11,2%
2016 2017 2018 2019 2020 1Q21
_____
_____
NPL Ratio
TABLE OF CONTENTS
_____
1. Overview of Grupo Cajamar
2. Key Highlights
3. Asset Quality
4. COVID-19 response
5. Capital, Funding & Liquidity
6. Business & Results
7. Conclusions
8. Annex
_____
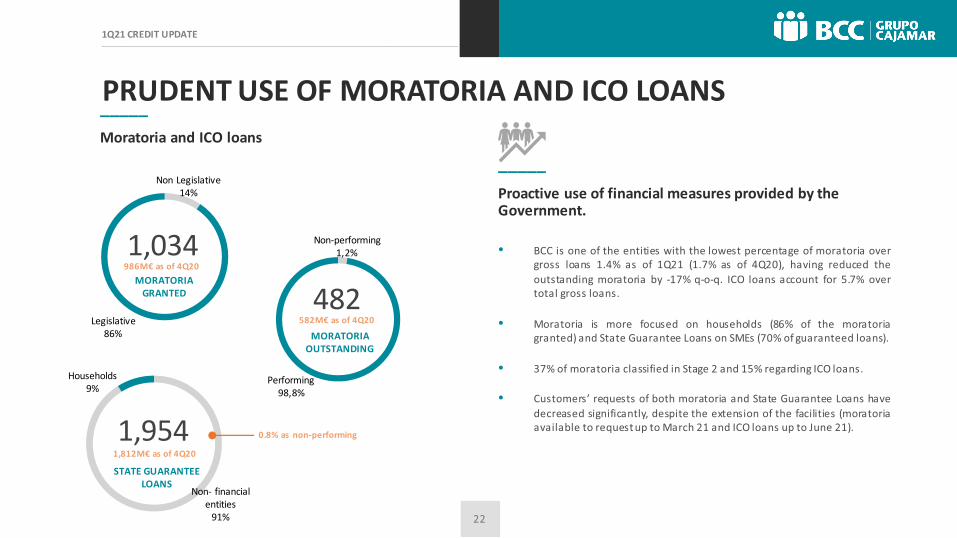
Moratoria and ICO loans
_____
Proactive use of financial measures provided by the Government.
•
•
•
•
PRUDENT USE OF MORATORIA AND ICO LOANS
Non-performing1,2%
Performing98,8%
482MORATORIA
OUTSTANDING
Non Legislative14%
Legislative86%
1,034MORATORIA
GRANTED
Non- financial entities
91%
Households9%
1,954STATE GUARANTEE
LOANS
_____
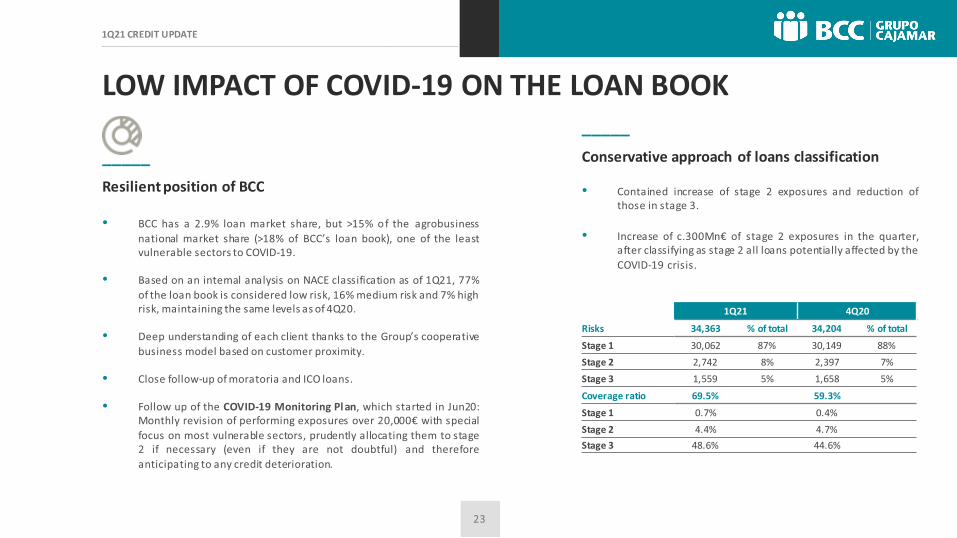
Conservative approach of loans classification_____
Resilient position of BCC
•
•
•
•
•
LOW IMPACT OF COVID-19 ON THE LOAN BOOK
1Q21 4Q20
Risks 34,363 % of total 34,204 % of total
Stage 1 30,062 87% 30,149 88%
Stage 2 2,742 8% 2,397 7%
Stage 3 1,559 5% 1,658 5%
Coverage ratio 69.5% 59.3%
Stage 1 0.7% 0.4%
Stage 2 4.4% 4.7%
Stage 3 48.6% 44.6%
•
•
TABLE OF CONTENTS
_____
1. Overview of Grupo Cajamar
2. Key Highlights
3. Asset Quality
4. COVID-19 response
5. Capital, Funding & Liquidity
6. Business & Results
7. Conclusions
8. Annex
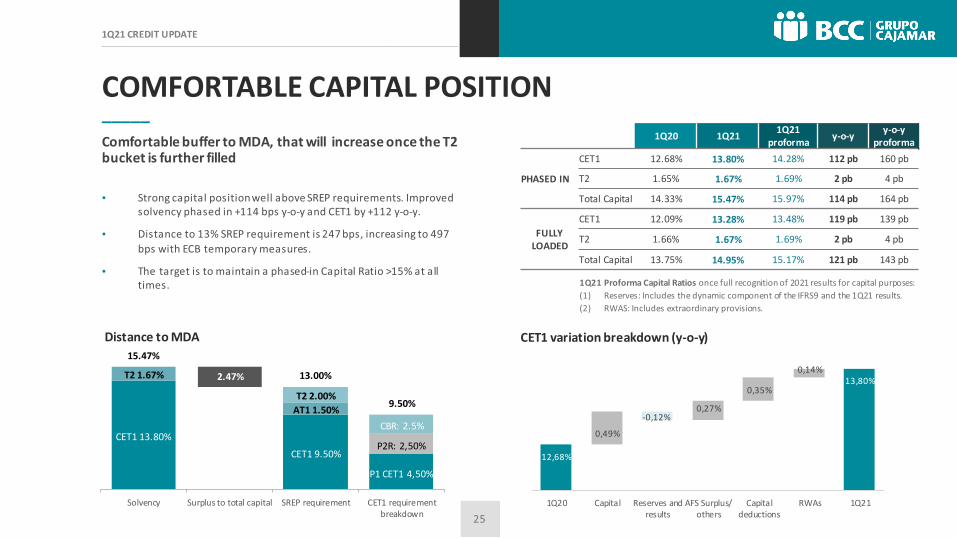
COMFORTABLE CAPITAL POSITION_____
Comfortable buffer to MDA, that will increase once the T2 bucket is further filled
•
•
•
CET1 13.80%
CET1 CET1 9.50%
P1 CET1 4,50%
P2R: 2,50%
CBR: 2.5%
AT1 1.50%9.50%
T2 1.67%
T2 2.00%
15.47%
2.47% 13.00%
-
0.002%
0.004%
0.006%
0.008%
0.010%
0.012%
0.014%
0.016%
Solvency Surplus to total capital SREP requirement CET1 requirementbreakdown
Distance to MDA
1Q20 1Q211Q21
proformay-o-y
y-o-yproforma
PHASED IN
CET1 12.68% 13.80% 14.28% 112 pb 160 pb
T2 1.65% 1.67% 1.69% 2 pb 4 pb
Total Capital 14.33% 15.47% 15.97% 114 pb 164 pb
FULLY LOADED
CET1 12.09% 13.28% 13.48% 119 pb 139 pb
T2 1.66% 1.67% 1.69% 2 pb 4 pb
Total Capital 13.75% 14.95% 15.17% 121 pb 143 pb
12,68%
13,80%
0,49%
-0,12%0,27%
0,35%
0,14%
1Q20 Capital Reserves andresults
AFS Surplus/others
Capitaldeductions
RWAs 1Q21
CET1 variation breakdown (y-o-y)
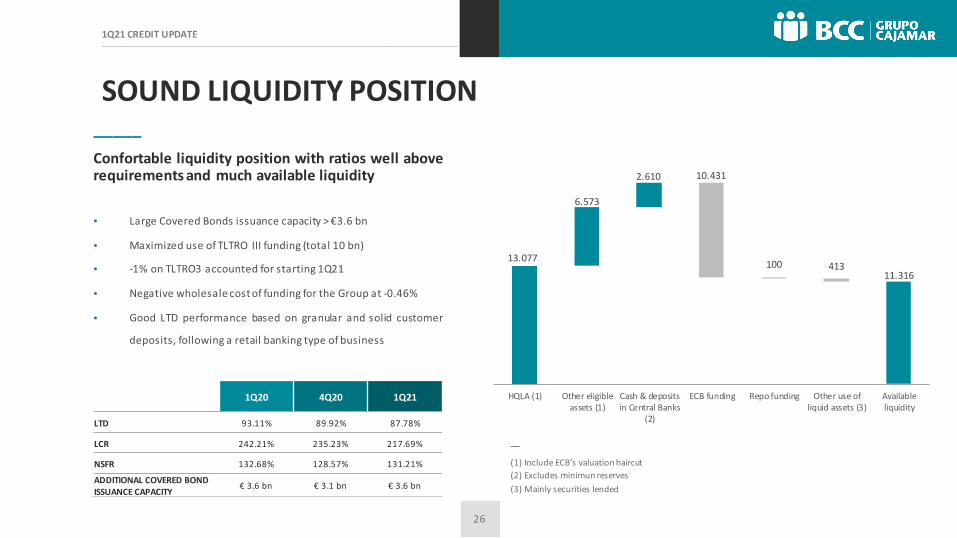
SOUND LIQUIDITY POSITION_____
Confortable liquidity position with ratios well aboverequirements and much available liquidity
•
•
•
•
•
1Q20 4Q20 1Q21
LTD 93.11% 89.92% 87.78%
LCR 242.21% 235.23% 217.69%
NSFR 132.68% 128.57% 131.21%
ADDITIONAL COVERED BOND ISSUANCE CAPACITY
€ 3.6 bn € 3.1 bn € 3.6 bn
13.077
11.316
6.573
2.610 10.431
100 413
HQLA (1) Other eligibleassets (1)
Cash & depositsin Central Banks
(2)
ECB funding Repo funding Other use ofliquid assets (3)
Availableliquidity
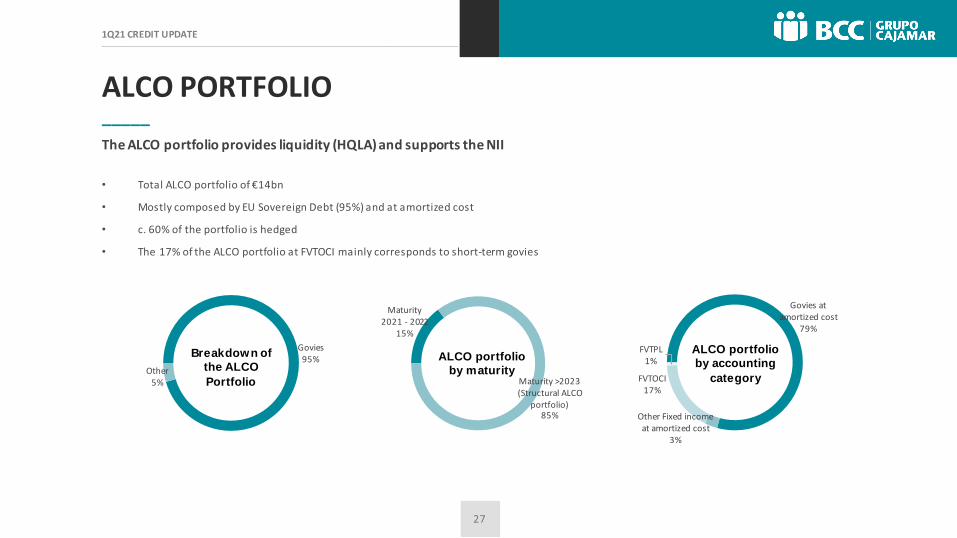
ALCO PORTFOLIO_____
The ALCO portfolio provides liquidity (HQLA) and supports the NII
Govies at amortized cost
79%
Other Fixed income at amortized cost
3%
FVTOCI17%
FVTPL1%
ALCO portfolio
by accounting
category
Govies95%
Other5%
Breakdown of
the ALCO
Portfolio
Maturity 2021 - 2022
15%
Maturity >2023 (Structural ALCO
portfolio)85%
ALCO portfolio
by maturity
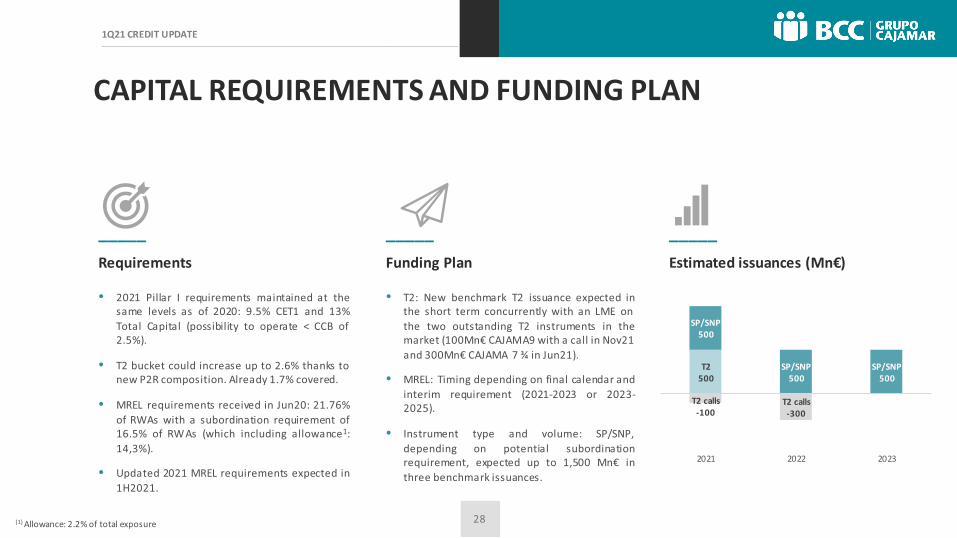
CAPITAL REQUIREMENTS AND FUNDING PLAN
_____
Funding Plan
•
•
•
_____
Requirements
•
•
•
•
_____
Estimated issuances (Mn€)
T2500
SP/SNP500
SP/SNP500
SP/SNP500
T2 calls-100
T2 calls-300
2021 2022 2023
TABLE OF CONTENTS
_____
1. Overview of Grupo Cajamar
2. Key Highlights
3. Asset Quality
4. COVID-19 response
5. Capital, Funding & Liquidity
6. Business & Results
7. Conclusions
8. Annex
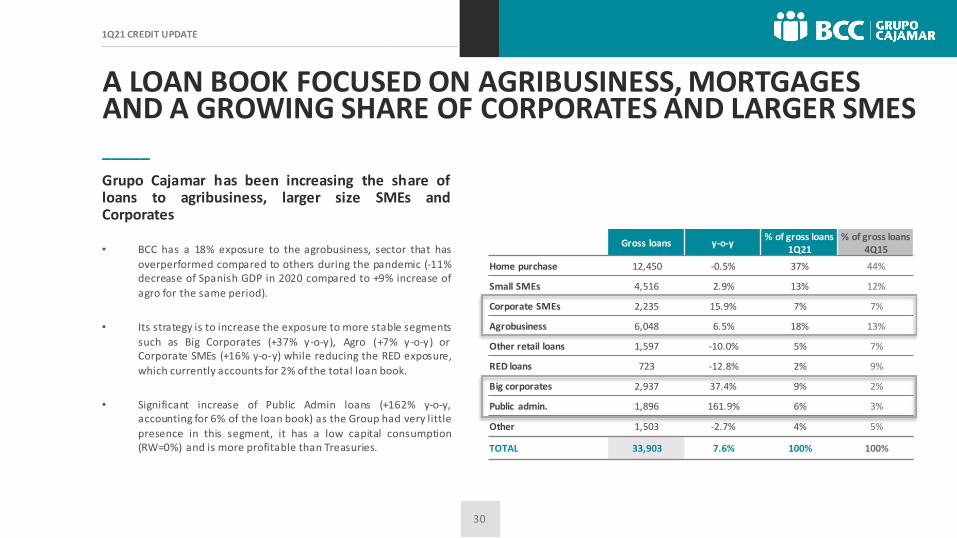
A LOAN BOOK FOCUSED ON AGRIBUSINESS, MORTGAGES AND A GROWING SHARE OF CORPORATES AND LARGER SMES
Gross loans y-o-y% of gross loans
1Q21% of gross loans
4Q15
Home purchase 12,450 -0.5% 37% 44%
Small SMEs 4,516 2.9% 13% 12%
Corporate SMEs 2,235 15.9% 7% 7%
Agrobusiness 6,048 6.5% 18% 13%
Other retail loans 1,597 -10.0% 5% 7%
RED loans 723 -12.8% 2% 9%
Big corporates 2,937 37.4% 9% 2%
Public admin. 1,896 161.9% 6% 3%
Other 1,503 -2.7% 4% 5%
TOTAL 33,903 7.6% 100% 100%
_____
Grupo Cajamar has been increasing the share ofloans to agribusiness, larger size SMEs andCorporates
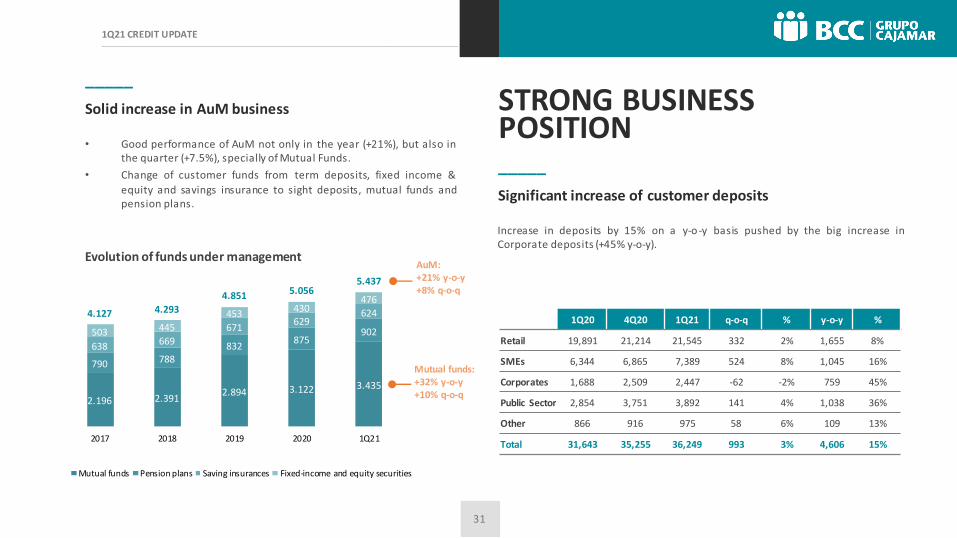
STRONG BUSINESS POSITION_____
Significant increase of customer deposits
_____
Solid increase in AuM business
1Q20 4Q20 1Q21 q-o-q % y-o-y %
Retail 19,891 21,214 21,545 332 2% 1,655 8%
SMEs 6,344 6,865 7,389 524 8% 1,045 16%
Corporates 1,688 2,509 2,447 -62 -2% 759 45%
Public Sector 2,854 3,751 3,892 141 4% 1,038 36%
Other 866 916 975 58 6% 109 13%
Total 31,643 35,255 36,249 993 3% 4,606 15%
2.196 2.3912.894 3.122 3.435
790 788832
875902
638 669
671629
624
503 445
453430
476
4.127 4.293
4.851 5.0565.437
(500 ,0)
50 0,0
15 00,0
25 00,0
35 00,0
45 00,0
55 00,0
2017 2018 2019 2020 1Q21
Evolution of funds under management
Mutual funds Pension plans Saving insurances Fixed-income and equity securities
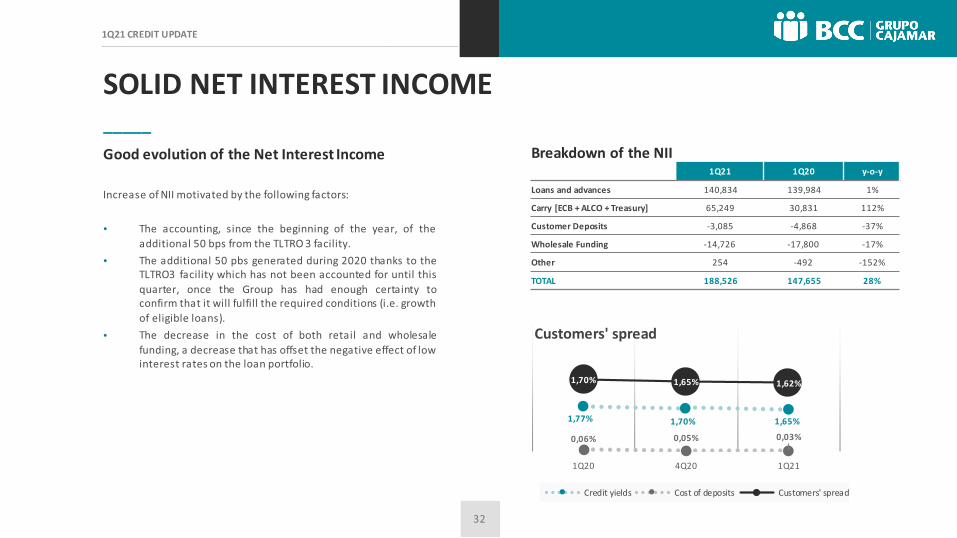
SOLID NET INTEREST INCOME_____
Good evolution of the Net Interest Income
•
•
•
Breakdown of the NII1Q21 1Q20 y-o-y
Loans and advances 140,834 139,984 1%
Carry [ECB + ALCO + Treasury] 65,249 30,831 112%
Customer Deposits -3,085 -4,868 -37%
Wholesale Funding -14,726 -17,800 -17%
Other 254 -492 -152%
TOTAL 188,526 147,655 28%
1,77% 1,70% 1,65%
0,06% 0,05% 0,03%
1,70% 1,65% 1,62%
0,00%
0,50%
1,00%
1,50%
2,00%
2,50%
3,00%
0,00%
1,00%
2,00%
3,00%
4,00%
5,00%
1Q20 4Q20 1Q21
Customers' spread
Credit yields Cost of deposits Customers' spread
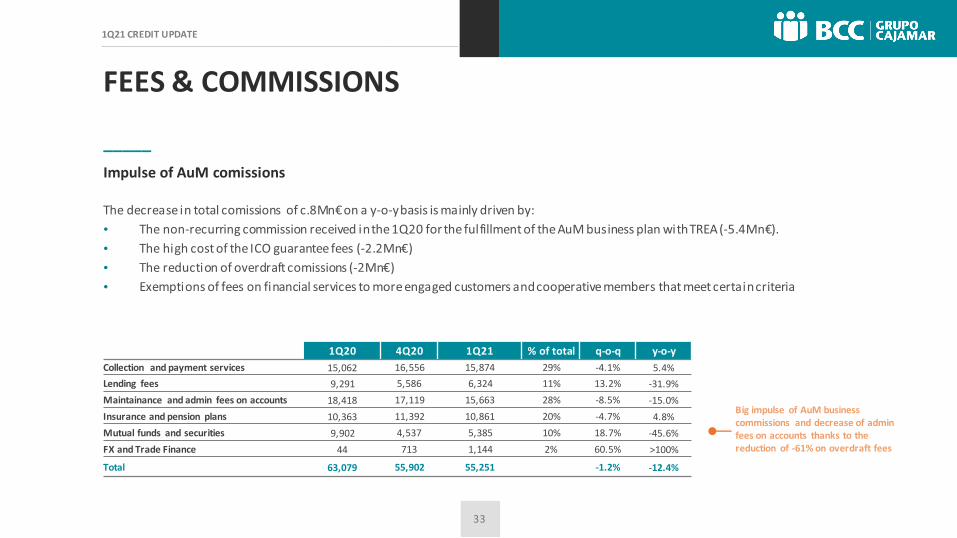
FEES & COMMISSIONS
_____
Impulse of AuM comissions
•
•
•
•
1Q20 4Q20 1Q21 % of total q-o-q y-o-y
Collection and payment services 15,062 16,556 15,874 29% -4.1% 5.4%
Lending fees 9,291 5,586 6,324 11% 13.2% -31.9%
Maintainance and admin fees on accounts 18,418 17,119 15,663 28% -8.5% -15.0%
Insurance and pension plans 10,363 11,392 10,861 20% -4.7% 4.8%
Mutual funds and securities 9,902 4,537 5,385 10% 18.7% -45.6%
FX and Trade Finance 44 713 1,144 2% 60.5% >100%
Total 63,079 55,902 55,251 -1.2% -12.4%
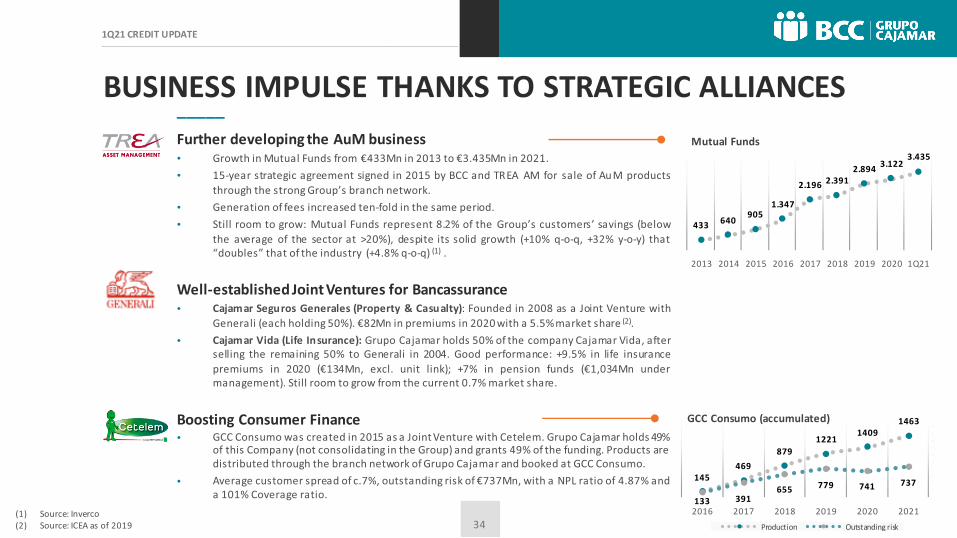
BUSINESS IMPULSE THANKS TO STRATEGIC ALLIANCES_____
Further developing the AuM business•
•
•
•
Well-established Joint Ventures for Bancassurance•
•
Boosting Consumer Finance•
•
433 640905
1.347
2.196 2.3912.894
3.1223.435
2013 2014 2015 2016 2017 2018 2019 2020 1Q21
Mutual Funds
145469
879
12211409
1463
133 391655 779 741 737
0
200
400
600
800
1000
1200
1400
1600
1800
2000
2016 2017 2018 2019 2020 2021
GCC Consumo (accumulated)
Production Outstanding risk
TABLE OF CONTENTS
_____
1. Overview of Grupo Cajamar
2. Key Highlights
3. Asset Quality
4. COVID-19 response
5. Capital, Funding & Liquidity
6. Business & Results
7. Conclusions
8. Annex
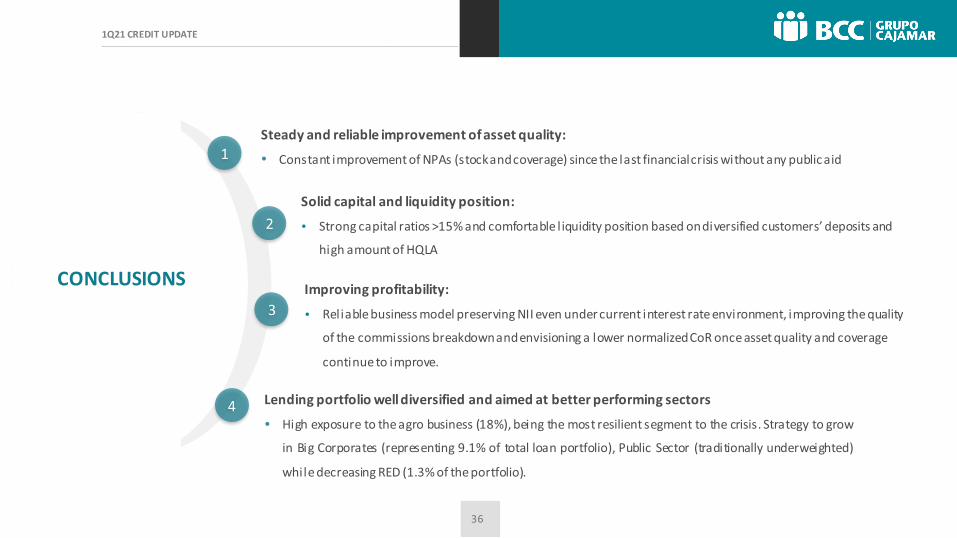
•
•
•
2
3
CONCLUSIONS
1
4
•

TABLE OF CONTENTS
_____
1. Overview of Grupo Cajamar
2. Key Highlights
3. Asset Quality
4. COVID-19 response
5. Capital, Funding & Liquidity
6. Business & Results
7. Conclusions
8. Annex
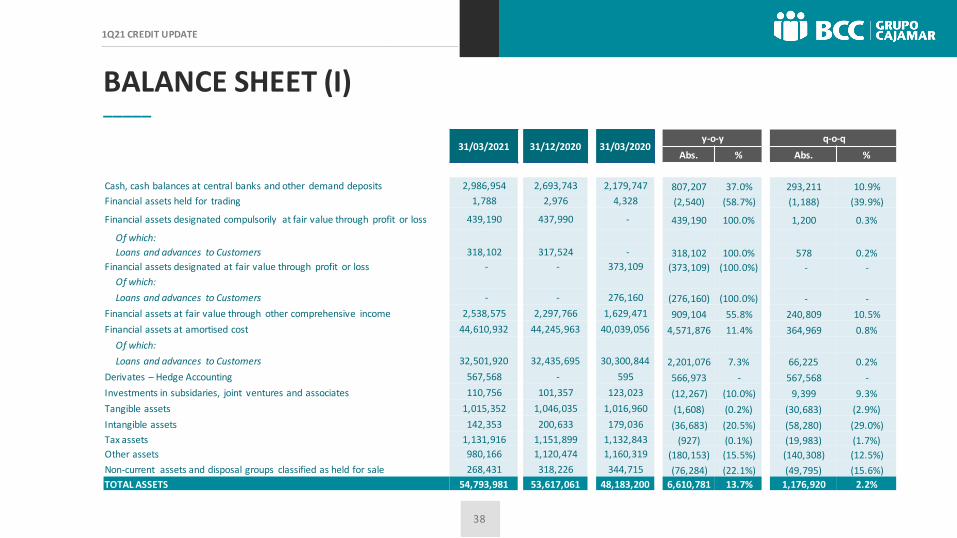
BALANCE SHEET (I)_____
31/03/2021 31/12/2020 31/03/2020y-o-y q-o-q
Abs. % Abs. %
Cash, cash balances at central banks and other demand deposits 2,986,954 2,693,743 2,179,747 807,207 37.0% 293,211 10.9%
Financial assets held for trading 1,788 2,976 4,328 (2,540) (58.7%) (1,188) (39.9%)
Financial assets designated compulsorily at fair value through profit or loss 439,190 437,990 - 439,190 100.0% 1,200 0.3%
Of which:
Loans and advances to Customers 318,102 317,524 - 318,102 100.0% 578 0.2%
Financial assets designated at fair value through profit or loss - - 373,109 (373,109) (100.0%) - -
Of which:
Loans and advances to Customers - - 276,160 (276,160) (100.0%) - -
Financial assets at fair value through other comprehensive income 2,538,575 2,297,766 1,629,471 909,104 55.8% 240,809 10.5%
Financial assets at amortised cost 44,610,932 44,245,963 40,039,056 4,571,876 11.4% 364,969 0.8%
Of which:
Loans and advances to Customers 32,501,920 32,435,695 30,300,844 2,201,076 7.3% 66,225 0.2%
Derivates – Hedge Accounting 567,568 - 595 566,973 - 567,568 -
Investments in subsidaries, joint ventures and associates 110,756 101,357 123,023 (12,267) (10.0%) 9,399 9.3%
Tangible assets 1,015,352 1,046,035 1,016,960 (1,608) (0.2%) (30,683) (2.9%)
Intangible assets 142,353 200,633 179,036 (36,683) (20.5%) (58,280) (29.0%)
Tax assets 1,131,916 1,151,899 1,132,843 (927) (0.1%) (19,983) (1.7%)
Other assets 980,166 1,120,474 1,160,319 (180,153) (15.5%) (140,308) (12.5%)
Non-current assets and disposal groups classified as held for sale 268,431 318,226 344,715 (76,284) (22.1%) (49,795) (15.6%)
TOTAL ASSETS 54,793,981 53,617,061 48,183,200 6,610,781 13.7% 1,176,920 2.2%
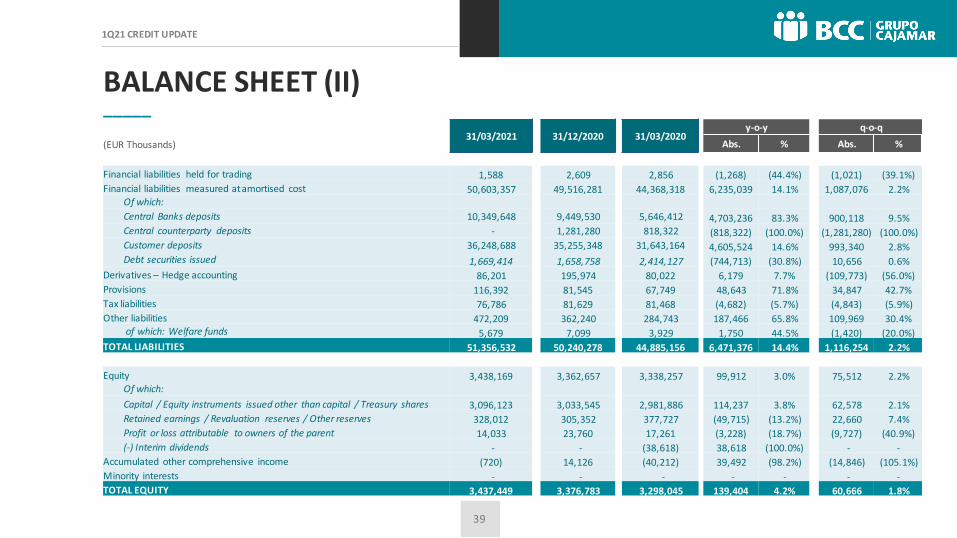
BALANCE SHEET (II)_____
31/03/2021 31/12/2020 31/03/2020y-o-y q-o-q
(EUR Thousands) Abs. % Abs. %
Financial liabilities held for trading 1,588 2,609 2,856 (1,268) (44.4%) (1,021) (39.1%)
Financial liabilities measured at amortised cost 50,603,357 49,516,281 44,368,318 6,235,039 14.1% 1,087,076 2.2%Of which:
Central Banks deposits 10,349,648 9,449,530 5,646,412 4,703,236 83.3% 900,118 9.5%Central counterparty deposits - 1,281,280 818,322 (818,322) (100.0%) (1,281,280) (100.0%)Customer deposits 36,248,688 35,255,348 31,643,164 4,605,524 14.6% 993,340 2.8%Debt securities issued 1,669,414 1,658,758 2,414,127 (744,713) (30.8%) 10,656 0.6%
Derivatives – Hedge accounting 86,201 195,974 80,022 6,179 7.7% (109,773) (56.0%)
Provisions 116,392 81,545 67,749 48,643 71.8% 34,847 42.7%
Tax liabilities 76,786 81,629 81,468 (4,682) (5.7%) (4,843) (5.9%)
Other liabilities 472,209 362,240 284,743 187,466 65.8% 109,969 30.4%of which: Welfare funds 5,679 7,099 3,929 1,750 44.5% (1,420) (20.0%)
TOTAL LIABILITIES 51,356,532 50,240,278 44,885,156 6,471,376 14.4% 1,116,254 2.2%
Equity 3,438,169 3,362,657 3,338,257 99,912 3.0% 75,512 2.2%Of which:
Capital / Equity instruments issued other than capital / Treasury shares 3,096,123 3,033,545 2,981,886 114,237 3.8% 62,578 2.1%
Retained earnings / Revaluation reserves / Other reserves 328,012 305,352 377,727 (49,715) (13.2%) 22,660 7.4%
Profit or loss attributable to owners of the parent 14,033 23,760 17,261 (3,228) (18.7%) (9,727) (40.9%)
(-) Interim dividends - - (38,618) 38,618 (100.0%) - -
Accumulated other comprehensive income (720) 14,126 (40,212) 39,492 (98.2%) (14,846) (105.1%)
Minority interests - - - - - - -
TOTAL EQUITY 3,437,449 3,376,783 3,298,045 139,404 4.2% 60,666 1.8%
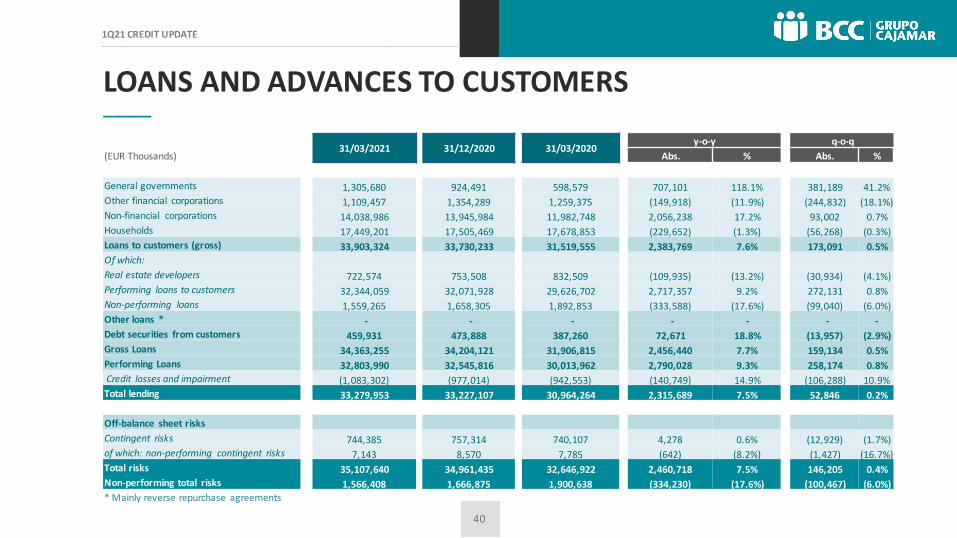
LOANS AND ADVANCES TO CUSTOMERS_____
31/03/2021 31/12/2020 31/03/2020y-o-y q-o-q
(EUR Thousands) Abs. % Abs. %
General governments 1,305,680 924,491 598,579 707,101 118.1% 381,189 41.2%Other financial corporations 1,109,457 1,354,289 1,259,375 (149,918) (11.9%) (244,832) (18.1%)Non-financial corporations 14,038,986 13,945,984 11,982,748 2,056,238 17.2% 93,002 0.7%Households 17,449,201 17,505,469 17,678,853 (229,652) (1.3%) (56,268) (0.3%)Loans to customers (gross) 33,903,324 33,730,233 31,519,555 2,383,769 7.6% 173,091 0.5%Of which:
Real estate developers 722,574 753,508 832,509 (109,935) (13.2%) (30,934) (4.1%)Performing loans to customers 32,344,059 32,071,928 29,626,702 2,717,357 9.2% 272,131 0.8%Non-performing loans 1,559,265 1,658,305 1,892,853 (333,588) (17.6%) (99,040) (6.0%)Other loans * - - - - - - -Debt securities from customers 459,931 473,888 387,260 72,671 18.8% (13,957) (2.9%)Gross Loans 34,363,255 34,204,121 31,906,815 2,456,440 7.7% 159,134 0.5%Performing Loans 32,803,990 32,545,816 30,013,962 2,790,028 9.3% 258,174 0.8%Credit losses and impairment (1,083,302) (977,014) (942,553) (140,749) 14.9% (106,288) 10.9%Total lending 33,279,953 33,227,107 30,964,264 2,315,689 7.5% 52,846 0.2%
Off-balance sheet risks
Contingent risks 744,385 757,314 740,107 4,278 0.6% (12,929) (1.7%)of which: non-performing contingent risks 7,143 8,570 7,785 (642) (8.2%) (1,427) (16.7%)Total risks 35,107,640 34,961,435 32,646,922 2,460,718 7.5% 146,205 0.4%Non-performing total risks 1,566,408 1,666,875 1,900,638 (334,230) (17.6%) (100,467) (6.0%)* Mainly reverse repurchase agreements
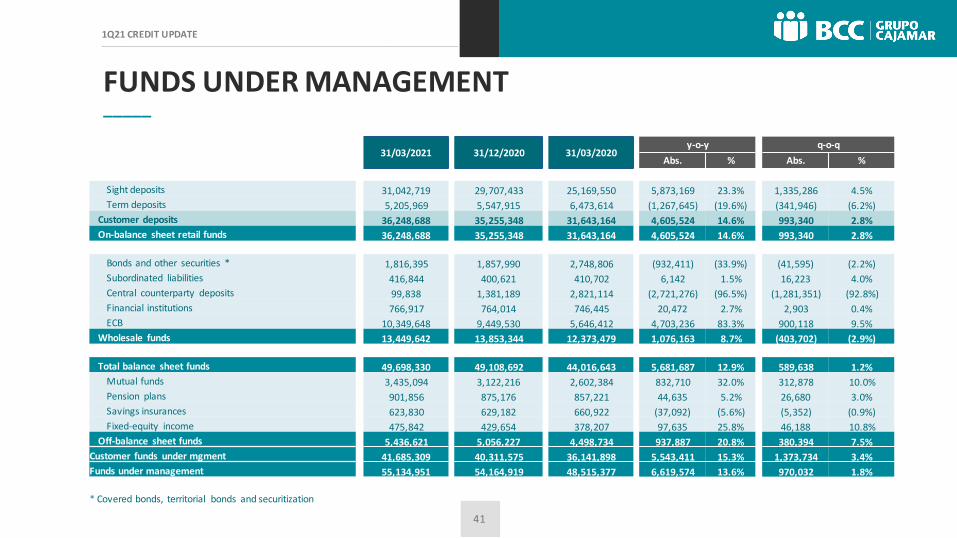
FUNDS UNDER MANAGEMENT_____
31/03/2021 31/12/2020 31/03/2020y-o-y q-o-q
Abs. % Abs. %
Sight deposits 31,042,719 29,707,433 25,169,550 5,873,169 23.3% 1,335,286 4.5%
Term deposits 5,205,969 5,547,915 6,473,614 (1,267,645) (19.6%) (341,946) (6.2%)
Customer deposits 36,248,688 35,255,348 31,643,164 4,605,524 14.6% 993,340 2.8%
On-balance sheet retail funds 36,248,688 35,255,348 31,643,164 4,605,524 14.6% 993,340 2.8%
Bonds and other securities * 1,816,395 1,857,990 2,748,806 (932,411) (33.9%) (41,595) (2.2%)
Subordinated liabilities 416,844 400,621 410,702 6,142 1.5% 16,223 4.0%
Central counterparty deposits 99,838 1,381,189 2,821,114 (2,721,276) (96.5%) (1,281,351) (92.8%)
Financial institutions 766,917 764,014 746,445 20,472 2.7% 2,903 0.4%
ECB 10,349,648 9,449,530 5,646,412 4,703,236 83.3% 900,118 9.5%
Wholesale funds 13,449,642 13,853,344 12,373,479 1,076,163 8.7% (403,702) (2.9%)
Total balance sheet funds 49,698,330 49,108,692 44,016,643 5,681,687 12.9% 589,638 1.2%
Mutual funds 3,435,094 3,122,216 2,602,384 832,710 32.0% 312,878 10.0%
Pension plans 901,856 875,176 857,221 44,635 5.2% 26,680 3.0%
Savings insurances 623,830 629,182 660,922 (37,092) (5.6%) (5,352) (0.9%)
Fixed-equity income 475,842 429,654 378,207 97,635 25.8% 46,188 10.8%
Off-balance sheet funds 5,436,621 5,056,227 4,498,734 937,887 20.8% 380,394 7.5%
Customer funds under mgment 41,685,309 40,311,575 36,141,898 5,543,411 15.3% 1,373,734 3.4%
Funds under management 55,134,951 54,164,919 48,515,377 6,619,574 13.6% 970,032 1.8%
* Covered bonds, territorial bonds and securitization
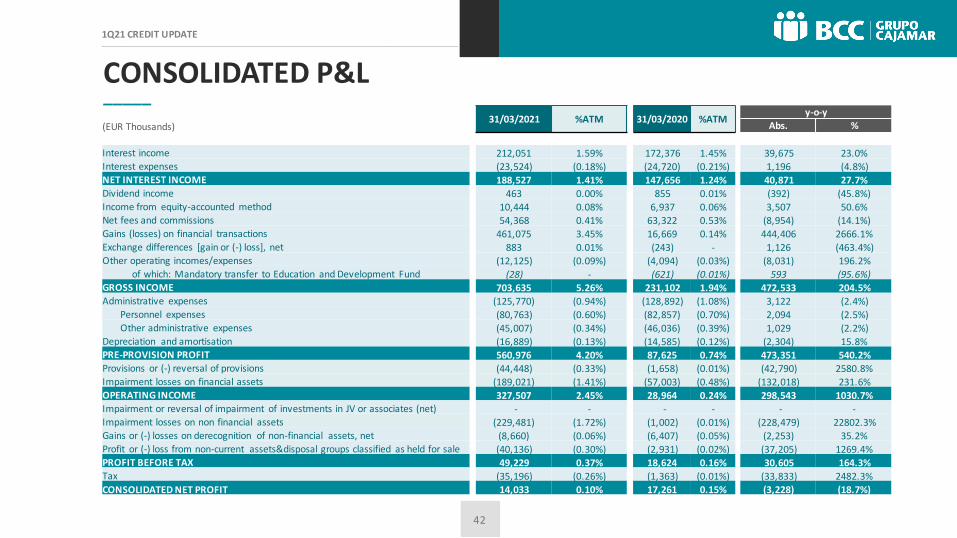
CONSOLIDATED P&L_____
31/03/2021 %ATM 31/03/2020 %ATMy-o-y
(EUR Thousands) Abs. %
Interest income 212,051 1.59% 172,376 1.45% 39,675 23.0%Interest expenses (23,524) (0.18%) (24,720) (0.21%) 1,196 (4.8%)NET INTEREST INCOME 188,527 1.41% 147,656 1.24% 40,871 27.7%Dividend income 463 0.00% 855 0.01% (392) (45.8%)Income from equity-accounted method 10,444 0.08% 6,937 0.06% 3,507 50.6%Net fees and commissions 54,368 0.41% 63,322 0.53% (8,954) (14.1%)Gains (losses) on financial transactions 461,075 3.45% 16,669 0.14% 444,406 2666.1%Exchange differences [gain or (-) loss], net 883 0.01% (243) - 1,126 (463.4%)Other operating incomes/expenses (12,125) (0.09%) (4,094) (0.03%) (8,031) 196.2%
of which: Mandatory transfer to Education and Development Fund (28) - (621) (0.01%) 593 (95.6%)GROSS INCOME 703,635 5.26% 231,102 1.94% 472,533 204.5%Administrative expenses (125,770) (0.94%) (128,892) (1.08%) 3,122 (2.4%)
Personnel expenses (80,763) (0.60%) (82,857) (0.70%) 2,094 (2.5%)Other administrative expenses (45,007) (0.34%) (46,036) (0.39%) 1,029 (2.2%)
Depreciation and amortisation (16,889) (0.13%) (14,585) (0.12%) (2,304) 15.8%PRE-PROVISION PROFIT 560,976 4.20% 87,625 0.74% 473,351 540.2%Provisions or (-) reversal of provisions (44,448) (0.33%) (1,658) (0.01%) (42,790) 2580.8%Impairment losses on financial assets (189,021) (1.41%) (57,003) (0.48%) (132,018) 231.6%OPERATING INCOME 327,507 2.45% 28,964 0.24% 298,543 1030.7%Impairment or reversal of impairment of investments in JV or associates (net) - - - - - -Impairment losses on non financial assets (229,481) (1.72%) (1,002) (0.01%) (228,479) 22802.3%Gains or (-) losses on derecognition of non-financial assets, net (8,660) (0.06%) (6,407) (0.05%) (2,253) 35.2%Profit or (-) loss from non-current assets&disposal groups classified as held for sale (40,136) (0.30%) (2,931) (0.02%) (37,205) 1269.4%PROFIT BEFORE TAX 49,229 0.37% 18,624 0.16% 30,605 164.3%Tax (35,196) (0.26%) (1,363) (0.01%) (33,833) 2482.3%
CONSOLIDATED NET PROFIT 14,033 0.10% 17,261 0.15% (3,228) (18.7%)
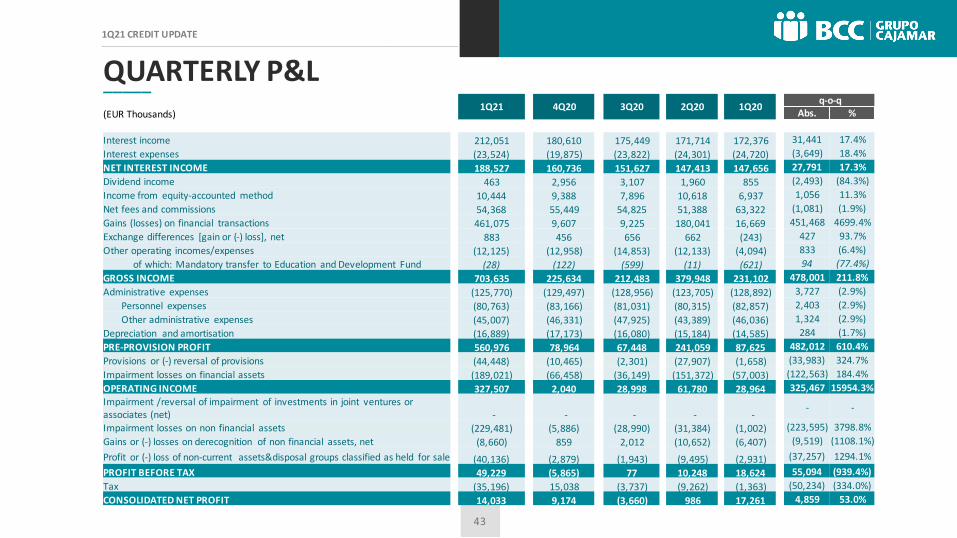
QUARTERLY P&L_____1Q21 4Q20 3Q20 2Q20 1Q20
q-o-q
(EUR Thousands) Abs. %
Interest income 212,051 180,610 175,449 171,714 172,376 31,441 17.4%
Interest expenses (23,524) (19,875) (23,822) (24,301) (24,720) (3,649) 18.4%
NET INTEREST INCOME 188,527 160,736 151,627 147,413 147,656 27,791 17.3%
Dividend income 463 2,956 3,107 1,960 855 (2,493) (84.3%)
Income from equity-accounted method 10,444 9,388 7,896 10,618 6,937 1,056 11.3%
Net fees and commissions 54,368 55,449 54,825 51,388 63,322 (1,081) (1.9%)
Gains (losses) on financial transactions 461,075 9,607 9,225 180,041 16,669 451,468 4699.4%
Exchange differences [gain or (-) loss], net 883 456 656 662 (243) 427 93.7%
Other operating incomes/expenses (12,125) (12,958) (14,853) (12,133) (4,094) 833 (6.4%)
of which: Mandatory transfer to Education and Development Fund (28) (122) (599) (11) (621) 94 (77.4%)
GROSS INCOME 703,635 225,634 212,483 379,948 231,102 478,001 211.8%
Administrative expenses (125,770) (129,497) (128,956) (123,705) (128,892) 3,727 (2.9%)
Personnel expenses (80,763) (83,166) (81,031) (80,315) (82,857) 2,403 (2.9%)
Other administrative expenses (45,007) (46,331) (47,925) (43,389) (46,036) 1,324 (2.9%)
Depreciation and amortisation (16,889) (17,173) (16,080) (15,184) (14,585) 284 (1.7%)
PRE-PROVISION PROFIT 560,976 78,964 67,448 241,059 87,625 482,012 610.4%
Provisions or (-) reversal of provisions (44,448) (10,465) (2,301) (27,907) (1,658) (33,983) 324.7%
Impairment losses on financial assets (189,021) (66,458) (36,149) (151,372) (57,003) (122,563) 184.4%
OPERATING INCOME 327,507 2,040 28,998 61,780 28,964 325,467 15954.3%
Impairment /reversal of impairment of investments in joint ventures or associates (net) - - - - -
- -
Impairment losses on non financial assets (229,481) (5,886) (28,990) (31,384) (1,002) (223,595) 3798.8%
Gains or (-) losses on derecognition of non financial assets, net (8,660) 859 2,012 (10,652) (6,407) (9,519) (1108.1%)
Profit or (-) loss of non-current assets&disposal groups classified as held for sale (40,136) (2,879) (1,943) (9,495) (2,931) (37,257) 1294.1%
PROFIT BEFORE TAX 49,229 (5,865) 77 10,248 18,624 55,094 (939.4%)
Tax (35,196) 15,038 (3,737) (9,262) (1,363) (50,234) (334.0%)
CONSOLIDATED NET PROFIT 14,033 9,174 (3,660) 986 17,261 4,859 53.0%
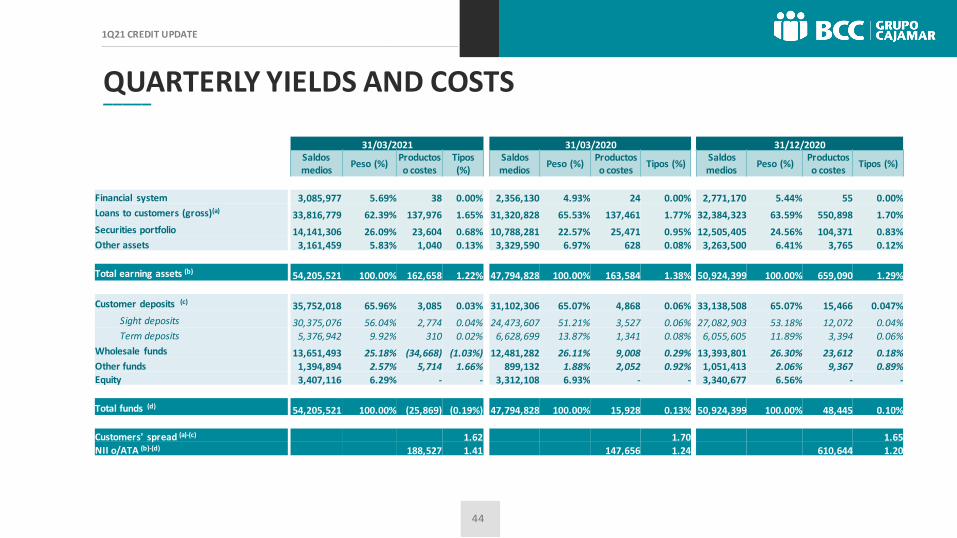
QUARTERLY YIELDS AND COSTS_____
31/03/2021 31/03/2020 31/12/2020Saldos medios
Peso (%)Productos o costes
Tipos (%)
Saldos medios
Peso (%)Productos o costes
Tipos (%)Saldos medios
Peso (%)Productos o costes
Tipos (%)
Financial system 3,085,977 5.69% 38 0.00% 2,356,130 4.93% 24 0.00% 2,771,170 5.44% 55 0.00%
Loans to customers (gross)(a) 33,816,779 62.39% 137,976 1.65% 31,320,828 65.53% 137,461 1.77% 32,384,323 63.59% 550,898 1.70%
Securities portfolio 14,141,306 26.09% 23,604 0.68% 10,788,281 22.57% 25,471 0.95% 12,505,405 24.56% 104,371 0.83%Other assets 3,161,459 5.83% 1,040 0.13% 3,329,590 6.97% 628 0.08% 3,263,500 6.41% 3,765 0.12%
Total earning assets (b) 54,205,521 100.00% 162,658 1.22% 47,794,828 100.00% 163,584 1.38% 50,924,399 100.00% 659,090 1.29%
Customer deposits (c) 35,752,018 65.96% 3,085 0.03% 31,102,306 65.07% 4,868 0.06% 33,138,508 65.07% 15,466 0.047%
Sight deposits 30,375,076 56.04% 2,774 0.04% 24,473,607 51.21% 3,527 0.06% 27,082,903 53.18% 12,072 0.04%Term deposits 5,376,942 9.92% 310 0.02% 6,628,699 13.87% 1,341 0.08% 6,055,605 11.89% 3,394 0.06%
Wholesale funds 13,651,493 25.18% (34,668) (1.03%) 12,481,282 26.11% 9,008 0.29% 13,393,801 26.30% 23,612 0.18%Other funds 1,394,894 2.57% 5,714 1.66% 899,132 1.88% 2,052 0.92% 1,051,413 2.06% 9,367 0.89%Equity 3,407,116 6.29% - - 3,312,108 6.93% - - 3,340,677 6.56% - -
Total funds (d) 54,205,521 100.00% (25,869) (0.19%) 47,794,828 100.00% 15,928 0.13% 50,924,399 100.00% 48,445 0.10%
Customers' spread (a)-(c) 1.62 1.70 1.65NII o/ATA (b)-(d) 188,527 1.41 147,656 1.24 610,644 1.20
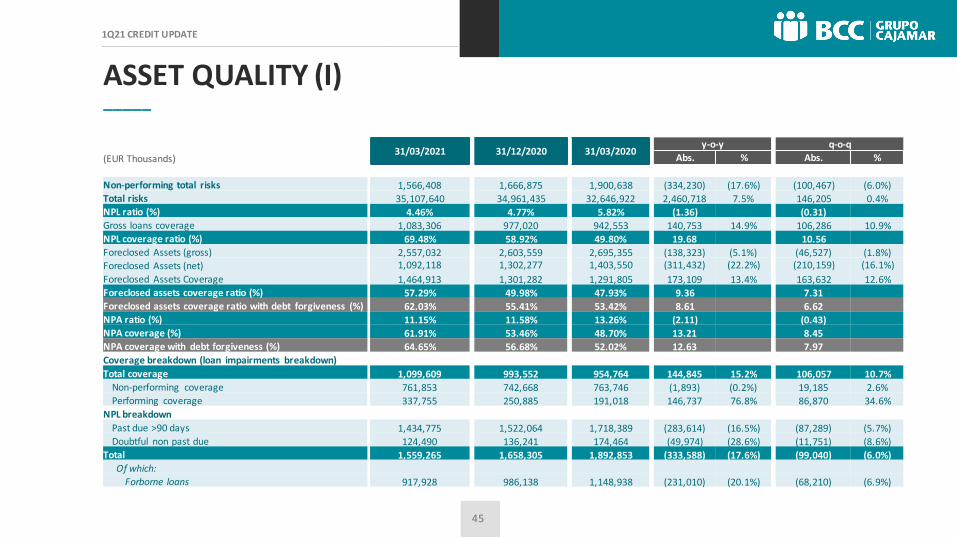
ASSET QUALITY (I)_____
31/03/2021 31/12/2020 31/03/2020y-o-y q-o-q
(EUR Thousands) Abs. % Abs. %
Non-performing total risks 1,566,408 1,666,875 1,900,638 (334,230) (17.6%) (100,467) (6.0%)Total risks 35,107,640 34,961,435 32,646,922 2,460,718 7.5% 146,205 0.4%NPL ratio (%) 4.46% 4.77% 5.82% (1.36) (0.31)Gross loans coverage 1,083,306 977,020 942,553 140,753 14.9% 106,286 10.9%NPL coverage ratio (%) 69.48% 58.92% 49.80% 19.68 10.56Foreclosed Assets (gross) 2,557,032 2,603,559 2,695,355 (138,323) (5.1%) (46,527) (1.8%)Foreclosed Assets (net) 1,092,118 1,302,277 1,403,550 (311,432) (22.2%) (210,159) (16.1%)
Foreclosed Assets Coverage 1,464,913 1,301,282 1,291,805 173,109 13.4% 163,632 12.6%Foreclosed assets coverage ratio (%) 57.29% 49.98% 47.93% 9.36 7.31Foreclosed assets coverage ratio with debt forgiveness (%) 62.03% 55.41% 53.42% 8.61 6.62NPA ratio (%) 11.15% 11.58% 13.26% (2.11) (0.43)NPA coverage (%) 61.91% 53.46% 48.70% 13.21 8.45NPA coverage with debt forgiveness (%) 64.65% 56.68% 52.02% 12.63 7.97Coverage breakdown (loan impairments breakdown)
Total coverage 1,099,609 993,552 954,764 144,845 15.2% 106,057 10.7%Non-performing coverage 761,853 742,668 763,746 (1,893) (0.2%) 19,185 2.6%Performing coverage 337,755 250,885 191,018 146,737 76.8% 86,870 34.6%
NPL breakdown
Past due >90 days 1,434,775 1,522,064 1,718,389 (283,614) (16.5%) (87,289) (5.7%)Doubtful non past due 124,490 136,241 174,464 (49,974) (28.6%) (11,751) (8.6%)
Total 1,559,265 1,658,305 1,892,853 (333,588) (17.6%) (99,040) (6.0%)Of which:
Forborne loans 917,928 986,138 1,148,938 (231,010) (20.1%) (68,210) (6.9%)
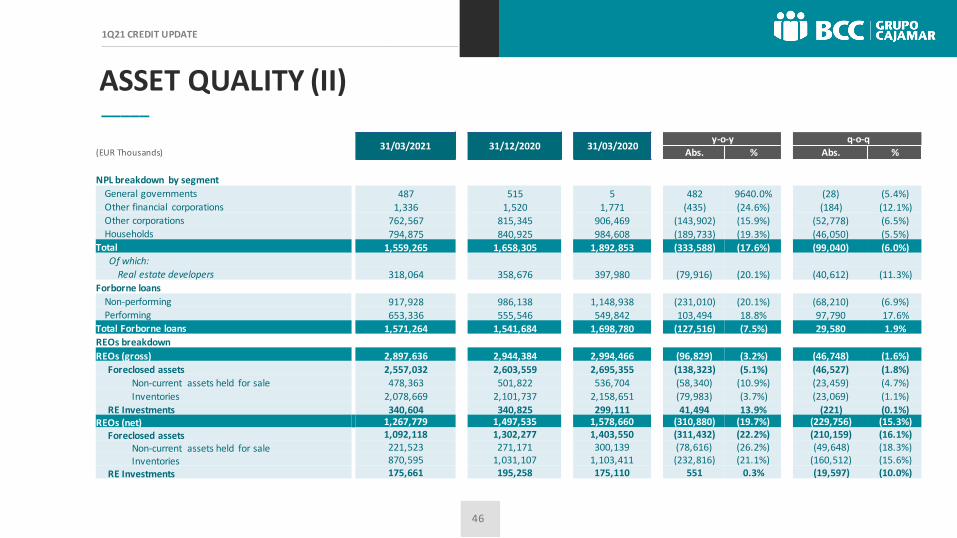
ASSET QUALITY (II)_____
31/03/2021 31/12/2020 31/03/2020y-o-y q-o-q
(EUR Thousands) Abs. % Abs. %
NPL breakdown by segment
General governments 487 515 5 482 9640.0% (28) (5.4%)Other financial corporations 1,336 1,520 1,771 (435) (24.6%) (184) (12.1%)Other corporations 762,567 815,345 906,469 (143,902) (15.9%) (52,778) (6.5%)Households 794,875 840,925 984,608 (189,733) (19.3%) (46,050) (5.5%)
Total 1,559,265 1,658,305 1,892,853 (333,588) (17.6%) (99,040) (6.0%)Of which:
Real estate developers 318,064 358,676 397,980 (79,916) (20.1%) (40,612) (11.3%)Forborne loans
Non-performing 917,928 986,138 1,148,938 (231,010) (20.1%) (68,210) (6.9%)Performing 653,336 555,546 549,842 103,494 18.8% 97,790 17.6%
Total Forborne loans 1,571,264 1,541,684 1,698,780 (127,516) (7.5%) 29,580 1.9%REOs breakdown
REOs (gross) 2,897,636 2,944,384 2,994,466 (96,829) (3.2%) (46,748) (1.6%)
Foreclosed assets 2,557,032 2,603,559 2,695,355 (138,323) (5.1%) (46,527) (1.8%)
Non-current assets held for sale 478,363 501,822 536,704 (58,340) (10.9%) (23,459) (4.7%)
Inventories 2,078,669 2,101,737 2,158,651 (79,983) (3.7%) (23,069) (1.1%)
RE Investments 340,604 340,825 299,111 41,494 13.9% (221) (0.1%)REOs (net) 1,267,779 1,497,535 1,578,660 (310,880) (19.7%) (229,756) (15.3%)
Foreclosed assets 1,092,118 1,302,277 1,403,550 (311,432) (22.2%) (210,159) (16.1%)
Non-current assets held for sale 221,523 271,171 300,139 (78,616) (26.2%) (49,648) (18.3%)
Inventories 870,595 1,031,107 1,103,411 (232,816) (21.1%) (160,512) (15.6%)
RE Investments 175,661 195,258 175,110 551 0.3% (19,597) (10.0%)
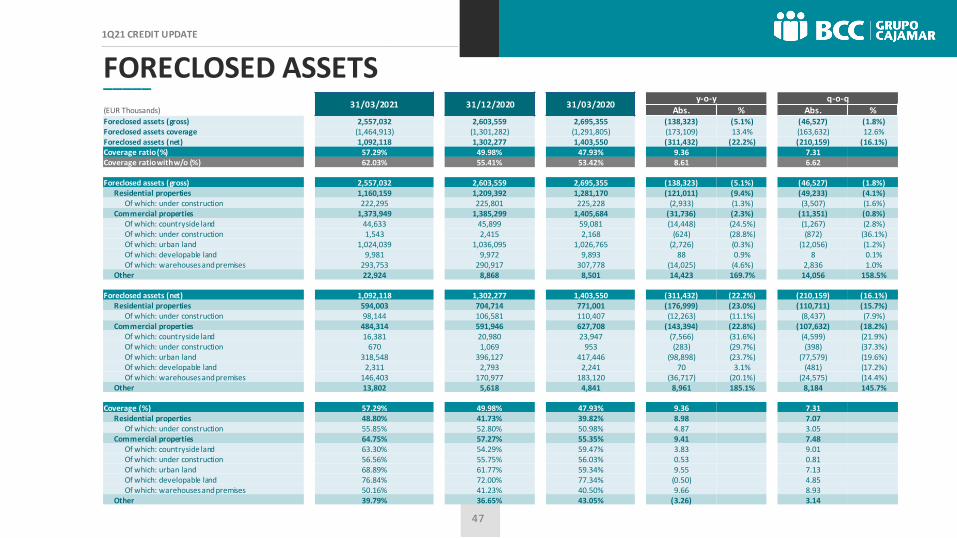
FORECLOSED ASSETS_____31/03/2021 31/12/2020 31/03/2020
y-o-y q-o-q(EUR Thousands) Abs. % Abs. %Foreclosed assets (gross) 2,557,032 2,603,559 2,695,355 (138,323) (5.1%) (46,527) (1.8%)Foreclosed assets coverage (1,464,913) (1,301,282) (1,291,805) (173,109) 13.4% (163,632) 12.6%Foreclosed assets (net) 1,092,118 1,302,277 1,403,550 (311,432) (22.2%) (210,159) (16.1%)Coverage ratio (%) 57.29% 49.98% 47.93% 9.36 7.31Coverage ratio with w/o (%) 62.03% 55.41% 53.42% 8.61 6.62
Foreclosed assets (gross) 2,557,032 2,603,559 2,695,355 (138,323) (5.1%) (46,527) (1.8%)Residential properties 1,160,159 1,209,392 1,281,170 (121,011) (9.4%) (49,233) (4.1%)
Of which: under construction 222,295 225,801 225,228 (2,933) (1.3%) (3,507) (1.6%)Commercial properties 1,373,949 1,385,299 1,405,684 (31,736) (2.3%) (11,351) (0.8%)
Of which: countryside land 44,633 45,899 59,081 (14,448) (24.5%) (1,267) (2.8%)Of which: under construction 1,543 2,415 2,168 (624) (28.8%) (872) (36.1%)Of which: urban land 1,024,039 1,036,095 1,026,765 (2,726) (0.3%) (12,056) (1.2%)Of which: developable land 9,981 9,972 9,893 88 0.9% 8 0.1%Of which: warehouses and premises 293,753 290,917 307,778 (14,025) (4.6%) 2,836 1.0%
Other 22,924 8,868 8,501 14,423 169.7% 14,056 158.5%
Foreclosed assets (net) 1,092,118 1,302,277 1,403,550 (311,432) (22.2%) (210,159) (16.1%)Residential properties 594,003 704,714 771,001 (176,999) (23.0%) (110,711) (15.7%)
Of which: under construction 98,144 106,581 110,407 (12,263) (11.1%) (8,437) (7.9%)Commercial properties 484,314 591,946 627,708 (143,394) (22.8%) (107,632) (18.2%)
Of which: countryside land 16,381 20,980 23,947 (7,566) (31.6%) (4,599) (21.9%)Of which: under construction 670 1,069 953 (283) (29.7%) (398) (37.3%)Of which: urban land 318,548 396,127 417,446 (98,898) (23.7%) (77,579) (19.6%)Of which: developable land 2,311 2,793 2,241 70 3.1% (481) (17.2%)Of which: warehouses and premises 146,403 170,977 183,120 (36,717) (20.1%) (24,575) (14.4%)
Other 13,802 5,618 4,841 8,961 185.1% 8,184 145.7%
Coverage (%) 57.29% 49.98% 47.93% 9.36 7.31 Residential properties 48.80% 41.73% 39.82% 8.98 7.07
Of which: under construction 55.85% 52.80% 50.98% 4.87 3.05 Commercial properties 64.75% 57.27% 55.35% 9.41 7.48
Of which: countryside land 63.30% 54.29% 59.47% 3.83 9.01 Of which: under construction 56.56% 55.75% 56.03% 0.53 0.81 Of which: urban land 68.89% 61.77% 59.34% 9.55 7.13 Of which: developable land 76.84% 72.00% 77.34% (0.50) 4.85 Of which: warehouses and premises 50.16% 41.23% 40.50% 9.66 8.93
Other 39.79% 36.65% 43.05% (3.26) 3.14
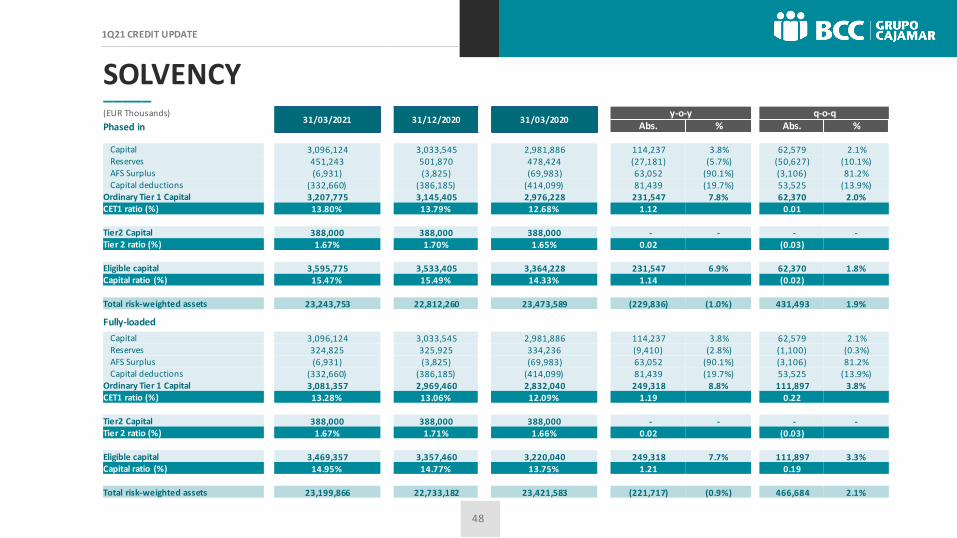
SOLVENCY_____(EUR Thousands)
31/03/2021 31/12/2020 31/03/2020y-o-y q-o-q
Phased in Abs. % Abs. %
Capital 3,096,124 3,033,545 2,981,886 114,237 3.8% 62,579 2.1%Reserves 451,243 501,870 478,424 (27,181) (5.7%) (50,627) (10.1%)AFS Surplus (6,931) (3,825) (69,983) 63,052 (90.1%) (3,106) 81.2%Capital deductions (332,660) (386,185) (414,099) 81,439 (19.7%) 53,525 (13.9%)
Ordinary Tier 1 Capital 3,207,775 3,145,405 2,976,228 231,547 7.8% 62,370 2.0%CET1 ratio (%) 13.80% 13.79% 12.68% 1.12 0.01
Tier2 Capital 388,000 388,000 388,000 - - - -Tier 2 ratio (%) 1.67% 1.70% 1.65% 0.02 (0.03)
Eligible capital 3,595,775 3,533,405 3,364,228 231,547 6.9% 62,370 1.8%Capital ratio (%) 15.47% 15.49% 14.33% 1.14 (0.02)
Total risk-weighted assets 23,243,753 22,812,260 23,473,589 (229,836) (1.0%) 431,493 1.9%
Fully-loaded
Capital 3,096,124 3,033,545 2,981,886 114,237 3.8% 62,579 2.1%Reserves 324,825 325,925 334,236 (9,410) (2.8%) (1,100) (0.3%)AFS Surplus (6,931) (3,825) (69,983) 63,052 (90.1%) (3,106) 81.2%Capital deductions (332,660) (386,185) (414,099) 81,439 (19.7%) 53,525 (13.9%)
Ordinary Tier 1 Capital 3,081,357 2,969,460 2,832,040 249,318 8.8% 111,897 3.8%CET1 ratio (%) 13.28% 13.06% 12.09% 1.19 0.22
Tier2 Capital 388,000 388,000 388,000 - - - -Tier 2 ratio (%) 1.67% 1.71% 1.66% 0.02 (0.03)
Eligible capital 3,469,357 3,357,460 3,220,040 249,318 7.7% 111,897 3.3%Capital ratio (%) 14.95% 14.77% 13.75% 1.21 0.19
Total risk-weighted assets 23,199,866 22,733,182 23,421,583 (221,717) (0.9%) 466,684 2.1%
DISCLAIMER_____This presentation (the "Presentation") has beenprepared andis issuedby, and is the sole responsibility of GrupoCooperativoCajamar.
The information containedin the Presentation has not been independently verifiedand some of the information is in summary form. No representation or warranty, express or implied, is made by Banco de Crédito Cooperativo (BCC) or any of itsaffiliates(Grupo Cooperativo Cajamar), nor by their directors, officers, employees, representatives or agents asto, and noreliance shouldbe placed on, the fairness, accuracy, completeness or correctness ofthe informationor opinions expressed herein. None of BCCnor any of itsaffiliates, nor their respective directors, officers, employees, representatives or agents shall have any liability whatsoever (innegligence or otherwise) for any direct or consequential loss, damages, costs or prejudices whatsoever arising fromthe use of the Presentation or its contents or otherwise arising in connectionwiththe Presentation, save with respect to any liability for fraud, and expressly disclaimany and all liability whether direct or indirect, express or implied, contractual, tortious,statutory or otherwise, inconnection with the accuracy or completenessof the information or for any of the opinions contained hereinor for any errors, omissions or misstatements contained inthe Presentation.
Banco de Crédito Cooperativo cautions that this Presentation may contain forward looking statements withrespect macroeconomicperspectives and financial Sector. While these forwardlooking statements represent Grupo Cooperativo Cajamar judgmentand future expectations, nevertheless a certainnumber of risks, uncertaintiesandother important factors couldcause actual developments and results to differ materially fromthe expectations.
The information contained inthe Presentation, including but not limitedto forward-looking statements, isprovidedas ofthe date hereof and is not intendedtogive any assurances asto future results. Noperson is under any obligationto update, complete,revise or keep current the information contained inthe Presentation,whether asa result of new information, future events or results or otherwise. The information contained in the Presentation may be subject to change without notice and must not berelied upon for any purpose.
This Presentation contains financial information derived from Grupo Cooperativo Cajamar unaudited financial statements for the first to last quarters of 2018, 2019 2020 and 1st quarter 2021. None of this financial information has been audited by theexternal auditors. Financial information ispresentedaccording to GAAP aswell as internal GrupoCooperativoCajamar criteria as a result ofwhicheach division reflects the true nature of its business. These criteria do not follow any particular regulationandcan include forecasts and subjective valuations which couldrepresent substantial differences should a different methodology be applied.
In addition to the financial information prepared in accordance withthe International Financial Reporting Standards (IFRS), this document includes certainAlternative Performance Measures (APMs) as defined in the guidelines on Alternative PerformanceMeasures issued by the EuropeanSecurities andMarkets Authority on 5 October 2015 (ESMA/2015/1415es) (the "ESMA guidelines”). This report uses certain APMs, whichare performancemeasures that have been calculatedusing the financial informationfrom Grupo Cooperativo Cajamar but that are not defined or detailed in the applicable financial framework and therefore have neither been audited nor are capable of being completely audited. These APMs are been used to allow for a betterunderstanding of the company's financial performance but should be considered only asadditional disclosures andin no case asa replacement of the financial information prepared under IFRS. Moreover, the way the Group defines and calculatesthesemeasuresmay differ to the way these are calculated by other companies, and therefore they may not be comparable. Please refer tothe file called “APMsglossary” (https://www.bcc.es/en/informacion-para-inversores/informacion-financiera/) for furtherdetails of the APMs used, including its definitionor a reconciliation between any applicable management indicators and the financial data presented in the consolidated financial statements preparedunder IFRS.
Market and competitive positiondata in the Presentation has generally been obtained fromindustry publications and surveys or studies conductedby third-party sources. Peer firminformationpresented hereinhas beentaken frompeer firmpublicreports,thoughwe do not call any ofthem by its name. There are limitations with respect tothe availability, accuracy, completeness andcomparability of suchdata. Grupo Cooperativo Cajamar has not independently verified such data and can provide noassuranceof its accuracy or completeness. Certain statements inthe Presentation regarding the market and competitive position data are based onthe internal analyses ofthe Group, which involve certain assumptions andestimates. These internal analyses have notbeen verified by any independent source andthere can be no assurance that the assumptions or estimates are accurate. Accordingly, undue reliance should not be placed onany of the industry, market or Grupo Cooperativo Cajamar competitive positiondata contained in the Presentation.
The distribution of this Presentation in certain jurisdictionsmay be restricted by law. Recipients of this Presentation should informthemselves about and observe such restrictions. Grupo Cooperativo Cajamar disclaims any liability for the distributionof thisPresentation by any of its recipients. Grupo Cooperativo Cajamar can not be heldresponsible for the use, valuations, opinions, expectations or decisions which might be adopted by third parties following the publicationof this Presentation. This Presentationdoes not constitute or form part of, and should not be construedas, (i) anoffer, solicitation or invitation to subscribe for, sell or issue, underwrite or otherwiseacquire any securities, nor shall it, or the fact ofits communication, formthe basis of, or be reliedupon in connection with, or act as any inducement to enter into any contract or commitment whatsoever withrespect to any securities; or (ii) any formof financial opinion, recommendation or investment advice withrespect to any securities.
By receiving or accessing tothisPresentation you accept and agree to be bound by the foregoing terms, conditions and restrictions.

THANK YOU_____________________