Embed Size (px)
Citation preview
1Cooper Human Systems
CREDIT CARD MARKET SIMULATION: QUANTIFYING THE IMPACT OF CHANGE LEADS TO DRAMATIC STRATEGIC INNOVATIONTuesday, November 19, 2013
Presented by:
David Starr, Cooper Human Systems
Sharon Els, PA Consulting Group
Hosted by:
Steve Adler, IBM & Karim Chichakly, isee systems
Cooper Human Systems
2Cooper Human Systems
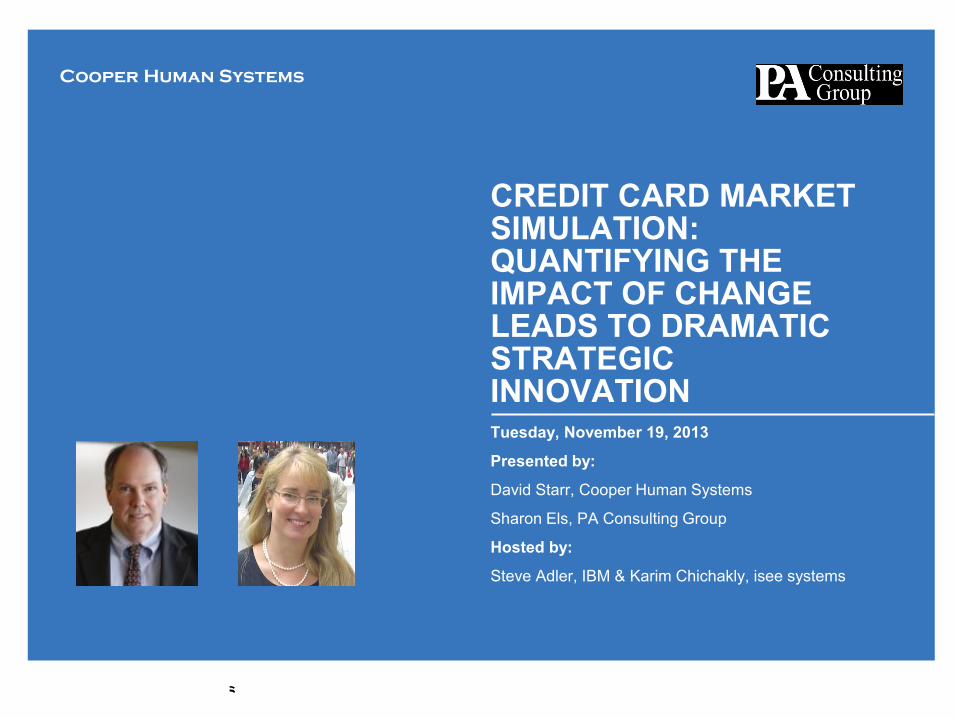
• Share erosion persisted for 6
years despite numerous
attempts to diagnose and solve
the problem
• Conventional wisdom wasn’t
working: “I’ve been doing this
for 20 years and I know this
business”
• Initiatives taken in one part of
organization were being
thwarting by other parts of the
organization
• The Fear: A “Death Spiral”
would ensue if they lost too
much market share -- putting the
organization out of business
The Problem: The client was losing market share despite many attempts to turn it around…
US Market Share
Ma
rke
t S
ha
re (
%)
Client Market Share Trend
Conflicting actions by different parts of organization
Economy
Disagreement about what to do
Fierce competition
History of failed turnarounds
MemberBanks
Regulation
Customers/Card Holders
Suppliers
Merchants
3Cooper Human SystemsCooper Human Systems
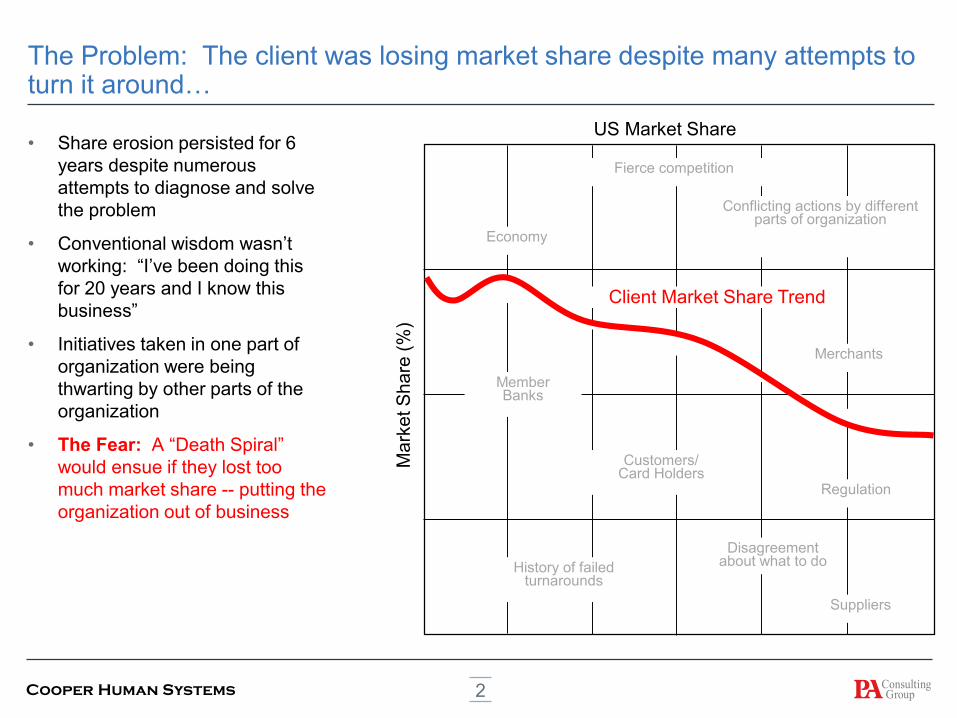
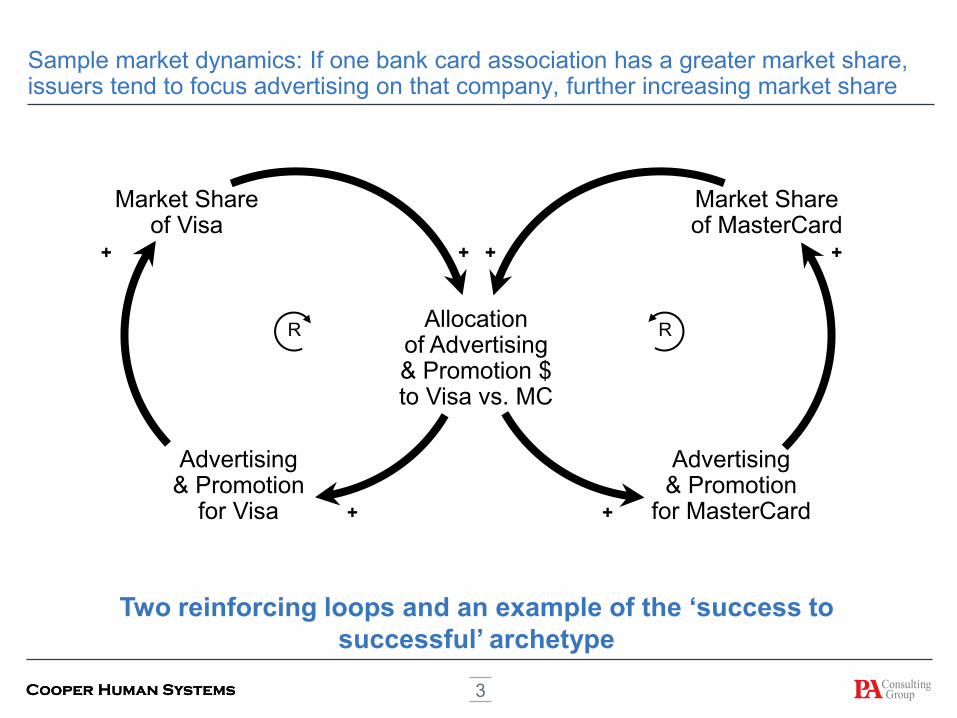
Sample market dynamics: If one bank card association has a greater market share, issuers tend to focus advertising on that company, further increasing market share
Allocationof Advertising& Promotion $to Visa vs. MC
Market Shareof MasterCard
Advertising& Promotion
for MasterCard
Advertising& Promotion
for Visa
Market Shareof Visa
Two reinforcing loops and an example of the ‘success to
successful’ archetype
RR
+ +
++
+ +
4Cooper Human SystemsCooper Human Systems
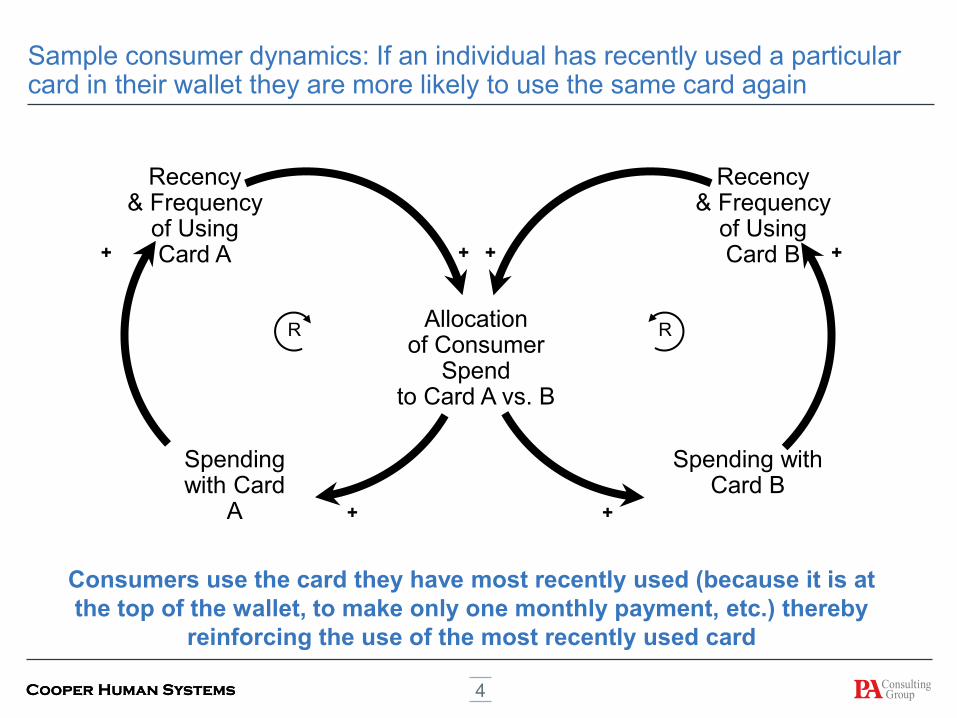
Sample consumer dynamics: If an individual has recently used a particular card in their wallet they are more likely to use the same card again
Allocationof Consumer
Spendto Card A vs. B
Recency& Frequency
of UsingCard B
Spending with Card B
Spending with Card
A
Recency& Frequency
of UsingCard A
Consumers use the card they have most recently used (because it is at
the top of the wallet, to make only one monthly payment, etc.) thereby
reinforcing the use of the most recently used card
RR
+ +
++
+ +
5Cooper Human SystemsCooper Human Systems
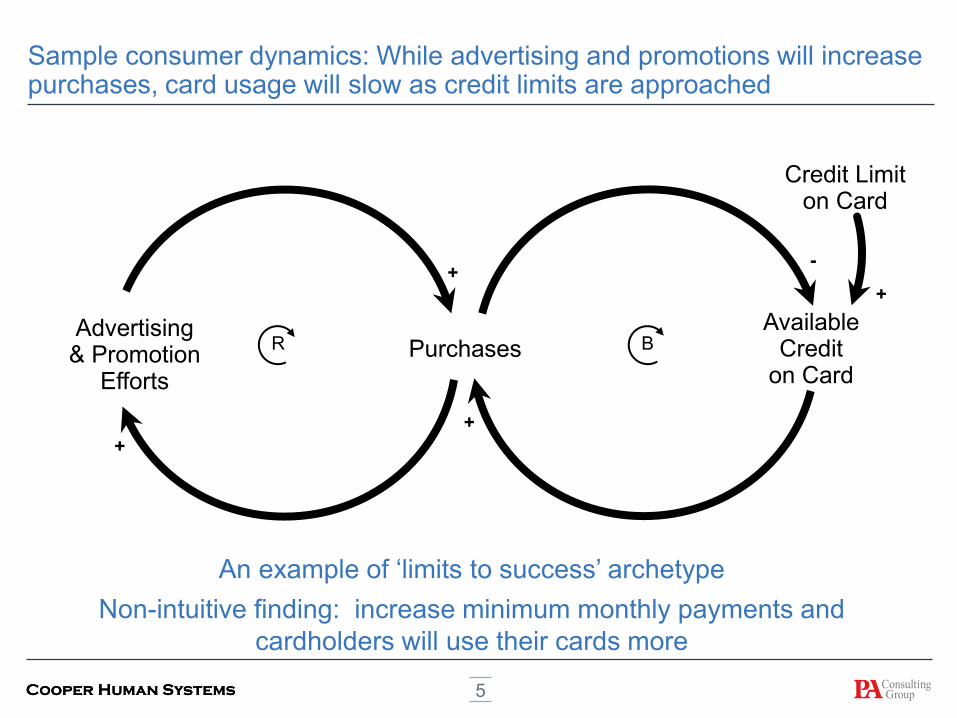
Sample consumer dynamics: While advertising and promotions will increase purchases, card usage will slow as credit limits are approached
PurchasesAvailable
Crediton Card
Credit Limiton Card
Advertising& Promotion
Efforts
An example of ‘limits to success’ archetype
Non-intuitive finding: increase minimum monthly payments and
cardholders will use their cards more
BR
+
+
-
+
+
6Cooper Human SystemsCooper Human Systems
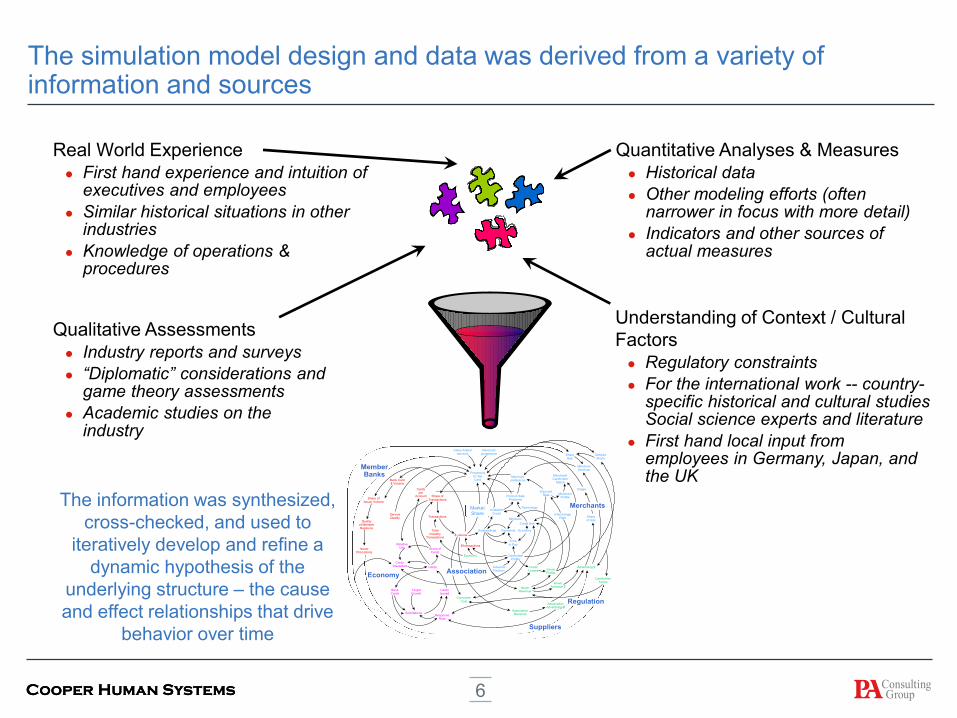
The simulation model design and data was derived from a variety of information and sources
The information was synthesized,
cross-checked, and used to
iteratively develop and refine a
dynamic hypothesis of the
underlying structure – the cause
and effect relationships that drive
behavior over time
Real World Experience
First hand experience and intuition of executives and employees
Similar historical situations in other industries
Knowledge of operations & procedures
Quantitative Analyses & Measures
Historical data
Other modeling efforts (often narrower in focus with more detail)
Indicators and other sources of actual measures
Qualitative Assessments
Industry reports and surveys
“Diplomatic” considerations and game theory assessments
Academic studies on the industry
Understanding of Context / Cultural
Factors
Regulatory constraints
For the international work -- country-specific historical and cultural studies Social science experts and literature
First hand local input from employees in Germany, Japan, and the UK
Outstandings Payments
Transactions
$ volume
Available
Credit
$/transactions
TotalIndustry
Transactions
Economy CardholderProfile
Timeto Pay
Merchantpreference
Propensityto UseCard
MerchantProfile
Technology
Minimum
Credit limit
Economy
Merchant/Cardholder
Match
Share ofCards
CreditLosses
AdvancePosition Issuer
Profits
InterchangeRate
IssuerRevenue
CardsDiscarded
RelativeUse
Cards
CardsIssued
TargetGrowth
BankCards
ResponseRate
AssociationRevenueSolicitations
IssuerAdvance $
Advertising $
CardholderTerms
ShareGap
DesiredShare
MerchantServices
Merchantacceptance
Value-Addedservices
Image
Shareof Ads
Bank Card$ Volume
Share ofIssuer Volume
Qualityof MemberRelations
ServiceQuality
IssuerPromotions
Cardsper
Account Share of
Transactions
Point-of-SaleProblems
DiscountRate
Market
Share
AssociationAdvertising &
Consumer
Cost
Economy
MemberBanks
Regulation
Suppliers
Merchants
Association
7Cooper Human SystemsCooper Human Systems
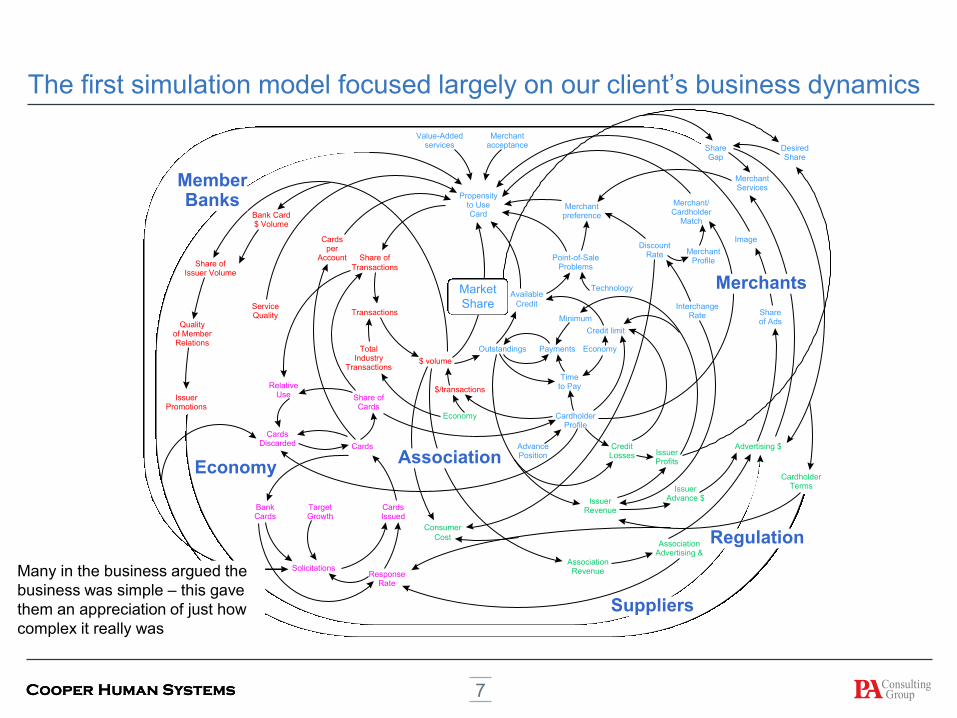
The first simulation model focused largely on our client’s business dynamics
Outstandings Payments
Transactions
$ volume
Available
Credit
$/transactions
TotalIndustry
Transactions
Economy CardholderProfile
Timeto Pay
Merchantpreference
Propensityto UseCard
MerchantProfile
Technology
Minimum
Credit limit
Economy
Merchant/Cardholder
Match
Share ofCards
CreditLosses
AdvancePosition Issuer
Profits
InterchangeRate
IssuerRevenue
CardsDiscarded
RelativeUse
Cards
CardsIssued
TargetGrowth
BankCards
ResponseRate
AssociationRevenueSolicitations
IssuerAdvance $
Advertising $
CardholderTerms
ShareGap
DesiredShare
MerchantServices
Merchantacceptance
Value-Addedservices
Image
Shareof Ads
Bank Card$ Volume
Share ofIssuer Volume
Qualityof MemberRelations
ServiceQuality
IssuerPromotions
Cardsper
Account Share of
Transactions
Point-of-SaleProblems
DiscountRate
Market
Share
AssociationAdvertising &
Consumer
Cost
Economy
MemberBanks
Regulation
Suppliers
Merchants
Association
Many in the business argued the
business was simple – this gave
them an appreciation of just how
complex it really was
8Cooper Human SystemsCooper Human Systems
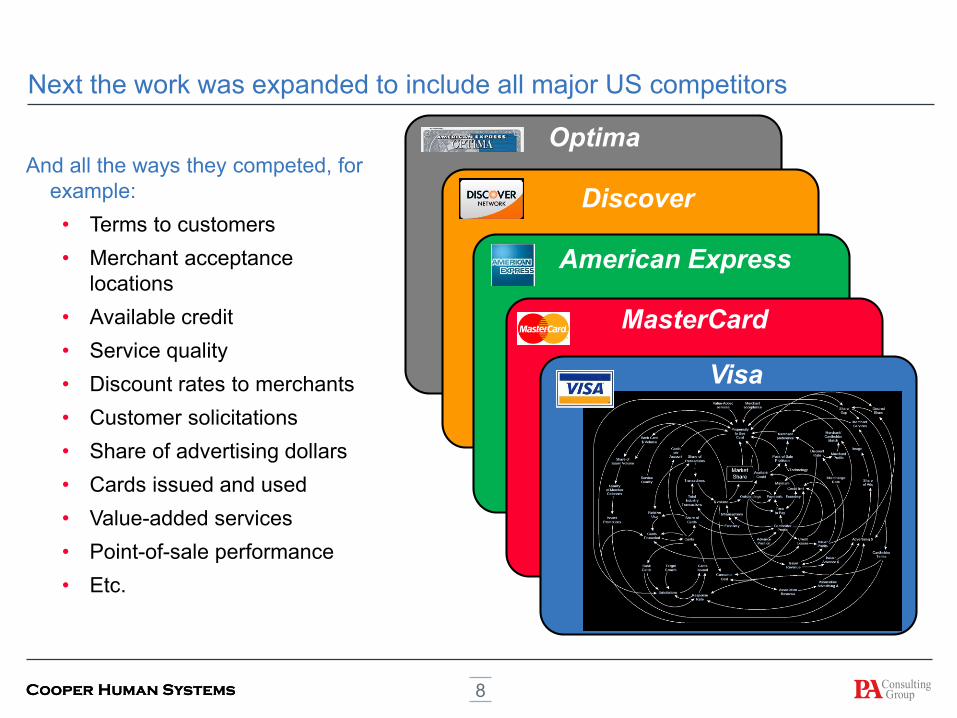
Next the work was expanded to include all major US competitors
And all the ways they competed, for
example:
• Terms to customers
• Merchant acceptance
locations
• Available credit
• Service quality
• Discount rates to merchants
• Customer solicitations
• Share of advertising dollars
• Cards issued and used
• Value-added services
• Point-of-sale performance
• Etc.
MasterCard
American Express
Discover
Optima
Visa
9Cooper Human SystemsCooper Human Systems
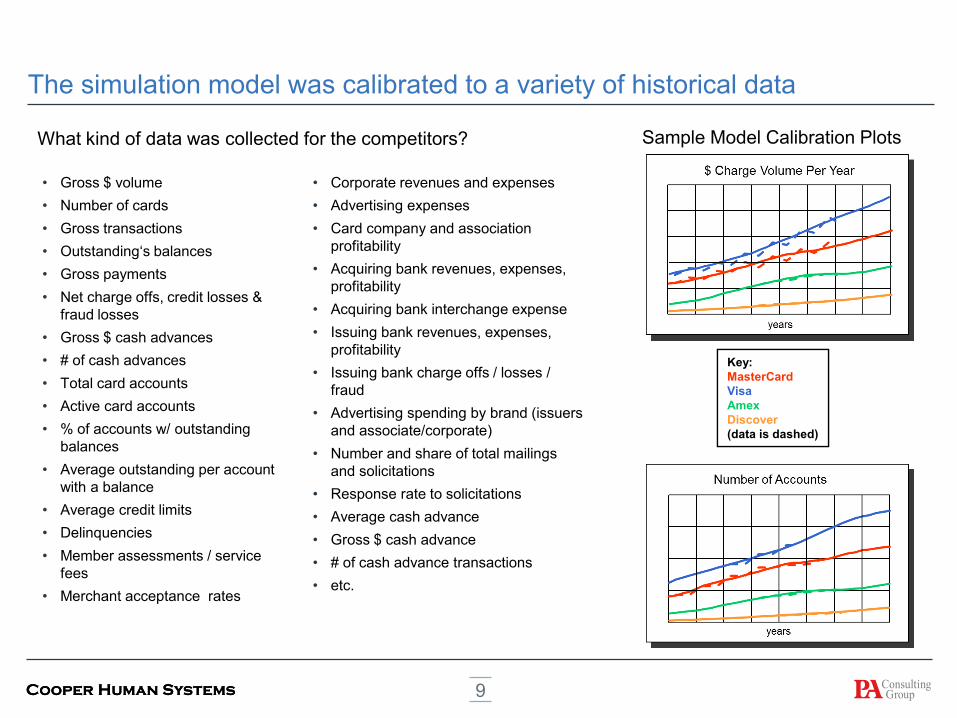
The simulation model was calibrated to a variety of historical data
Key:
MasterCard
Visa
Amex
Discover
(data is dashed)
Key:
MasterCard
Visa
Amex
Discover
(data is dashed)
• Gross $ volume
• Number of cards
• Gross transactions
• Outstanding‘s balances
• Gross payments
• Net charge offs, credit losses &
fraud losses
• Gross $ cash advances
• # of cash advances
• Total card accounts
• Active card accounts
• % of accounts w/ outstanding
balances
• Average outstanding per account
with a balance
• Average credit limits
• Delinquencies
• Member assessments / service
fees
• Merchant acceptance rates
Sample Model Calibration Plots
• Corporate revenues and expenses
• Advertising expenses
• Card company and association
profitability
• Acquiring bank revenues, expenses,
profitability
• Acquiring bank interchange expense
• Issuing bank revenues, expenses,
profitability
• Issuing bank charge offs / losses /
fraud
• Advertising spending by brand (issuers
and associate/corporate)
• Number and share of total mailings
and solicitations
• Response rate to solicitations
• Average cash advance
• Gross $ cash advance
• # of cash advance transactions
• etc.
What kind of data was collected for the competitors?

10Cooper Human Systems
The “Business As Usual” simulation showed that without major intervention our client’s share would continue to fall
US Market Share (all competitors)
Historical share trend
“Business as usual” Simulation
Market Share
Conflicting actions by different parts of organizationEconomy
Disagreement about what to do
Fierce competition
History of failed turnarounds
MemberBanks
Regulation
Customers/Card Holders
Suppliers
Merchants
11Cooper Human SystemsCooper Human Systems
First we tested the initiatives the organization had recently undertaken, or was considering. None of these reversed the loss of share.
We then executed a thorough set of sensitivity
tests, varying most of the parameters in the
model by plus or minus 25%
12Cooper Human SystemsCooper Human Systems
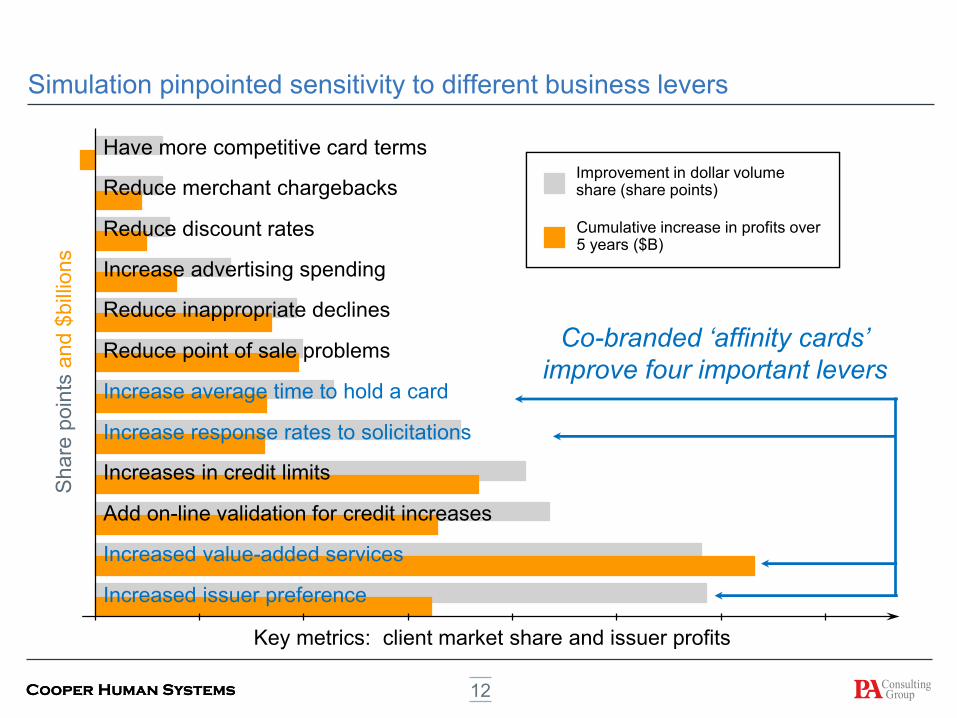
Simulation pinpointed sensitivity to different business levers
Key metrics: client market share and issuer profits
Improvement in dollar volume share (share points)
Cumulative increase in profits over 5 years ($B)
Share
poin
tsa
nd
$bill
ions
Have more competitive card terms
Reduce merchant chargebacks
Reduce discount rates
Increase advertising spending
Reduce inappropriate declines
Reduce point of sale problems
Increase average time to hold a card
Increase response rates to solicitations
Increases in credit limits
Add on-line validation for credit increases
Increased value-added services
Increased issuer preference
Co-branded ‘affinity cards’
improve four important levers
13Cooper Human SystemsCooper Human Systems
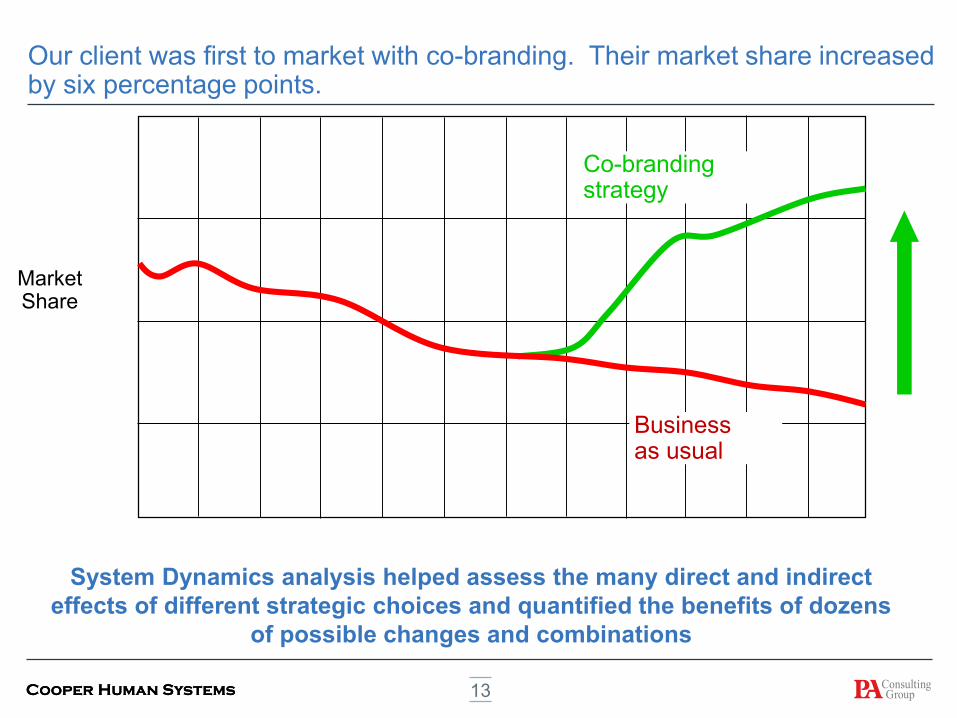
Our client was first to market with co-branding. Their market share increased by six percentage points.
Market Share
Co-brandingstrategy
Businessas usual
System Dynamics analysis helped assess the many direct and indirect
effects of different strategic choices and quantified the benefits of dozens
of possible changes and combinations
14Cooper Human SystemsCooper Human Systems
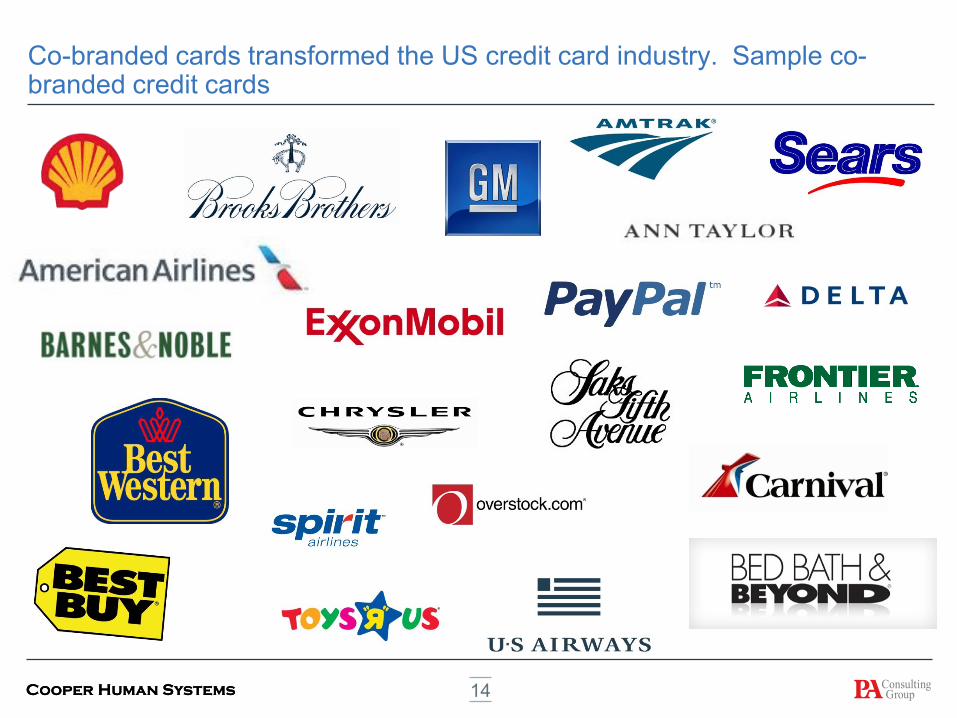
Co-branded cards transformed the US credit card industry. Sample co-branded credit cards
15Cooper Human Systems
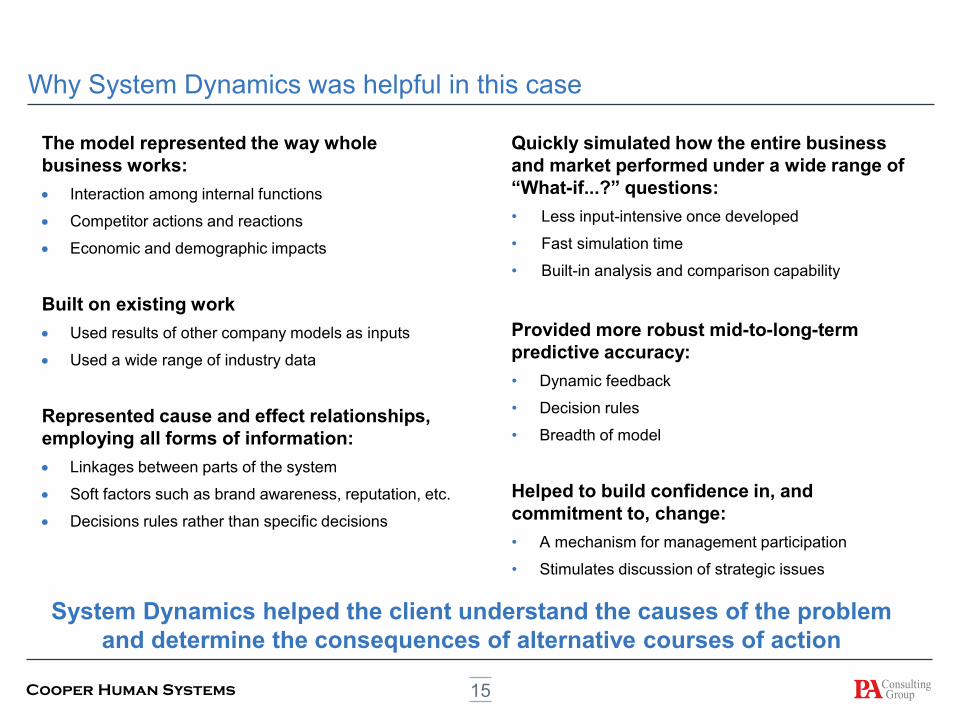
Why System Dynamics was helpful in this case
The model represented the way whole
business works:
Interaction among internal functions
Competitor actions and reactions
Economic and demographic impacts
Built on existing work
Used results of other company models as inputs
Used a wide range of industry data
Represented cause and effect relationships,
employing all forms of information:
Linkages between parts of the system
Soft factors such as brand awareness, reputation, etc.
Decisions rules rather than specific decisions
Quickly simulated how the entire business
and market performed under a wide range of
“What-if...?” questions:
• Less input-intensive once developed
• Fast simulation time
• Built-in analysis and comparison capability
Provided more robust mid-to-long-term
predictive accuracy:
• Dynamic feedback
• Decision rules
• Breadth of model
Helped to build confidence in, and
commitment to, change:
• A mechanism for management participation
• Stimulates discussion of strategic issues
System Dynamics helped the client understand the causes of the problem
and determine the consequences of alternative courses of action
16Cooper Human Systems
APPENDIX
17Cooper Human Systems
David Starr: Dave has been the CIO of three Fortune Five Hundred
companies, advisor to two U.S. Presidents, rated #1 CIO in the country twice,
and is a former member of the Board of Directors of Best Buy Corporation. He
is currently working with Cooper Human Systems using System Dynamics to
build life science models. David has a bachelor in Physics from Florida State,
and has studied at Harvard Business School and Duke University.
Sharon Els: Sharon has specialized in business modelling and simulation for
over twenty years. Her client work has included: assessing emerging strategic
issues and options, optimizing corporate resource allocation, delivering projects
on time and on budget, and resolving large contract disputes and predicting
market changes and evolution. She has consulted to a number of financial,
technology, and defense firms in the U.S. and Europe including Pfizer, 3Com,
Boeing, Raytheon, AT&T, Pepsi, the US Navy and the US Marine Corps.
Sharon holds a bachelor’s degree in Civil Engineering from MIT, and an MBA
from MIT's Sloan School.
Speaker Bios

18Cooper Human SystemsCooper Human Systems
JapanJapan
Stage 3:
Analyzing Strategies in Different
Countries (e.g., UK, Germany, Japan)
GermanyGermany
Later the work was expand to evaluate international markets
UKUK
Outstandings Payments
Transactions
$ volume
Available
Credit
$/transactions
TotalIndustry
Transactions
Economy CardholderProfile
Timeto Pay
Merchantpreference
Propensityto UseCard
MerchantProfile
Technology
Minimum
Credit limit
Economy
Merchant/Cardholder
Match
Share ofCards
CreditLosses
AdvancePosition Issuer
Profits
InterchangeRate
IssuerRevenue
CardsDiscarded
RelativeUse
Cards
CardsIssued
TargetGrowth
BankCards
ResponseRate
AssociationRevenueSolicitations
IssuerAdvance $
Advertising $
CardholderTerms
ShareGap
DesiredShare
MerchantServices
Merchantacceptance
Value-Addedservices
Image
Shareof Ads
Bank Card$ Volume
Share ofIssuer Volume
Qualityof MemberRelations
ServiceQuality
IssuerPromotions
Cardsper
Account Share of
Transactions
Point-of-SaleProblems
DiscountRate
Market
Share
AssociationAdvertising &
Consumer
Cost
Economy
MemberBanks
Regulation
Suppliers
Merchants
Association
Macro-Economy Debit
Stage 1:
Understanding Key
Client Dynamics
Stage 2:
Analyzing US Market Strategy
Options
Client Executive: “We are
often investing in initiatives
that are thwarted by other
actions the organization is
pursuing”Client Executives: “How can
we better compete in this
market place?” Client Executives: “What should we be doing
differently overseas?”