Embed Size (px)
Citation preview
DEA RESEARCH DISCUSSION PAPER Number 48 June 2002
______________________________________________________________________________
Crafty women: The livelihood impact of craft income in Caprivi
Helen Suich and Carol Murphy
______________________________________________________________________________
Directorate of Environmental Affairs, Ministry of Environment and Tourism,
Private Bag 13306, Windhoek, Namibia Tel: + 264 (0)61 249 015 Fax: + 264 (0)61 240 339
email: [email protected] http://www.dea.met.gov.na
Wildlife Integration for Livelihood Diversification (WILD) Project, Directorate of Environmental Affairs,
Ministry of Environment and Tourism, Private Bag 13306, Windhoek, Namibia
Tel: + 264 (0)61 249 015 Fax: + 264 (0)61 240 339 email: [email protected]
This series of Research Discussion Papers is intended to present preliminary, new or topical information and ideas for discussion and debate. The contents are not necessarily the final views or firm positions of the Ministry of Environment and Tourism. Comments and feedback will be welcomed.
Contact details: Helen Suich, Resource Economist, Directorate of Environmental Affairs, Ministry of Environment and Tourism,
Private Bag 13306, Windhoek, NAMIBIA. Tel: +264-61-249 015; Fax: +264-61-240 339; email: [email protected]
Carol Murphy , Senior Field Researcher, WILD Project, Directorate of Environmental Affairs, Ministry of Environment and Tourism, PO Box 1551, Ngweze, NAMIBIA. Tel: +264-66-252 705; email: [email protected]
Edited by Directorate of Environmental Affairs Cover illustration by Helga Hoveka Research for this paper was conducted under the auspices of the Wildlife Integration for Livelihood Diversification (WILD) Project, funded by the UK Department for International Development (DFID).
1
Table of Contents Acronyms 2 Acknowledgements 2 EXECUTIVE SUMMARY 3 1. INTRODUCTION 5 2. CRAFT IN CAPRIVI 5
2.1 Basket weaving 5 2.2 Wood carving 6 2.3 Clay pottery 6 2.4 Commercialisation of the craft industry 6
3. CRAFT AND LIVELIHOODS 7 3.1 Sustainable livelihoods approach 7 3.2 Socio-economic status of crafters in Caprivi 8 3.3 Natural resource management 8 3.4 Craft and the conservancies 9
4. ANALYSIS OF CRAFT SALES 9 4.1 Grading 13 4.2 Implications of use of natural resources for basket production 14
5. CASE STUDIES 15 5.1 Case-study sites 15 5.2 Case-study individuals 16 5.3 Comparisons between groups and sites 16 5.4 When do women weave? 18 5.5 Difficulties with basket production and selling 18 5.6 Sources of income from weaving and other livelihood activities 19 5.7 Women’s control of income from basket sales 21 5.8 Expenditure distributions 22 5.9 Alternatives to basket production 24 5.10 Impacts of basket income 25
6. CONCLUSIONS 25 REFERENCES 28 APPENDIX 1. GRADING OF WOVEN BASKETS 29 APPENDIX 2. CASE STUDY INTERVIEW DETAILS 30 APPENDIX 3. SALES DETAILS OF CASE STUDY INDIVIDUALS 31
Tables and Figures Table 1 Craft sales start date and type of craft for each village 7 Table 2 Sales details by year 10 Table 3 Number and value of sales by year by village 11 Table 4 The nature of income for all crafters, by year 12 Table 5 Nature of income by categories, 2001 13 Table 6 Number of baskets by grade by year 13 Table 7 Dyes used in basket weaving 14 Table 8 Overall important rating of main utilised plants 15 Table 9 Basket sales and income by group by village 17 Table 10 Sources of cash (all case studies) 20 Table 11 Expenditure distributions 23 Figure 1 Proportion of crafters by number of sales p.a. 10 Figure 2 Value of sales by village by year 11 Figure 3 Crafters by income category 12
2
Figure 4 Basket grades by year 14 Figure 5 Sources of cash, median earners 21 Figure 6 Sources of cash, top earners 21 Figure 7 Average expenditure distribution, median earners 23 Figure 8 Average expenditure distribution, top earners 24 Acronyms CACA Caprivi Arts and Crafts Association CBNRM community based natural resource management CRMs community resource monitors CWM community wildlife management hhs households IRDNC Integrated Rural Development and Nature Conservation NGO non government organisation RF Rössing Foundation Acknowledgements We would like to thank all those who assisted with the research and analysis for this paper. Alice Jarvis and Ndeu Haimbodi who both helped to set up the database; all the baskets producers who gave up their time to participate in the research, especially the 24 women interviewed from Muyako Village and the five producer groups in Masokotwane. Patricia Nchino (Community Resource Monitor, Salambala Conservancy), Mary Mukutela (Community Resource Monitor, Mayuni Conservancy), Dorothy Muluti (Masokotwane) and Judith Simata (Extension Officer, Directorate of Community Development, Ministry of Women Affairs and Child Welfare, Bukalo) all assisted with translation. We would also like to thank Charlie Paxton, Karin le Roux, Annie Simmons, Connie Botma, Margie Jacobsohn, Candy Milton, Abigail Amos, Andrew Long and Jon Barnes for their ideas and comments.

3
EXECUTIVE SUMMARY This paper analyses the Rössing Foundation craft purchase data paid out to individual crafters in Caprivi between June 1998 and the end of 2001 and reviews the livelihood impact of this money. The total sales figure for these dates amounted to just over $N200,000. The vast majority of craft producers are women who weave baskets, though the small number of male wood carvers that sell their products to Rössing Foundation are the highest income earning crafters compared to these weavers and a small number of female potters. Although there are a large number of individuals selling to the Rössing Foundation, there are a relatively small number of consistently high producers (in volume and quality). High earners consistently make a large share of the top grades. In contrast the median earners consistently produce the bulk of their baskets in the C-grade (only in 2000, did they manage to move the bulk of production up to B-grade, but it returned to C-grade in 2001). Eighty percent of the weavers that sold their baskets during this time earned less than $N500. In 1998 and 1999 no crafters earned over $N1,000. Of the ten crafters earning over $N1,000 in 2001, only four were weavers (their incomes ranging between $N1,050 and $N1,418), one was a potter ($N1,195) and the remaining five were woodcarvers earning between $N3,290 and $N8,314. Despite the relatively small amounts earned by most weavers, the monetary income from cash sales of baskets is an important source of income for these rural women who are generally from poor households. Through the paid and unpaid work they do in the home and the community, these women play a key role in poverty alleviation. Making and selling baskets for women in Caprivi is only one income-generating activity that makes up their diverse livelihoods. The three most important sources of cash income for all the twenty four women interviewed are basket sales, sales of maize and of thatching grass. All the median group earned cash from a range of three or four activities, with basket selling was the major contributor (providing an average yearly contribution of 37 per cent). For the high cash earners basket sales are also the most important source of cash income (providing an average yearly cash contribution of 51 per cent of total household cash income). Most women keep control of their earnings from basket sales and decided alone how it is spent. Some women make joint decisions with their husbands, and only two women lost control of their earning to their husbands. Basket sales income alleviates poverty by enabling women to better cope with the most vulnerable aspect of their lives and that for their families – food security. On average, the main item purchased with their earnings is food (mostly mealie meal and ‘relish’). Following food, the next most important expenditure item is school costs for their children or grandchildren (school fees, uniforms and for those with high school-aged children, hostel costs). Other important expenditure items include clinic/hospital fees, domestic consumables, as well as hiring oxen or tractors for ploughing fields. Use of the craft income to meet basic needs has a highly desirable impact on household security and development generally, and by spending their income locally, this positive impact is enhanced. The extent and conservation status of palm forests in Caprivi is not known. The Community Resource Monitors from the Caprivian conservancies believe that palm resources are limited and declining. Women from both case-study areas reported having to walk long distances to collect palm. The collective management of the natural resources required for this plant based craft industry includes mainly awareness and enforcement of sustainable harvesting of palm leaves and material from dye plants. This has the potential to contribute to the conservation of these natural resources. This was not a specific research focus for this paper but anecdotal experience of the
4
authors shows that palm has increased in value for some people with its use for craft that is sold to the Rössing Foundation. Community organisation currently focuses on craft quality, but as donor and non government organisation support is reduced over time, the development and organisation of central buying locations for craft will have to improve. The regular nature of Rössing Foundation buying trips in Caprivi over the last five years has created a dependency of the weavers on income earned from craft sales. With the reduction in donor support to cover the costs of craft buying trips, a strategy for the continued success of the craft development programme must be developed to ensure that this source of income for crafters is not under threat. Although no figures are available at present, the transaction costs for the Rössing Foundation Craft Development Programme are thought to be much lower than those of other components of the Namibian Community Based Natural Resource Management Programme while benefits to individuals are arguably much higher. Further donor support for craft development is warranted, especially in the current transition stage to ensure sustainable marketing and producer operations.
5
1. INTRODUCTION Over the past 15–20 years, the traditional practices of some craft making in Caprivi have become increasingly commercialised. This has been largely the result of the increased involvement of various organisations in craft development – particularly non government organisations (NGOs) with the assistance of donor funding. Those organisations most involved in craft development and marketing in Caprivi have been the Caprivi Arts and Crafts Association (CACA), the National Art Gallery as well as Integrated Rural Development and Nature Conservation (IRDNC) and the Rössing Foundation (RF). The RF and IRDNC have been involved in several regions of Namibia as part of the Community Based Natural Resource Management (CBNRM) programme, and they have been the largest buyers and marketers of craft in the Caprivi region in recent years. The most important crafts in this commercialisation have been woven products (particularly open palm baskets, but also other woven items and grass and reed mats), wood carvings and clay pots. The majority of the craft makers in the region live in rural areas, and while wood carving appears to be the domain of men, weaving and pottery is carried out almost exclusively by women. This paper focuses on the craft development and marketing programme of RF, a later study will focus on that of IRDNC and make comparisons between the two. The next section examines the history of craft development programmes in Caprivi and is followed by a brief analysis of the potential importance of craft production to rural livelihoods. Section four analyses the sales of craft to RF over recent years, and is followed by the results of several case studies undertaken to determine the livelihood impacts of this income to the households of female basket weavers. Finally, conclusions are drawn and recommendations made. 2. CRAFT IN CAPRIVI As mentioned above, the most common commercial forms of craft making in Caprivi are basket making, woodcarving and clay pottery. 2.1 Basket weaving Almost all of the basketry produced in Namibia is found in Caprivi, Kavango and the four regions of former Owamboland, and to a lesser extent in the Kunene Region (Terry et al, 1994). These baskets have been traditional made by women for use in harvesting and storing grain, winnowing and collecting and transporting food and possessions. In Caprivi, open palm baskets are woven from the young, closed leaves of the indigenous makalani palm (Hyphaene petersiana). Once the leaves at the centre of the palm trees are have been harvested, they are split and left in the sun to dry. The weaving process can take anything from a few days to a month depending on size, quality and design. Designs are woven into the coils of the baskets using palm coloured with traditional plant dyes. Dye materials are collected from a wide variety of local, indigenous plants. A common tree used is the Berchemia discolor (Bird plum or muzinzila) whose bark produces a brown colour. The plant material is crushed then boiled in water with the dried young palm leaves. A variety of other woven products are also produced, including place mats, key rings, woven bags, grass and reed mats.
6
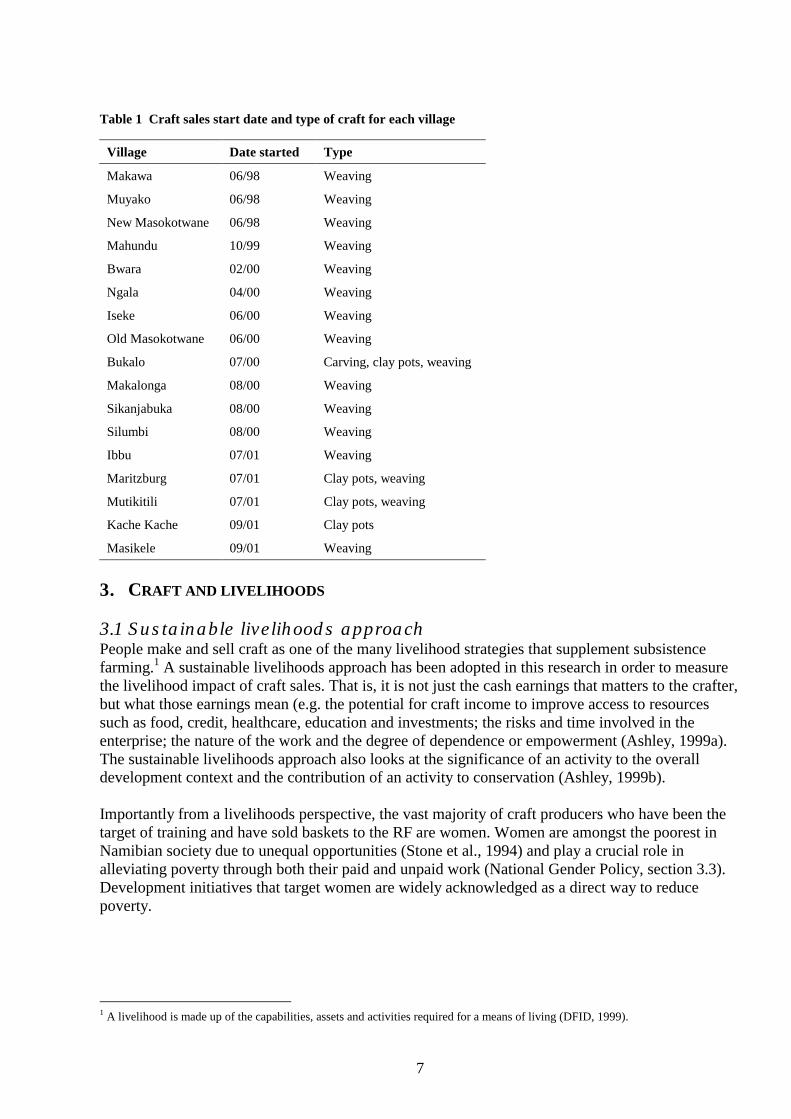
2.2 Wood carving Commercial wood carving in East Caprivi is apparently a relatively recent activity that has been inspired by contact with neighbouring Zambia (G. Mutwa, pers. comm.).One of the main centres of commercial wood carving in Caprivi is focused around the work of the Shambwe family and their apprentices at the Bukalo Open Air Museum. The latter functions as a workshop and sales outlet and the wood carvings are made from a variety of local hardwoods. Those sold to RF to order on a quarterly basis are usually walking sticks with bone inlays, paper knives, forks and spoons with animal designs on the handles. 2.3 Clay pottery Producing fired pots from local river clay is a traditional practice of the Subia women in Caprivi. They mould their pots from lumps of clay and build the walls by adding clay rolls. The sides are smoothed using a river pebble or mussel shell. Ioma village within the Salambala Conservancy is a focal point for pottery in north eastern Namibia and the Ioma pots are considered the finest examples of traditional pots in Namibia (Terry et al., 1994). 2.4 Commercialisation of the craft industry Commercial interest in these crafts and their marketing in Caprivi appears to have begun when the CACA opened in Katima Mulilo in the 1980s. Terry et al., (1994) estimated that at this time there were only 70 basket makers in Caprivi (50 in East Caprivi and 20 in West Caprivi). In the 1990s, the Namibian Art Gallery and the RF worked with the CACA to provide further support for craft development. IRDNC works with crafters mainly from western East Caprivi, near Kongola, and in West Caprivi. A second research paper is intended to focus on the Mashi Craft Market and compare the research findings presented in this paper. The RF has been the lead NGO in the craft development component of the Namibian CBNRM programme. RF works with other NGOs (including IRDNC) to implement the programme, which is largely donor funded – the majority of donor funding coming from the WWF–Living in a Finite Environment programme in Namibia. RF has been involved in craft development in Caprivi since the early 1990s when it started to purchase craft from CACA. The first training of Caprivian basket weavers by RF occurred in 1992, and shortly after this, two villages – Muyako and Masokotwane – were targeted for further training. Around this time, RF also started to buy craft directly from producers. In 1998 the first basket competitions and exhibitions of craft from producers trained by RF staff were held and the number of producers selling to RF has increased as quality has improved. Craft is purchased from individual craft makers and is then transported to Windhoek where most is sold by Mud Hut Trading in the Namibian Craft Centre. (Mud Hut Trading is a fair trade craft business managed by RF, and is a member of the International Federation for Alternative Trade.) A small amount of craft is also exported to outlets in South Africa and elsewhere. RFs buying trips occur approximately every quarter. Initially, only weavers from three villages were involved, but over time this has expanded to weavers, potters and woodcarvers in 16 villages (see Table 1). (The information analysed in this paper is that between June 1998 and the end of 2001.) Buying trips by RF in Caprivi continued following the failed attempt to secede in August 1999. This has been important because the number of tourists in the region fell dramatically, reducing local sales. Given the limited alternatives for earning cash income, this continuation was particularly important following the collapse of the thatching grass industry due to the difficulty associated with ensuring secure transport through West Caprivi at this time and the prohibitive cost of any other route.
7
Table 1 Craft sales start date and type of craft for each village
Village Date started Type
Makawa 06/98 Weaving
Muyako 06/98 Weaving
New Masokotwane 06/98 Weaving
Mahundu 10/99 Weaving
Bwara 02/00 Weaving
Ngala 04/00 Weaving
Iseke 06/00 Weaving
Old Masokotwane 06/00 Weaving
Bukalo 07/00 Carving, clay pots, weaving
Makalonga 08/00 Weaving
Sikanjabuka 08/00 Weaving
Silumbi 08/00 Weaving
Ibbu 07/01 Weaving
Maritzburg 07/01 Clay pots, weaving
Mutikitili 07/01 Clay pots, weaving
Kache Kache 09/01 Clay pots
Masikele 09/01 Weaving
3. CRAFT AND LIVELIHOODS 3.1 Sustainable livelihoods approach People make and sell craft as one of the many livelihood strategies that supplement subsistence farming.1 A sustainable livelihoods approach has been adopted in this research in order to measure the livelihood impact of craft sales. That is, it is not just the cash earnings that matters to the crafter, but what those earnings mean (e.g. the potential for craft income to improve access to resources such as food, credit, healthcare, education and investments; the risks and time involved in the enterprise; the nature of the work and the degree of dependence or empowerment (Ashley, 1999a). The sustainable livelihoods approach also looks at the significance of an activity to the overall development context and the contribution of an activity to conservation (Ashley, 1999b). Importantly from a livelihoods perspective, the vast majority of craft producers who have been the target of training and have sold baskets to the RF are women. Women are amongst the poorest in Namibian society due to unequal opportunities (Stone et al., 1994) and play a crucial role in alleviating poverty through both their paid and unpaid work (National Gender Policy, section 3.3). Development initiatives that target women are widely acknowledged as a direct way to reduce poverty.
1 A livelihood is made up of the capabilities, assets and activities required for a means of living (DFID, 1999).
8
3.2 Socio-economic status of crafters in Caprivi An indication of the wealth status of craft producers was shown by a wealth ranking exercise carried out by six weavers in Muyako village. These women documented the wealth status of 77 households (hhs) according to locally generated indices (predominantly based on whether the hh owned cattle, and how many they owned). The hhs were split in to three groups – rich, middle and poor. Out of the 77 hhs, 28 hhs had members making and selling baskets. These women fell into all three wealth groups. However, only two of these hhs (eight per cent) were in the richest group, with a nearly even spilt between the middle group (50 per cent) and the poor group (43 per cent). When asked about basket income contributing to movement between wealth groups, the women feared that they would drop a group if RF did not continue to buy craft. Confirmation that crafters in Caprivi come from less secure households is provided by the limited livestock holdings of the 24 women interviewed. Over a third of the women interviewed came from households that did not own any cattle. Of those that came from cattle-owning households, most owned only two or three cattle. 3.3 Natural resource management Common property natural resources are often amongst the only resources easily accessible to poor households. Environmental degradation of the natural resource base used by poor households can lead to a downward spiral of poverty. In this context, the sustainable use of the natural resources required for crafting is important to ensure a continuous supply of raw material. The sustainable use of palm and dye plants is the focus of community based natural resource management in the context of basket production. Women at both study sites have been taught to harvest palm in the least damaging manner, i.e. to use a sharp knife, to only cut the bottom of the new palm frond and to leave some new leaves behind. This technique is very important as the palm population can be rapidly eradicated by cutting palm hearts (Hines and Cunningham, 1992 in Terry et al., 1994). Weavers have also been taught not to damage plants when harvesting dye material e.g. to cut small strips of bark from different places on the tree trunk. In conservancy areas, women selected by their communities to be Community Resource Monitors provide training and monitoring in these sustainable harvesting techniques. RF has helped to establish palm gardens in Muyako, Old Masokotwane and New Masokotwane and IRDNC has also worked to establish several gardens in Salambala conservancy – at Iseke, Bukalo and Ikumwe The producer groups in both study sites manage palm gardens – fenced areas where palm trees have been planted. It is intended that these trees will be harvested when they large enough to bear fronds suitable for weaving purposes. Monitoring of regularly harvest palm plants has shown that palm responds well to ‘pruning’. Harvesting correctly actually improves growth for basketry (the plant produces soft, flexible fronds and stays in a stunted growth form accessible for harvesting, instead of growing into a tall tree). Germination rates of planted palm have been high (60–100 per cent), however the palm plants are specific in their habitat requirements, and plant mortality or slow growth are common in plants where rainfall and soil are not suitable (C. Paxton, pers. comm.). The five producer groups in Masokotwane are required to pay $N50 each per year (i.e. $N250 in total) to the Chinchimane Khuta in order to harvest palm. This money is raised through basket sales, with contributions depending on the basket income of each woman. In return the Khuta ensures that outsiders do not use the local palm source without permission. No formal, comprehensive investigation has been conducted into the location and availability of the palm supply for basket making in Caprivi. Prior to the expansion of the craft programme in Caprivi,
9
RF staff investigated the status of the palm source in order to ensure sustainability of supply. Results indicated that where the palm occurs (dependent on soil and rainfall), it is in plentiful supply (C. Paxton, pers. comm.). No published results from this investigation were available at the time of writing this paper. For the Chobe–Caprivi Wetlands, two per cent of the area is classified as ‘palm savannah’. 62 per cent of households in a survey claimed to harvest an average of 14 bundles of palm fronds per year. Harvesting occurs at the beginning of the dry season after the floodwaters have subsided and half of all user households sell their total harvest. A price of $N2.50 a bundle was assumed (similar to Okavango Delta prices), giving an annual value for the whole wetland area of nearly $N200,000 (Turpie et al., 1999). Palm has also been identified as an important natural resource available within the Salambala Conservancy (Mosimane, 1996; Murphy and Mulonga, 2002 and Murphy et al., 2002). However, it is not known how big the market for palm in the case-study areas of this paper is, as there is only anecdotal evidence of young men selling palm to older women. Palm resources in Caprivi appear to be localised and soil dependent rather than widespread or evenly distributed. Mashi Craft producers in the vicinity of Kongola travel over 100km to collect palm near Katima Mulilo. Weavers in Salambala Conservancy and Masokotwane have more local sources, though women in both the study sites reported that the distances they travelled to collect palm were long and community resource monitors (CRMs) have reported that palm sources are declining (see Table 8). 3.4 Craft and the conservancies RF spent $N60,000 in over ten villages in the Salambala Conservancy from June 1998 to end of 2001. The main impact of Salambala Conservancy on the RF craft programme has been that the CRMs have assisted RF staff with training and buying, both inside and outside the conservancy. Conservancy staff actively collaborate with RF staff to develop a more sustainable craft buying operation, mainly focussing on a centralised buying and distribution of payments system with transport assistance from the conservancy vehicle. The conservancy committee was also successful in getting the RF to extend their craft programme from Muyako to additional villages within the conservancy. The presence of a conservancy is however, not necessary for a successful craft programme – the Muyako craft group was established prior to the conservancy, and the five Masokotwane producer groups flourish in an area with no conservancy and sustaining harvesting techniques are enforced. 4. ANALYSIS OF CRAFT SALES The information used for this analysis was the sales records of all craft sold to RF between June 1998 and December 2001. In 1998, 100 per cent of craft sold was woven products – mostly baskets and reed mats. Table 2 illustrates the massive growth in the programme over time in terms of both the number of crafters and the value of sales. 100 per cent of sales in 1999 and 2000 were also by weavers. In 2001, potters and wood carvers also began to sell their products to RF, although weavers still accounted for 95 per cent of the number of crafters. Over time, 565 women have sold at least one basket (85 selling only one basket), 17 potters have sold at least one pot to RF and five woodcarvers have become regular suppliers to RF.
10
Table 2 Sales details by year
Year Total sales ($N)
Number of crafters
Av price rec’d ($N)
Min price rec’d ($N)
Max price rec’d* ($N)
No. of sales
1998 1,910 41 14 5 57 140
1999 15,682 63 21 1 77 755
2000 83,243 294 31 1 131 2,717
2001 101,792 522 25 1 500 4,167
* highest prices for single pieces of craft, excluding bonus and exhibition payments.
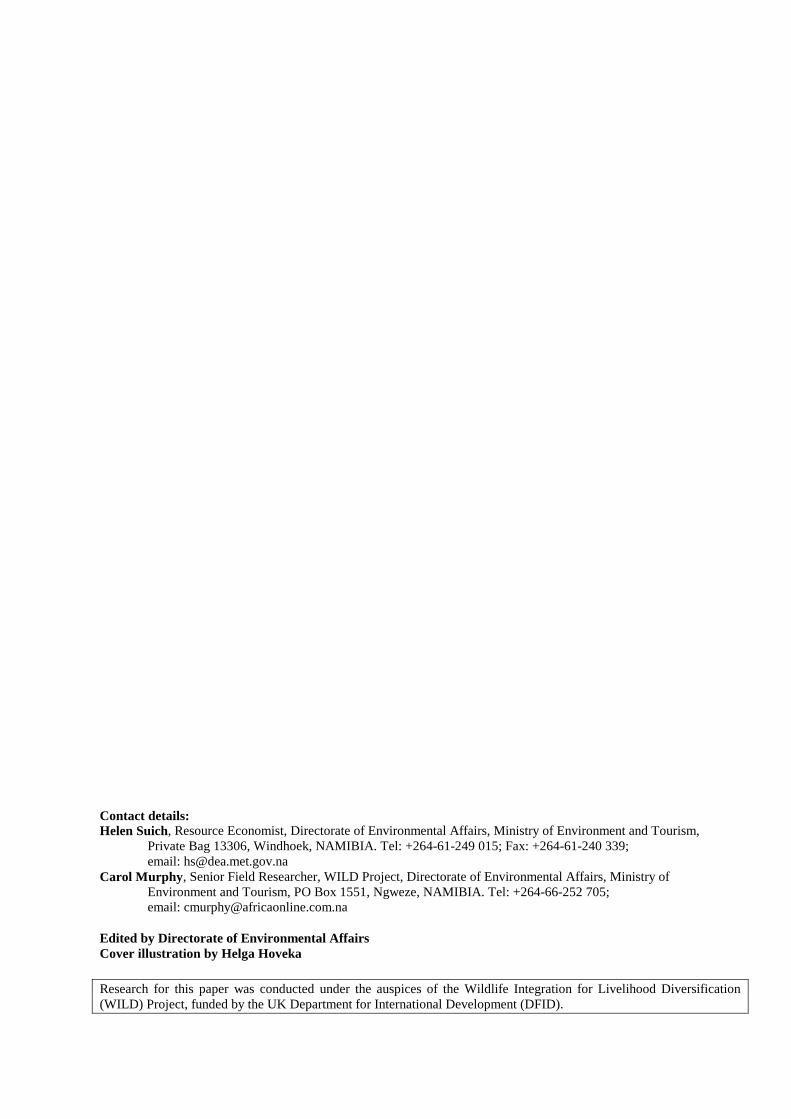
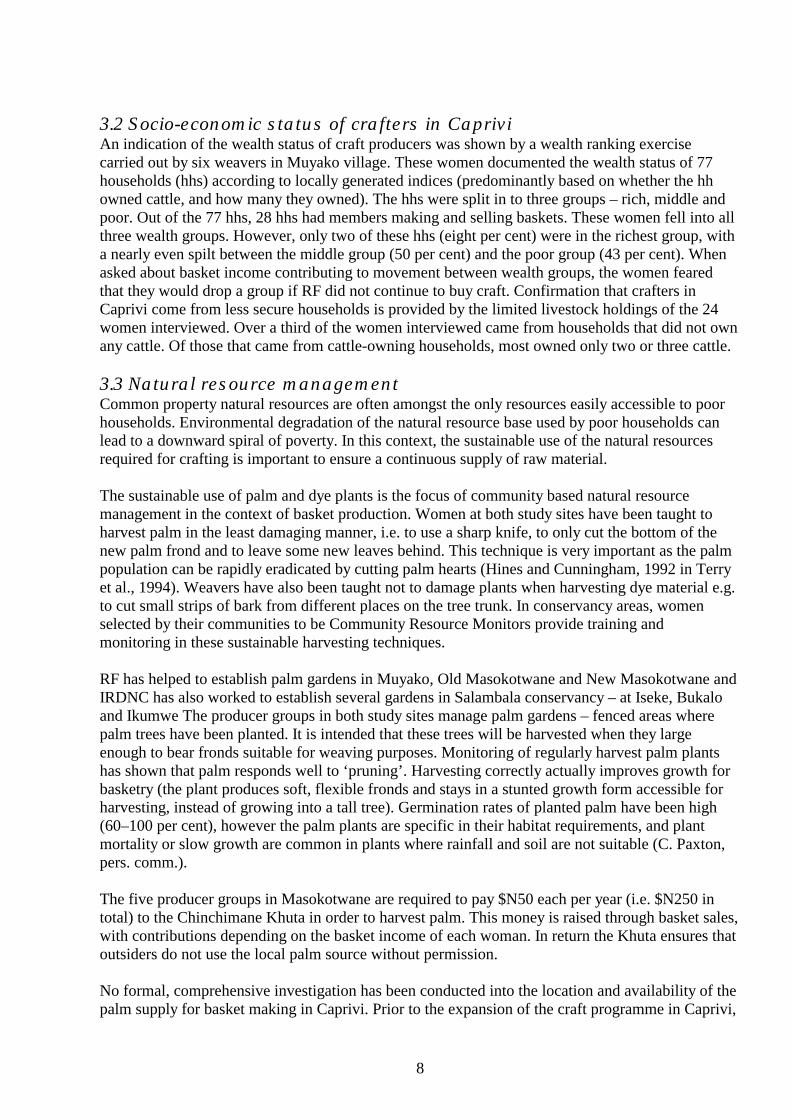
The sheer number of suppliers gives a good indication of the scale of growth (from 41 in 1998 to 522 in 2001) and the potential to make positive impacts on rural livelihoods in the region. However, it must be recognised that there are only a small number of consistently high volume producers and high income earners from craft sales (see Figure 1). It can be seen from this figure that most crafters sell between two and five pieces per year. Given the relatively low average prices per piece, these crafters will earn only a small cash income from craft making.
Only 19 crafters have sold over 60 pieces of work – five woodcarvers and 14 weavers. The average price for each item was relatively low at $N28. On average, these crafters sold 115 pieces to earn an average income of around $N2,860. Of these, weavers sold fewer pieces and earned lower incomes. Few crafters received high average prices for each piece of work – only 20 achieved average prices above $N50. Of these, one was a carver, seven were potters and the remaining 12 were weavers. The potters sold on average only two items, achieving an average price of $N78 and an average income of $N225 (in 2001). The weavers sold on average 22 pieces at an average price of $N57 to earn an average income of $N1,289 (1998–2001). The average price received by the woodcarver was $N56, he sold 112 pieces for a total cash income of $N3,290 (2001). This carver was also the only individual who achieved both an average prices over $N50 as well as selling over 60 pieces of work.
Figure 1 Proportion of cr afters by number of sales p.a.
0
10
20
30
40
50
60
70
80
1 2 to 5 6 to 9 10+No. of sales
%
1998
1999
2000
2001
11
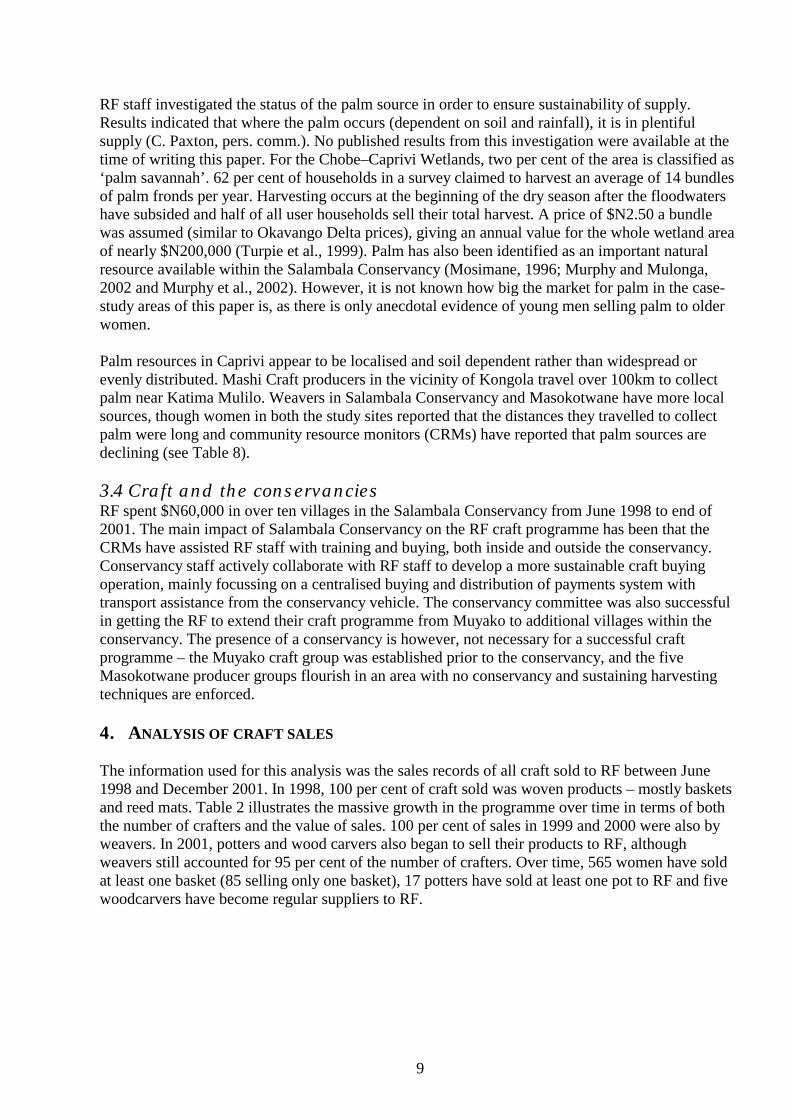
Table 3 disaggregates sales by year by village and shows the rapid growth between 1998 and 2000, and the levelling off in 2001. It can be seen from this table that the crafters in Muyako, Makawa and New Masokotwane in particular are consistently high producers.
Table 3 Number and value of sales by year by village
1998 1999 2000 2001 Village
$N No. $N No. $N No. $N No.
Total sales
Bukalo 857 54 28,421 1,112 29,278
Bwara 2,039 98 1,208 46 3,247
Ibbu 255 15 255
Iseke 5,869 307 5,187 344 11,056
Kache Kache 454 12 454
Mahundu 131 7 131
Makalonga 335 7 9,507 375 9,842
Makawa 56 4 88 4 9,392 234 15,272 572 24,808
Maritzburg 2,171 53 2,171
Masikele 85 4 85
Mutikitili 1,884 69 1,884
Muyako 1,045 76 8,542 446 15,533 781 7,144 315 32,264
New Masokotwane 809 60 6,921 298 25,394 696 13,486 464 46,610
Ngala 1,911 103 1,688 69 3,599
Old Masokotwane 20,924 422 12,272 453 33,196
Sikanjabuka 670 37 2,286 77 2,956
Silumbi 319 23 472 23 791
Total 1,910 140 15,682 755 83,243 2,717 101,792 4,003 202,627
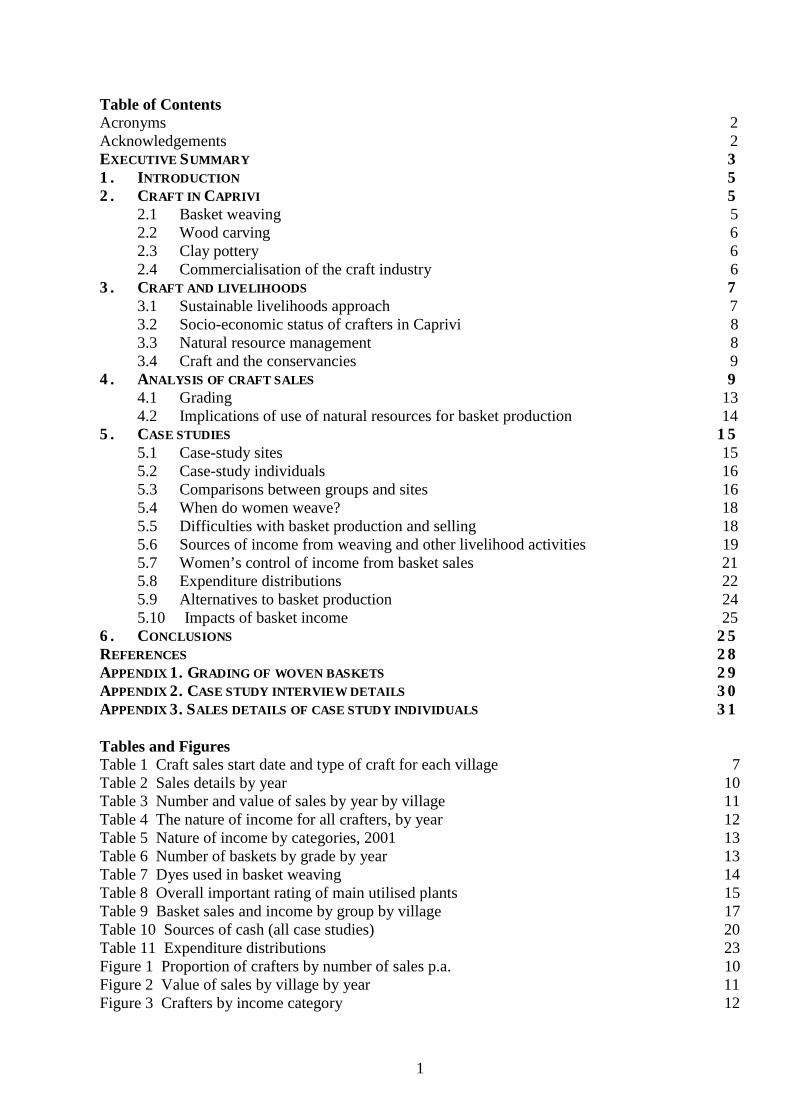
This table and Figure 2 illustrate the productivity and high value of sales of wood carvings – as evidenced by the massive increase in the value of sales in Bukalo between 2000 and 2001 (all five carvers are located in or near Bukalo).
Figure 2 Value of sales by village by year
0%
20%
40%
60%
80%
100%
1998 1999 2000 2001Year
%
Silumbi
Sikanjabuka
Old Masokotwane
Ngala
New Masokotwane
Muyako
Mutikitili
Masikele
Maritzburg
Makawa
Makalonga
Mahundu
Kache Kache
Iseke
Ibbu
Bwara
Bukalo
12
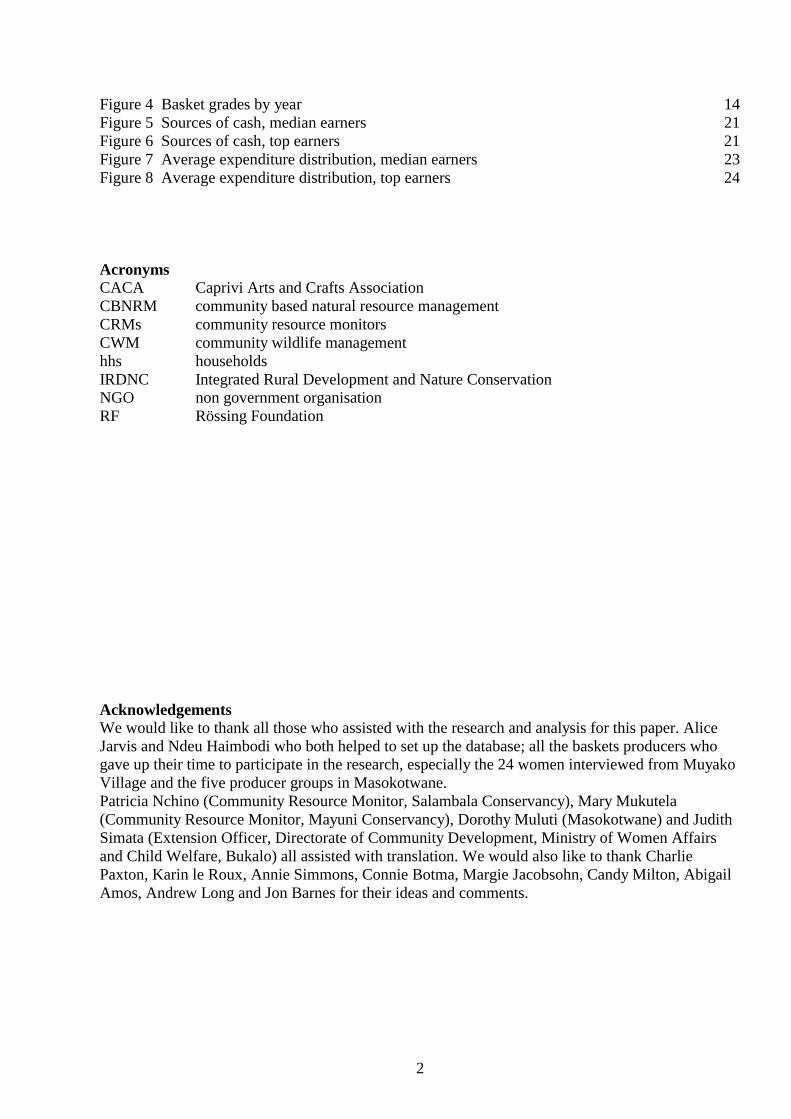
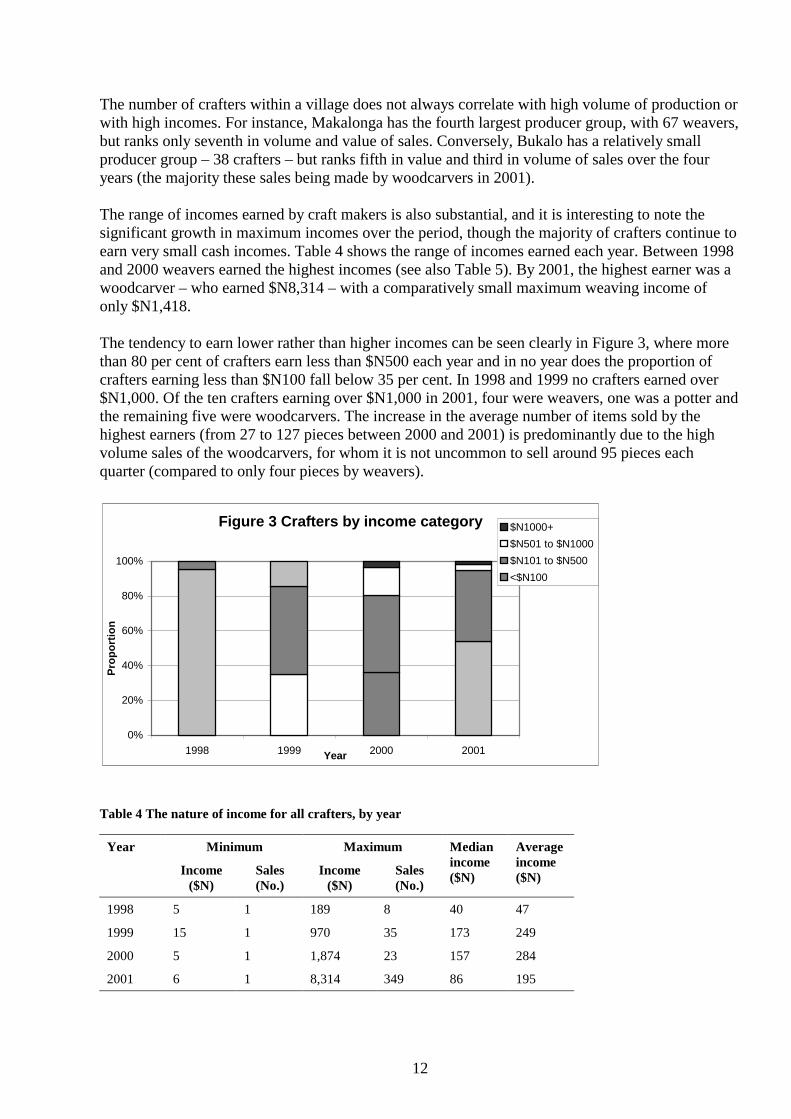
The number of crafters within a village does not always correlate with high volume of production or with high incomes. For instance, Makalonga has the fourth largest producer group, with 67 weavers, but ranks only seventh in volume and value of sales. Conversely, Bukalo has a relatively small producer group – 38 crafters – but ranks fifth in value and third in volume of sales over the four years (the majority these sales being made by woodcarvers in 2001). The range of incomes earned by craft makers is also substantial, and it is interesting to note the significant growth in maximum incomes over the period, though the majority of crafters continue to earn very small cash incomes. Table 4 shows the range of incomes earned each year. Between 1998 and 2000 weavers earned the highest incomes (see also Table 5). By 2001, the highest earner was a woodcarver – who earned $N8,314 – with a comparatively small maximum weaving income of only $N1,418. The tendency to earn lower rather than higher incomes can be seen clearly in Figure 3, where more than 80 per cent of crafters earn less than $N500 each year and in no year does the proportion of crafters earning less than $N100 fall below 35 per cent. In 1998 and 1999 no crafters earned over $N1,000. Of the ten crafters earning over $N1,000 in 2001, four were weavers, one was a potter and the remaining five were woodcarvers. The increase in the average number of items sold by the highest earners (from 27 to 127 pieces between 2000 and 2001) is predominantly due to the high volume sales of the woodcarvers, for whom it is not uncommon to sell around 95 pieces each quarter (compared to only four pieces by weavers).
Table 4 The nature of income for all crafters, by year
Year Minimum Maximum
Income ($N)
Sales (No.)
Income ($N)
Sales (No.)
Median income ($N)
Average income ($N)
1998 5 1 189 8 40 47
1999 15 1 970 35 173 249
2000 5 1 1,874 23 157 284
2001 6 1 8,314 349 86 195
Figure 3 Crafters by income category
0%
20%
40%
60%
80%
100%
1998 1999 2000 2001Year
Pro
port
ion
$N1000+
$N501 to $N1000
$N101 to $N500
<$N100
13
Only 15 women (37 per cent) earned over the average income in 1998. Again in 1999, only 37 per cent of women earned over the average income. In 2000 around 34 per cent of weavers earned over the average income for the year. In that year, the bottom 25 per cent of earners earned marginally over three per cent of total craft income, while the top 25 per cent earned 65 per cent ($N54,284) and the top five almost 24 per cent ($N19,670) of total income earned by all crafters. The top income in 2001 was earned by a (male) woodcarver, as were another four of the top ten incomes for that year. In 2001, 95 per cent of crafters were weavers, but they produced only 85 per cent of total crafts and earned only 85 per cent of total craft income. Total income to weavers in 2001 was $N73,324 of a total to all crafts of $N101,792. The bottom 25 per cent earned only $N3,026 (only three per cent of income) while the top 25 per cent earned $N74,441 between them (almost 73 per cent of total income). The top five per cent (27 weavers) earned 42 per cent of total income, or $N42,924 between them.
Table 5 Nature of income by categories, 2001
Year Minimum Maximum
Income ($N)
Sales (No.)
Income ($N)
Sales (No.)
Median income ($N)
Average income ($N)
Potters 10 1 1,135 7 60 164
Weavers 6 1 1,418 31 86 147
Woodcarvers 1,416 77 8,314 349 4,033 4,454
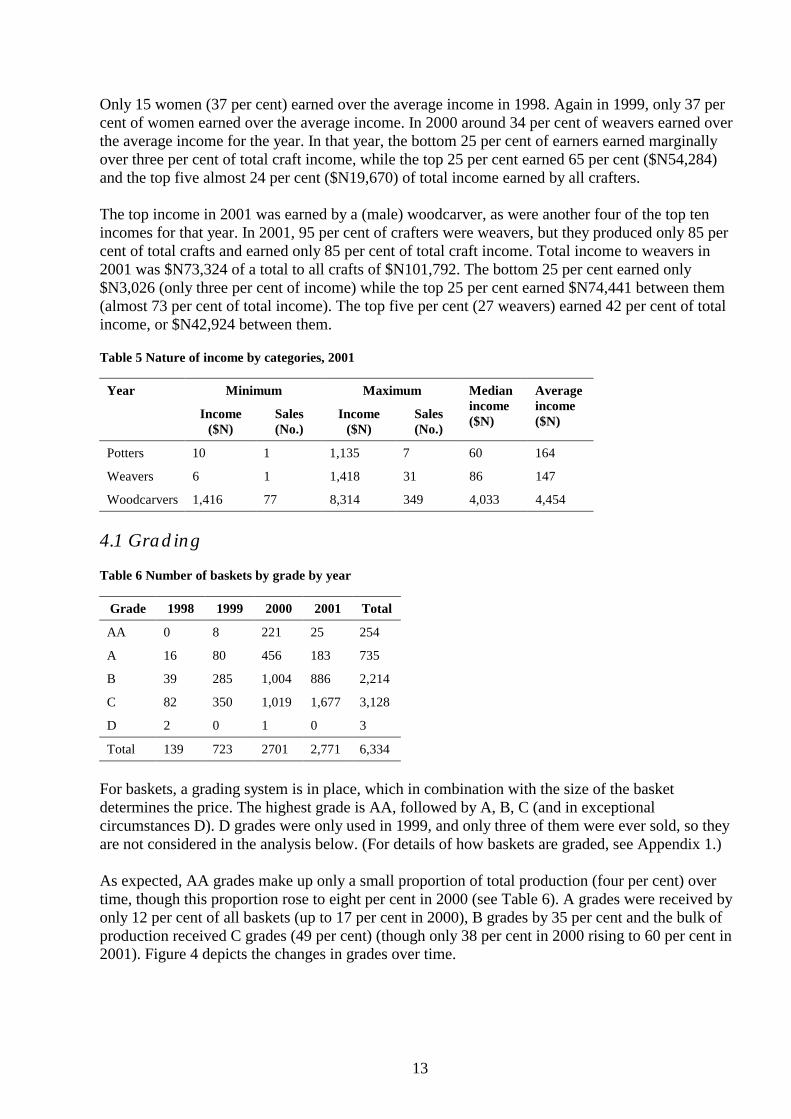
4.1 Grading
Table 6 Number of baskets by grade by year
Grade 1998 1999 2000 2001 Total
AA 0 8 221 25 254
A 16 80 456 183 735
B 39 285 1,004 886 2,214
C 82 350 1,019 1,677 3,128
D 2 0 1 0 3
Total 139 723 2701 2,771 6,334
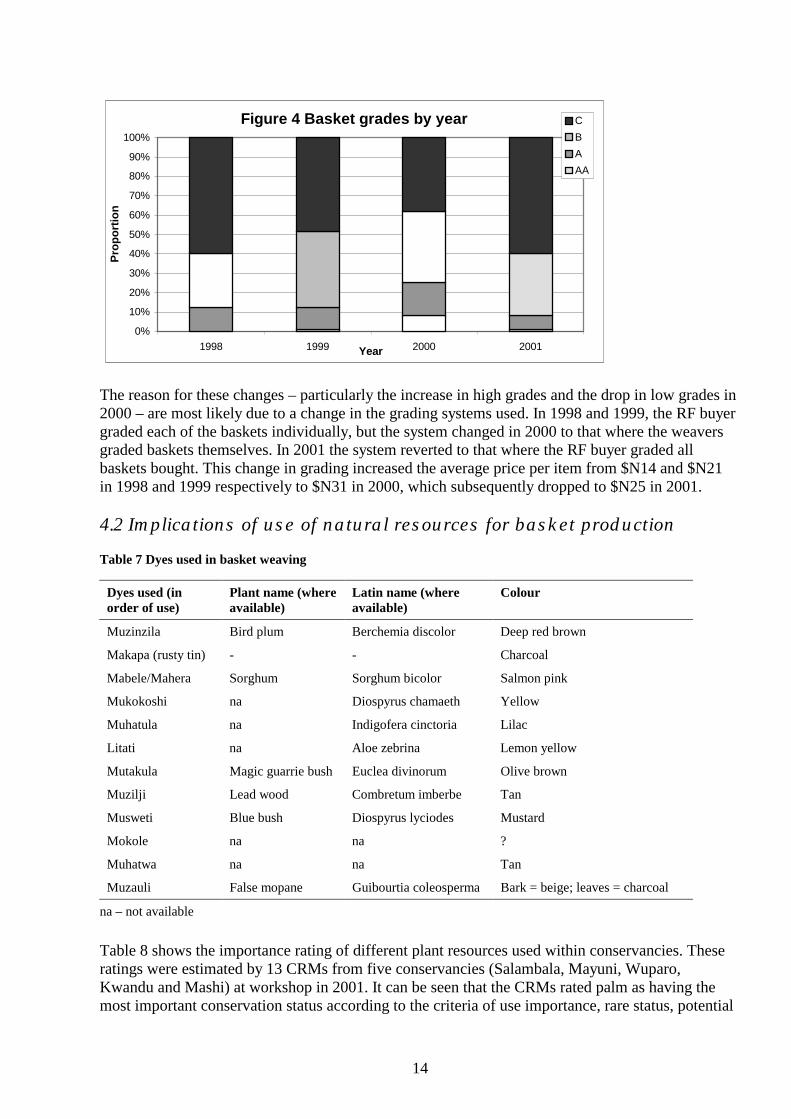
For baskets, a grading system is in place, which in combination with the size of the basket determines the price. The highest grade is AA, followed by A, B, C (and in exceptional circumstances D). D grades were only used in 1999, and only three of them were ever sold, so they are not considered in the analysis below. (For details of how baskets are graded, see Appendix 1.) As expected, AA grades make up only a small proportion of total production (four per cent) over time, though this proportion rose to eight per cent in 2000 (see Table 6). A grades were received by only 12 per cent of all baskets (up to 17 per cent in 2000), B grades by 35 per cent and the bulk of production received C grades (49 per cent) (though only 38 per cent in 2000 rising to 60 per cent in 2001). Figure 4 depicts the changes in grades over time.
14
Figure 4 B asket grades by year
0%
10%
20%
30%
40%
50%
60%
70%
80%
90%
100%
1998 1999 2000 2001Year
Pro
port
ion
C
B
A
AA
The reason for these changes – particularly the increase in high grades and the drop in low grades in 2000 – are most likely due to a change in the grading systems used. In 1998 and 1999, the RF buyer graded each of the baskets individually, but the system changed in 2000 to that where the weavers graded baskets themselves. In 2001 the system reverted to that where the RF buyer graded all baskets bought. This change in grading increased the average price per item from $N14 and $N21 in 1998 and 1999 respectively to $N31 in 2000, which subsequently dropped to $N25 in 2001. 4.2 Implications of use of natural resources for basket production
Table 7 Dyes used in basket weaving
Dyes used (in order of use)
Plant name (where available)
Latin name (where available)
Colour
Muzinzila Bird plum Berchemia discolor Deep red brown
Makapa (rusty tin) - - Charcoal
Mabele/Mahera Sorghum Sorghum bicolor Salmon pink
Mukokoshi na Diospyrus chamaeth Yellow
Muhatula na Indigofera cinctoria Lilac
Litati na Aloe zebrina Lemon yellow
Mutakula Magic guarrie bush Euclea divinorum Olive brown
Muzilji Lead wood Combretum imberbe Tan
Musweti Blue bush Diospyrus lyciodes Mustard
Mokole na na ?
Muhatwa na na Tan
Muzauli False mopane Guibourtia coleosperma Bark = beige; leaves = charcoal
na – not available
Table 8 shows the importance rating of different plant resources used within conservancies. These ratings were estimated by 13 CRMs from five conservancies (Salambala, Mayuni, Wuparo, Kwandu and Mashi) at workshop in 2001. It can be seen that the CRMs rated palm as having the most important conservation status according to the criteria of use importance, rare status, potential

15
for mortality with use and declining status. Dye plants fare better and have a lower conservation status except Chifurofuro (Aloe zebrine). This plant is common in Salambala Conservancy but rare elsewhere. RF actively discourages use of this plant for basket dyes (C. Paxton, pers. comm.). Luckily, the main dye tree (Muzinzila) appears not to be rare or declining. The use of rusty tin and sorghum for dyes is also very sustainable.
Table 8 Overall important rating of main utilised plants
Plants to monitor Overall importance rating (1 = critical)
Important Rare Death (1 = use means death)
Decline (1 = declining)
Palm 1 1 1 2 1
Tree cutting 2 1 4 1 1
Grass (thatch) 3 1 3 3 1
Chifurofuro (yellow dye – aloe) 3 2 1 1 1
Reeds 4 1 3 2 2
Muzimachuru/Mukokoshi (dye trees/shrubs)
4 3 3 1 1
Muzinzila (dye tree) 5 3 3 3 3
Water lilies 6 4 3 3 2
Papyrus 6 1 3 3 2
5. CASE STUDIES 5.1 Case-study sites The two case-study sites were Muyako (within Salambala Conservancy) and Masokotwane2. These villages were chosen as they currently have the largest concentrations of basket producers selling to RF. Both of these areas have historically been the focus of NGO support for basket production and marketing. This is likely to be due to the availability of palm and the historical presence of skilled basket weavers. The choice of one study site within a conservancy and one outside lent itself to a comparison of any impact that the conservancy may have on the basket production activities. There were two groups of women interviewed – those with the highest incomes and those who earned median incomes3 from basket sales in the two villages. These two groups were chosen to try and determine whether there was any significant difference between the different groups, i.e. whether the top earners made more money because they produced more baskets (relatively) or because they produced higher quality goods. The distinction was also made to try and determine what the different levels of income earned from weaving means to different groups (i.e. whether the median earners produce less because they have other ways of earning cash). Low earners were not chosen as it is believed that the income such women earn is too low (as little as N$5 per year) and too infrequent to have significant livelihood impacts on their household.
2 Masokotwane here refers to three villages – New Masokotwane, Old Masokotwane and Makawa. They are considered the same here because the group that started as ‘Masokotwane’ subsequently split into five producer groups (Makawa, Makalonga, Machita, Matemwa and Muluti) because of the large number of weavers involved. 3 Median of earners who sold three or more baskets over time.
16
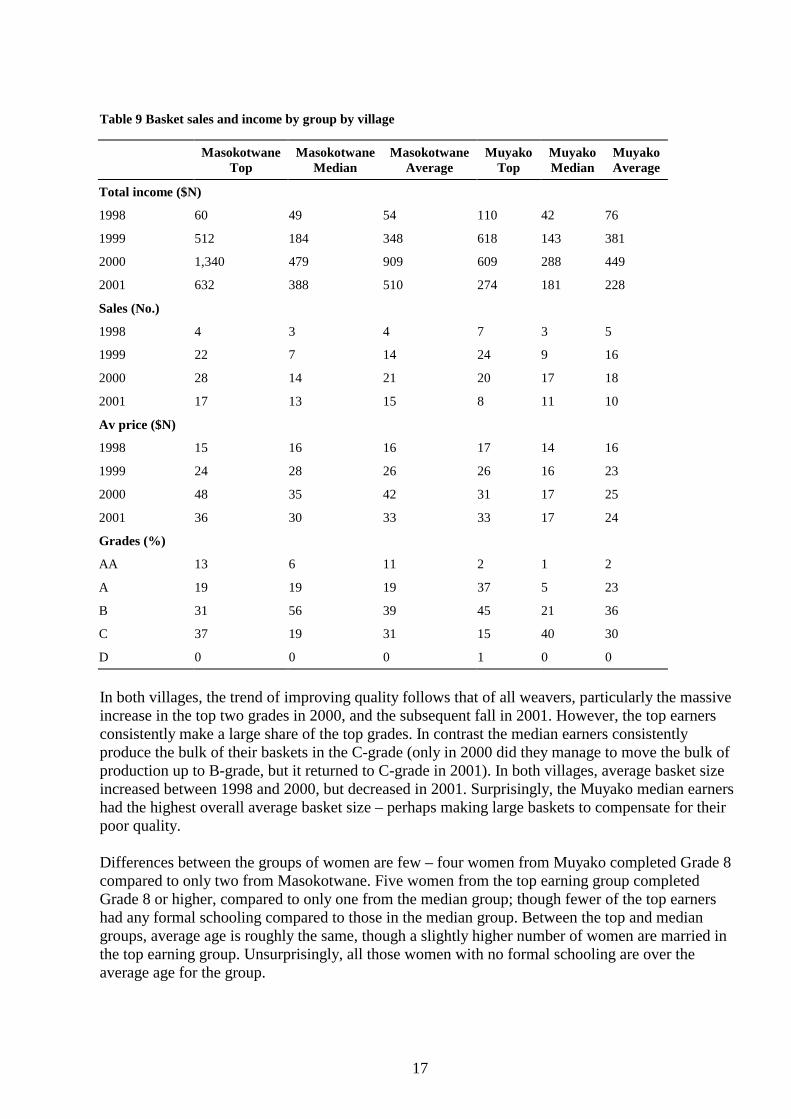
5.2 Case-study individuals A total of 24 women were interviewed (10 from Muyako and 14 from within the five producer groups in Masokotwane, refer to Appendix 2). The women interviewed ranged in age from 21 years to 81 years. Nine of the women had never been to school. Of the school-going women, only 25 per cent completed Grade 8 or higher and only one woman completed Grade 12. Some of the women left school because they fell pregnant or their families could not afford school fees. Twenty three women interviewed had children, ranging in number between one and nine with an average of five. Nineteen of the women had children or grandchildren that they were responsible for sending to school. Seventeen of the women are married, one is a widower, four are divorced or separated and two have never been married. The limited livestock holdings of these women referred to previously indicate that they are from less secure households. Some of the women were taught to harvest, prepare and weave the palm by their mothers. Others were taught when they were at school and, more recently, skilled weavers in the basket selling groups set up by RF taught newcomers the art of weaving. Some of the women mentioned that they learnt to weave and sell baskets when they were having financial difficulties – one woman began selling baskets in 1993 after she divorced and was struggling to support her three children; another started weaving and selling baskets in 2000 to earn money for school fees she was having difficulties paying. Most of the high earners, named their skill as the reason why they could generate more money than the other women. All the women interviewed reported that they liked making baskets because it brought them money. (See Appendix 3 for details of individuals’ sales.) 5.3 Comparisons between groups and sites From Table 9, it can be seen that there are quite significant differences in income from basket sales between the top and median earners in both villages4. In both Muyako and Masokotwane, yearly income, sales and average prices are higher for the top earners than for the median group. It can also be seen from this table that while Muyako was initially more successful, the differences were minimised in 1999, and by 2000 Masokotwane had surged well ahead of Muyako – earning around double the incomes earned in Muyako, and with considerably higher average prices (though average sales remained similar). One of the most significant differences can be seen in the analysis of grades. The Masokotwane weavers produced higher proportions of AA grades than those in Muyako – though for the top earners, the overall proportions of AA grades are very similar. The comparatively poor performance of the Muyako median weavers can be in large part attributed the high proportion of production of poor quality baskets (68 per cent C-grade).
4 There has been no statistical verification of the differences between to the two groups or villages, so the differences noted are indicative only.
17
Table 9 Basket sales and income by group by village
Masokotwane Top
Masokotwane Median
Masokotwane Average
Muyako Top
Muyako Median
Muyako Average
Total income ($N)
1998 60 49 54 110 42 76
1999 512 184 348 618 143 381
2000 1,340 479 909 609 288 449
2001 632 388 510 274 181 228
Sales (No.)
1998 4 3 4 7 3 5
1999 22 7 14 24 9 16
2000 28 14 21 20 17 18
2001 17 13 15 8 11 10
Av price ($N)
1998 15 16 16 17 14 16
1999 24 28 26 26 16 23
2000 48 35 42 31 17 25
2001 36 30 33 33 17 24
Grades (%)
AA 13 6 11 2 1 2
A 19 19 19 37 5 23
B 31 56 39 45 21 36
C 37 19 31 15 40 30
D 0 0 0 1 0 0
In both villages, the trend of improving quality follows that of all weavers, particularly the massive increase in the top two grades in 2000, and the subsequent fall in 2001. However, the top earners consistently make a large share of the top grades. In contrast the median earners consistently produce the bulk of their baskets in the C-grade (only in 2000 did they manage to move the bulk of production up to B-grade, but it returned to C-grade in 2001). In both villages, average basket size increased between 1998 and 2000, but decreased in 2001. Surprisingly, the Muyako median earners had the highest overall average basket size – perhaps making large baskets to compensate for their poor quality. Differences between the groups of women are few – four women from Muyako completed Grade 8 compared to only two from Masokotwane. Five women from the top earning group completed Grade 8 or higher, compared to only one from the median group; though fewer of the top earners had any formal schooling compared to those in the median group. Between the top and median groups, average age is roughly the same, though a slightly higher number of women are married in the top earning group. Unsurprisingly, all those women with no formal schooling are over the average age for the group.
18
In addition, the top earning women had, on average, quite considerably fewer children than those in the median group – 4.4 and 6.25 respectively, though the ranges did not differ significantly between the groups. (This could perhaps be attributed to the recognised trend that higher household incomes tend to lead to a smaller number of children per household.) 5.4 When do women weave? Weaving is a supplementary activity that women fit into their other livelihood activities more than a full-time occupation. Other activities such as growing food and household chores take precedence. Although day to day, once these chores are completed, the women will weave. Six women consider weaving to be a virtually full-time occupation, though for three of these women, the work is mostly in the winter when there are no cropping or ploughing activities to attend to. Only one woman mentioned that she did not have as much time as she would like to weave. The remaining weavers (17) fit weaving into their daily routine around other activities such as fetching water, household cleaning and cooking, plastering the house, cropping activities, etc., ‘If I don’t have work, I will make baskets. If I do, I will make baskets later’. 5.5 Difficulties with basket production and selling When asked about the difficulties of making and selling baskets, three major categories of difficulties emerged – those related to the collection of the raw materials necessary for basket production; the strenuous nature of weaving; and the problems related to marketing and low returns. 5.5.1 Natural resource collection and use Many women mentioned the dangers associated with having to walk long distances to collect palm and dye materials. These dangers included the risk of encountering elephants, snakes, scorpions and bees on the journey, as well as the fact that elephants often eat the new leaves (the best palm to work with). The amount of good quality palm available in Muyako has also been reduced probably due to the current dry cycle and drying up of Lake Liambezi. The distance travelled to collect both palm and dyes is a further problem – many types of dye tree do not grow near the villages, so the women must walk long distances to collect it. In addition, the preparation of indigenous plant dyes requires careful work – and in Muyako, where the water is salty, clean water from outside the village must be fetched. This may also be a problem in other villages where weavers live. 5.5.2 Strenuous nature of weaving Physically, the women must endure pain in their backs, shoulders and hands from sitting for long periods weaving. The awl used in weaving can inflict painful injuries and causes calluses on the womens’ fingers. 5.5.3 Marketing and low returns The women recognise that weaving is a low return and time consuming activity. One weaver stated that ‘the job is big, but the money is small’. They also believe that the grading system is too strict – that they receive lower prices than they ‘should’ for the finished product. The women also mentioned that marketing constraints are a problem – in terms of making more baskets than they can sell to RF (and receiving lower prices if baskets have deteriorated in quality as a result of prolonged storage); as well as the problems of relying heavily on RF and having to wait for the RF buyer to come each quarter (as well as the difficulties associated with the postponement of the December 2001 trip, and the uncertainties about the future that that event caused).
19
5.6 Sources of income from weaving and other livelihood activities
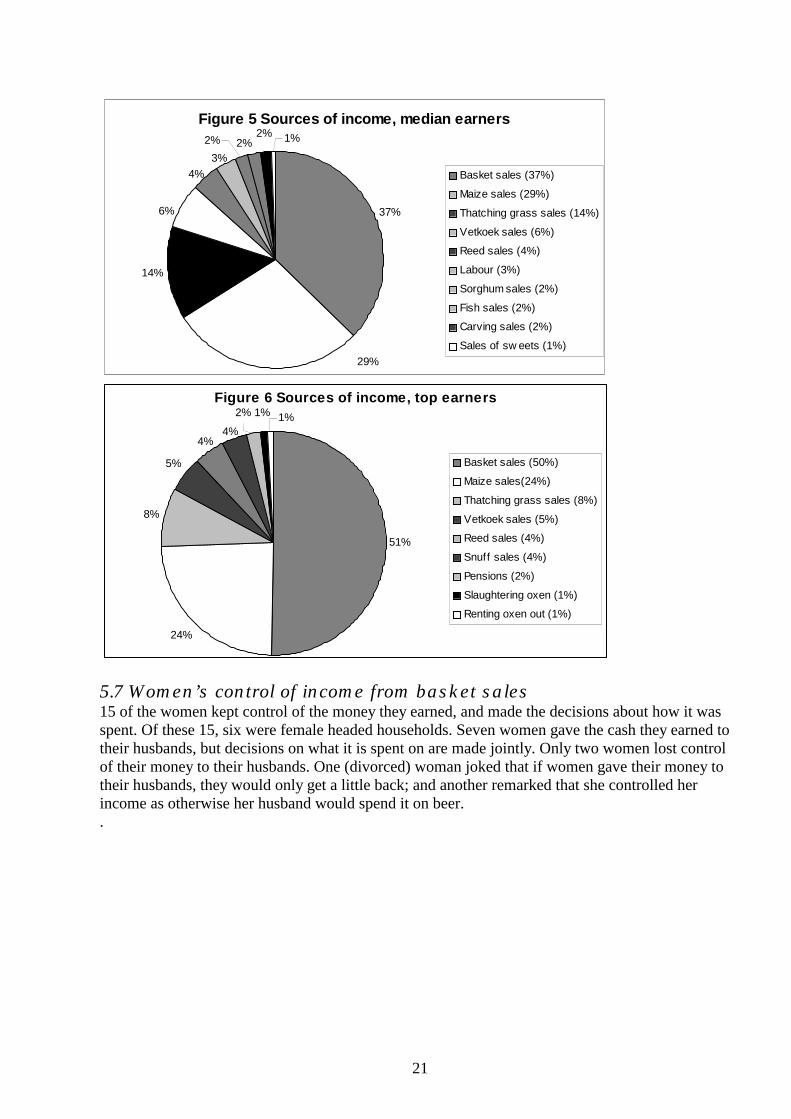
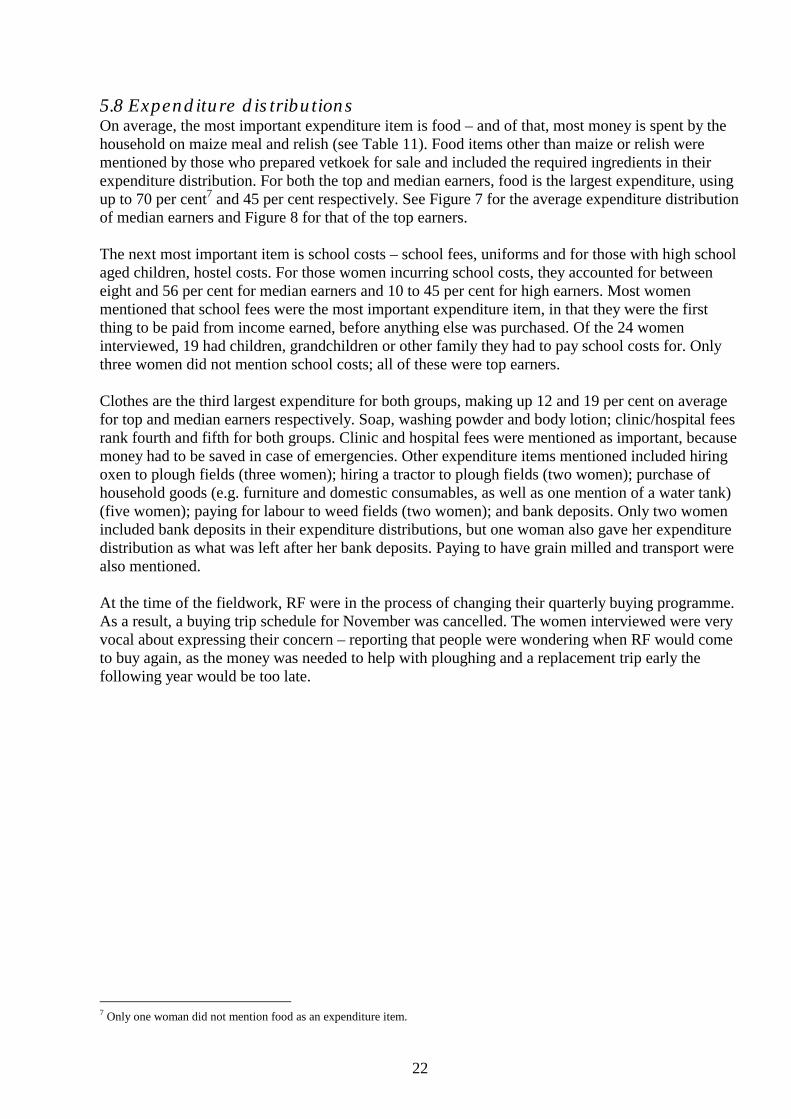
5.6.1 Median earning group For the median group, 11 different activities were listed as providing cash income for these women and their households (see Figure 5). All women earned money from selling baskets, which was on average the most important source of cash income (with a range of 5–75 per cent of total cash income). Sales of maize were the second most important source of cash (almost 30 per cent on average), providing some cash for eight of these 12 women. Nine women sold thatching grass, though it provided on average only 14 per cent of total cash income for 2001. Vetkoek sales provided the fourth most important source of cash, and provided income for five women. Only three women sold reeds, which provided the fifth most important source of cash (between 10–20 per cent of income for these women). Two women did piecework, and the other five activities were carried out by only one woman each. These activities were selling fish, buying sweets in Katima Mulilo to sell to local school children, sales of carvings made by one woman’s husband, selling sorghum and selling traditional beer. (This last activity does not appear in Figure 5, as it makes up only five per cent of one woman’s income, and so is insignificant overall). On average, this group of women earn all their cash from between three and four activities, with a minimum of two and a maximum of six activities being undertaken by any one woman. This large number of activities illustrates well the diverse livelihood strategies of the rural poor. In 2001, basket selling contributed between $N70 and $N1,050. Total cash income was calculated5 to range from only $N161 and $N2,820; such incomes are well below the widely accepted poverty line of $US1 per day6. 5.6.2 High earning group For the highest earning group, sources of cash and their proportions are available for only 11 of the 12 interviewees. All women earned cash during 2001 from basket sales, which is the most important source overall for the group – providing an average of 51 per cent of total cash income (with a range of 16–100 per cent; only one woman relies entirely on basket sales for cash). Maize sales are the next most important cash source, providing on average a quarter of yearly income, with seven women earning income by selling maize. Thatching grass sales are the third most important cash source, and is an activity undertaken by half of the group. Vetkoek sales are made by three women, as are reed sales. The remaining five activities are undertaken by only one woman each. These activities are snuff sales, receiving an old age pension, slaughtering oxen for sale, renting oxen to other households and selling building poles. (Building poles account for only two per cent of one woman’s income, so are not significant on average, and thus do not appear in Figure 6.) This group of women earned their total cash income from two or three activities, with a minimum of one and maximum of six activities providing income for any one individual. Total cash income from basket sales in 2001 for this group ranged from $N137 to $N1,418; with total cash income from all sources calculated to range between $N291 and $N2,388. These incomes also fall below the poverty line of $US1 per day.
5 Calculated using 2001 basket sales income and proportions of income from all sources for each individual. 6 Using an exchange rate of $N9.80:$US1, the poverty line is calculated at approximately $N3,577 (June 2002). Since writing this paper, it has been suggested at a United Nations Development Programme conference that the poverty line be redefined at $US2 per day.
20
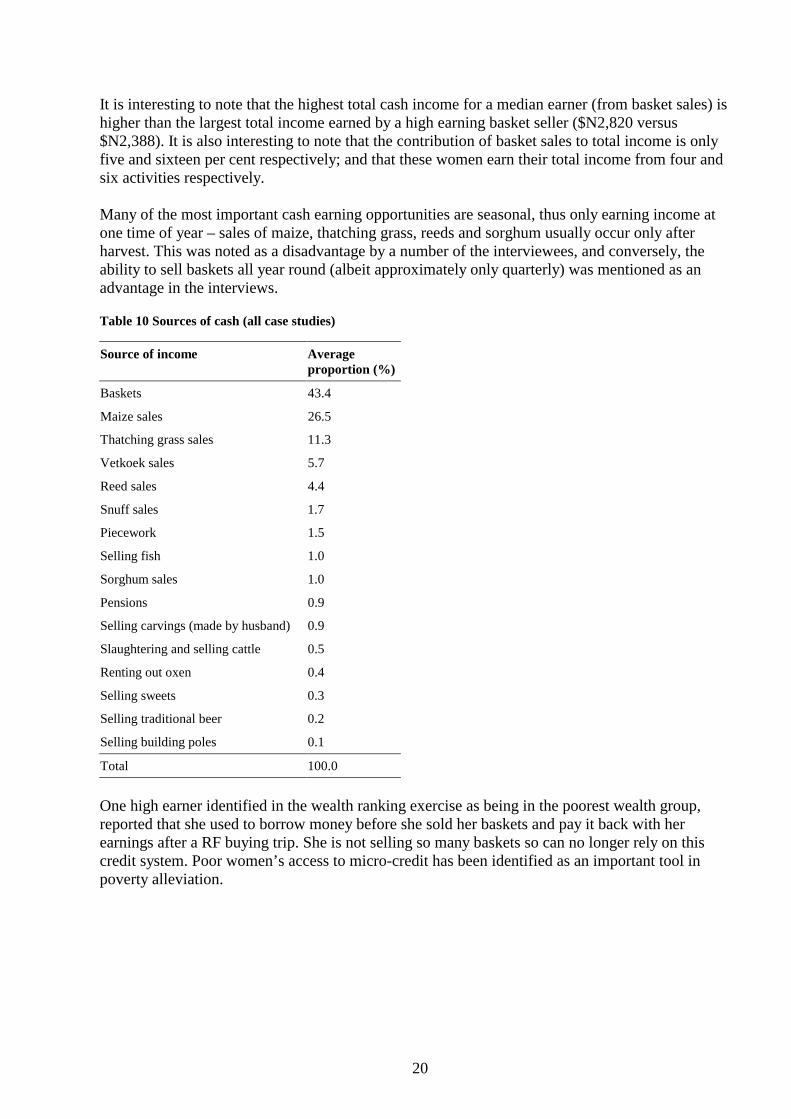
It is interesting to note that the highest total cash income for a median earner (from basket sales) is higher than the largest total income earned by a high earning basket seller ($N2,820 versus $N2,388). It is also interesting to note that the contribution of basket sales to total income is only five and sixteen per cent respectively; and that these women earn their total income from four and six activities respectively. Many of the most important cash earning opportunities are seasonal, thus only earning income at one time of year – sales of maize, thatching grass, reeds and sorghum usually occur only after harvest. This was noted as a disadvantage by a number of the interviewees, and conversely, the ability to sell baskets all year round (albeit approximately only quarterly) was mentioned as an advantage in the interviews.
Table 10 Sources of cash (all case studies)
Source of income Average proportion (%)
Baskets 43.4
Maize sales 26.5
Thatching grass sales 11.3
Vetkoek sales 5.7
Reed sales 4.4
Snuff sales 1.7
Piecework 1.5
Selling fish 1.0
Sorghum sales 1.0
Pensions 0.9
Selling carvings (made by husband) 0.9
Slaughtering and selling cattle 0.5
Renting out oxen 0.4
Selling sweets 0.3
Selling traditional beer 0.2
Selling building poles 0.1
Total 100.0
One high earner identified in the wealth ranking exercise as being in the poorest wealth group, reported that she used to borrow money before she sold her baskets and pay it back with her earnings after a RF buying trip. She is not selling so many baskets so can no longer rely on this credit system. Poor women’s access to micro-credit has been identified as an important tool in poverty alleviation.
21
Figure 5 Sources of income, median earners
37%
14%
29%
1%
6%
4%
3%
2% 2%2%
Basket sales (37%)
Maize sales (29%)
Thatching grass sales (14%)
Vetkoek sales (6%)
Reed sales (4%)
Labour (3%)
Sorghum sales (2%)
Fish sales (2%)
Carving sales (2%)
Sales of sw eets (1%)
Figure 6 Sources of income, top earners
51%
24%
8%
5%
4%4%
2% 1% 1%
Basket sales (50%)
Maize sales(24%)
Thatching grass sales (8%)
Vetkoek sales (5%)
Reed sales (4%)
Snuff sales (4%)
Pensions (2%)
Slaughtering oxen (1%)
Renting oxen out (1%)
5.7 Women’s control of income from basket sales 15 of the women kept control of the money they earned, and made the decisions about how it was spent. Of these 15, six were female headed households. Seven women gave the cash they earned to their husbands, but decisions on what it is spent on are made jointly. Only two women lost control of their money to their husbands. One (divorced) woman joked that if women gave their money to their husbands, they would only get a little back; and another remarked that she controlled her income as otherwise her husband would spend it on beer. .
22
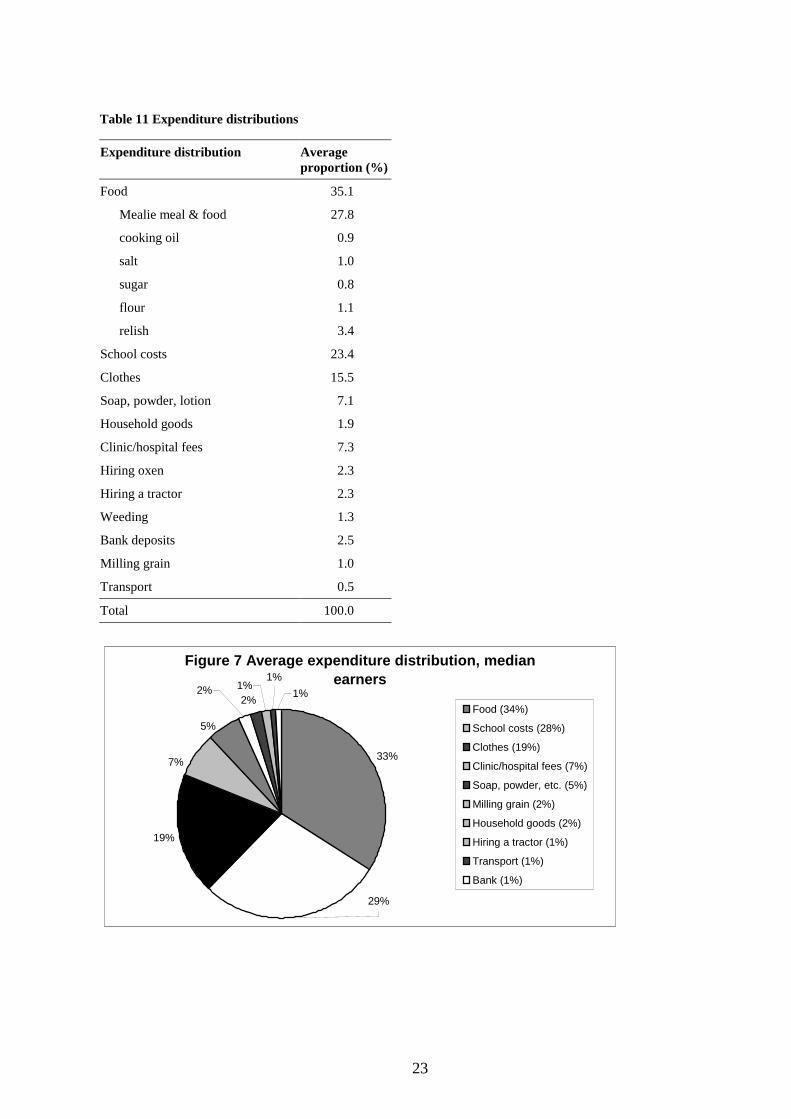
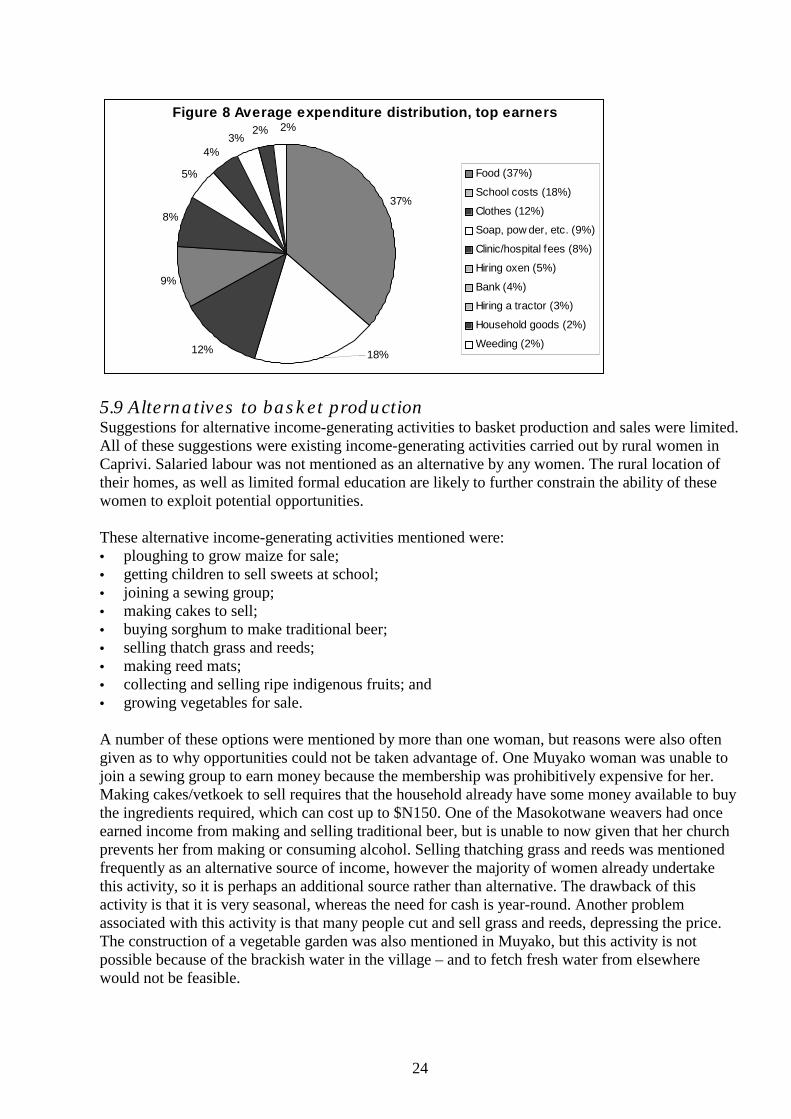
5.8 Expenditure distributions On average, the most important expenditure item is food – and of that, most money is spent by the household on maize meal and relish (see Table 11). Food items other than maize or relish were mentioned by those who prepared vetkoek for sale and included the required ingredients in their expenditure distribution. For both the top and median earners, food is the largest expenditure, using up to 70 per cent7 and 45 per cent respectively. See Figure 7 for the average expenditure distribution of median earners and Figure 8 for that of the top earners. The next most important item is school costs – school fees, uniforms and for those with high school aged children, hostel costs. For those women incurring school costs, they accounted for between eight and 56 per cent for median earners and 10 to 45 per cent for high earners. Most women mentioned that school fees were the most important expenditure item, in that they were the first thing to be paid from income earned, before anything else was purchased. Of the 24 women interviewed, 19 had children, grandchildren or other family they had to pay school costs for. Only three women did not mention school costs; all of these were top earners. Clothes are the third largest expenditure for both groups, making up 12 and 19 per cent on average for top and median earners respectively. Soap, washing powder and body lotion; clinic/hospital fees rank fourth and fifth for both groups. Clinic and hospital fees were mentioned as important, because money had to be saved in case of emergencies. Other expenditure items mentioned included hiring oxen to plough fields (three women); hiring a tractor to plough fields (two women); purchase of household goods (e.g. furniture and domestic consumables, as well as one mention of a water tank) (five women); paying for labour to weed fields (two women); and bank deposits. Only two women included bank deposits in their expenditure distributions, but one woman also gave her expenditure distribution as what was left after her bank deposits. Paying to have grain milled and transport were also mentioned. At the time of the fieldwork, RF were in the process of changing their quarterly buying programme. As a result, a buying trip schedule for November was cancelled. The women interviewed were very vocal about expressing their concern – reporting that people were wondering when RF would come to buy again, as the money was needed to help with ploughing and a replacement trip early the following year would be too late.
7 Only one woman did not mention food as an expenditure item.
23
Table 11 Expenditure distributions
Expenditure distribution Average proportion (%)
Food 35.1
Mealie meal & food 27.8
cooking oil 0.9
salt 1.0
sugar 0.8
flour 1.1
relish 3.4
School costs 23.4
Clothes 15.5
Soap, powder, lotion 7.1
Household goods 1.9
Clinic/hospital fees 7.3
Hiring oxen 2.3
Hiring a tractor 2.3
Weeding 1.3
Bank deposits 2.5
Milling grain 1.0
Transport 0.5
Total 100.0
Figure 7 Average expenditure distribution, median earners
33%
19%
2%1%
1%2%
29%
1%
5%
7%
Food (34%)
School costs (28%)
Clothes (19%)
Clinic/hospital fees (7%)
Soap, powder, etc. (5%)
Milling grain (2%)
Household goods (2%)
Hiring a tractor (1%)
Transport (1%)
Bank (1%)
24
Figure 8 Average expenditure distribution, top earners
37%
12%
9%
8%
5%
4%3%
2% 2%
18%
Food (37%)
School costs (18%)
Clothes (12%)
Soap, pow der, etc. (9%)
Clinic/hospital fees (8%)
Hiring oxen (5%)
Bank (4%)
Hiring a tractor (3%)
Household goods (2%)
Weeding (2%)
5.9 Alternatives to basket production Suggestions for alternative income-generating activities to basket production and sales were limited. All of these suggestions were existing income-generating activities carried out by rural women in Caprivi. Salaried labour was not mentioned as an alternative by any women. The rural location of their homes, as well as limited formal education are likely to further constrain the ability of these women to exploit potential opportunities. These alternative income-generating activities mentioned were: • ploughing to grow maize for sale; • getting children to sell sweets at school; • joining a sewing group; • making cakes to sell; • buying sorghum to make traditional beer; • selling thatch grass and reeds; • making reed mats; • collecting and selling ripe indigenous fruits; and • growing vegetables for sale. A number of these options were mentioned by more than one woman, but reasons were also often given as to why opportunities could not be taken advantage of. One Muyako woman was unable to join a sewing group to earn money because the membership was prohibitively expensive for her. Making cakes/vetkoek to sell requires that the household already have some money available to buy the ingredients required, which can cost up to $N150. One of the Masokotwane weavers had once earned income from making and selling traditional beer, but is unable to now given that her church prevents her from making or consuming alcohol. Selling thatching grass and reeds was mentioned frequently as an alternative source of income, however the majority of women already undertake this activity, so it is perhaps an additional source rather than alternative. The drawback of this activity is that it is very seasonal, whereas the need for cash is year-round. Another problem associated with this activity is that many people cut and sell grass and reeds, depressing the price. The construction of a vegetable garden was also mentioned in Muyako, but this activity is not possible because of the brackish water in the village – and to fetch fresh water from elsewhere would not be feasible.
25
Though basket production was often said to be a time-consuming and low return activity, it is an accessible option to many women. As it is a nature based craft activity, the capital required is minimal – the only input being the awl, which costs approximately $N12 and for some women the cost of the permission from the Khuta to harvest palm. The latter does not need to be paid upfront but can be paid after baskets sales. Apart from harvesting the palm, preparation of the palm for weaving and weaving itself can be carried out from women’s homes and the only cost of this is the opportunity cost of the time that it takes to collect and prepare the materials and weave the basket. This opportunity cost appears to be low given the limited alternatives for income generation by the women. 5.10 Impacts of basket income The women who make and sell baskets spend their income on the well-being of their families – buying food and clothing and paying clinic and school fees – which greatly increases the positive impacts of this income. It has been observed that basket buying sessions attract local entrepreneurs, selling vegetables, dried fish and vetkoek to the basket producers. Elsewhere, it has been observed that those waiting for payment from households earning craft income (e.g. herders) attend the basket buying sessions. RF buying trips in the Kavango are accompanied by similar mini-markets, which includes the sale of palm material by young men to women. The creation of a local savings and credit scheme to enable the weavers to control the use of their money (rather than giving it to their husbands) was also stimulated. (C. Paxton, pers. comm.). 6. CONCLUSIONS The commercialisation of craft production as a component of the Namibian CBNRM Programme has provided the opportunity for craft producers in Caprivi to derive a cash income by selling their produce. The total figures from sales of baskets to the RF in Caprivi are impressive. In addition, the number of basket producers has grown from an estimated 50 in 1994 (Terry et al., 1994) to over 500 producers selling to the RF in 2001. This has had a positive impact on, and diversified, the livelihoods of producers, especially those who sell baskets regularly. The amount of money generally generated by individual women from basket production is often small compared to other income sources such as pensions. Producers do not earn enough to make major investments in assets such as purchasing cattle. There is unequal earning potential amongst producers – although there are a large number of individuals selling to RF, there are a relatively small number of consistently high producers. Basket production and selling is a supplementary activity that is time-consuming and brings low returns. Nevertheless, women can prepare the palm and weave from home as basket production is an activity that fits in with the women’s traditional roles of homemaker and childminder. This has also been found to be the case in Botswana (Cassidy, 2000). Social capital as well as individual skills is also likely to have been strengthened through the development of producer groups which act to monitor resource management, weaving quality and the organisation of sales. There is a strong need to integrate women into the development process in Namibia, particularly as they are the main users of natural resources and producers of the domestically consumed product (Andima, 1992). Producing and selling craft is a marginal activity, but one available to women with few resources, which is not reliant on seasonally available materials. It is also an activity that appears to reduce vulnerability among households earning cash from basket sales. Support for the development of alternative income generating activities that are less marginal is strongly recommended. Some ideas from the women interviewed include sewing and food preparation. Increased sustainable harvesting, possible cultivation, processing, use and marketing of indigenous
26
botanical resources was identified as the most important and significant category of opportunities for beneficial micro-enterprise development at all household levels in the Caprivi (CRIAA SA-DC, 2000). Apart from cash generation, indirect benefits of the craft programme include increasing rural women’s sense of pride and identity. Women showed a sense of achievement when recognising from photographs their baskets that had been exhibited in the annual basket exhibition in Windhoek. At least one woman is a proud member of the Masokotwane basket group and would like to have a basket on her coffin to show that she was a weaver. Craft production also works to maintain a strong traditional, cultural practice. Another likes to make baskets because it is the traditional way of the elders – her grandmother taught her mother, who then taught her and she will teach her daughter. The impact of the RF Craft Development Programme in Caprivi is considerable as it has enabled poor women to derive an income that is used to support their families. This takes place in an environment where the women have little access to wage labour and few other income generating alternatives. However, individual incomes from basket sales are relatively low compared to wage labour and pensions. Basket production for all but a small number of women is likely to remain a supplementary livelihood activity as the majority of weavers do not earn large amounts of cash by selling baskets. Over 550 women have received cash upfront for baskets they have produced with over 40 earning more than $N1,000 between June 1998 and December 2001. In the context of benefits from community wildlife management (CWM), small amounts of cash to poor people has been recognised as being of great significance. Roe reports that, ‘the level and type of economic benefits generated by CWM varies enormously according to the type of initiative. Per capita or per household income may be small, but when viewed against potential income from other sources may be locally very significant and small benefits at crucial times can be of greatest value to the poorest sector of the community’ (2002:2). The average CAMPFIRE household dividend in 1996 was $US5. Ashley commented that ‘plant-based CBNRM activities are particularly important for those who rely on occasional sales for their cash. Development of new products, processing and markets, can help households to earn an extra few hundreds of dollars a year. Such amounts are small but could significantly reduce insecurity or the impact of drought for some in this vulnerable group’ (1997:v). Flintan recognised that though ‘the amount generated may not appear large – for the poorest amongst the communities it is certainly very beneficial. Reliance on income generation through products such as baskets means that the money/benefits can be easily returned to the producer. This proves more difficult when dividing out money/benefits from e.g. campsites and/or sport hunting’(2001:12). More importantly however is that the vast majority of craft producers who have sold baskets to the RF are women. These women spend their income on the well-being of their families (the women buy food and clothing and pay clinic and school fees), which greatly increases the desired development impact of this income. The limited livestock holding capacity of the sample of high and middle income earners interviewed in this survey indicates that these craft producers are more likely to come from less secure households than more secure households. Use of their earnings on meeting their families basic needs contributes to alleviation of poverty. The costs of the expansion of the producer base has been subsidised by donor funding. RF cannot service 16 villages as a long-term option. There is a tension between the need to ‘commercialise’ the basket procurement business to make it sustainable and the need to retain strong conservation and development objectives. With the reduction in donor funding and surplus of lower grade
27
baskets, RF is in a position to only buy the better quality baskets and thus reduce the producer base considerably. Strategically managing the change in the RF craft development programme in Caprivi could assist in maintaining the positive development impact. This strategic management should include such things as accessing alternative markets for lower grade baskets in order to maintain the magnitude of sales, diversification of products and the continuation of RFs training programme to upgrade the skill of the producers. Continuing to assist with the organisational requirements needed to centralise sales to reduce the transport costs (including encouraging the continued assistance of Salambala Conservancy staff and vehicle) and continued efforts to reduce the transport constraints should also be considerations. Mud Hut Trading runs as a business and as such, RF is constrained by the need to protect its investment in the craft programme to continue to access good quality craft in a competitive environment. The budget for the RF Craft Development Programme is modest compared to the expenditure on other components of the CBNRM Programme. The transaction costs for the Rössing Foundation Craft Development Programme are likely to be much lower than other components of the Namibian CBNRM Programme (K. le Roux, pers. comm.) and the individual benefits much higher. It is in this context that it could be argued that continued donor support is warranted, especially in the transition stage to a more sustainable marketing and producer operation. The presence of a conservancy is not necessary for a successful craft programme. The five Masokotwane producer groups flourish in an area with no conservancy and sustaining harvesting techniques are enforced. The Muyako producer group was established prior to the Salambala Conservancy. The Rössing Foundation spent $N60,000 in over ten villages in the Salambala Conservancy from June 1998 to end of 2001. The conservancy staff (Community Resource Monitors) assist Rössing Foundation staff in training and buying, both inside and outside the conservancy (including Masokotwane). The Rössing Foundation extended their craft programme from one village (Muyako) to 10 villages within the conservancy at the request of the Conservancy Committee. Conservancy staff are working with Rössing Foundation staff to develop a more sustainable craft buying operation, mainly focussing on a centralised buying and distribution of payments system with transport assistance from the conservancy vehicle Collective management of producers shows itself in the organisation of women for central buying and training (including grading and quality control, design development and sustainable harvesting techniques). Women often collect palm together for safety, companionship and sharing transport. In Masokotwane, the producer groups pay the Khuta for use of the palm resource in return for their custodianship. The Traditional Authorities in both case-study areas are supportive of the craft programme. The precursor to the five producer groups was the women selling to CACA. There is some co-operation between these five groups but their relationship has also been conflictual. The craft programme in Caprivi has helped strengthen the role of women in CBNRM in Namibia by providing a role for conservancy staff (Community Resource Monitors) to support the craft industry and monitor natural resources (Flintan, 2001). Another advantage has been that it has worked to diversify the emphasis on large mammals within the Namibian CBNRM programme. The natural resource implications of the craft programme in Caprivi are not known. A participatory study of the extent, accessibility, use and conservation of major harvesting locations is warranted.
28
7. REFERENCES Andima, J. (1992) ‘The integration of women into the rural development process.’ NEPRU Working
Paper No 4. Windhoek: NEPRU. Ashley, C. and La Franchi, C. (1997) ‘Livelihood strategies of rural households in Caprivi:
Implications for conservancies and natural resource management.’ DEA Research Discussion Paper No 20. Windhoek: MET.
Ashley, C. (1999a) Financial and livelihood impacts of butterfly farming at Arabuko Sokoke Forest. Nairobi: African Wildlife Foundation.
Ashley, C. (1999b) Handbook for assessing the economic and livelihood impacts of wildlife enterprises. Nairobi: African Wildlife Foundation.
Cassidy, L. (2001) ‘Improving women’s participation in CBNRM in Botswana’. Paper presented at Governance and CBNRM. 10–14 September 2001, Cape Town.
CRIAA SA-DC (2000) ‘Opportunities and support services capacity for rural micro-enterprise development in the Kavango and Caprivi Regions, Namibia’. Prepared for DFID–Southern African Namibia Field Office.
DFID (1999) Sustainable livelihood guidance sheet’. London: DFID. Flintan, F. (2001) ‘Women and CBNRM in Namibia. A case-study of the IRDNC Community
Resource Monitor Project’. Working Paper No. 2. Cork: The International Famine Centre, University College Cork, Ireland.
Hines, C.J.H. and Cunningham, A.B. (1992) ‘Harvesting palm leaves in the Mahango Game Reserve’. Proposal for the Ministry of Environment and Tourism. Windhoek: MET.
Murphy, C., Mulonga, S. and, Abbott, J. (2002) ‘Information gathering workshops with representatives of Salambala Conservancy’ Unpublished: WILD Project, MET.
Murphy, C and Mulonga, S. (2002) ‘Livelihood profile – experience from two conservancies in Caprivi’. Unpublished: WILD Project, MET.
Mosimane, A.W. (1996) ‘Socio-economic status of the use of natural resources in the proposed Salambala Conservancy’. Windhoek: Multi-disciplinary Research Centre, University of Namibia.
Government of the Republic of Namibia (1997) National Gender Policy. Windhoek: Office of the President. Roe, D. (2001) ‘Community based wildlife management: Improved livelihoods and wildlife
conservation? Bio-brief No 1. London: IIED. Stone, S. and Gaomab (1994) ‘Poverty and income distribution in Namibia’. NEPRU Working
Paper No. 31. Windhoek: NEPRU. Turpie, J., Smith, B., Emerton, L. and Barnes J.I. (1999) The economic value of the Zambezi Basin
Wetlands. Cape Town: University of Cape Town/IUCN Regional Office for Southern Africa. Terry, M.E, Lee, F.J. and Le Roux, K. (1994) ‘A survey of natural resource based craft production
and marketing in Namibia’. Windhoek: WWF-LIFE/Rössing Foundation.
29
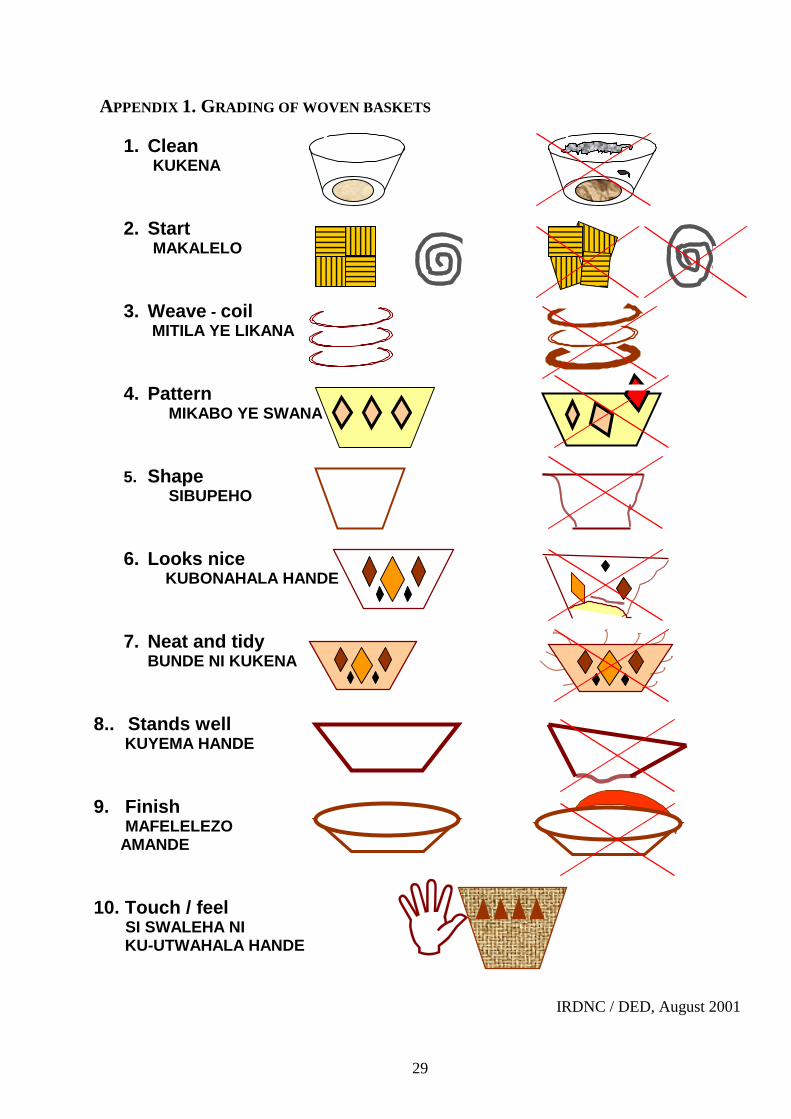
APPENDIX 1. GRADING OF WOVEN BASKETS
1. Clean KUKENA
2. Start MAKALELO
3. Weave - coil MITILA YE LIKANA
4. Pattern
MIKABO YE SWANA
5. Shape
SIBUPEHO
6. Looks nice KUBONAHALA HANDE
7. Neat and tidy BUNDE NI KUKENA
8.. Stands well KUYEMA HANDE 9. Finish MAFELELEZO AMANDE 10. Touch / feel SI SWALEHA NI KU-UTWAHALA HANDE
IRDNC / DED, August 2001
,
30
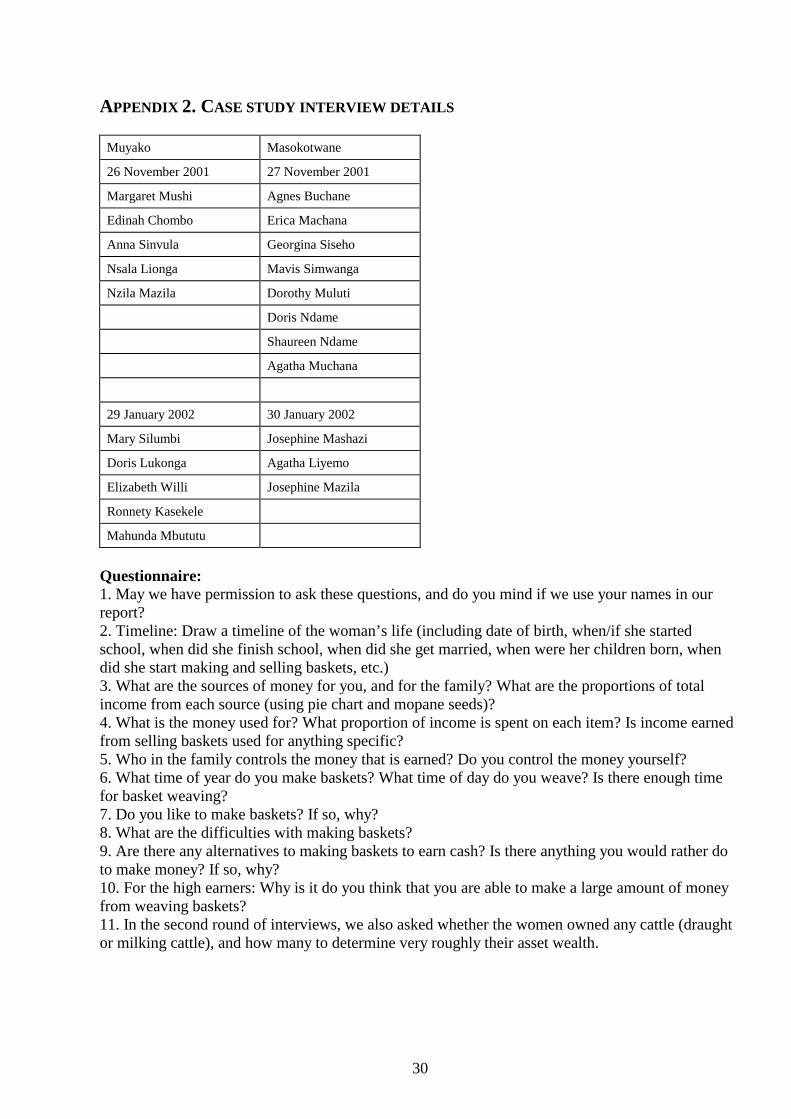
APPENDIX 2. CASE STUDY INTERVIEW DETAILS Muyako Masokotwane
26 November 2001 27 November 2001
Margaret Mushi Agnes Buchane
Edinah Chombo Erica Machana
Anna Sinvula Georgina Siseho
Nsala Lionga Mavis Simwanga
Nzila Mazila Dorothy Muluti
Doris Ndame
Shaureen Ndame
Agatha Muchana
29 January 2002 30 January 2002
Mary Silumbi Josephine Mashazi
Doris Lukonga Agatha Liyemo
Elizabeth Willi Josephine Mazila
Ronnety Kasekele
Mahunda Mbututu
Questionnaire: 1. May we have permission to ask these questions, and do you mind if we use your names in our report? 2. Timeline: Draw a timeline of the woman’s life (including date of birth, when/if she started school, when did she finish school, when did she get married, when were her children born, when did she start making and selling baskets, etc.) 3. What are the sources of money for you, and for the family? What are the proportions of total income from each source (using pie chart and mopane seeds)? 4. What is the money used for? What proportion of income is spent on each item? Is income earned from selling baskets used for anything specific? 5. Who in the family controls the money that is earned? Do you control the money yourself? 6. What time of year do you make baskets? What time of day do you weave? Is there enough time for basket weaving? 7. Do you like to make baskets? If so, why? 8. What are the difficulties with making baskets? 9. Are there any alternatives to making baskets to earn cash? Is there anything you would rather do to make money? If so, why? 10. For the high earners: Why is it do you think that you are able to make a large amount of money from weaving baskets? 11. In the second round of interviews, we also asked whether the women owned any cattle (draught or milking cattle), and how many to determine very roughly their asset wealth.
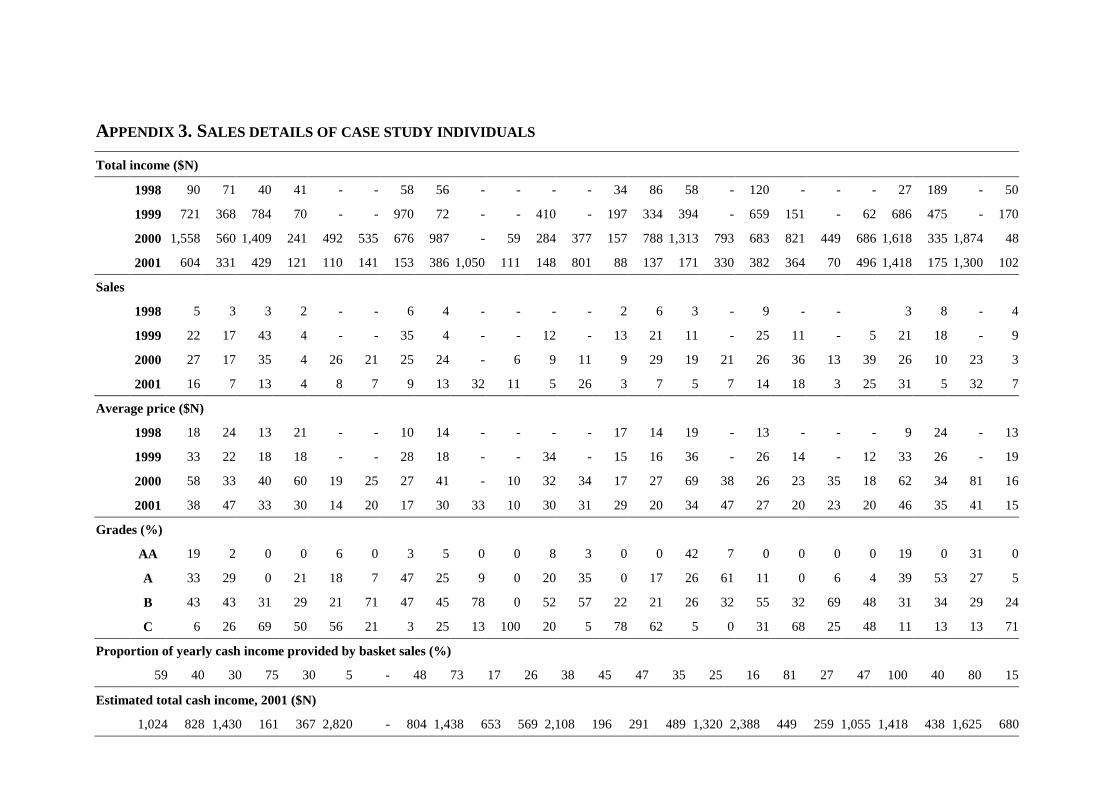
APPENDIX 3. SALES DETAILS OF CASE STUDY INDIVIDUALS
Total income ($N)
1998 90 71 40 41 - - 58 56 - - - - 34 86 58 - 120 - - - 27 189 - 50
1999 721 368 784 70 - - 970 72 - - 410 - 197 334 394 - 659 151 - 62 686 475 - 170
2000 1,558 560 1,409 241 492 535 676 987 - 59 284 377 157 788 1,313 793 683 821 449 686 1,618 335 1,874 48
2001 604 331 429 121 110 141 153 386 1,050 111 148 801 88 137 171 330 382 364 70 496 1,418 175 1,300 102
Sales
1998 5 3 3 2 - - 6 4 - - - - 2 6 3 - 9 - - 3 8 - 4
1999 22 17 43 4 - - 35 4 - - 12 - 13 21 11 - 25 11 - 5 21 18 - 9
2000 27 17 35 4 26 21 25 24 - 6 9 11 9 29 19 21 26 36 13 39 26 10 23 3
2001 16 7 13 4 8 7 9 13 32 11 5 26 3 7 5 7 14 18 3 25 31 5 32 7
Average price ($N)
1998 18 24 13 21 - - 10 14 - - - - 17 14 19 - 13 - - - 9 24 - 13
1999 33 22 18 18 - - 28 18 - - 34 - 15 16 36 - 26 14 - 12 33 26 - 19
2000 58 33 40 60 19 25 27 41 - 10 32 34 17 27 69 38 26 23 35 18 62 34 81 16
2001 38 47 33 30 14 20 17 30 33 10 30 31 29 20 34 47 27 20 23 20 46 35 41 15
Grades (%)
AA 19 2 0 0 6 0 3 5 0 0 8 3 0 0 42 7 0 0 0 0 19 0 31 0
A 33 29 0 21 18 7 47 25 9 0 20 35 0 17 26 61 11 0 6 4 39 53 27 5
B 43 43 31 29 21 71 47 45 78 0 52 57 22 21 26 32 55 32 69 48 31 34 29 24
C 6 26 69 50 56 21 3 25 13 100 20 5 78 62 5 0 31 68 25 48 11 13 13 71
Proportion of yearly cash income provided by basket sales (%)
59 40 30 75 30 5 - 48 73 17 26 38 45 47 35 25 16 81 27 47 100 40 80 15
Estimated total cash income, 2001 ($N)
1,024 828 1,430 161 367 2,820 - 804 1,438 653 569 2,108 196 291 489 1,320 2,388 449 259 1,055 1,418 438 1,625 680
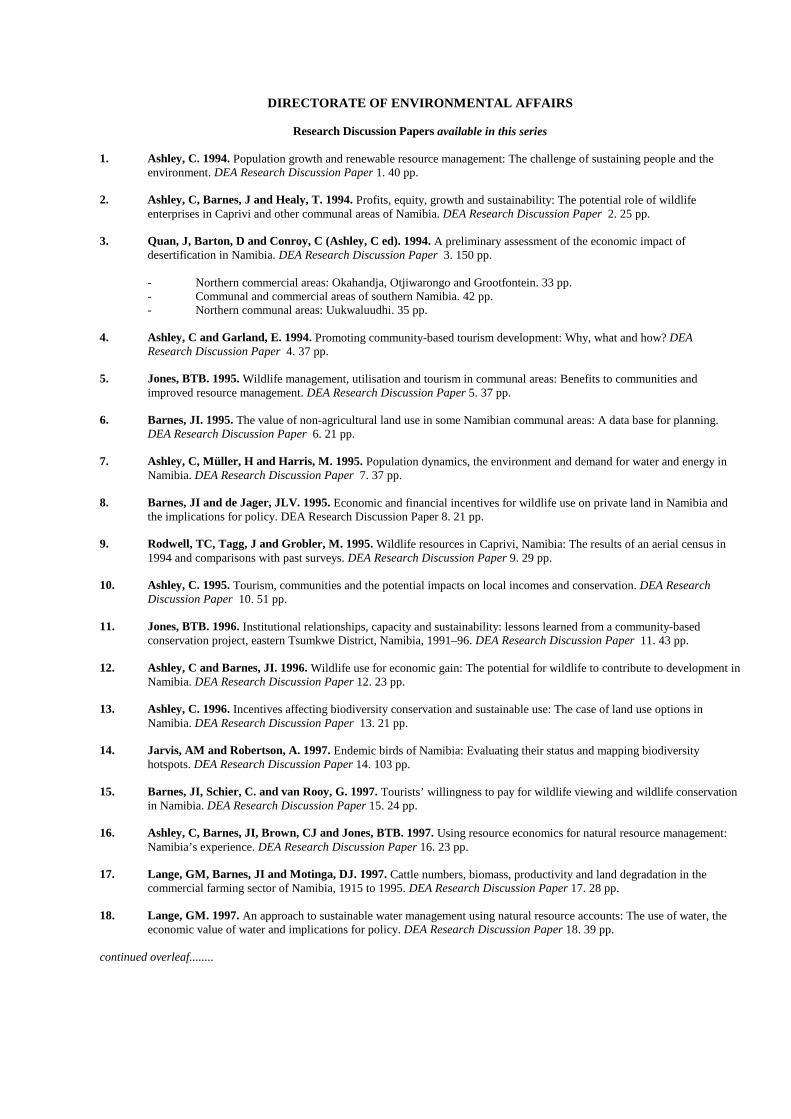
DIRECTORATE OF ENVIRONMENTAL AFFAIRS
Research Discussion Papers available in this series 1. Ashley, C. 1994. Population growth and renewable resource management: The challenge of sustaining people and the
environment. DEA Research Discussion Paper 1. 40 pp. 2. Ashley, C, Barnes, J and Healy, T. 1994. Profits, equity, growth and sustainability: The potential role of wildlife
enterprises in Caprivi and other communal areas of Namibia. DEA Research Discussion Paper 2. 25 pp. 3. Quan, J, Barton, D and Conroy, C (Ashley, C ed). 1994. A preliminary assessment of the economic impact of
desertification in Namibia. DEA Research Discussion Paper 3. 150 pp. - Northern commercial areas: Okahandja, Otjiwarongo and Grootfontein. 33 pp.
- Communal and commercial areas of southern Namibia. 42 pp. - Northern communal areas: Uukwaluudhi. 35 pp. 4. Ashley, C and Garland, E. 1994. Promoting community-based tourism development: Why, what and how? DEA
Research Discussion Paper 4. 37 pp. 5. Jones, BTB. 1995. Wildlife management, utilisation and tourism in communal areas: Benefits to communities and
improved resource management. DEA Research Discussion Paper 5. 37 pp. 6. Barnes, JI. 1995. The value of non-agricultural land use in some Namibian communal areas: A data base for planning.
DEA Research Discussion Paper 6. 21 pp. 7. Ashley, C, Müller, H and Harris, M. 1995. Population dynamics, the environment and demand for water and energy in
Namibia. DEA Research Discussion Paper 7. 37 pp. 8. Barnes, JI and de Jager, JLV. 1995. Economic and financial incentives for wildlife use on private land in Namibia and
the implications for policy. DEA Research Discussion Paper 8. 21 pp. 9. Rodwell, TC, Tagg, J and Grobler, M. 1995. Wildlife resources in Caprivi, Namibia: The results of an aerial census in
1994 and comparisons with past surveys. DEA Research Discussion Paper 9. 29 pp. 10. Ashley, C. 1995. Tourism, communities and the potential impacts on local incomes and conservation. DEA Research
Discussion Paper 10. 51 pp. 11. Jones, BTB. 1996. Institutional relationships, capacity and sustainability: lessons learned from a community-based
conservation project, eastern Tsumkwe District, Namibia, 1991–96. DEA Research Discussion Paper 11. 43 pp. 12. Ashley, C and Barnes, JI. 1996. Wildlife use for economic gain: The potential for wildlife to contribute to development in
Namibia. DEA Research Discussion Paper 12. 23 pp. 13. Ashley, C. 1996. Incentives affecting biodiversity conservation and sustainable use: The case of land use options in
Namibia. DEA Research Discussion Paper 13. 21 pp. 14. Jarvis, AM and Robertson, A. 1997. Endemic birds of Namibia: Evaluating their status and mapping biodiversity
hotspots. DEA Research Discussion Paper 14. 103 pp. 15. Barnes, JI, Schier, C. and van Rooy, G. 1997. Tourists’ willingness to pay for wildlife viewing and wildlife conservation
in Namibia. DEA Research Discussion Paper 15. 24 pp. 16. Ashley, C, Barnes, JI, Brown, CJ and Jones, BTB. 1997. Using resource economics for natural resource management:
Namibia’s experience. DEA Research Discussion Paper 16. 23 pp. 17. Lange, GM, Barnes, JI and Motinga, DJ. 1997. Cattle numbers, biomass, productivity and land degradation in the
commercial farming sector of Namibia, 1915 to 1995. DEA Research Discussion Paper 17. 28 pp. 18. Lange, GM. 1997. An approach to sustainable water management using natural resource accounts: The use of water, the
economic value of water and implications for policy. DEA Research Discussion Paper 18. 39 pp. continued overleaf........
Other Research Discussion Papers in this series (continued)...... 19. Lange, GM and Motinga, DJ. 1997. The contribution of resource rents from minerals and fisheries to sustainable
economic development in Namibia. DEA Research Discussion Paper 19. 32 pp. 20. Ashley, C and LaFranchi, C. 1997. Livelihood strategies of rural households in Caprivi: Implications for conservancies
and natural resource management. DEA Research Discussion Paper 20. 96 pp. 21. Byers, BA (Roberts, CS, ed.) 1997. Environmental threats and opportunities in Namibia: A comprehensive assessment.
DEA Research Discussion Paper 21. 65 pp. 22. Day, JA (Barnard, P, ed). 1997. The status of freshwater resources in Namibia. DEA Research Discussion Paper 22. 46
pp. 23. O’Toole, MJ (Barnard, P, ed). 1997. Marine environmental threats in Namibia. DEA Research Discussion Paper 23. 48
pp. 24. Jones, BTB. 1997. Parks and resident peoples. Linking Namibian protected areas with local communities. DEA Research
Discussion Paper 24. 39 pp. 25. Environmental Evaluation Unit, University of Cape Town (Tarr, JG, ed.) 1998. Summary report of a retrospective
study of the environmental impacts of emergency borehole supply in the Gam and Khorixas areas of Namibia. DEA Research Discussion Paper 25. 27 pp.
26. Auer, C. 1998. Water availability and chemical water quality as important factors for sustainable wildlife management in
the Etosha National Park and for domestic stock in farming areas of Namibia. DEA Research Discussion Paper 26. 30 pp. 27. Barnes, JI. 1998. Wildlife conservation and utilisation as complements to agriculture in southern African development.
DEA Research Discussion Paper 27. 18 pp 28. Blackie, R and Tarr, P. 1998. Government policies on sustainable development in Namibia. DEA Research Discussion
Paper 28. 21 pp. 29. Blackie, R. 1998. Communities and natural resources: Trends in equitable and efficient use. DEA Research Discussion
Paper 29, in press. 30. Tarr, P. 1999. Knowledge, opinions and attitudes regarding Environmental Assessment in Namibia: Results of a national
survey conducted in 1997. DEA Research Discussion Paper 30. 20 pp. 31. Simmons, RE, Barnes, KN, Jarvis, AM and Robertson, A. 1999. Important bird areas in Namibia. DEA Research
Discussion Paper 31. 66 pp. 32. Environmental and Geographical Science Masters Students, University of Cape Town (Blackie, R, ed). 1999. A
preliminary environmental assessment of Namibia’s resettlement programme. DEA Research Discussion Paper 32, 29 pp. 33. Robertson, A and Jarvis, AM. 1999. Bird data in Namibia: A model for biodiversity information system development.
Avifaunal database user manual. DEA Research Discussion Paper 33. 122 pp. 34. Tarr, P and Figueira, M. 1999. Namibia’s Environmental Assessment framework: The evolution of policy and practice.
DEA Research Discussion Paper 34. 20 pp. 35. Margules, CR (Barnard, P, ed). 1999. Biodiversity planning and monitoring in Namibia. DEA Research Discussion
Paper 35. 27 pp. 36. Nghileendele, NP and Uisso, V. 1999. The state of Namibia’s freshwater environment. DEA Research Discussion Paper
36. 37. Nghileendele, NP and Uisso, V. 1999. The state of Namibia’s socio-economic environment. DEA Research Discussion
Paper 37. 38. McGann, JA. 1999. The Environmental Investment Fund: An initiative for the conservation and protection of the
environmental and natural resource base of Namibia. DEA Research Discussion Paper 38. 57 pp. continued overleaf.........
Other Research Discussion Papers in this series (continued)...... 39. McGann, JA. 1999. Towards the establishment of the Environmental Investment Fund: Opportunities, constraints, and
lessons learned. DEA Research Discussion Paper 39. 47 pp. 40. Jones, BTB and Mosimane, A. 2000. Empowering communities to manage natural resources: where does the new power
lie? Case studies from Namibia. DEA Research Discussion Paper 40. 32 pp. 41. Corbett, A and Jones, BTB. 2000. The legal aspects of governance in CBNRM in Namibia. DEA Research Discussion
Paper 41. 25 pp. 42. Barnes, JI., MacGregor, J. and Weaver, LC. 2001. Economic analysis of community wildlife use initiatives in Namibia.
DEA Research Discussion Paper 42. 20pp 43. Poonyth, D., Barnes, JI., Suich, H. and Monamati, M. 2001. Satellite and resource accounting as tools for tourism
planning in southern Africa. DEA Research Discussion Paper 43. 21pp. 44. Suich, H. 2001. Development of preliminary tourism satellite accounts for Namibia. DEA Research Discussion Paper 44.
20pp. 45. Krug W., Suich H and Haimbodi, N. 2002. Park pricing and economic efficiency in Namibia. DEA Research Discussion
Paper 45. 31pp.
46. Krugman, H. 2002. Fundamental issues and the threats to sustainable development in Namibia. DEA Research Discussion Paper 46. 50pp.
47. Humavindu, MN. 2002. An econometric analysis of fixed investment in Namibia. DEA Research Discussion Paper 47. 22pp.
48. Suich, H and Murphy, C. 2002. Crafty women: The livelihood impact of craft income in Caprivi. DEA Research
Discussion Paper 48. 31pp.