Embed Size (px)
Citation preview

REPORT ON CPRC WORKSHOP ON
PANEL SURVEYS AND LIFE HISTORY METHODS
Held at the Overseas Development Institute, London
24-25th February 2006
Edited by Bob Baulch and Lucy Scott

Contents Workshop Objectives and Agenda
1
Presentations, Comments and Discussion
3
Summary and Implications for CPRC Research
28
List of Participants
32
Bibliography
33
1
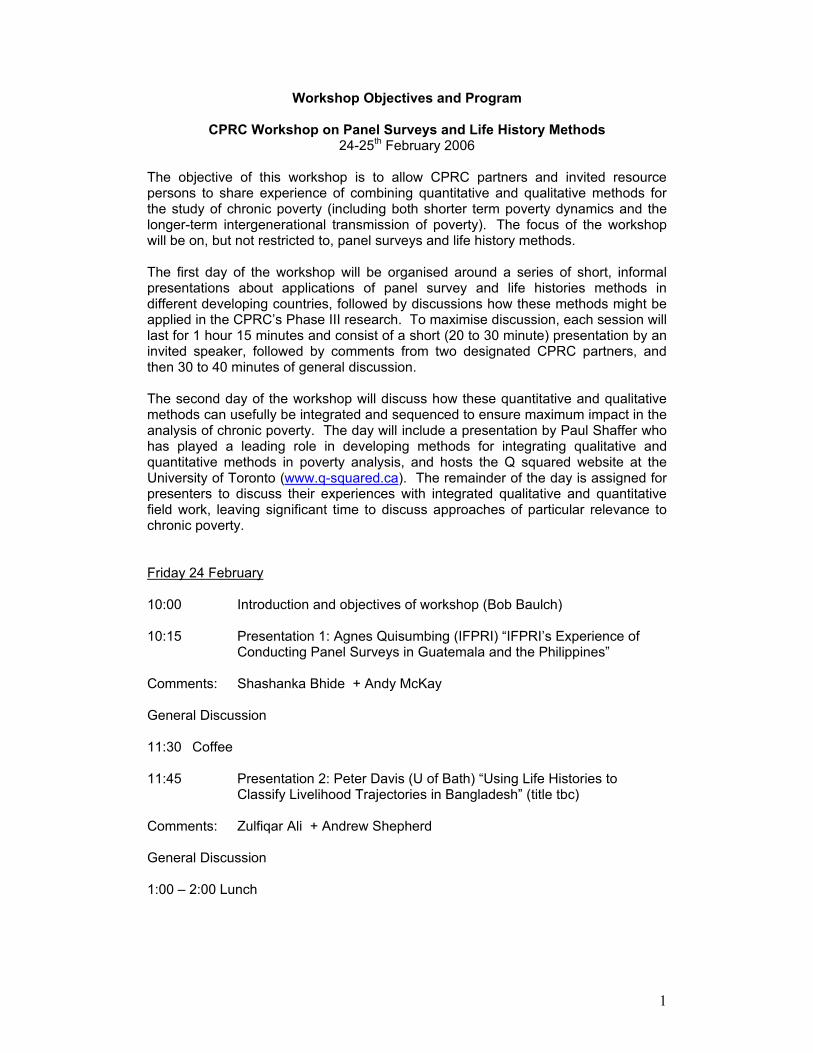
Workshop Objectives and Program
CPRC Workshop on Panel Surveys and Life History Methods 24-25th February 2006
The objective of this workshop is to allow CPRC partners and invited resource persons to share experience of combining quantitative and qualitative methods for the study of chronic poverty (including both shorter term poverty dynamics and the longer-term intergenerational transmission of poverty). The focus of the workshop will be on, but not restricted to, panel surveys and life history methods. The first day of the workshop will be organised around a series of short, informal presentations about applications of panel survey and life histories methods in different developing countries, followed by discussions how these methods might be applied in the CPRC’s Phase III research. To maximise discussion, each session will last for 1 hour 15 minutes and consist of a short (20 to 30 minute) presentation by an invited speaker, followed by comments from two designated CPRC partners, and then 30 to 40 minutes of general discussion. The second day of the workshop will discuss how these quantitative and qualitative methods can usefully be integrated and sequenced to ensure maximum impact in the analysis of chronic poverty. The day will include a presentation by Paul Shaffer who has played a leading role in developing methods for integrating qualitative and quantitative methods in poverty analysis, and hosts the Q squared website at the University of Toronto (www.q-squared.ca). The remainder of the day is assigned for presenters to discuss their experiences with integrated qualitative and quantitative field work, leaving significant time to discuss approaches of particular relevance to chronic poverty.
Friday 24 February 10:00 Introduction and objectives of workshop (Bob Baulch) 10:15 Presentation 1: Agnes Quisumbing (IFPRI) “IFPRI’s Experience of
Conducting Panel Surveys in Guatemala and the Philippines” Comments: Shashanka Bhide + Andy McKay General Discussion 11:30 Coffee 11:45 Presentation 2: Peter Davis (U of Bath) “Using Life Histories to
Classify Livelihood Trajectories in Bangladesh” (title tbc) Comments: Zulfiqar Ali + Andrew Shepherd General Discussion 1:00 – 2:00 Lunch
2
2:00 Presentation 3: Bereket Kebede (U of East Anglia) “Collecting panel data in Africa: the case of the Ethiopian Rural Household Survey Panel” Comments: Bob Baulch + Sarah Ssewanyana General Discussion 3:15 Tea 3:30 Presentation 4: Elizabeth Francis (London School of Economics)
“Reflections on Life History Analysis in Kenya and South Africa” Comments: Kate Bird + Andries du Toit General Discussion 4:45 Closing Remarks: Bob Baulch Saturday 25 February 9.30 Introduction: Andy McKay 9.40 Presentation 1: Stefan Dercon (U of Oxford): “Moving on, staying
behind and getting lost: lessons from long-term panel data collection” Comments: Bob Baulch + Shashanka Bhide General discussion 11.00 – 11.30 Coffee 11.30 Presentation 2: Paul Shaffer (U of Toronto): “A survey of recent
experience of combining quantitative and qualitative methods in poverty
analysis” (title tbc) Comments: Anand Kumar + Charles Lwange-Ntale General discussion 12.45 – 1.45 Lunch 1.45 Presentation 3: Andries du Toit (U of Western Cape): “An example of
a theoretically informed integration of qualitative and quantitative data on livelihoods in Ceres, South Africa”
Comments: Kate Bird + Andy McKay General discussion 3:00 Closing remarks: Andy McKay
3
Presentation 1: Agnes Quisumbing (IFPRI) ‘IFPRI’s Experience of Conducting Panel Surveys in Guatemala and the Philippines’ This presentation compared IFPRI’s experience of conducting a very well-funded panel survey in the Oriente region of Guatemala with a more budget constrained survey in the southern Philippines. It argued that cost-effective panel surveys are both possible and instructive.
Guatemala: Human Capital Study The objective was to examine the impact of a nutrition intervention in early childhood on adult human capital and economic productivity. The theoretical framework was that malnutrition in early childhood (in particular, protein energy deficiency) leads to retarded human growth and development, which in turn leads to lower human capital and lower economic productivity in later life. The original study was conducted in four villages in Guatemala between 1969 and 1977 and included children born between 1962 and 1977. To test this hypothesis, 300 villages were screened to identify those of appropriate size, compactness, ethnicity, diet, demographic characteristics, nutritional status and degree of physical isolation. From this, two pairs of comparable villages were selected. Children under seven years old in two villages received a high protein energy drink, atole (a warm gruel) as a dietary supplement. In the other two villages, an alternative drink fresco (a cool, clear coloured and fruit flavoured drink) was provided to children under seven. In 1988 and 1989, a follow-up study was conducted of the children who had received the nutritional supplements. This study involved a range of tests on body composition, skeletal age, schooling and also conducted life histories focusing on migration, work, and reproductive life. Since the children were now aged between 11 and 26, many of them had not stopped growing or studying and so it was difficult to truly assess human capital formation and to link this to economic productivity. A further, more extensive, follow-up study occurred between 2002 and 2004. This aimed to track all the children from the original trial who were still alive and living in Guatemala. 86% of the children from the original trial were traceable, with 77% alive and living in Guatemala (Figure 1). Some 60% of the children were still living in the original four villages. The study obtained detailed information on these individuals including school histories and tests of cognitive ability, literacy and reading comprehension. This was combined with archival data on the dimensions of school quality and qualitative data on changes in livelihoods in the study villages as well as data on household consumption, assets and also tests of physical status and health. The follow-up study was highly interdisciplinary involving nutritionists, epidemiologists, anthropologists, sociologists and economists. Anthropologists played an important role in understanding the links between changes at the community level and ‘critical periods’ in people’s lives. The total cost of conducting all four waves of this panel survey is more than $3 million.

4
Figure 1: Results from the tracing work in Guatemala
1856(77%)
Stayed Guatemala
2393Subjects in 69-77 study-
272(11%)
Died between1969 and 2002
102(4%)
Untraceable
2019Traceable in
2002
163(8%)
Left the Country
1113(60%)
Original Villages
154(8%)
Nearby Villages
419(23%)
In or nearby Guatemala City
170(9%)
Elsewhere Guatemala
Traceable, living in Guatemala
Migrants
The Philippines: Bukidnon Panel Survey The purpose of the original survey conducted between 1984 and 1985 was to examine the effects of commercialisation (especially the shift from subsistence corn production to sugarcane) on income, consumption and nutrition.
The sample was drawn from ten municipalities in Bukidnon Province of Mindanao in the southern Philippines. The sampling was based on (i) the household’s distance from the mill (the high costs of transporting cut cane mean that farmers further from the mill have a lower probability of growing sugar cane) and (ii) whether the household had at least one child less than 5 years old (as the study was interested in examining the impact of commercialization on childhood nutrition). Four survey rounds were conducted between 1984 and 1985, with a sample of 448 households interviewed in all four rounds. A long questionnaire with 12 modules was administered to these households, which often required several visits over a period of a few days. In 1992, a team returned to the same households for a study which focused on adolescents (Bouis et. al. 1998). This consisted of a one round household survey complemented by an ethnographic study. Due to budgetary constraints no information on consumption or income was collected in this round of the survey. In 2003, a further study re-surveyed individuals from the 1984/85 survey. The objective of this follow-up study was to understand how access to rural financial services affected patterns of physical and human capital accumulation, economic mobility and well-being. The survey aimed to study all households from the 1984/85 survey. However, in the 20 years that had elapsed, many of the original households changed, with parents dying and children leaving home to set-up their own households or search for better paid work in the cities. To adjust for this, in addition to the original households, up to two of the children who had formed separate households in the same survey barangay were traced. At least one of these household splits was required to have a pre-schooler in the household. This tracking procedure resulted in a sample size of 572 households: 311 of these being the

5
original households from the 1984/5 survey and 261 being household splits. One of the reasons for the high recontact rate was that many of the 2003 interviewers were the same people who conducted the interviews in 1984/85. They have made return trips to the communities to collect qualitative data in the intervening period between survey rounds. Their knowledge of the context also helps to ensure the quality of the data. However, the design of the 2003 surveys had a flaw – what about children who have moved away from the barangay? If migration is not a random process, this means that any conclusions based on the sample of children tracked within the barangay would be biased. To prepare for a follow-up survey that traced migrants, the survey instruments administered in 2003 also included a module to collect information on the addresses and contact details of household members who had migrated. Using information from this module, the 2004 survey round, funded by a DfID programme on rural-urban linkages, tracked migrants from the original households to urban, rural and peri-urban areas based on the information previously given by their parents or other relatives who had remained in the barangay. This tracking yielded about 75% of migrants. The questionnaire given to them was the similar to the 2003 survey with an additional module on their migration history. The total cost of the 2003-04 Bukidnon surveys is approximately $500,000 including field costs and staff time. Lessons learned from conducting these two surveys:
• If budget constraints are tight, you can prioritise questionnaire modules depending on the survey objective (such as the income module being dropped from the 1992 Bukidnon survey).
• Track individuals rather than households. Households form and dissolve over time. However, be sure to obtain information about the households where individuals are currently living.
• Invest in generating a complete list of individuals who were once household members at the very start, even those who have moved away.
• If you want to track children, ask their parents and siblings for their address, phone numbers, jobs and personal circumstances.
• Invest in a good community study using either qualitative methods or a community questionnaire. This can be ‘mined’ for data on time-varying shocks.
• If children have married and left the household, ask about the transfers of assets their parents have made to them. It you do not do this, you are likely to understate the present asset position of the parents.
• On changing survey objectives over time: one way that IFPRI has typically dealt with different survey objectives is to collect very comprehensive information (subject to funding, of course) so that the surveys can lend themselves to multiple types or topics of analysis. Some modules are repeated without substantial modification to allow comparisons to be made; special modules are added depending on the topic.
COMMENTS Shashanka Bhide (NCAER) Following individuals may not give the whole picture. Household characteristics influence the income of individuals and highlight different characteristics. For instance, remittances may be significant, while household demographics such as the

6
dependency ratio are important when looking at income. Is there also a role for village/ community surveys? Changing the objectives of the survey over time means that you are using an old survey design to test new hypotheses. In some cases, this original survey design will not be suited to the new objective. How comprehensive should the initial survey design be so as to allow flexibility in the objectives? Is it possible to allow for changes that occur in ‘the sampling universe’, such as more villages becoming peri-urban, by supplementing the sample as the panel survey proceeds? Quantitative panel surveys usually looks at just two or three points in time. What happens in-between these times? There is a role for qualitative methods to be used in the intervening period. Qualitative methods may also be more appropriate than questionnaires for investigating social capital issues. Andy McKay (U of Bath) We have to recognise that there are two types of panel survey. The first are purposive panels – as used in the two IFPRI panels – which are designed to answer key questions and relate to specific regions. The second are national panel surveys. The latter aim to be nationally representative and typically ask a larger number of questions, making it difficult to use them to address specific research issues. Migration is very important for the CPRC to capture, as migration is often associated with socio-economic change. So far the CPRC has used relatively short-term panel data which has not tracked migrants. Household splits and sample attrition will become much more serious issues with longer term panel data. GENERAL DISCUSSION Combining Quantitative and Qualitative Methods: Maybe the challenge here is less about the sequencing of different methods and more about what methods you use. Just as important here is the question of what to do at the different stages of the research process: in the design, initial implementation and analysis phases. ‘What’ is perhaps more important than ‘when’. Capturing shocks: How can we best capture the negative shocks that lead to downward mobility? Information on the severity of shocks is often hard to pick up in quantitative data. In the Philippines survey, IFPRI discovered that respondents could give a date/specific time for when serious shocks (such as droughts and illness) had occurred. For less serious shocks, respondents were often vague about the dates. However, IFPRI found it hard to get good information on positive shocks and in the end these were dropped from the shocks module. It’s easier to capture positive shocks in qualitative data. Ensuring Data quality: The challenges of marrying data form different sources needs to be recognised. What people tell you will depend on what you ask them. As you interview, you direct the narrative. The way people tell the story depends on their personality and also on the state of the present; you retrospectively assess a decision with respect to the outcome. We need to challenge the data we can obtain from interviews, life histories and surveys.

7
Interview Length and Ethics: The general consensus was that two hours is the maximum interview length before both respondent and interviewer encounter fatigue. Two hours, though, is a long period of time to take people away from their other activities. Do you pay the respondents or offer them feedback? When offering feedback you then run into problems of confidentiality. Interviews can also be emotionally gruelling when dealing with very poor and distressed people. You draw them through their experience only to walk away, a hour or two later. All IFPRI surveys now undergo ethics reviews. You are not allowed to pay interviewees, but instead, provide in-kind ‘compensation’ or services. In the Guatemala study, for instance, a health clinic was set up in the villages. All medical results are provided to the respondents by trained medical staff while people who are diagnosed with medical conditions are referred for treatment. In the Philippines it is not culturally acceptable to pay people for participation in surveys. However, the project gives gifts that are roughly equivalent to a day’s wage (e.g. wall clocks, utensils, linens, etc.). Presentation 2: Peter Davis (University of Bath) ‘Poverty Dynamics in Bangladesh: Using life history interviews to explore trajectory patterns’ In 1999-2001, I conducted a number of life history interviews in nine sites of Kushtia district in Western Bangladesh as part of my doctoral fieldwork. The aim was to identify episodes of crisis in people’s lives and to analyse the way they coped in order to explore informal forms of social protection. Areas of interest included the importance of informal forms of social protection and its relationship with formal social policy. I wanted to go further than a livelihoods perspective and incorporate the role which power relationships play in social protection. In particular, what does it mean to study social protection in a context of differentiated power? Selection of the Respondents: In each of the nine sites (six villages and three municipal) an initial ‘household census’ of 100 households selected as randomly as possible was carried out. Basic information on each of these households was collected. From the 100 households in each site, 20 households were then randomly selected for more detailed life histories. The 20 households chosen in each site were also ranked according to economic power, coercive resources and social prestige in three focus groups using ranking cards. A total of 242 life history interviews were conducted, of which 90 were particularly detailed. The number of cases in this study means it can be called a ‘medium n’ study. This poses the issues of how do you present the data of these interviews without merely listing cases? How do you keep the depth of intimacy from life history interviews while overcoming issues of representativeness? As Ragin has noted there seems to be a neglected middle between ‘small n’ micro-level studies and ‘large’ n household surveys. Life History Interviews: Life history interviews represent a challenge, particularly in terms of data analysis and aggregation. However, a more detailed interview can take place without boring the interviewee, mainly because people are truly interested in seeing their lives mapped out. Life history interviews also reduce the sense of objectification with
8
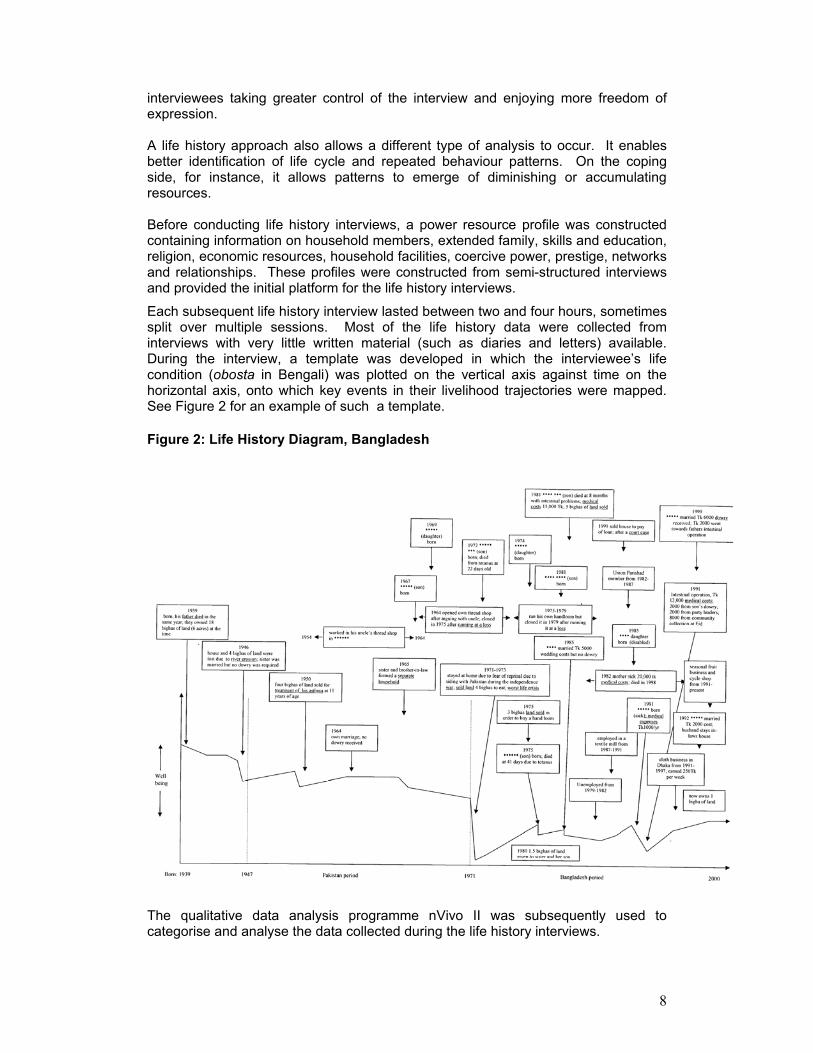
interviewees taking greater control of the interview and enjoying more freedom of expression. A life history approach also allows a different type of analysis to occur. It enables better identification of life cycle and repeated behaviour patterns. On the coping side, for instance, it allows patterns to emerge of diminishing or accumulating resources. Before conducting life history interviews, a power resource profile was constructed containing information on household members, extended family, skills and education, religion, economic resources, household facilities, coercive power, prestige, networks and relationships. These profiles were constructed from semi-structured interviews and provided the initial platform for the life history interviews.
Each subsequent life history interview lasted between two and four hours, sometimes split over multiple sessions. Most of the life history data were collected from interviews with very little written material (such as diaries and letters) available. During the interview, a template was developed in which the interviewee’s life condition (obosta in Bengali) was plotted on the vertical axis against time on the horizontal axis, onto which key events in their livelihood trajectories were mapped. See Figure 2 for an example of such a template. Figure 2: Life History Diagram, Bangladesh
The qualitative data analysis programme nVivo II was subsequently used to categorise and analyse the data collected during the life history interviews.
9
Methodological issues learned: I learned to avoid general questions about overall circumstances at the initial stage of the interview and began rather by setting up a chronological framework of major life events. This created a series of benchmarks and other details which were written onto the template. It also helped to ‘warm up’ people’s memories and to set the tone so that they realised that I was interested in a high level of accurate detail. In other words, you have to give people the time for them to give you the time. I also found it best to start the interview by working out concrete details like a person’s age. Very few poor rural Bangladeshis are able to tell you this accurately so age was estimated with reference to major historical events such as the 1971 War of Independence. It was important to work out these key dates and names; otherwise when asking about duration people will respond along the lines of ‘we’ve always been poor’. With each marriage, I asked how much dowry was given and received and about other wedding costs. This often led to discussion of loans taken out, land mortgaged, assets sold or community collections being made. Significant sickness was also investigated: who devoted their labour to caring for the sick, who raised money to pay for medical care, and where was treatment was sought. While I was aware of the topics and issues I wanted to cover, I usually allowed the interview to follow its natural course without imposing too much structure on it. After the life history interview it was often possible to talk to other household members and relatives about the same episodes so giving clues about the quality of information I had received. There were some issues connected with memory and recall and memory of trauma. Some people remember things clearly and other people don’t, leading to variations in the quality of information. Analysis: I categorised the patterns I saw emerging in the life histories into eight ideal typical trajectory patterns. The use of this categorical data analysis technique provides the opportunity to bridge the qualitative/quantitative divide. This use of trajectory categories can also contribute to poverty dynamics research and the assessment of social protection policies. I also examined the relationships between various ‘power-resources’ (including economic assets, status, access to officials) available to the individual or household and how they were mobilised to help in times of crisis. This helped to develop an understanding of the social mechanisms and processes which lead to the differentiation between highly insecure people and not-so-insecure people. Reflections: I probably paid insufficient attention to the meso or community level. I tried to combine analysis of people and households through the life history methods with the political economy of the macro-level. But this missed many of the important relationships in-between. If I did this research again, I would look more at the distribution of community power, making sure I linked the micro factors to the meso-level ones. A lot of crises which seem to be idiosyncratic are in fact socially structured, as they are to do with the way in which people are positioned in society.
10
COMMENTS Zulfiqar Ali (BIDS) Some aspects of ascent from and descent into poverty can be captured through structured questionnaire and quantitative methods (e.g., the migration of agricultural labourers and the status of formal loans). Quantitative surveys are better at identifying poverty dynamics than life history interviews. Indeed the perception-based data from qualitative surveys may lead researchers to believe the situation has not changed much, when quantitative data may yield a quite different story. However, attitudes and aspirations are an important aspect of poverty dynamics which quantitative surveys do not capture well, and where qualitative methods have an important role. Life history interviews are particularly important when examining a group of people in similar situations; when looking at why some escape poverty and others don’t. Combining both qualitative and quantitative methods effectively or using them to complement each other is the key challenge. Two important factors here are sequencing and sampling. Should qualitative techniques follow quantitative ones – with qualitative approaches being focused and guided by the better understanding provided by quantitative data? Careful sampling helps address the problem of the ‘generalisability’ of the qualitative findings. Andrew Shepherd (ODI): The value of the methods used in this paper are that you can build a picture of complex patterns of mobility and causation over time, analysing the processes through which causes lead to results. This paper points to the multiplicity of types of trajectory possible, but also to the difficulty of categorising these trajectories into different types. Certainly, when putting data into categories it is important to reflect on the subjectivity of the researcher and their process of thinking. Of particular interest here to the CPRC is the fact that you found very few smooth trajectories. Would we expect to observe this in other contexts and countries? It should also be noted that there are social values and norms wider than the unit of the individual and household. Is this method useful for analysing these wider values?
GENERAL DISCUSSION Looking at upward mobility: This method is weaker when looking at upward trajectories. People tend to remember downward crises a lot more clearly, while accumulation may occur over a long period of time and can be neglected. Whether or not you can identify those factors which help people to escape from poverty depends on the ‘art’ of doing the interview. The vast majority of quantitative studies also show that it is easier to identify the correlates and causes of declining trajectories than of upward ones. Upward mobility is also linked to resilience (the ability to cope with crises when they occur). The common occurrence of saw-tooth trajectories are an outcome of peoples’ resilience in the face of shocks. Subjectivity of the researcher:
To what extent are the trajectories identified, the results of the researcher’s interpretations? When producing ideal categories, the researcher is always vulnerable to criticisms of incorrect interpretation. Viewing the eight categories as provisional, and from which more may emerge, makes sense.
11
Integrating qualitative and quantitative analysis: There seem to be further possibilities for the integration of qualitative and quantitative methods in analysing this data. The front-end of the fieldwork focused on household characteristics, which can be combined with the narratives from the life histories in a sequence of events. Unlike many ‘small n’ studies, the sample size is large enough to use quantitative analysis. While qualitative work is useful as an explanatory and explorative too, is there a role here for quantitative analysis to make these findings more generally applicable? Comparability: Can you use the eight ideal trajectories to compare different countries? Life history interviews can be used to identify triggers, but in different countries the triggers which are central to social protection strategies will be different. For instance, in the Philippines there are no dowries, so no policy attempting to regulate them would be appropriate. Is there the possibility to help identify instruments that are useful for some situations and not for others? What are you actually comparing when looking across decades? Living conditions, the social context and power relations in the 1950s and 1990s will vary greatly. The idea behind this particular study was to look at how risk-profiles and power-resources change over time and to use this to inform social policy. Dowries may now be a more important risk than famine in the design of social policy in Bangladesh. Presentation 3: Bereket Kebede (University of East Anglia): ‘Collecting Panel Data in Africa: The Case of Ethiopian Rural Household Survey’ This presentation reflects on the experience of collecting panel data in Ethiopian Rural Household Survey (ERHS), of which I was the survey manager until 1997. The first round of the ERHS was conducted by the International Food Policy Research Institute in 1989, and aimed to examine how public works affect the livelihoods of people in areas vulnerable to famine and drought. The focus of the study was on Southern Ethiopia, as civil war in the North made it too dangerous to conduct the survey there. In 1994/95 three more survey rounds were conducted by an expanded team now consisting of the University of Addis Ababa and the Centre for the Study of African Economies at Oxford and of IFPRI. Six of the seven sites used in the 1989 study were re-surveyed (one site had disappeared as a result of ethnic conflict) and nine additional sites were added. The objective of the study changed to examine livelihoods in different agricultural and farming systems. A total of around 1500 households were surveyed three times in 1994/95 and data on household production, consumption, assets and market prices were collected. Community wealth ranking and other sociological investigations were conducted at the same time as the quantitative panel survey. Further rounds were carried out in the fifteen villages in 1997 (focusing on intra-household dynamics), 1999 (focusing on technology) and 2004 (with a focus on food aid). The advantages of using panel data are that it enables you to track changes in the same units over time, allowing one to control for unobserved heterogeneity and also
12
to identify the temporal sequence of events (‘causes and effects’). However, in order to exploit these advantages the data from the different rounds of a panel survey has to be compatible. Challenges in ensuring data compatibility include:
• Changing the questionnaire and other data collection instruments. It is tempting to correct the ‘mistakes’ of previous rounds and change questions which are found to be worded badly. However, this undermines the compatibility of the data. Previous rounds thus create ‘lock-in’ effects. New areas of research can be introduced and added-on in subsequent rounds, particularly if the objective of the survey changes, but old questions should be retained unless they are fundamentally flawed.
• Changes in research personnel. As different enumerators may ask the same questions differently, this can undermine data compatibility. Like other surveys, maintaining the same fieldwork personnel, especially over long periods of time, was practically difficult.
• Timing of the surveys. This can be seen on two levels: the timing of survey rounds to capture seasonal variations and the difference in the length of time between rounds. The three rounds of the ERHS in 1994/95 were initially planned to be conducted in four-month intervals to capture information on the whole year, reflecting seasonal variations. However, practical problems in the field made it impossible to visit each village exactly after four-months; hence, the information from the three rounds covers slightly more than a year having implications for comparability. In addition to the three rounds in 1994/95, the gap between the other rounds is not the same; and the rounds are not conducted in the same seasons. Researchers focusing on changes of variables between rounds (e.g., annual growths) should take this into account. In addition to the practical difficulties of coordination on the field, the availability of funding also influenced the timing of survey rounds.
• Different funding sources and changes in research focus. Long-term funding for a panel survey is very hard to secure, so you probably have to satisfy the requirements of several different funding bodies with different research interests. To take account of this, the ERHS used a core and rotating module design for its questionnaires. A core section – with questions on assets, consumption, etc. - was repeated in all the rounds supplemented by rotating modules containing questions that changed with the research focus of each survey round.
Ideally one should minimise problems in compatibility of data at the research design stage. In practice one often ends up trying to control for it at the analytical stage. Sampling A question that is often asked about the ERHS is what population it represents; this determines the population to which its results can be extrapolated. First, the six sites covered by IFPRI in 1989 were incorporated into the ERHS; these sites were initially selected to assess the effect of public works programmes and obviously were not nationally representative. The rounds in 1994/95 expanded the coverage to fifteen sites deliberately attempting to represent regions in the north (which was not covered in 1989) and richer rural areas of the country. The additional sites were dispersed over the main farming systems of the country. Since a sampling frame based on farming systems was not available, the selection of the villages could not be random. The dispersion of the villages over the more densely populated regions of the country enabled the ERHS to capture variations across the main farming systems of the country; this is attested by the similarity of many statistics from the data that compare well with those from nationally representative data. But in a strict statistical sense, the ERHS is neither nationally representative nor representing a clearly defined

13
population; hence, a weighting system that can be used to extrapolate the sample statistics to a population is not available. After the selection of villages, households were randomly selected from updated lists of Peasant Associations. As long as these lists are good sampling frames for the population of the villages, the ERHS was representative of the village populations at the time of sampling. When dealing with panel surveys, even if in the first round the survey population is representative of a defined population, attrition and changes in the composition of the population undermine representativeness. In the ERHS, attrition was relatively modest, for example as compared to the urban panel surveys that the University of Addis Ababa also conducted. COMMENTS Bob Baulch (IDS) The core and rotating module design is a useful way to cope with the changing research focus of donors. Another advantage of this design is that you would expect there to be variables which don’t change quickly over time. Agricultural practices or fertility behaviour, for instance, tends to change relatively slowly and so collecting information on these every five or ten years is reasonable. It is essential to take account of the effects of seasonality when designing a panel survey. In the Malawi Complementary panel survey, the timing of different survey rounds in different months of the year, means no reasonable comparison of the consumption data can be made. It is also critical not to change the recall period for food consumption items, even if you get this wrong in the first survey round. You can help avoid such mistake by testing your questionnaire thoroughly in a pilot study. The work coming out of ERHS has largely been economics focused. There is not a strong integration of economic and sociological components of the research. Is this a reflection of the balance between different disciplines in the survey team? Sarah Ssewanyanga (EPRC) How representative is your analysis? Representativeness is a key issue when convincing policy makers that the findings from your research have a wider applicability and so are relevant when drawing-up policies. Did you follow-up households or individuals? Obviously there would be problems here if you were re-interviewing the heads-of-households. Is panel data more difficult to collect for urban households? Can rural households be followed up more easily? GENERAL DISCUSSION Units of Analysis: What does a panel household mean? Changes to household composition due to deaths, births, marriages, and migration mean that the household unit is continually changing. This has important implications for data comparability. Are movements in and out of poverty simply reflecting these changes in household composition? In retrospect, the ERHS probably focused too much on tracking households and should have made more efforts to track individuals. Should we also look at panel villages, regardless of who lives there, so paying greater attention to the notion of ‘community poverty’? Or, through following
14
individuals are you also following what happens at the higher level of the community? We need to think more creatively about the ways of looking at panel data analysis. Representativeness: It is important not to confuse representativeness of a survey with whether it is nationally representative. To be nationally representative you have to sample from a national sample frame. But a survey can still be representative if it has a clearly defined sample frame and collects in-depth information from this. It is clear that the ERHS is not nationally representative, but can we talk about the population which it represents? The ERHS’s fifteen sites were purposively selected from the main farming systems, but within these sites the households were selected randomly. Ultimately, whether representativeness is important depends on the purpose of the survey. Integrating rural and urban surveys: In Ethiopia, rural and urban panel surveys were conducted separately. This may ultimately have been an accident of funding, as the funder SIDA was initially more interested in rural dynamics than urban ones. The urban panel survey was also funded by SIDA but it came through a different channel. The urban questionnaire in Ethiopia was drafted to make it as comparable as possible with the rural one. The dynamics of poverty in urban areas are different to those in rural areas, and so urban surveys require different survey instruments from rural ones. Presentation 4: Elizabeth Francis (London School of Economics) ‘Reflections on Life History Analysis in Kenya and South Africa’ This presentation reflects on my experience of conducting life history analysis in Kenya and South Africa. The Kenyan project was part of my DPhil research and involved 19 months living in Kisumu district in western Kenya between 1987 and 1989. My focus was on the impact of migration, in particular the links between the changes in the regional political economy and changing relationships between and within households. The South African project was a much shorter DFID funded project with three months spend in the field with two colleagues in 1999. The project aimed to compare household-level responses to the upheavals of the previous 20 years (especially removals to the ‘homelands’ and their aftermath, changing labour-market conditions, and the abolition of apartheid restrictions) in two villages in North West Province. Clearly, these two projects had very different purposes and constraints. Research methods In Kenya, I used a range of methods including :
• Examination of Census data • Semi-structured interviews with key informants • A budget survey (24 households) • Life histories (60 individuals) • Sample survey (104 households – to check)
I had intended to use more informal methods such as participant observation in my research but found that it was difficult to get as high quality of information from these methods. I almost stumbled upon life histories as an alternative qualitative research method. Since I had spent almost a year in the field before embarking on life histories, I had a good sense of the range of people I needed to speak to and the topics to ask them.

15
In South Africa, life history interviews were the main research method used, supplemented with key informant interviews on the local and regional context. I tried to draw on official data where possible, but did not collect any quantitative sample survey or budget data for the project. A total of 40 life history interviews were conducted. Sampling Kenya: I used the census to construct a sampling frame for my sample survey. However, I didn’t aim for a statistically representative sample for the life histories or budget survey. For the budget survey and life histories, I looked for different types of people and households (stratified by house type, household structure, and age of adults) with the numbers continually growing. The criteria for selecting the respondents were driven by my research questions on the impact of migration on household differentiation and gender relations and generational changes. In South Africa, we used a snowball sample. We identified a number of potential starting points derived from the research agenda and from gatekeepers. We tried to get a spread of people who were of interest (unemployed, families of migrants, pensioners, farmers, people leasing out land etc.) Design and structure of the interviews In Kenya, most of the life history interviews lasted for around two hours although some people were interviewed more than once. I gathered core information from all respondents and then followed this through with selected respondents on other themes as appropriate. As I learned DhoLuo, I conducted most of the interviews myself, though I always had an interpreter with me. In South Africa, each informant was interviewed once for about two hours. The interviews were based around a livelihoods framework, though they still managed to be flexible and respond to unexpected information. Due to the time constraint, I did not learn Setswana and conducted interviews through an interpreter. Recurring challenges
• Vagueness about dates and ages, especially in Kenya. To overcome this I used benchmarks (well known events, cross checking with people who knew their ages)
• Telescoping and compressing time (eg, giving the last wage earned as wages for a longer period). It was very important to try and get external sources of information to validate the responses.
• Nostalgia: interviewees tended to project current patterns of behaviour or beliefs back into the past. I tried to ask for factual statements from people of different generations and make comparisons based on these, rather than relying on interviewee’s opinions.
• Withholding information/ not telling the truth. I looked for inconsistencies and implausible statements, but also tried to establish rapport. It was usually best to approach more sensitive topics towards the end of the interview.
What I established: Kenyan research: Managed to move between levels of analysis, linking the long-term decline of the local economy to changes in relationships within and between households. South African research: Identified sources of household differentiation, the sources of different kinds of risks encountered by people in the area and their responses

16
Problems Encountered In Kenya, though I was aware of the notion of life histories as constructs which cannot be taken at face value, greater familiarity with the literature would have made me more likely to have recorded interviews and subjected them to textual analysis. In the South African study the political dimension was not brought out clearly enough; so highlighting the difficulties of trying to link different levels of analysis. However, you can’t study everything and you have to make a lot of judgements. Researchers need to be explicit about the costs and benefits of using different research approaches. There are many different ways of collecting life histories and many different life histories. A life history approach allows for complexity and gives an opportunity to look at inner-workings of households, to analyse perceptions and meanings. However, for the approach to work requires considerable skill on the part of the interviewer. Life histories are not something which can just be slotted into research. It is also essential to reflect on their costs and benefits. COMMENTS Kate Bird (ODI): In the context of life histories data quality returns to the notion that they are a construct; that they represent a truth not the truth. The story a life history tells is partly a result of the respondent’s:
• Sex, which influences how people see the world. In particular, it influences the realms over which we have influence. Men are thus more likely to mention market shocks than women, in some contexts.
• Age and stage in the life cycle, which strongly influence levels of optimism/ pessimism.
• Relative well-being. Life histories are influenced not just by absolute well-being. People will put a different gloss on events in the past depending on the outcome and whether their well-being improved or worsened afterwards.
• Personality and education, influences whether people conceive of themselves as having a story to tell and having confidence to tell that story
These are challenging issues when you want to set evidence from life histories against those from panel surveys. The complexity and richness of the data produced from life history interviews makes it difficult to identify sets of causal links. This is a problem for the CPRC’s research, which will want to highlight the overall causes of chronic poverty to inform policy. Andries du Toit (PLAAS, University of the West Cape): An important difference between life histories and household interviews is that, while rigour in household surveys requires directing questions very precisely at particular issues, life history interviewing is often a research strategy for obliquely getting people to talk about the issues in which the researcher is interested. It revolves around an interviewer’s ability to listen critically, both to what is being said and to the ideology or frame of reference that informs this. Often, the life history which people want to have may be as informative as the life history they actually have. You can’t make too many assumptions about the accuracy of the history given. Behind research questions there is a rich theory, a set of hypotheses and a framework which tells you what you should be asking. If you want to integrate qualitative and quantitative data, you will always be doing this in terms of a theory

17
about society that informs your research and that enables you to use life-histories to link the micro-level with the meso-level. Given all the issues raised about skill and judgement, is there a half-way house for the CRPC. How can we start producing some comparability between our research results? GENERAL DISCUSSION Integrating life histories and panel data: When trying to set life histories against panel data you are trying to get at the same themes from a different angle. There is an epistemological problem of trying to integrate life histories with panel surveys – people are using completely different sets of concepts, so a 1 to 1 correspondence is not possible. One size does not fit all in terms of research methodologies. Verifiability: Assessing the validity of the information you are given in life history interviews tends to come down to instinct. However, if you are familiar with the context you have a greater idea of which responses make sense and which ones don’t. Ways of cross-checking include asking the same question in different ways; seeing if peoples’ responses correspond with what was happening in general during that period and also attempting to internally verify the responses using historical records (though this is often very difficult). Using a local research officer can also help. Verification is, of course, a problem not just life histories but any research method, particularly when it tries to address contentious subjects. Understanding the context: The context will influence the effectiveness of using life histories to analyse upward mobility, in particular. This was relatively easier to do in Liz Francis’s research in western Kenya, where upward mobility was clearly linked to education and employment. In other circumstances, where upward mobility involves coercive power and ‘trampling over others’, it will be more difficult to capture. You have to know about the key processes before you start. Constructing a community life history with key informants (such as village leaders or leaders) can be a good way to gain understanding of the context. Presentation 5: Stefan Dercon (University of Oxford) ‘Moving on, staying behind, getting lost: Lessons from long-term panel data collection.’ This presentation introduced the strengths of long-term panel data and discussed some of the problems encountered when using it, drawing on examples from Ethiopia, Tanzania and India. In particular, it examined the exciting opportunities provided by panel surveys for policy analysis and for investigating personal wealth dynamics and intergenerational dynamics. It also highlighted a number of crucial issues revolving around sampling, timing, attrition, migration and household formation and dissolution. Policy Analysis: Ethiopia Rural Household Survey (ERHS) Panel data can be used to assess the impact of economic reforms on household poverty by identifying household positions in terms of welfare, income and assets

18
before and after the reform. In other words, you can control for all the characteristics that remain unchanged between two periods. You still, however, need information on other factors which may have changed over this period. Using the ERHS, we identified a set of six villages in which policy reforms and market liberalization had changed the relative prices faced by farmers. These relative price changes can be shown (Dercon, 2005) to be a crucial factor in explaining declining poverty. However, poverty declines were centred in better located villages with roads. Relatively speaking we can say that the reforms were biased in favour of the poor in these villages, while the poor in other, more remote, villages lost out. There are, however, limitations of using panel data for poverty analysis: Sampling: It is impossible in panel data to have ‘representative’ samples for the monitoring of poverty. This is because the statistical concept of representativeness is defined at one point in time for a specific geographical entity. When the next survey round is conducted, your previously representative sample is no longer representative because people have been born or have died or migrated. Moreover, patterns of birth, death and migration are not random processes but vary with age, gender, socio-economic status and so on. So if you are interested in monitoring poverty changes in a particular geographical area, then you need to draw random samples at each point in time. If however, you want to analyse poverty dynamics and the reasons why people move up and down the welfare distribution then panel data is excellent. Identification of ‘Policy Change’: One needs to be certain that ‘policy change’ is not determined by the people within the sample. If the characteristics of the people shape the intervention, then it is difficult to distinguish what is determined by the people themselves and what is due to the intervention. For instance, is a certain area richer because it has a road or does it have a road because it is richer? Cross-sectional data cannot solve this problem of endogenous programme placement effects. Panel data, however, can potentially solve this problem if you have data on the wealth of the villages before the road was built and if you can also identify factors ‘exogenous’ to the wealth of the village which may have influenced whether a road would be built. Before and after analysis on its own cannot necessarily identify the impact of policy change. Timing of Data Collection: Logistics meant that in the ERHS the survey rounds could not always be conducted during the same months of the year. This posed a problem for the comparability of many variables as most Ethiopian households face serious fluctuations linked to seasons. Budget and energy constraints also meant that the intervals between survey rounds were variable, ranging from six months to five years. Perception of Poverty Status: The ERHS also asked people for their perceptions of their poverty status in various rounds. Some rounds asked them to recall their perceptions of poverty status from previous rounds. This provides an interesting source of comparison. For instance, 29 households recalled their perceptions of poverty in 1994 as being ‘rich’ or ‘very rich’ when asked in 2004, while when asked their self-perception of poverty in 1994/95 only seven household answered ‘rich’ or ‘very rich’. Life histories are relevant to one-point in time. Perceptions provide useful information on well-being but this will be conditioned by the current context. Recall information on perceptions of poverty are not an alternative to panel data.

19
Intergenerational Dynamics and Personal Wealth Dynamics: Kagera Health and Development Survey, Tanzania The objective behind this survey round of 914 households in the Kagera Region of North-Western Tanzania was to learn about the long-term implications of shocks in an area strongly affected by HIV/AIDS. Most previous studies on the long-term impact of HIV/AIDS were speculative or based on case-studies and cross-sectional studies and did not help to identify cause-effect linkages. For instance, it was known that orphans typically came from poorer families and so would be more likely to have lower levels of education. However, it was not possible to distinguish between low education being due to being an orphan or living in a poor family. Four rounds of data collection took place in Kagera between 1991 and 1994, with a further round of data collection taking place in 2004. Problems in the region, including a refugee crisis, high levels of migration and HIV/AIDS leading to orphanhood and possible household dissolution would have made it difficult to base the sampling frame on households. Instead, in 2004 we re-defined the survey using individuals as the sampling unit and aimed to track all individual ever interviewed in 1991-1994. This tracking required a lot of funding and resulted in over 4,436 people being interviewed with 2,774 original or split households being identified (compared to the original data in 1991-94 involving 912 households). Only 49% of people tracked remained in the same village thus showing the critical importance of tracking people to nearby and distant locations. One aim of the data analysis was to understand the long-term implications of orphanhood. To do this we looked at all non-orphans in 1994, and then studied how becoming an orphan affected their long-run health and long-run educational outcomes (with extensive checks on whether unobservable factors related to becoming an orphan were not driving the final findings). We used quantitative techniques to analyse the final height and school achievement of those individuals who had become adults by 2004. We picked up strong long-term effects from being an orphan, including stunting of about 2cm and the loss of a year of schooling. Another way we statistically analysed the panel data was to look at changes in poverty and consumption over the ten year period, comparing the current consumption status of the household people belonged to with the status of the household they were a member of ten years before. We discovered that individuals who migrated from the original villages saw an increase food consumption and income greater than those who remained living in the villages. Furthermore, poverty headcount rates fell more rapidly the further individuals migrated. This once again highlights the importance of the tracking of individuals in order to get a complete picture when collecting long-term panel data. Intergenerational Dynamics: ICRISAT Phase 3 This is a renowned data set for studying dynamics and change in a rural setting in South India. However, it used the village as the sample frame, with people who left the village or the household being dropped from the sample. If the head of the household died, the household was also dropped from the sample.
• Phase 1: 1975-1984 (monthly rounds) • Phase 2: 2001-2004 (yearly rounds, within village, with some split-offs) • Phase 3: 2004- (all individuals ever interviewed, including migrants!)
We currently estimated that 55% of the original household members live outside the village so that the sample of 40 households per village from Phase 1 had become 80
20
households per village by Phase 3. This shows you can easily lose track of how big your sample actually is and get lost when sorting and analysing the later rounds of data. COMMENTS Bob Baulch (IDS) The cost of successfully tracking respondents means that you need to have a strategy of what to do if you don’t have generous funding. This would include collecting tracking information on where migrants have moved to, in case another funder comes along at a later stage. Are there possible short-cut methods to tracking? In the ICRISAT Phase 3 work, you gained information from migrants when they returned home for Diwali. However, it should be recognised that people may present their circumstances differently when they are in the company of their family than when interviewed alone. Similarly, work on Matlab panel in Bangladesh collected information on the occupations and approximate incomes as well as locations of migrants without following them. What can you learn about chronic poverty from a one shot survey? Collecting anthropometrics on everyone in the households in the first wave of a survey can tell you a lot about how individual living standards have changed over time. Shashanka Bhide (NCAER): While you cannot say that a panel sample is representative of a changing population, you can say that a panel sample is representative of the changes that happen to the original sample of people in the intervals between survey rounds. It is also possible to build in a rolling panel – in which additional samples are added in subsequent rounds – to maintain cross-sectional representatativeness? How far would you track individuals if the research question is what is happening to chronic poverty in rural India? You would want to track households in rural India only, as you are not asking the general question of how people leave poverty. The research purpose should define how we design panel surveys. GENERAL DISCUSSION The Sampling Unit: If the individual is the unit of analysis then you have a representative sample of a cohort of people at a particular point in time. If someone dies or moves, they should remain in the sample but people who are born are new to the sample. Are you being contradictory by adding them to the panel? The unit of analysis should be driven by the research questions. For instance, if you are studying economic decision-making in households you may have to focus on intra household dynamics. If you want to track people in rural areas this is not the same as only surveying people who remain in the same village. When doing a village-level survey, women who move to marry will be systematically left out of the sample. Representativeness: Changes in poverty are only representative for the initial round (not for the population as a whole) as the panel always relates to a particular point in time. Rolling panel designs - in which half the sample is dropped and then replenished with a new sample of households – are sometimes recommended by the World Bank. However,

21
after three rounds this design means you will have no household left who was initially sampled. Note also that the World Bank’s sampling designs have a fixed sample size, while the sample sizes in the Tanzania and India panels increased with time. Identifying policy changes: When people analyse survey data they often think ‘this the data set I have to analyse’ and never look further than what they have to work on. This is how World Bank commission research projects work. However, it is often highly advantageous to find secondary sources which providing independent evidence on when and where interventions are placed. Some of the best research is question driven rather than tool driven, and this provides an entry point for the integration of qualitative and quantitative methodologies. Qualitative analysis can put the wealth of context into quantitative data Presentation 6: Paul Shaffer (University of Toronto) ‘Q2 – Combining Qualitative and Quantitative Approaches to Poverty Analysis and Monitoring: Issues and Examples’ This presentation provides an overview of Q2 including what it means, the different ways in which qualitative and quantitative methods can be combined, the difficulties in doing this in practice and some ways to enhance comparability. The implications for combining life histories with panel data are then discussed. Kanbur looks at Q2 through the following dimensions of difference:
• Type of information: numerical/ non-numerical • Type of population coverage: specific/ general • Type of population involvement: active to passive • Type of inference methodology: inductive to deductive • Type of disciplinary framework: social sciences to neo-classical economics.
While this classification is useful, as is often the case, the categories tend to collapse when analyzed. For instance, much narrative data collected in discussions can be transformed into numerical data. There are two ways forward. On the one hand, you can ‘go philosophical’ and look for foundational categories from which intermediate categories derive. On the other hand, you can dispense with categoral schemes and refer to exactly which is being combined in particular studies. The latter approach is far more practical and is the approach adopted in this presentation drawing on three different case studies.1 The different ways of combining the approaches adopted in these specific studies can be distinguished into two types: ‘Putting Together’: the results of different approaches conducted separately are put together with a view to enrich or confirm/refute each other. Methodological Integration: the outputs of one approach feed into the design or methods of another (such as using ethnographic results to inform household survey questionnaire design). Within the above two categories different types of sequencing/ simultaneity occur. A final distinction is between different stages of poverty analysis, namely between identification and causal stages. The former entails analysis of characteristics/correlates, levels and trends of poverty. It addresses the question,
1 See Pradhan and Ravallion (2000), Place et al., (2006) and Rao et al (forthcoming).

22
who are the poor? The latter involves analysis of the causes of poverty (chronic or transitory) and addresses the question why are they poor and/or why do they enter into and exit from poverty? Within the identification stage of poverty analysis seven criteria distinguish different traditions of poverty analysis:
• Peoples’ perceptions – is there an attempt to include peoples’ perceptions of poverty in the analysis?
• ‘Basket Consistency’ – are the same dimensions of poverty/ well-being used when making inter-personal or inter-group comparisons?
• ‘Cut-Off Consistency’ – is the poverty line being drawn at the same level of well-being across the domain of the comparison?
• ‘Aggregation Consistency’ – is there an attempt to add up those below the poverty line using the same poverty basket and cut-off?
• Representativeness – can the findings be extrapolated to other population groups?
• Reliability – would the same results occur if the data collection and analysis were replicated by different investigators under identical conditions?
• Validity – are the results accurate (ie. factually correct) on average or characterised by bias?
The move to Q2, in the context of policy relevant research into poverty, can be thought of as an attempt to satisfy those criteria not met singularly through participatory poverty analysis or through consumption poverty analysis based on household surveys. Some implications for combining life histories and panel data include :
• Comparability issues: are we talking about the same things – basket, cut-off, time-period (such as seasonality) and units of measure (may need conversion factors)?
• Validity issues: there can be perceptual biases associated with self-reports (in life histories OR household surveys) due to adaptation, memory issues, changes in expectations, mood/ affect etc. This can make the results less policy relevant.
• Representativeness issues: are we talking about different populations with different characteristics?
• Reliability issues: is the investigator the main driver of results? Less structure in the dialogue of life histories means this is more likely to be a serious problem. For policy purposes this may need to be addressed – more standardisation, multiple coders?
Combining qualitative and quantitative methods in practice involves tailoring the instruments – household surveys, for instance, can include ‘subjective’ modules which mimic questions in life histories. The bottom line is that the choice of method should be driven by the purposes of the study and not the other way round. COMMENTS Anand Kumar (JNU) It seems that five factors require attention from the outset of a research project. These are: time, money, rapport building (including acculturation), cross checking capacity, and ‘the X factor’ of the politics of information. Only when these have all been considered should the ambition of combining the two methods be attempted.
23
How can the two methods converge effectively without upholding the ‘fetish of the quantification’ and its desire to convert everything into numbers? Convergence needs to be thought through carefully: when you integrate qualitative methods into a survey you change the nature of the data collection process and subsequent analysis. While Q1 and 2 can come together nicely for identifying poverty can they be successfully combined when assessing policy impacts? Charles Lwanga-Ntale (Development Research and Training) The process of how qualitative and quantitative methods are integrated is often ignored. However, there is a real issue of a fear factor and mutual suspicion between quantitative and qualitative researchers. The nature of the two methods: It is important to reflect on the fact that when we use different methods we are often talking about different dimensions of the same phenomenon. For instance, household surveys focus on consumption and living standards while qualitative methods focus on the material and non-material dimensions of well-being. Large-scale surveys tend to be nationally or regionally based while qualitative research tends to focus on particular communities or to focus on particular questions or dimensions. This has implications for extrapolation and representativeness. The two methods have different total reference periods. With most qualitative studies people are talking about decades of experience. On the other hand, household surveys have specific reference periods of one year or one month. There are three main ways of combining qualitative and quantitative methods:
• Integrating methodologies: in which qualitative and quantitative methods inform and build on each other.
• Triangulation and Refutation: one data set helps to refute, inform, and advise the other
• Merging findings: each approach is used independently but their findings are used to enrich each other – once findings are there they should be brought to inform what is coming out on each side.
Essentially then, we are talking about two sides of the same coin. When we talk about combining methods we are really asking ourselves to what extent can we talk about poverty from different angles? GENERAL DISCUSSION Overlapping Quantitative and Qualitative Samples: Under CPRC’s Poverty Dynamics and Economic Mobility theme, we’re planning to nest qualitative and quantitative methods with overlapping sub-samples for the qualitative and quantitative work. For example, in Bangladesh we’re planning to draw a sub-sample of respondents for life history interviews from a transition matrix coming from a household panel survey. Doesn’t this address the problems with cut-offs, and time period issues mentioned in Paul’s presentation? Possibly but you also want to identify process typologies for site selection. These are factors that explain why there is a lot of the variation in the variable of interest. But with small samples, you have to be selective. If you try and identify the main factors

24
and then find sites that match these, then you can make a stronger case concerning representativeness. The ‘putting together’ approach: Have there been enough attempts at ‘putting together’? Shouldn’t this dialogue go on for longer? ‘Putting together’ actually influences change with researchers becoming part of the process of policy change. The next Q2 conference will look at the policy implications of being too bogged down in methodology as opposed to outcomes. Constructing a conceptual framework: If you want to integrate the methodologies into the design you have to step back and construct a conceptual framework that takes into account the concerns of many people. There are only a very few examples where this has succeeded. It depends on the whole intellectual tradition. It’s difficult enough to keep up with your own and nearby disciplines without all the other ones as well! We also need to be careful to distinguish between a framework for methods and the conceptual framework for the research agenda. It is deciding on this conceptual framework for the agenda which is key. However, this is extremely difficult as our aims, and conceptual categories, can be completely different. There often has to be an initial translation exercise, in which we have to figure out what certain terms mean in language of other disciplines. Are there common strategies to get at this? This is combined with the fear factor and the dynamics within a team when trying to do this. Disputes often arise from mutual suspicion and you can’t retrain people to be equally versed in all disciplines. Presentation 7: Andries du Toit (University of Western Cape): ‘Understanding Poverty in Ceres: Reflections on a theoretically informed integration of qualitative and quantitative data’ This presentation examines theoretical issues that are central to the integration of qualitative and quantitative methods. It stresses the importance of developing a conceptual framework or theory within which qualitative and quantitative methods can be analysed before going on to discuss the presenters experience of conducting theoretically informed Q2 research in Ceres, South Africa. The issues of methodological integration go deeper than a distinction between qualitative and quantitative methods: they are at the heart of our disciplinary training and perspectives. Methodological differences stem from contested understandings of poverty. On the one hand, poverty is viewed as an attribute of individuals or households that can be grasped through measurement. A different approach sees poverty as an ideological construct which can only be grasped by analysing social relations. Since these patterns and relationships are always historical and local any explanatory account will always be context bound; limited in applicability to a particular set of circumstances. There is no single dominant paradigm of how to do this; but to a greater or lesser extent any relational approach would look at the interplay between agency and structure and at how resources, networks, systems and processes interact to produce outcomes. Understanding Poverty in Ceres: In 2002, the University of the Western Cape conducted a livelihoods survey at three sites in the Eastern and Western Cape. Ceres, a centre for the commercial production of fruit and agro-food products approximately 160 kms Northeast of Cape Town was one of these sites. In 2003 we conducted follow-up semi-structured

25
interviews with 50 households in Ceres, which were selected in the belief that they were the most vulnerable. Our survey research was informed by a broader literature review on change in the agro-food sector and in farm labour relations. In other words, we knew the themes which we wanted to investigate at the outset. These were: (i) regulation, deregulation and re-regulation, (ii) the restructuring of agro-food chains; (iii) farmers’ responses to these changes, and (iv) paternalism as social formation. Using a heuristic diagram with commodity chains on the vertical axis and social and political dynamics on the horizontal one, we linked different scales of analysis, which helped to identify how different factors impact on poverty. The key driver and maintainer of chronic poverty which we identified was dependency on incomes from farm labour. High rates of landlessness, lack of access to resources and lack of diversity in the local economy meant that people in Ceres were forced to secure food by working as farm labourers. The seasonal nature of the demand for farm labour resulted in seasonal food insecurity, another key maintainer of chronic poverty. This has implication for policy which, in the South African context, stresses the importance of modernisation, labour laws and rapid integration into markets leading to benefits for everyone.
To further integrate qualitative and quantitative methods we asked the question, ‘is there a relationship between the extent of marginality, vulnerability and poverty outcomes?’ Our results here were ‘not entirely inconclusive.’ Though the correlations between indicators of structural vulnerability and poverty outcomes were statistically significant, they were also weak. This is however, not surprising because the we know the causal relationships between these factors to be non-linear and indirect. The impact of a particular factor – e.g. gender – can also be quite complex,

26
varying from circumstance to circumstance. This means that one should be sceptical of the notion that the role of qualitative research is to generate hypotheses that have to be tested through quantitative methods. To conclude: this presentation has been an account of one attempt to link the micro, meso and macro dynamics that shape chronic and structural poverty by using quantitative and qualitative methods. Quantitative econometric analysis and the analysis of social power relations can be complementary. However, the way in which they are integrated depends on the underlying theory of society that informs analysis. Competing and diverging accounts of a situation, though, should be viewed as a strength. We should not be aiming to create a monologue but a dialogue between qualitative and quantitative methods. COMMENTS Kate Bird (ODI): The heuristic diagram is a useful way to capture how household phenomena are linked with global processes. However, the key driver and maintainer of chronic poverty identified illustrates the context-dependent nature of your research. For instance, the key driver and maintainer of chronic poverty would be very different in Uganda. So how can we use this approach to compare experiences from different countries? Household surveys are looking at counts, at how many poor people there are and who is poor. In contrast, qualitative methods focus on the “why” behind poverty: why are people poor? What is driving chronic poverty? So qualitative methods are not an ‘add-on’ to quantitative surveys but a way in which context and causality can be identified. Andy McKay (U of Bath): Often when we have dialogues (or read) across disciplines we find it difficult to understand what is being said. The nature of specialist vocabulary used by different disciplines is a fundamental issue which the CPRC needs to overcome. One of the strengths of quantitative data is its ability to look at many things simultaneously. You can control for other variables and better understand a particular story. However, just as with life histories, survey data needs to be critically analysed for its quality and consistency. GENERAL DISCUSSION Integrating qualitative and quantitative methods: Qualitative data can add to the results of panel studies by giving us a sense of how much we can trust survey data. For instance, economic data nearly always under-reports income levels because economic activities are often highly diverse and some sources of income are ‘invisible’ to household surveys. Life history studies can highlight and triangulate these different sources of income. Being able to quantify the scale and size of phenomena is extremely useful, and can lead to unexpected results. For instance, in Ceres people always talk about farm labourers as being ‘the poorest of the poor’. But the PLAAS survey showed that in actual fact they are in the 2nd from top quintile in terms of per capita income. We need to ask the key questions about what new insights are provided by using additional methodologies. To what extent does combining the qualitative and
27
quantitative methodologies result in a product which is more than the sum of its parts? What are the strongest messages which qualitative and quantitative approaches separately communicate and what implications does this have for policy? Relational poverty analysis: There is a debate when looking at relational understanding of poverty. Household surveys focus on individual households and tend not to look at relationships between households, communities or social groups. However, inequality is a matter of distributions and relationships in which relative positions and power relations are central. How can the CPRC’s research take relationships into consideration? Understanding the context: We need to get beyond extremely context bound information and come to explanations that are more general. We should be able to compare two similar social context and identify what is applicable to both contexts and what is only applicable to only one of them. However, the CPRC also needs to be careful about generalising about chronic poverty in wider contexts. We don’t want to become like the ‘development expert’ who believes that what works in one context can be exported wholesale to other situations. This is extremely dangerous. We always need to be aware of the importance of local context. The role of theory: Theory is central to how we interpret what people have said. It helps to have a theory about society which tells us what we are trying to integrate, and what the different methods are trying to achieve. However, theory is also potentially dangerous. You can get onto a slippery slope where the analyst’s critical reaction to people’s responses is driving the research. Very strong priors are involved when distinguishing between true and false consciousness on the part of respondents. In this respect, the dangers of the ‘development expert’ approach also applies to the researcher.
28
Summary and Implications for CPRC’s Research This section aims to synthesize the key themes that were discussed in the workshop on “Panel Surveys and Life History Methods” and draw conclusions for CPRC’s research agenda. Tracking Households or Individuals Until recently most panel surveys in developing countries, tracked households rather than individuals. Yet, as demonstrated by the Ethiopian (ERHS), Guatemalan (INCAP), Philippine (Bukidnon) and Tanzanian (Kagera) panels, households are ever changing entities. Children are born, other household members die, and still others leave the household because of marriage, the dissolution of relationships, or migration in search of better opportunities (employment, education and the like). All of these events are likely to have critical impact on poverty dynamics, economic mobility and the intergenerational transmission of poverty. By restricting themselves to following an individual household (usually based on the household head or residence), conventional panel surveys lose the ability to track these drivers of individual well-being. Accordingly, many new panels (such as the later rounds of most of the above panels) attempt to follow individuals when they leave the household. As demonstrated by the Bukidnon, Kagera and ICRISAT Phase 3 follow-up surveys, this can lead to a rapid growth of sample size with attendant challenges in terms of budget and survey logistics. To manage these challenges, carefully developed and pre-tested tracking protocols are essential. As life history studies tend to use individuals as a unit of analysis, they tend to circumvent this problem. Following People When They Move Most of the classic ‘theories’ of economic development stress the importance of migration and urbanisation to rising living standards. However, for logistical and budgetary reasons, most panel surveys restrict themselves to specific locations (such as a carefully drawn sample of rural villages). As with the tracking of households rather than individuals, such geographic boundaries restrict the extent to which panel surveys can investigate pathways out of poverty and may lead to overestimates of chronic poverty. Clearly, following people when they move poses severe logistical and budgetary constraints. Unless a generous funder can be identified at the outset, it may be impossible to follow individuals when they move beyond the locations in which they originally lived (though it should be remembered that some people will move to new residences within these locations). In such circumstances, it makes good sense to collect information on the contact details and broad circumstances of individuals who migrate from those family members who remain behind. Such information can serve two purposes. First, as demonstrated by the Bukidnon survey, if supplementary funding is subsequently obtained it makes the follow-up of migrants much easier. Second, the information collected on the broad circumstances of migrants can be used to assess and control for attrition bias.

29
Sampling and Representativeness Most policy makers want to be assured that the sample from which a panel survey or set of life histories is collected is representative of a wider population. While there are a few examples of panel surveys that are broadly nationally representative (e.g., Uganda, Vietnam and the planned National Income Dynamics Study in South Africa), most panel surveys are restricted to particular locations or sub-groups of people. Similarly most life histories and other qualitative research projects are ‘small N’ studies, in which generalisability to the wider community in which they take place is problematic, although there some ‘medium N’ studies (such as the Bangladesh and Kenya studies) which allow one to do this to some extent. The ‘purposiveness’ of such studies does, however, allow them to focus more clearly on specific research questions or the evaluation of specific interventions than more general surveys or qualitative investigations. Technically, because of ageing and the formation and dissolution of households, a panel survey can never be representative beyond its first wave. However, one can say that a panel surveys is representative of a particular cohort of individuals (e.g., a random sample of people living in villages with the following characteristics) and the changes which happen to these individuals between the panel waves. Without substantial co-funding, the CPRC cannot hope to conduct panel surveys or life history work at a scale that can be considered nationally or even regionally representativeness. It is therefore essential that the sub-population(s) on which individual pieces of research are to be conducted are specified clearly at the outset, sampling procedures are transparent and well-documented, and the implications of this design for the generalisability of the findings is clearly stated early on in the research outputs. The nesting of qualitative and life-history work within the samples of broader panel surveys is one way in which the generalisability of their findings may be enhanced. Changing Research Agendas Once a panel study is started, there are significant ‘lock-in’ effects in terms of both location and questions that can be asked. As demonstrated by the Ethiopian and Philippine studies, this is often hard to square with policy makers’ and donors’ changing agendas. Maintaining comparability between the different waves of a panel survey is absolutely essential but it can also be feasible to supplement the original survey design as you go along. A core and rotating module survey design is a very useful way to do this, especially as some variables (e.g., agricultural or fertility practices) tend to change quite slowly. Life Histories as a Method for Providing Narratives and Explanations Panel surveys in developing countries usually contain just two or three waves. Clearly a lot happens in between these waves, and retrospective questions and life histories can be extremely useful for discovering what has happened before, in between and after these waves. Life histories also offer the advantage of a long term perspective, rather than just looking in detail at two or three points in time, and can be very helpful in explaining observed changes in ways that survey data cannot. However, one needs to be cautious about how respondents reconstruct their life histories in the light of their current circumstances and recent events. Respondents also have a tendency to project current patterns of behaviour or beliefs into the past, and use relative rather than absolute standards for assessing well-being and ill-being. In addition, the way in which the interviewer conducts a life history interview
30
can ‘direct’ the narrative obtained. Thus a life history obtained from a respondent at one point in time may not be fully consistent with a life history collected from the same respondent at an earlier or later date. Life Histories as a Research Tool Life histories should not be regarded as a universal research tool. There are many different ways to collect life histories, and each has its own costs and benefits. The interviewer’s ability to understand the context, listen critically to what is said (cross-checking facts where necessary) and then interpret the data in a meaningful and unbiased way is crucial. How a life history interview should be conducted needs to be tailored to the specific research questions under investigation. A ‘one size fits all’ approach cannot apply to life history research. Shocks, Accumulation and Downward and Upward Mobility People tend to recall information about major shocks which lead to downward mobility a lot more clearly than the gradual process of accumulation which result in upward mobility. This is a challenge for both panel surveys and life history methods. Considerable care is needed when conducted life history interviews to avoid events being telescoped, or the ways in which changing social and power relations condition life chances (which may be difficult to identify) being downplayed. As the principal researchers for the Bangladesh, Kenyan and South African studies suggested, it is usually better to approach sensitive topics that are often the proximate causes of downward and upward mobility (such as dowries, the acquisition and sale of land, household dissolution, and exploitative trading relations) toward the end of life history interviews. When conducting panel surveys, administering a household-level shocks module after obtaining updates on major changes in the household (such as birth, deaths and migration) is becoming standard practice. Including ‘shocks’ modules in both the household and community surveys can be a good way to triangulate information about the timing and severity of shocks. Combining Qualitative and Quantitative Methods There are a number of ways in which qualitative and quantitative methods can be combined. At one end of the spectrum are studies which involve the ‘putting together’ of separately conducted qualitative and quantitative studies, and using these to triangulate, enrich and supplement each others findings. The Uganda experience with household surveys and PPAs is a good example of this. At the other end of the spectrum are studies which aim at complete ‘methodological integration’ in which qualitative and quantitative methods are used together on common samples or sub-samples. The KIDS-SEPPI work in South African exemplifies this. In between these extremes, are numerous possibilities in which the outputs of one approach feed into the design, sampling and methods of another. However, the mixing of methods in this way needs to be done very carefully: the research objectives and conceptual/theoretical framework of the study should drive which methods are used and how they are combined. Sequencing of Qualitative and Quantitative Methods There is no ‘right’ way to sequence qualitative and quantitative methods. Some Q2 studies adopt a qual-quant design, in which the qualitative work informs the design of the quantitative survey instruments, while others adopt a quant-qual design in which qualitative fieldwork is used to explore, enrich and understand the findings of a quantitative survey. Still other studies have adoped qual-quant-qual or quant-qual-quant designs. Iteration between methods is usually helpful as it helps to confirm
31
and refute research findings, while posing key questions for the next stage of the research. However, it is also time-consuming and expensive. Cross-Context and Cross-Country Comparisons Comparing the experience, magnitude and intensity of chronic poverty across countries together with the processes which maintain poverty over extended periods, the lifecourse or between generations is central to the CPRC’s research agenda. While there are some contexts (e.g., the West African Sahel or flood prone areas in Bangladesh and Eastern India) in which cross-country comparisons are relatively straightforward, it is usually difficult to make comparisons across different social and economic contexts, both within and between countries. The sorts of events (including shocks) which are critical to determining livelihood trajectories in one country are likely to be quite different in another country. Similarly, the types of assets that are regarded as essential, how they are accumulated, and the sacrifices which people are prepared to make to get onto an upward livelihood trajectory will differ markedly between different socio-economic groups, regions and countries. While the CPRC needs to go beyond highly context specific studies in examining the drivers and maintainers of chronic poverty, it must also be extremely cautious about proposing universal explanations of and blueprint solutions to chronic poverty.

32
List of Participants
Abu Bash Taqi IDS, University of Sussex, UK [email protected]
Agnes Quisumbing IFPRI, USA [email protected]
Anand Kumar Jawaharlal Nehru University (JNU), India
Andrew Shepherd ODI, UK [email protected]
Andries du Toit Programme for Land and Agrarian Studies (PLAAS), South Africa
Andy McKay DEID, University of Bath, UK [email protected]
Bereket Kebede University of East Anglia, UK [email protected]
Bernardin Senadza University of Ghana [email protected]
Bob Baulch IDS, University of Sussex, UK [email protected]
Caroline Harper ODI, UK [email protected]
Charles Lwanga-Ntale Development Research & Training, Uganda
Elizabeth Francis LSE, UK [email protected]
Josphat Mushongah IDS, University of Sussex, UK [email protected]
Julia Brunt ODI, UK [email protected]
Kate Bird ODI, UK [email protected]
Lucy Scott ODI, UK [email protected]
Mastoera Sadan President’s Office, South Africa [email protected]
Paul Shaffer University of Toronto, Canada [email protected]
Peter Davis University of Bath, UK [email protected]
Sarah Ssewanyana EPRC, Uganda [email protected]
Shashanka Bhide National Council of Applied Economic Research (NCAER), India
Sharifa Begum BIDS, Bangladesh [email protected]
Stefan Dercon DID, University of Oxford, UK [email protected]
Tim Braunholtz ODI, UK [email protected]
Ursula Grant ODI, UK [email protected]
Vusi Gumede President’s Office, South Africa [email protected]
Zulfiqar Ali BIDS, Bangladesh [email protected]

33
Selected Bibliographic References On Panel Surveys and Life History Methods Deaton, A., 1997, The Analysis of Household Surveys, Baltimore John Hopkins University Press Deveureux, S. and Hoddinott. J., 1992, The Practice of Fieldwork, London: Earthscan Glewwe, P., 2000, ‘Panel Surveys’ in Grosh, M. and Glewwe, M., 2000, Designing LSMS Surveys in Developing Countries,Washington: World Bank Miller, R., 2000, Researching Life Stories and Family Histories, London; Sage Perks, R., and Thompson, A. (eds), 1998, The Oral History Reader, London; Routledge On Key Findings from the Studies Presented Beegle, K., De Weerdt, J., and Dercon, S., 2005, ‘Orphanhood and the long-run impact on children”, Mimeo (describes findings from the Kagera Health and Development Survey panel in Tanzania) Bouis, H.E., M. Palabrica-Costello, O. Solon, D. Westbrook, and A. B. Limbo 1998. Gender Equality and Investments in Adolescents in the Rural Philippines. Research Report 108. Washington, DC: International Food Policy Research Institute. Crosoer, D., Leibbrandt, M. and Woolard, I., 2005, ‘Asset-based versus money metric poverty indices in South Africa: an assessment using the Chronic Poverty Research Centre RSA 2002 survey’, draft Chronic Poverty Research Centre Working Paper Davis, P., 2006, Poverty dynamics in Bangladesh: Using life history interviews to explore trajectory patterns, Mimeo (paper distributed at workshop). Davis, P. 2005, “Power-resources and Social Policy in Bangladesh”, Ph.D. Thesis, University of Bath Dercon, S., forthcoming, ‘Economic reform, growth and the poor: evidence from rural Ethiopia”, Journal of Development Economics Du Toit, A., 2005, Chronic and Structural Poverty in South Africa: challenges for action and research CPRC Working paper 59, University of Manchester Estudillo, J., Quisumbing, A., and Otsuka, K., 2001., ‘Gender differences in land inheritance, schooling and lifetime income: evidence from the Rural Philippines’, Journal of Development Studies, 37(4): 23-49 Francis, E., 2000, Making a Living: Changing Livelihoods in Rural Africa, London: Routledge Francis, E., 2002, 'Rural Livelihoods, Institutions and Vulnerability in North West Province, South Africa', Journal of Southern African Studies, 28(3): 531-550.

34
Francis, E. and Hoddinott, J., 1993, ‘Migration and differentiation in Western Kenya: a tale of two sub-locations’, Journal of Development Studies, 30(1): 115-145 Kebede, B., 2002, ‘Land tenure and common pool resources in Ethiopia: a study based on fifteen sites’, African Development Review, 14(1): 113-49 Maluccio, J., Hoddinott J., Behrman, J., Martorell R., Quisumbing A., Stein A., 2005, ‘The impact of an experimental nutritional intervention in childhood on education among Guatemalan adults’, Mimeo: International Food Policy Research Institute Place, F., et al., forthcoming, “Identifying the rural poor and their ability to invest in agriculture: compatible and conflicting implications from quantitative and qualitative data from Western Kenya”, World Development Pradhan, M. and Ravallion, M., 2000, “Measuring poverty using qualitative perceptions of consumption adequacy”, Review of Economics and Statistics, 82(3): 462-471 Quisumbing, A. and S. McNiven, S. 2005. Migration and the rural-urban continuum: Evidence from the Rural Philippines. FCND Discussion Paper 197. Washington, D.C.: International Food Policy Research Institute. Rao, V., Gupta, I. and Smarajit, J., forthcoming, “Sex workers and the cost of safe sex: the compensating differential for condom use in Calcutta”, Journal of Development Economics (also World Bank Policy Research Working Paper 2334) Shaffer, P., 2003, “Difficulties in combining income/consumption and participatory poverty approaches: issues and examples” in Kanbur, R. (ed), Qualitative and Quantitative Poverty Appraisal, Delhi: Permanent Black