Embed Size (px)
Citation preview
6/7/2019
1
The Science of Management – A Scientific Approach to Decision
Making Cameron Cox, III, FACMPE, MHA
President, MSOC HealthChapel Hill, NC
Learning Objectives
• Identify important differences between data, analysis and presentation
• Recognize differences in analytical methods
• Summarize financial metrics and analytics in a practice setting
1
2
6/7/2019
2
What is (big) data?
Source: http://shmsoft.blogspot.com/2014/03/big-data-cartoon-data-is-new-oil.html
Big Data Defined by Big Data
3
4

6/7/2019
3
Stereotypical Presentation of Data
The Dashboard
5
6

6/7/2019
4
Purpose and Objectives of Effective Dashboard of Data
• Visual Display– The display of any effective dashboard will be visually appealing to
the end user.
• Concisely Consolidated– The data presented will be quickly and easily decipherable to the
end user.
• Monitored at a Glance– The end user will be able to interpret from the visual display an end
effect that will provide the ability to determine whether results are acceptable or need action.
Classic Dashboard
7
8
6/7/2019
5
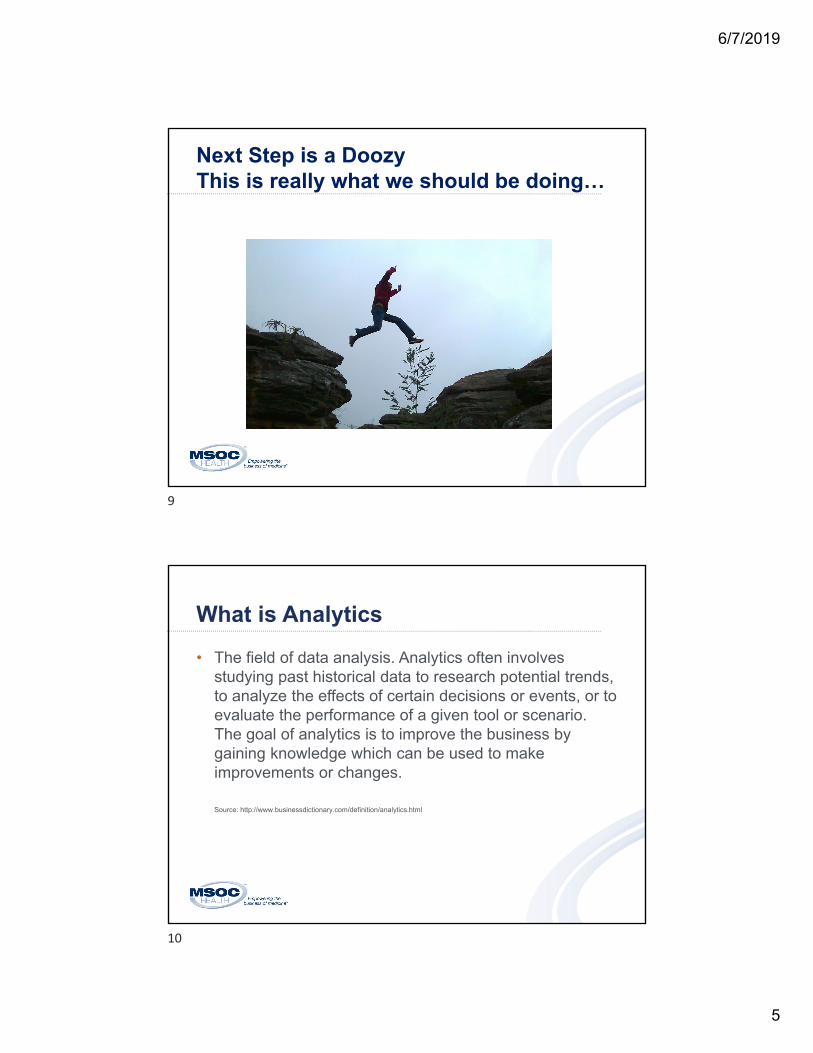
Next Step is a DoozyThis is really what we should be doing…
What is Analytics
• The field of data analysis. Analytics often involves studying past historical data to research potential trends, to analyze the effects of certain decisions or events, or to evaluate the performance of a given tool or scenario. The goal of analytics is to improve the business by gaining knowledge which can be used to make improvements or changes.
Source: http://www.businessdictionary.com/definition/analytics.html
9
10

6/7/2019
6
The Analytics Continuum
Difficulty Level
Val
ue
The Analytics Continuum
Difficulty Level
Val
ue
11
12

6/7/2019
7
Descriptive
What happened?
• End of Month Reports
• Payor Mix for a month, year, etc.
• wRVU reports by Provider
• Total Charges, Payments and Adjustments
Tools for Descriptive
• Dashboards
• Scorecards
• Business Reports (EOM, etc.)
13
14
6/7/2019
8
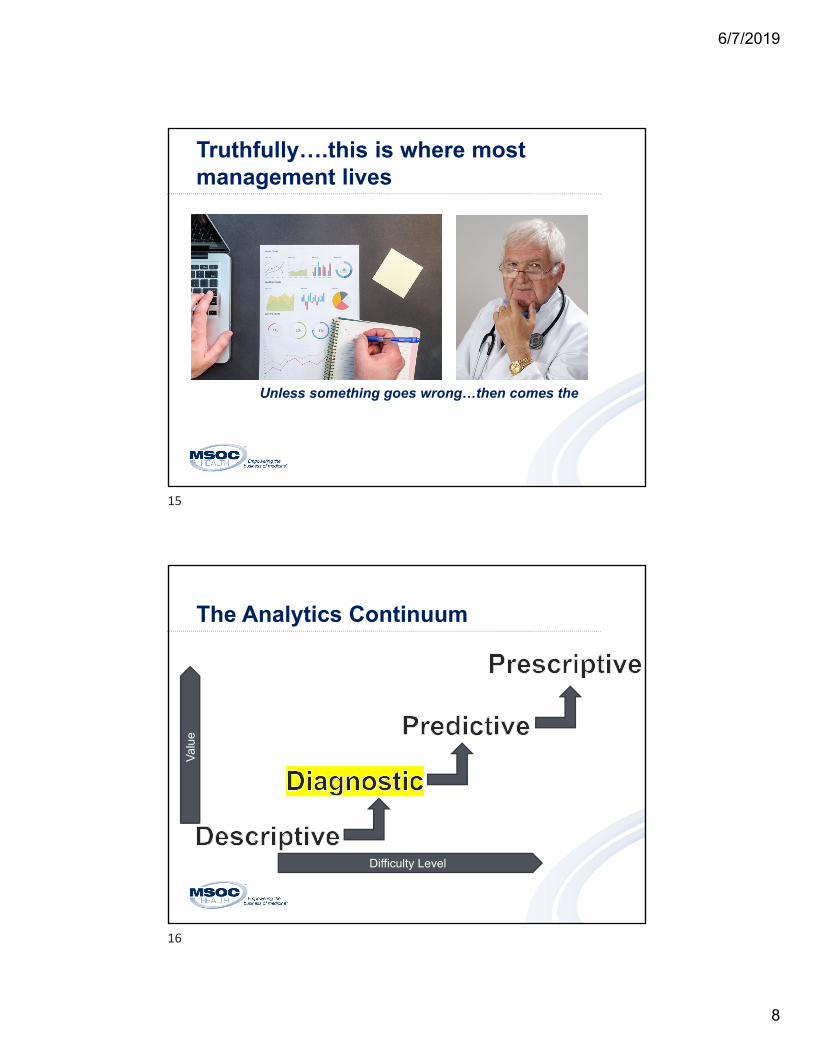
Truthfully….this is where most management lives
Unless something goes wrong…then comes the
The Analytics Continuum
Difficulty Level
Val
ue
15
16
6/7/2019
9
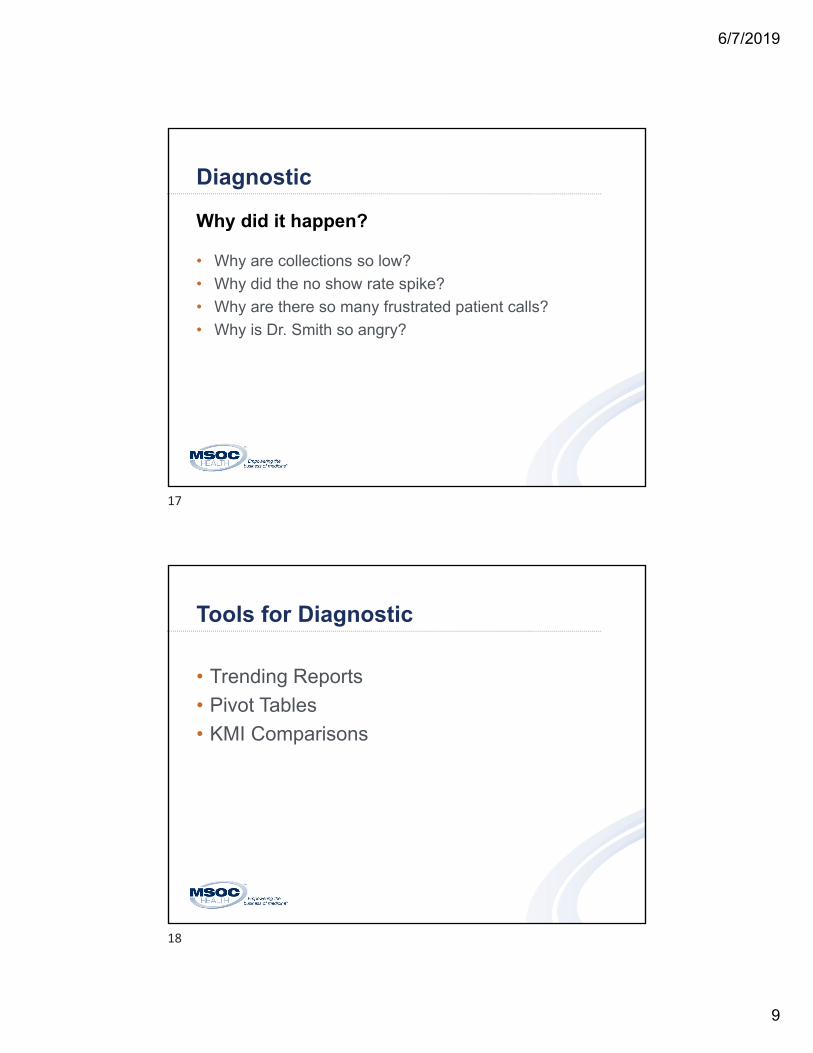
Diagnostic
Why did it happen?
• Why are collections so low?
• Why did the no show rate spike?
• Why are there so many frustrated patient calls?
• Why is Dr. Smith so angry?
Tools for Diagnostic
• Trending Reports
• Pivot Tables
• KMI Comparisons
17
18

6/7/2019
10
Diagnostic is where we are constantly answering the questions…
“I’m working so much harder, but my collections have only gone up a little bit. What is wrong?”
Physician Compensation Diagnosis
19
20
6/7/2019
11
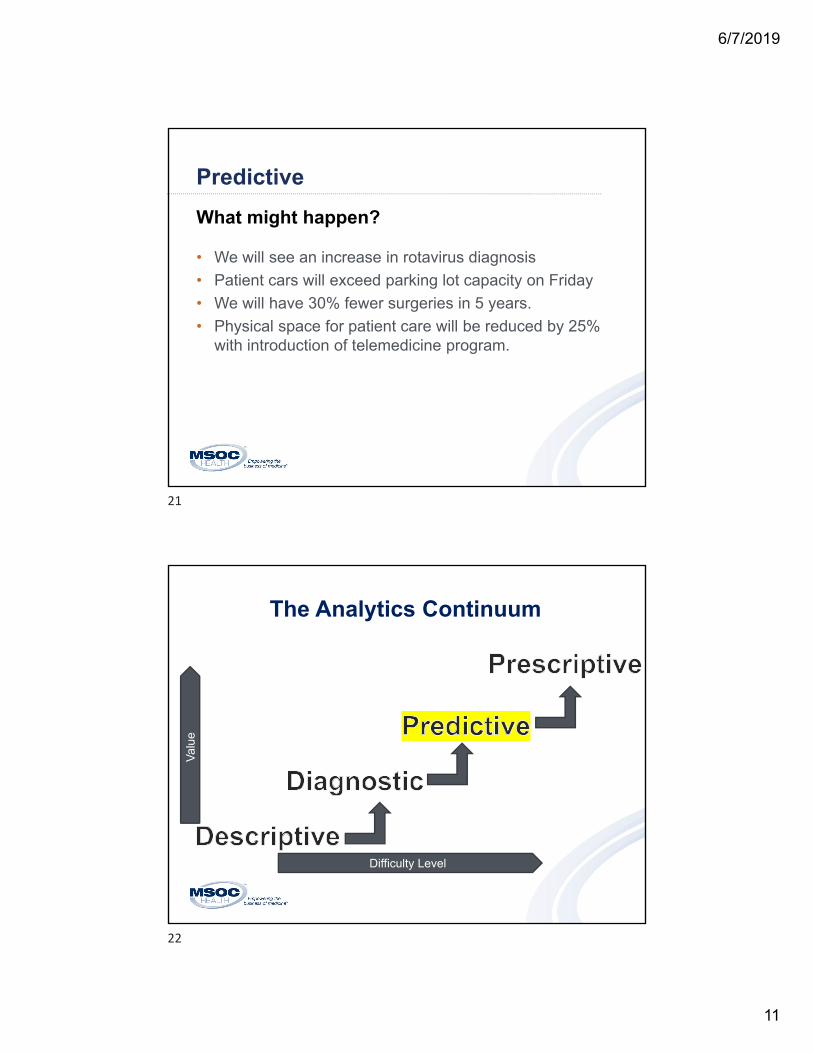
Predictive
What might happen?
• We will see an increase in rotavirus diagnosis
• Patient cars will exceed parking lot capacity on Friday
• We will have 30% fewer surgeries in 5 years.
• Physical space for patient care will be reduced by 25% with introduction of telemedicine program.
The Analytics Continuum
Difficulty Level
Val
ue
21
22

6/7/2019
12
Tools for Predictive
• Mining of data sets
• Forecasting
Other Industries Use This –How can we?
23
24

6/7/2019
13
Forecasting
If you look at the graph, you can see that the actual payments per month (the blue line) stays close to the predicted forecast (the grey line). Simply by using your eye test, you are able to see that this forecasting method is really accurate.
The Analytics Continuum
Difficulty Level
Val
ue
25
26

6/7/2019
14
Prescriptive
What actions should be taken?
• We can maximize profitability by restructuring physician procedures.
• Restructuring surgery coordinators can minimize resource expense for scheduling of provider surgeries.
Tools for Prescriptive
• Linear Programming
• Optimization – Problem Solver
• Decision Modeling (Decision Analysis Software)
27
28
6/7/2019
15
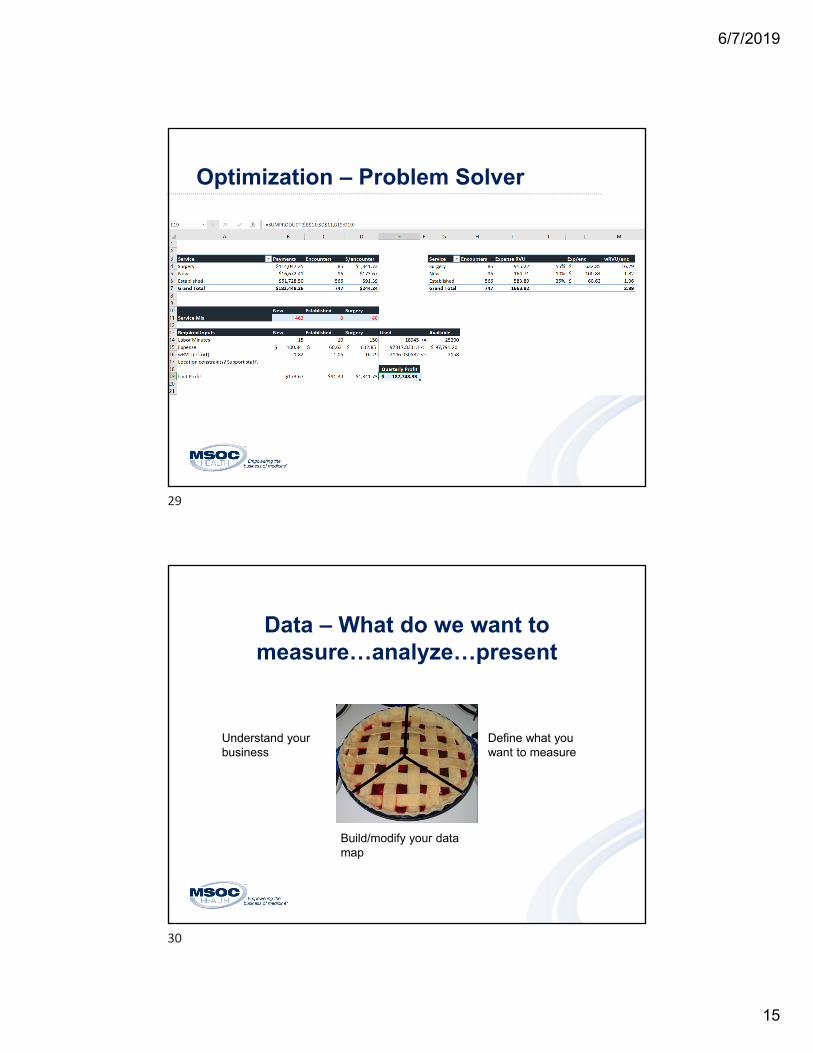
Optimization – Problem Solver
Data – What do we want to measure…analyze…present
Understand your business
Define what you want to measure
Build/modify your data map
29
30

6/7/2019
16
Thank You
MSOC Health(866) 347-0001
200 Timber Hill Place Suite 221Chapel Hill, NC 27514
www.msochealth.com
Thank You
31