Embed Size (px)
Citation preview
Cowen and Company
Global Transportation & Aerospace/Defense Conference
September 3, 2014
2
Certain statements set forth in this presentation and statements made during this presentation, including,without limitation, information respecting WestJet’s ROIC target of a sustainable 12%; the anticipated timing ofthe 737 MAX deliveries and the associated benefits of this type of aircraft and the LEAP-1B engine; our 737 andQ400 fleet plans; our plans to introduce wide-body service with initial flights planned between Alberta andHawaii in late 2015; our expectations of further expansion through WestJet Vacations, additional flights andnew airline partnerships; the installation timing of our new in-flight entertainment system; WestJet Encore’snetwork growth plans; our expectations to retain a strong cash balance; and our 2014 third quarter and 2014full year outlook are forward-looking statements within the meaning of applicable Canadian securities laws.
By their nature, forward-looking statements are subject to numerous risks and uncertainties, some of which arebeyond WestJet’s control. Readers are cautioned that undue reliance should not be placed on forward-lookingstatements as actual results may vary materially from the forward-looking statements due to a number offactors including, without limitation, changes in consumer demand, energy prices, aircraft deliveries, generaleconomic conditions, competitive environment, regulatory developments, environment factors, ability toeffectively implement and maintain critical systems and other factors and risks described in WestJet’s publicreports and filings which are available under WestJet’s profile at www.sedar.com.
Any forward-looking statements contained in this presentation and statements made during this presentationrepresent WestJet’s expectations as of the date of this presentation and are subject to change after such date.WestJet does not undertake to update, correct or revise any forward-looking statements as a result of any newinformation, future events or otherwise, except as may be required by law.
September 2014
Caution regarding forward-looking information

3
This presentation contains disclosure respecting non-GAAP financial measures including, withoutlimitation, return on invested capital (ROIC); CASM, excluding fuel and employee profit share; cash tolast twelve months revenue; adjusted net debt to earnings before interest, taxes, depreciation,amortization and rent (EBITDAR); and adjusted debt to equity. These measures are included toenhance the overall understanding of WestJet’s financial performance and to provide an alternativemethod for assessing WestJet’s operating results in a manner that is focused on the performance ofWestJet’s ongoing operations, and to provide a more consistent basis for comparison betweenreporting periods. These measures are not calculated in accordance with, or an alternative to, GAAPand do not have standardized meanings. Therefore, they may not be comparable to similar measuresprovided by other entities. Readers are urged to review the section entitled “Reconciliation of non-GAAP and additional GAAP measures” in WestJet’s management’s discussion and analysis of financialresults for the three and six months ended June 30, 2014, which is available under WestJet’s profile atwww.sedar.com, for a further discussion of such non-GAAP measures.
Non-GAAP measures
4
-50
0
50
100
150
200
250
19
96
19
97
19
98
19
99
20
00
20
01
20
02
20
03
20
04
20
05
20
06
20
07
20
08
20
09
20
10
20
11
20
12
20
13
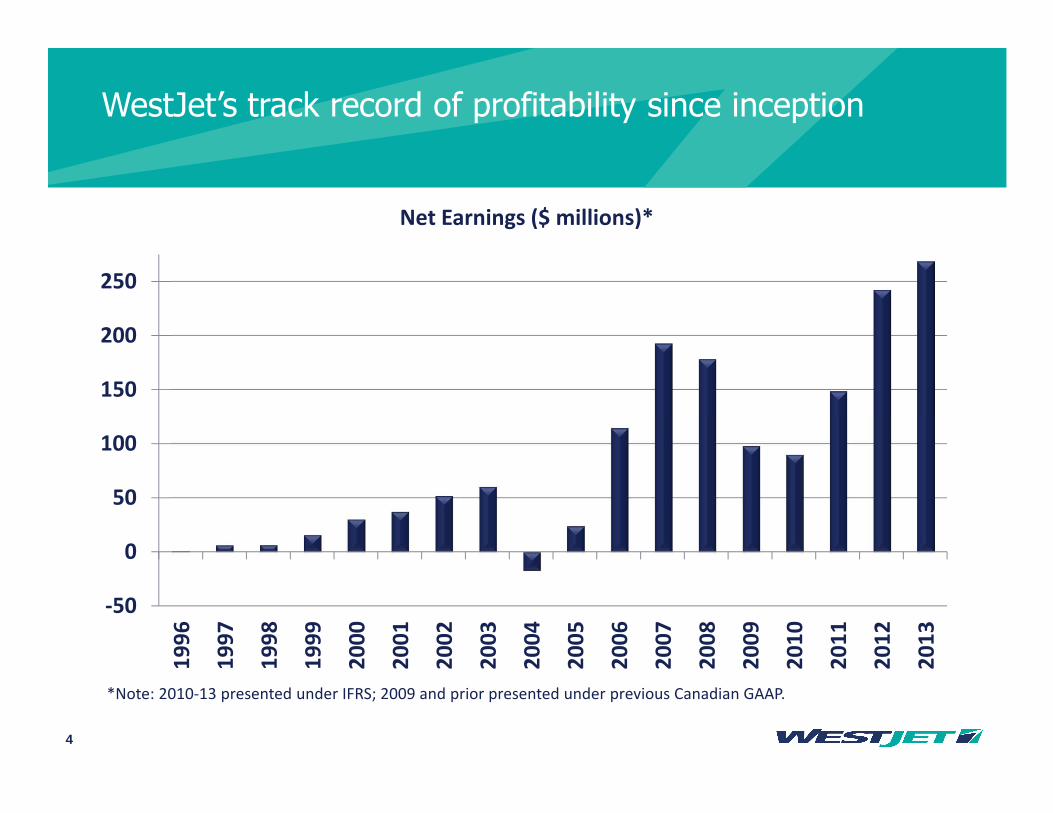
Net Earnings ($ millions)*
WestJet’s track record of profitability since inception
*Note: 2010-13 presented under IFRS; 2009 and prior presented under previous Canadian GAAP.
5
5%
6%
7%
8%
9%
10%
11%
12%
13%
14%
15%
2005 2006 2007 2008 2009 2010 2011 2012 2013 Q2
2014
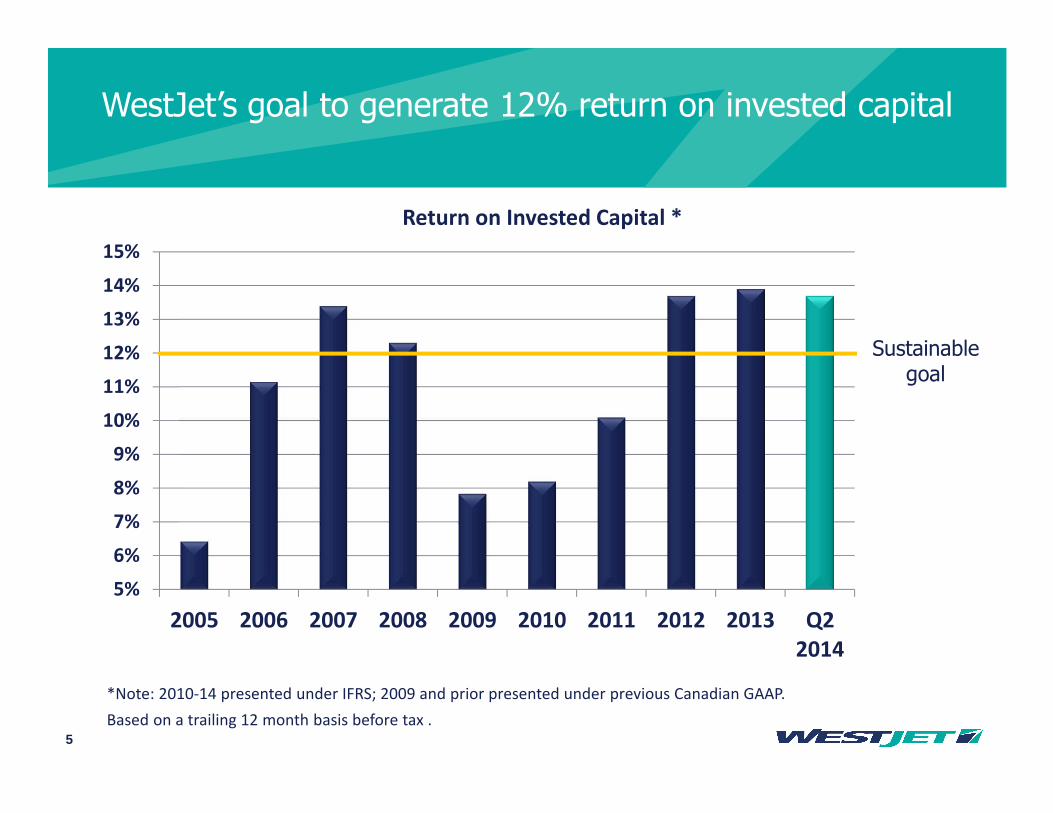
Return on Invested Capital *
Sustainable goal
WestJet’s goal to generate 12% return on invested capital
*Note: 2010-14 presented under IFRS; 2009 and prior presented under previous Canadian GAAP.
Based on a trailing 12 month basis before tax .

6
0
2,500
5,000
7,500
10,000
12,500
15,000
17,500
20,000
20
01
20
02
20
03
20
04
20
05
20
06
20
07
20
08
20
09
20
10
20
11
20
12
20
13
Guests (thousands)
WestJet a profitable growth story
0
5,000
10,000
15,000
20,000
25,000
20
01
20
02
20
03
20
04
20
05
20
06
20
07
20
08
20
09
20
10
20
11
20
12
20
13
Available Seat Miles (millions)
0
500
1,000
1,500
2,000
2,500
3,000
3,500
4,000
20
01
20
02
20
03
20
04
20
05
20
06
20
07
20
08
20
09
20
10
20
11
20
12
20
13
Revenue ($ millions)
7
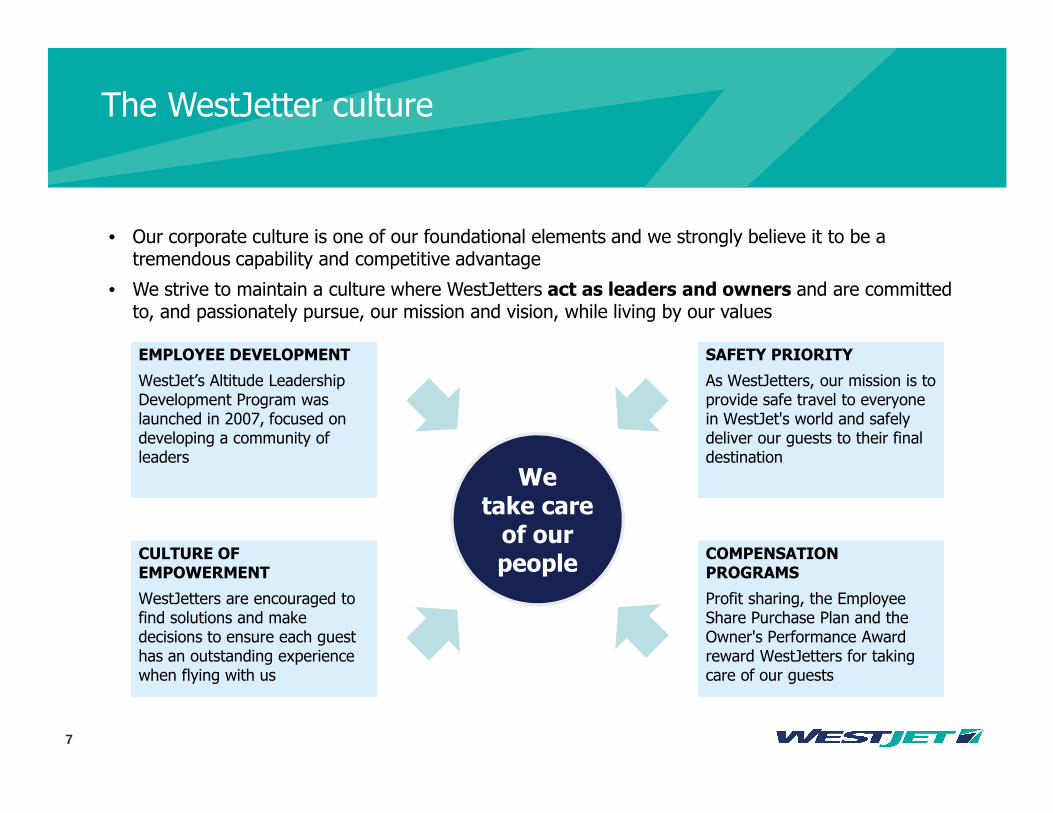
The WestJetter culture
• Our corporate culture is one of our foundational elements and we strongly believe it to be a tremendous capability and competitive advantage
• We strive to maintain a culture where WestJetters act as leaders and owners and are committed to, and passionately pursue, our mission and vision, while living by our values
EMPLOYEE DEVELOPMENT
WestJet’s Altitude Leadership Development Program was launched in 2007, focused on developing a community of leaders
CULTURE OF EMPOWERMENT
WestJetters are encouraged to find solutions and make decisions to ensure each guest has an outstanding experience when flying with us
COMPENSATION PROGRAMS
Profit sharing, the Employee Share Purchase Plan and the Owner's Performance Award reward WestJetters for taking care of our guests
SAFETY PRIORITY
As WestJetters, our mission is to provide safe travel to everyone in WestJet's world and safely deliver our guests to their final destination
We take care of our people
8
Consistently recognized by the industry and our guests
• Interbrand Canada’s Best Canadian Brands, rank #20 (2014)
• Canada’s Most Preferred Airline (2014)
• Value Airline of the Year (2014)
• Canada’s Most Attractive Employer (2014/2013/2012)
• Highest equity score: airline, vacation package supplier brands (2013)
• Gold Stevie Award Best Transportation Company (2013)
• Chairman’s Circle Award: WestJet Vacations (2013)
• WestJet RBC MasterCard ranked #1 in Canada (2013)
• WestJet RBC MasterCard Named Canada’s Top Travel Rewards Credit Card (2013)
• Gregg Saretsky Named Top New CEO (2013)
99
TO BE UPDATED – CREATIVE SERVICES
10
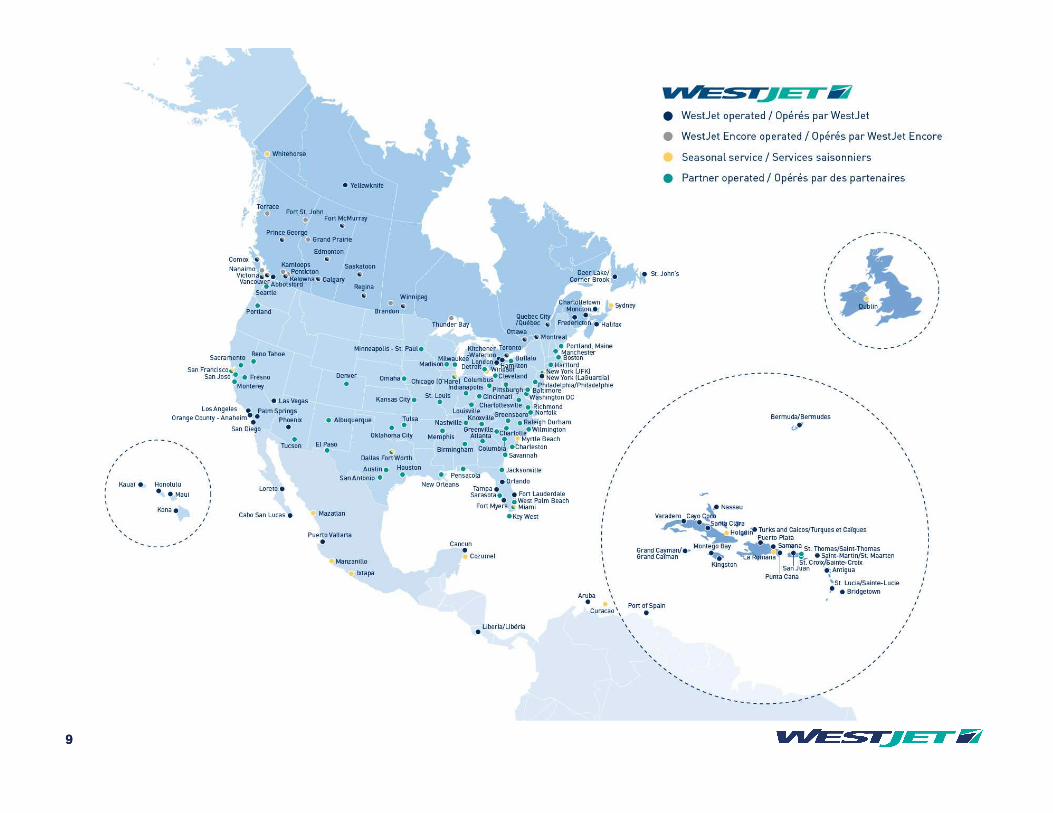
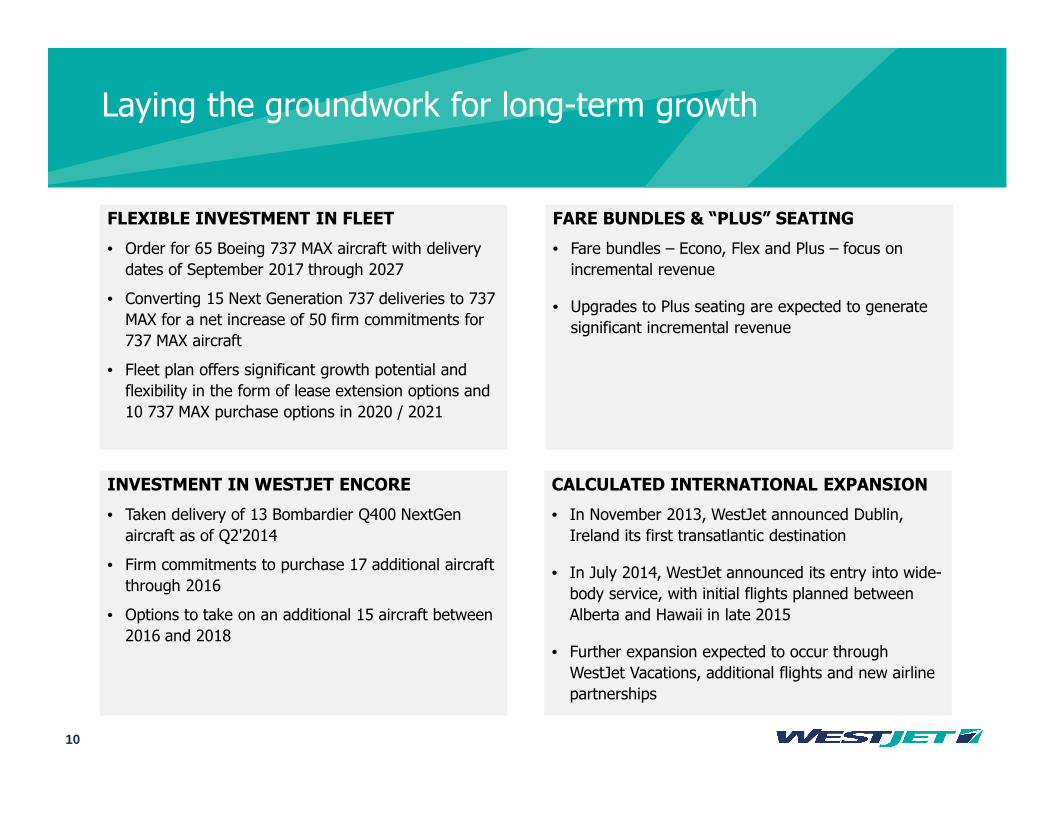
CALCULATED INTERNATIONAL EXPANSION
• In November 2013, WestJet announced Dublin,
Ireland its first transatlantic destination
• In July 2014, WestJet announced its entry into wide-
body service, with initial flights planned between
Alberta and Hawaii in late 2015
• Further expansion expected to occur through
WestJet Vacations, additional flights and new airline
partnerships
INVESTMENT IN WESTJET ENCORE
• Taken delivery of 13 Bombardier Q400 NextGen
aircraft as of Q2'2014
• Firm commitments to purchase 17 additional aircraft
through 2016
• Options to take on an additional 15 aircraft between
2016 and 2018
FARE BUNDLES & “PLUS” SEATING
• Fare bundles – Econo, Flex and Plus – focus on
incremental revenue
• Upgrades to Plus seating are expected to generate
significant incremental revenue
Laying the groundwork for long-term growth
FLEXIBLE INVESTMENT IN FLEET
• Order for 65 Boeing 737 MAX aircraft with delivery
dates of September 2017 through 2027
• Converting 15 Next Generation 737 deliveries to 737
MAX for a net increase of 50 firm commitments for
737 MAX aircraft
• Fleet plan offers significant growth potential and
flexibility in the form of lease extension options and
10 737 MAX purchase options in 2020 / 2021
Growth and strong financial performance continues

12
Operating highlights – Q2 2014
Q2 2014 Q2 2013 Change
Total revenue (millions) $930.3 $843.7 10.3%
Net earnings (millions) $51.8 $44.7 15.9%
Diluted earnings per share $0.40 $0.34 17.6%
RASM (revenue per available seat mile) (cents)
15.02 14.33 4.8%
Yield (revenue per revenue passenger mile) (cents)
18.87 18.05 4.5%
Load Factor 79.6% 79.4% 0.2 pts
CASM, excl. fuel and employee profit share (cents)
9.23 9.06 1.9%
37th consecutive quarter of profitability and record earnings
13
18.1% 17.5%16.1%
12.4%10.8%
9.8%8.4% 7.9%
1.0%
-1.9%-5%
0%
5%
10%
15%
20%A
lle
gia
nt
Sp
irit
Ala
ska
JetB
lue
So
uth
we
st
We
stJe
t
De
lta
Am
eri
can
Un
ite
d
Air
Ca
na
da
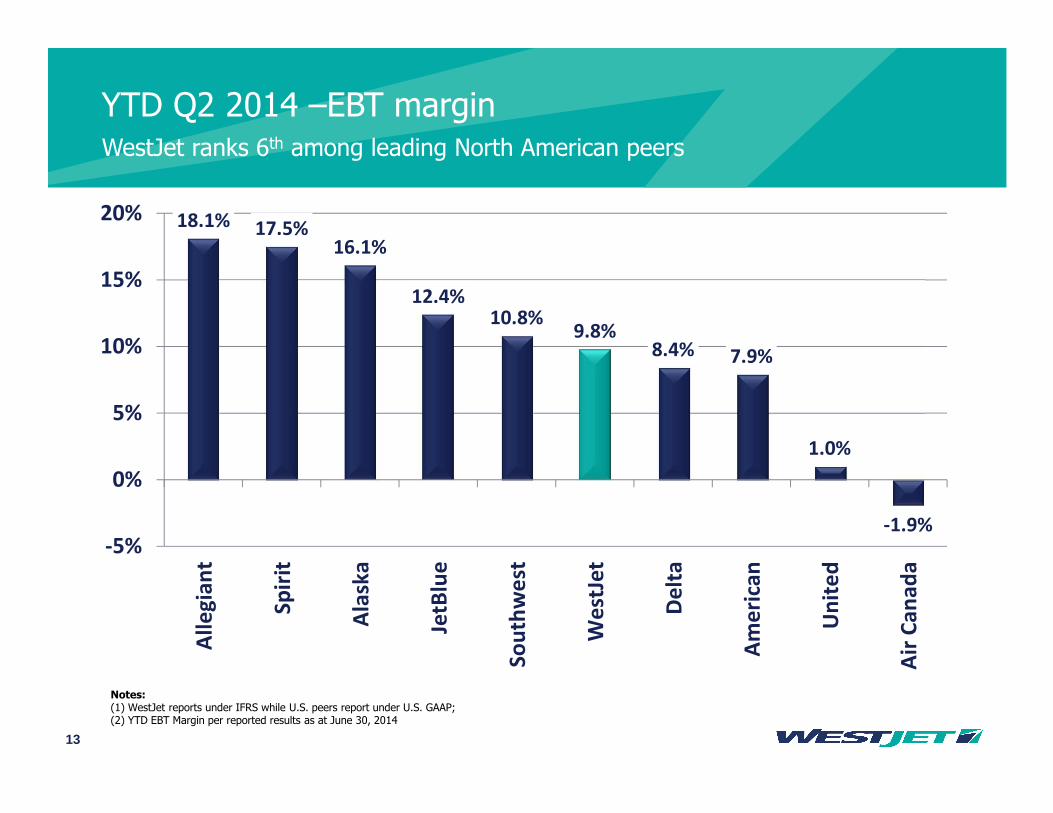
YTD Q2 2014 –EBT marginWestJet ranks 6th among leading North American peers
Notes: (1) WestJet reports under IFRS while U.S. peers report under U.S. GAAP; (2) YTD EBT Margin per reported results as at June 30, 2014
14
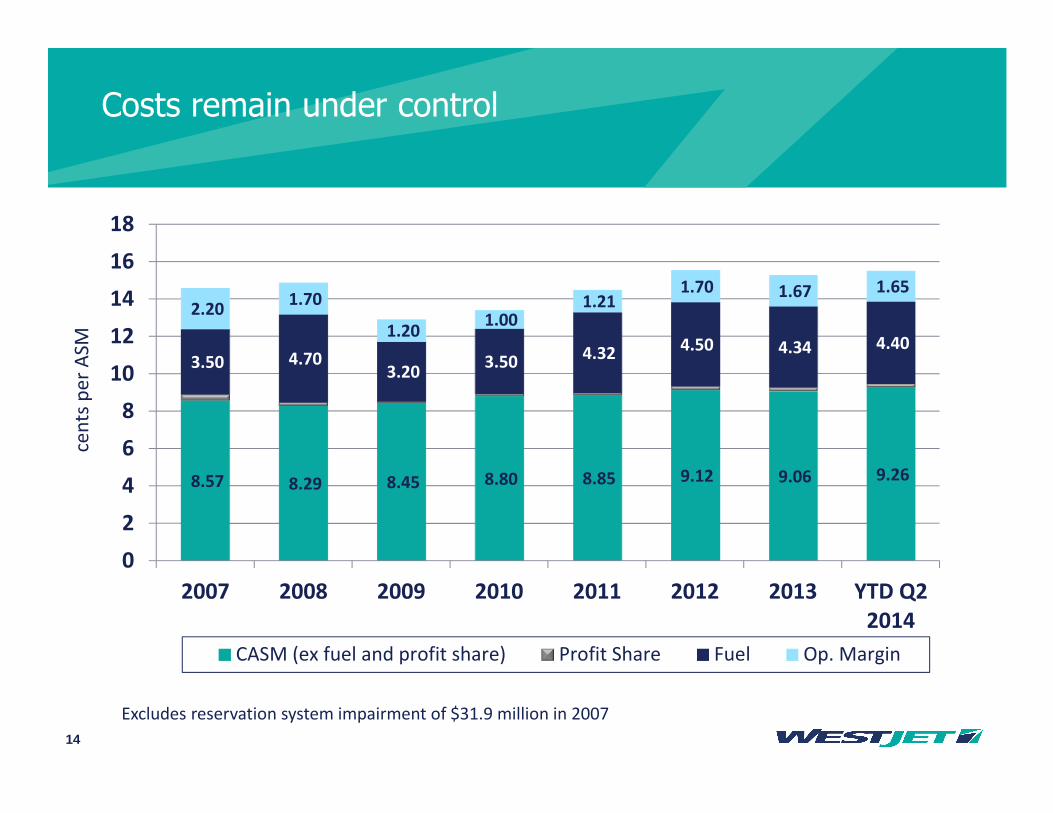
Costs remain under control
8.57 8.29 8.45 8.80 8.85 9.12 9.06 9.26
3.50 4.70 3.20
3.50 4.32 4.50 4.34 4.40
2.20 1.70
1.20 1.00
1.21 1.70 1.67 1.65
0
2
4
6
8
10
12
14
16
18
2007 2008 2009 2010 2011 2012 2013 YTD Q2
2014
cen
ts p
er
ASM
CASM (ex fuel and profit share) Profit Share Fuel Op. Margin
Excludes reservation system impairment of $31.9 million in 2007
15
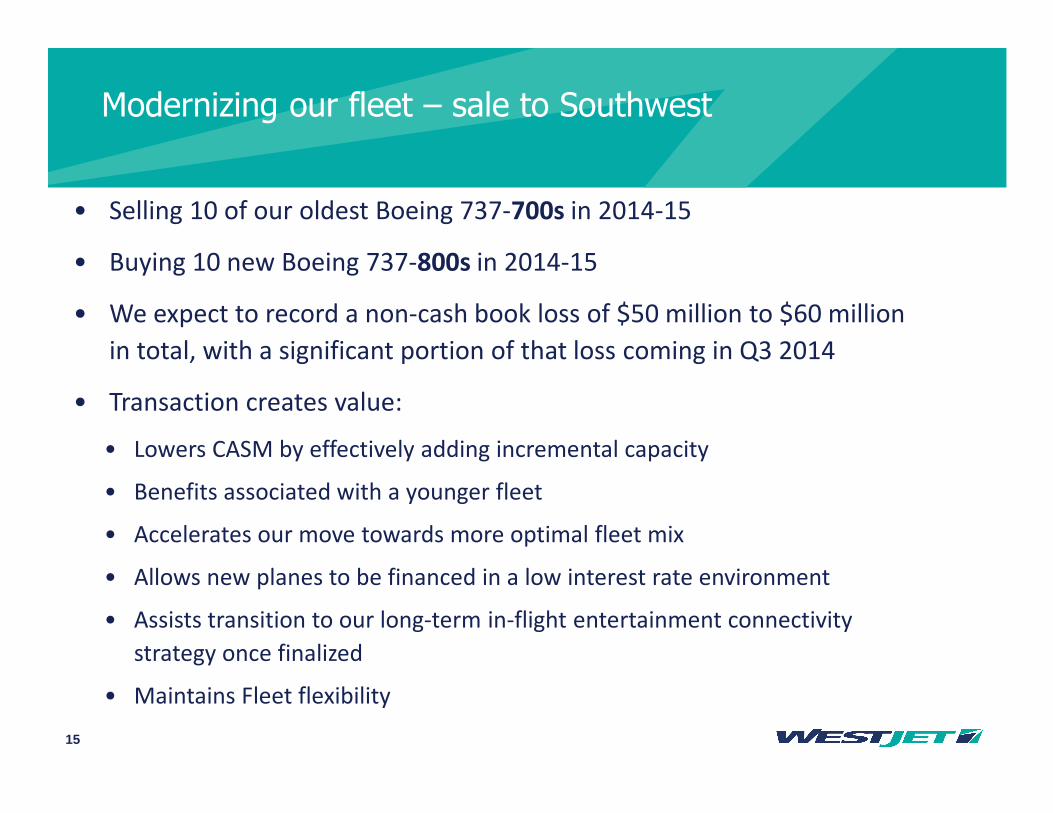
Modernizing our fleet – sale to Southwest
• Selling 10 of our oldest Boeing 737-700s in 2014-15
• Buying 10 new Boeing 737-800s in 2014-15
• We expect to record a non-cash book loss of $50 million to $60 million
in total, with a significant portion of that loss coming in Q3 2014
• Transaction creates value:
• Lowers CASM by effectively adding incremental capacity
• Benefits associated with a younger fleet
• Accelerates our move towards more optimal fleet mix
• Allows new planes to be financed in a low interest rate environment
• Assists transition to our long-term in-flight entertainment connectivity
strategy once finalized
• Maintains Fleet flexibility
16
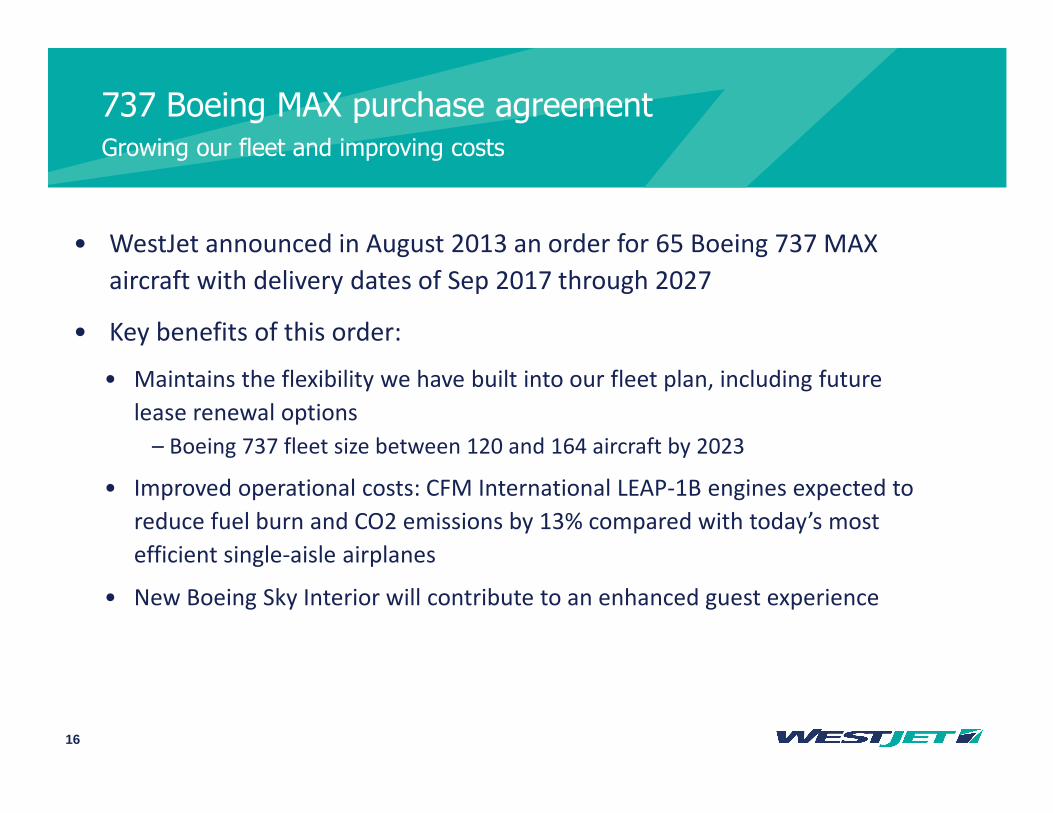
737 Boeing MAX purchase agreement
• WestJet announced in August 2013 an order for 65 Boeing 737 MAX
aircraft with delivery dates of Sep 2017 through 2027
• Key benefits of this order:
• Maintains the flexibility we have built into our fleet plan, including future
lease renewal options
– Boeing 737 fleet size between 120 and 164 aircraft by 2023
• Improved operational costs: CFM International LEAP-1B engines expected to
reduce fuel burn and CO2 emissions by 13% compared with today’s most
efficient single-aisle airplanes
• New Boeing Sky Interior will contribute to an enhanced guest experience
Growing our fleet and improving costs

17
107 100 99 94 90 85 81 76 76 76
11 23 29 34 39 4412 20 26
30 35 39 44
44 44
107 112 119
124 131
143 149 154
159 164
0
25
50
75
100
125
150
175
2014 2015 2016 2017 2018 2019 2020 2021 2022 2023
737 NG Committed Fleet 737 MAX Committed Fleet
Cumulative Lease Extension Options
Measured growth - 737 flexible fleet planincluding fleet modernization
120
18
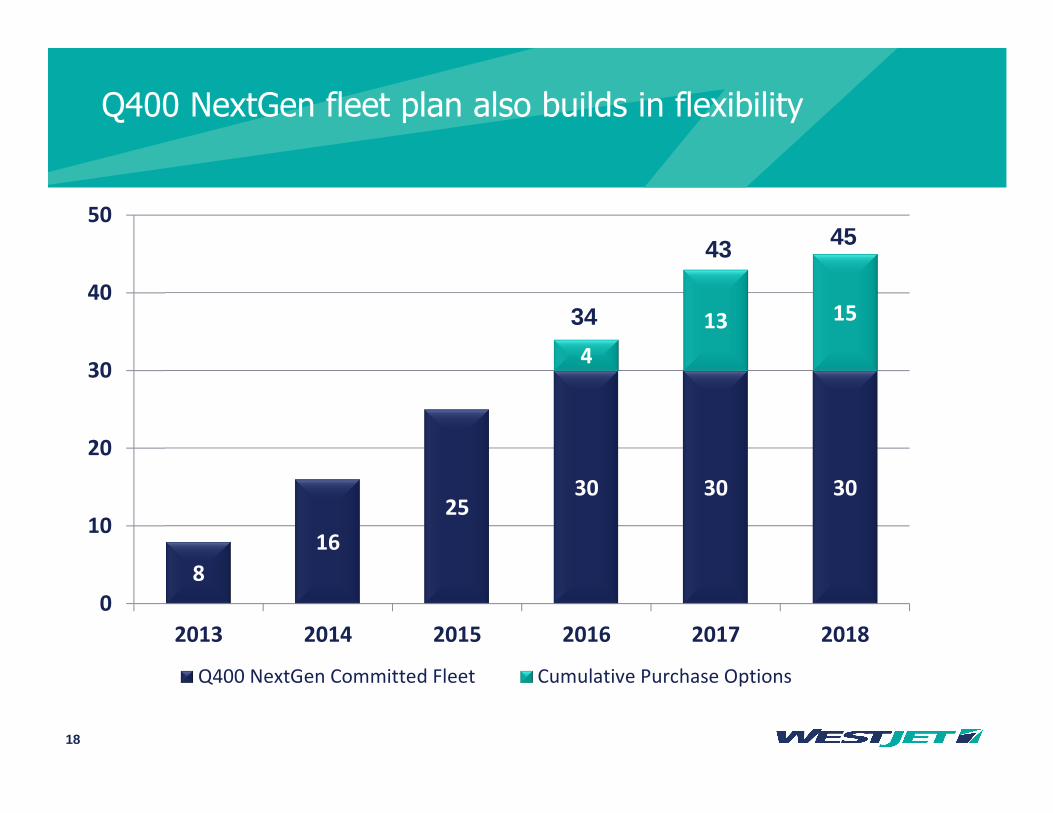
8
16
2530 30 30
4
13 15
0
10
20
30
40
50
2013 2014 2015 2016 2017 2018
Q400 NextGen Committed Fleet Cumulative Purchase Options
34
43 45
Q400 NextGen fleet plan also builds in flexibility

Building on our capabilities
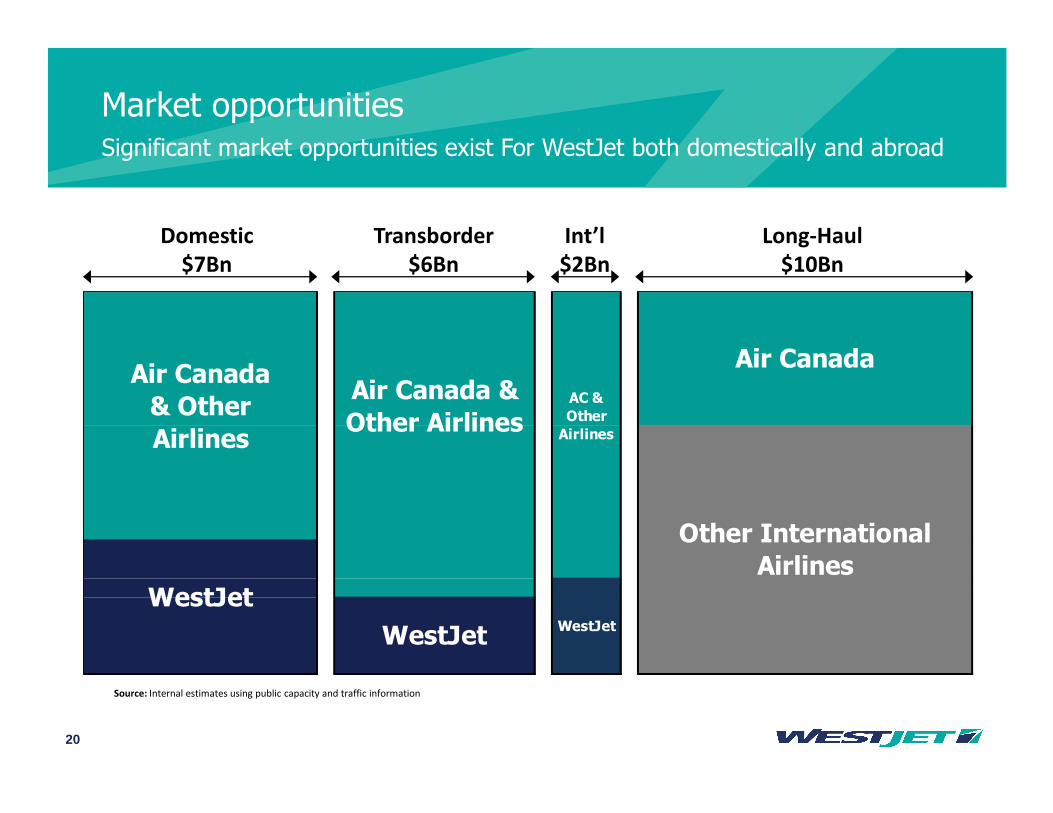
20
Market opportunitiesSignificant market opportunities exist For WestJet both domestically and abroad
Air Canada
Other International
Airlines
Air Canada
& Other
Airlines
WestJet
Air Canada &
Other AirlinesAC &
Other
Airlines
WestJetWestJet
Source: Internal estimates using public capacity and traffic information
Domestic
$7Bn
Transborder
$6Bn
Int’l
$2Bn
Long-Haul
$10Bn
21
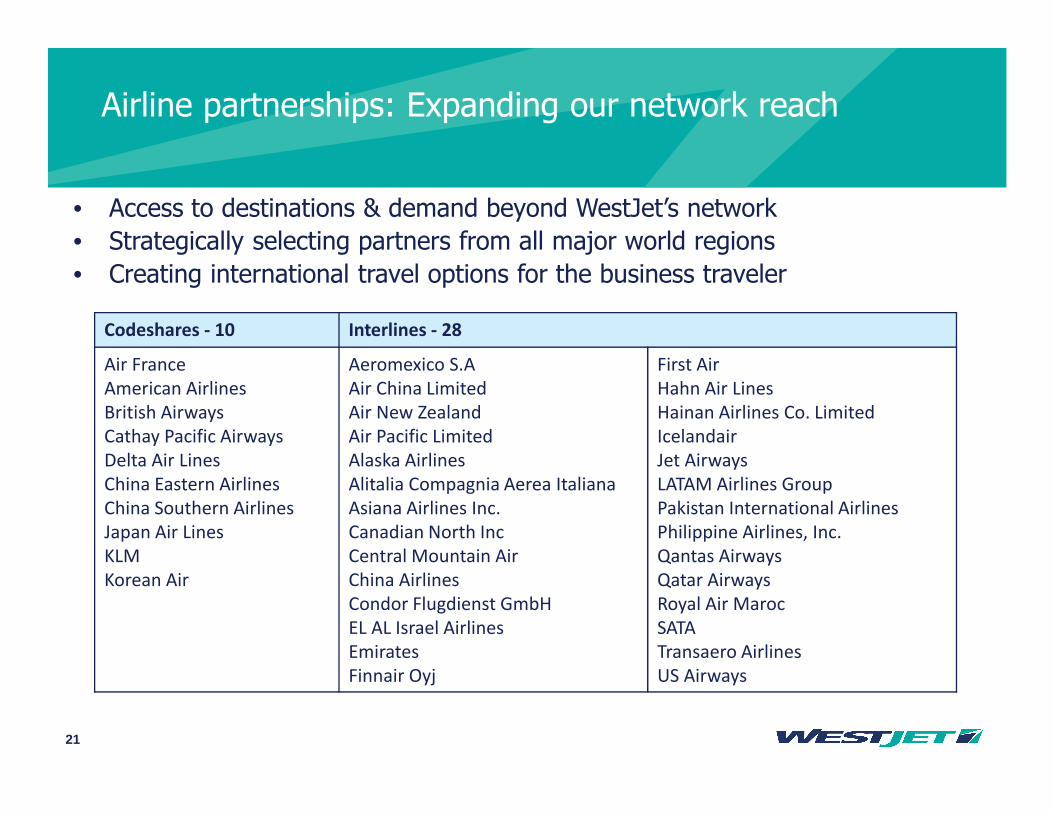
Airline partnerships: Expanding our network reach
• Access to destinations & demand beyond WestJet’s network
• Strategically selecting partners from all major world regions
• Creating international travel options for the business traveler
Codeshares - 10 Interlines - 28
Air France
American Airlines
British Airways
Cathay Pacific Airways
Delta Air Lines
China Eastern Airlines
China Southern Airlines
Japan Air Lines
KLM
Korean Air
Aeromexico S.A
Air China Limited
Air New Zealand
Air Pacific Limited
Alaska Airlines
Alitalia Compagnia Aerea Italiana
Asiana Airlines Inc.
Canadian North Inc
Central Mountain Air
China Airlines
Condor Flugdienst GmbH
EL AL Israel Airlines
Emirates
Finnair Oyj
First Air
Hahn Air Lines
Hainan Airlines Co. Limited
Icelandair
Jet Airways
LATAM Airlines Group
Pakistan International Airlines
Philippine Airlines, Inc.
Qantas Airways
Qatar Airways
Royal Air Maroc
SATA
Transaero Airlines
US Airways
22
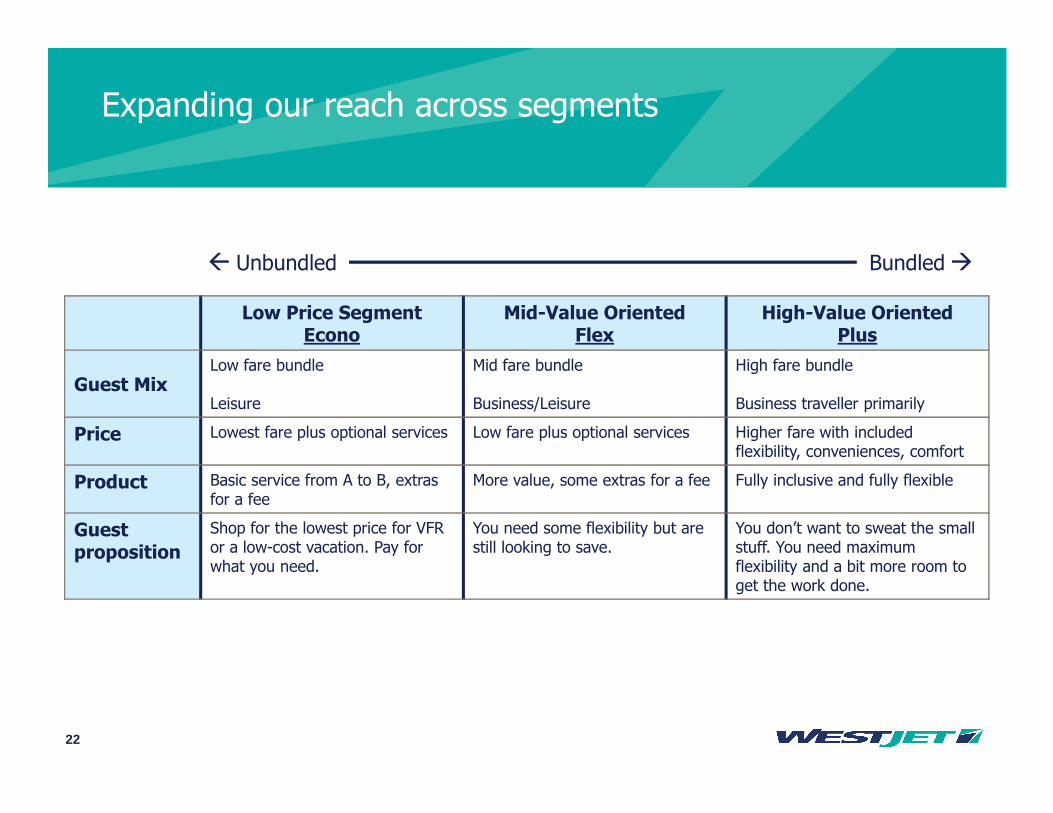
Expanding our reach across segments
Low Price SegmentEcono
Mid-Value OrientedFlex
High-Value OrientedPlus
Guest MixLow fare bundle
Leisure
Mid fare bundle
Business/Leisure
High fare bundle
Business traveller primarily
Price Lowest fare plus optional services Low fare plus optional services Higher fare with included flexibility, conveniences, comfort
Product Basic service from A to B, extras for a fee
More value, some extras for a fee Fully inclusive and fully flexible
Guestproposition
Shop for the lowest price for VFRor a low-cost vacation. Pay for what you need.
You need some flexibility but are still looking to save.
You don’t want to sweat the small stuff. You need maximum flexibility and a bit more room to get the work done.
� Unbundled Bundled�

23
Plus fare product is a win-win for WestJet and its guests
24
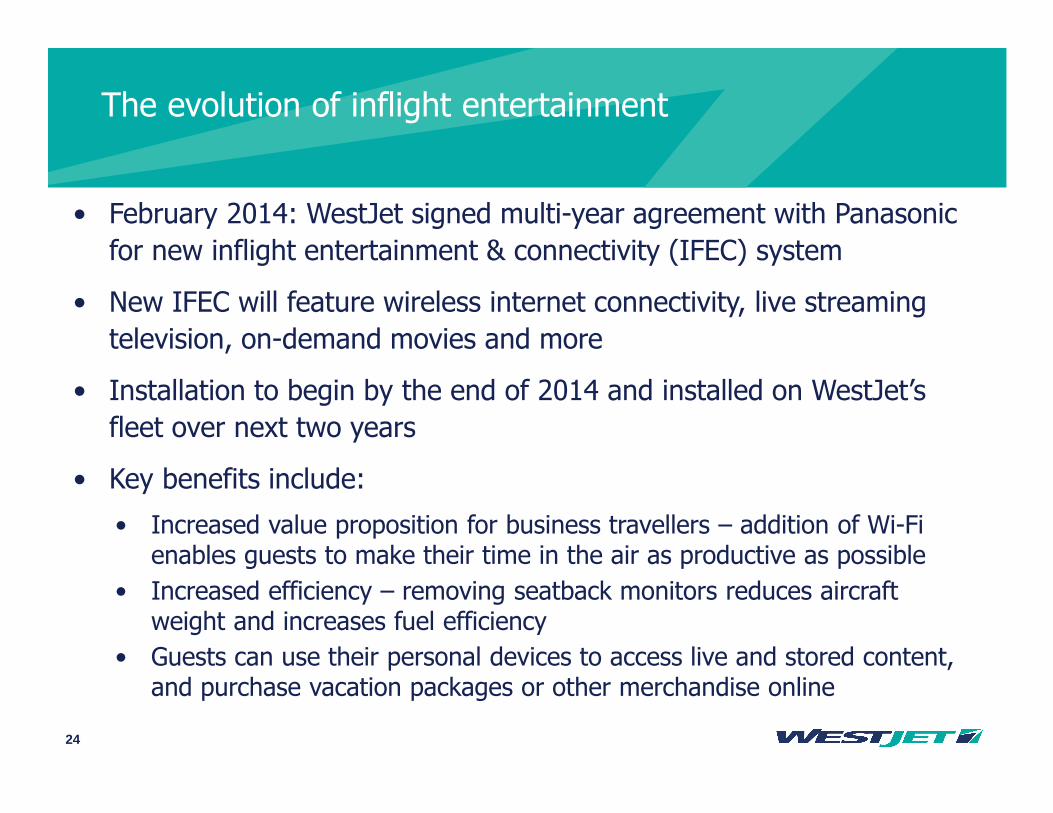
The evolution of inflight entertainment
• February 2014: WestJet signed multi-year agreement with Panasonic
for new inflight entertainment & connectivity (IFEC) system
• New IFEC will feature wireless internet connectivity, live streaming
television, on-demand movies and more
• Installation to begin by the end of 2014 and installed on WestJet’s
fleet over next two years
• Key benefits include:
• Increased value proposition for business travellers – addition of Wi-Fi enables guests to make their time in the air as productive as possible
• Increased efficiency – removing seatback monitors reduces aircraft weight and increases fuel efficiency
• Guests can use their personal devices to access live and stored content, and purchase vacation packages or other merchandise online
WestJet Encore
26
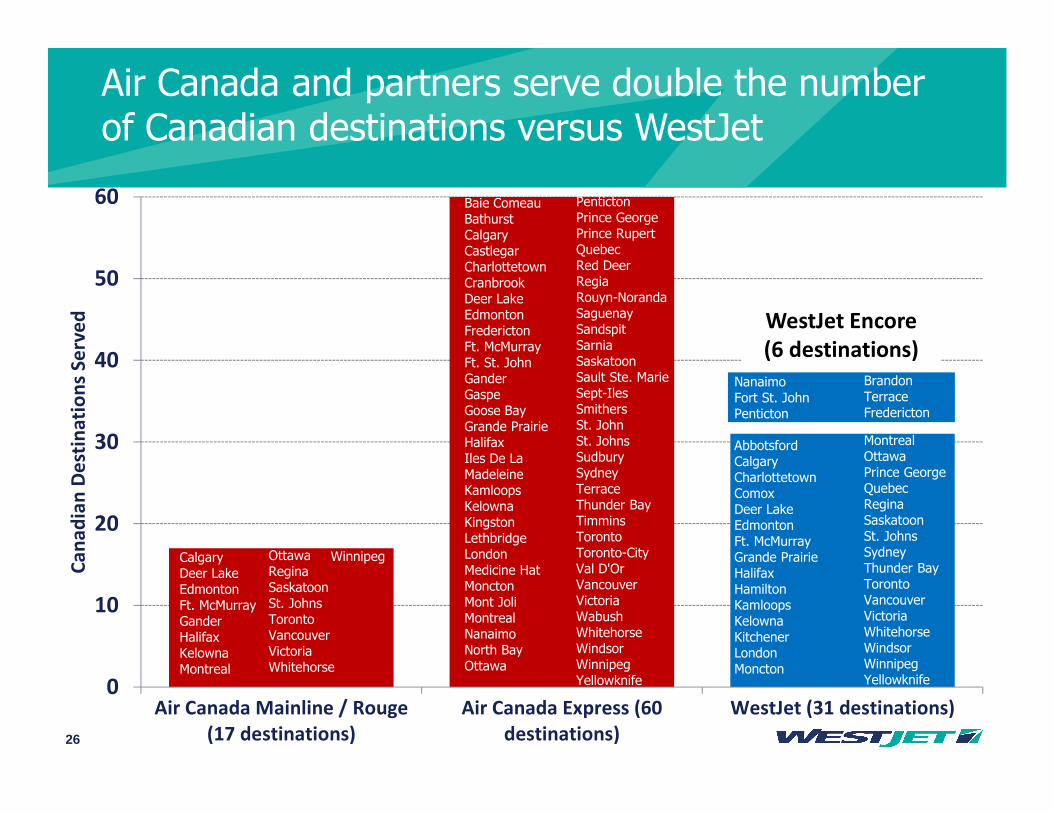
Air Canada and partners serve double the number of Canadian destinations versus WestJet
0
10
20
30
40
50
60
Air Canada Mainline / Rouge
(17 destinations)
Air Canada Express (60
destinations)
WestJet (31 destinations)
Ca
na
dia
n D
est
ina
tio
ns
Se
rve
d
CalgaryDeer LakeEdmontonFt. McMurrayGanderHalifaxKelownaMontreal
OttawaReginaSaskatoonSt. JohnsTorontoVancouverVictoriaWhitehorse
Winnipeg
Baie ComeauBathurstCalgaryCastlegarCharlottetownCranbrookDeer LakeEdmontonFrederictonFt. McMurrayFt. St. JohnGanderGaspeGoose BayGrande PrairieHalifaxIles De La MadeleineKamloopsKelownaKingstonLethbridgeLondonMedicine HatMonctonMont JoliMontrealNanaimoNorth BayOttawa
PentictonPrince GeorgePrince RupertQuebecRed DeerRegiaRouyn-NorandaSaguenaySandspitSarniaSaskatoonSault Ste. MarieSept-IlesSmithersSt. JohnSt. JohnsSudburySydneyTerraceThunder BayTimminsTorontoToronto-CityVal D'OrVancouverVictoriaWabushWhitehorseWindsorWinnipegYellowknife
AbbotsfordCalgaryCharlottetownComoxDeer LakeEdmontonFt. McMurrayGrande PrairieHalifaxHamiltonKamloopsKelownaKitchenerLondonMoncton
MontrealOttawaPrince GeorgeQuebecReginaSaskatoonSt. JohnsSydneyThunder BayTorontoVancouverVictoriaWhitehorseWindsorWinnipegYellowknife
WestJet Encore
(6 destinations)
NanaimoFort St. JohnPenticton
BrandonTerraceFredericton
27
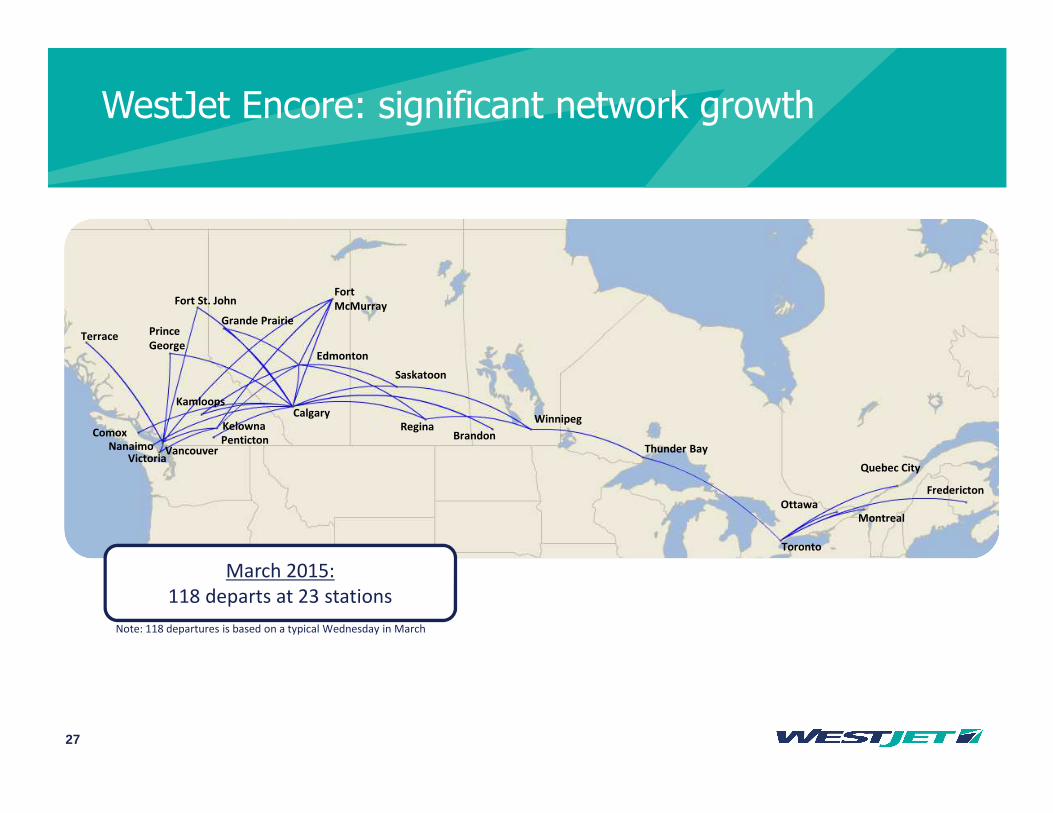
WestJet Encore: significant network growth
Terrace Prince
George
NanaimoVictoria
VancouverPenticton
Fort St. John
Grande Prairie
Fort
McMurray
Calgary
Edmonton
Kamloops
Kelowna
Saskatoon
ReginaBrandon
Winnipeg
Thunder Bay
Toronto
Quebec City
Comox
Fredericton
OttawaMontreal
March 2015:
118 departs at 23 stations
Note: 118 departures is based on a typical Wednesday in March
28
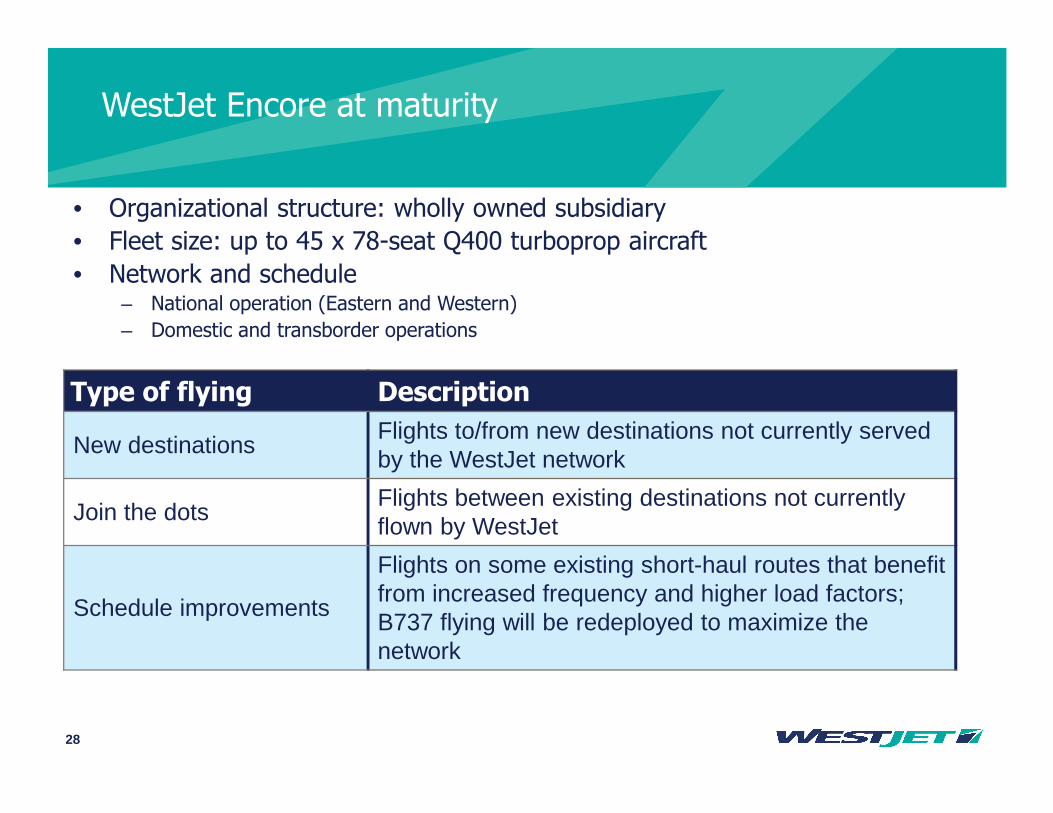
WestJet Encore at maturity
Type of flying Description
New destinationsFlights to/from new destinations not currently served by the WestJet network
Join the dotsFlights between existing destinations not currently flown by WestJet
Schedule improvements
Flights on some existing short-haul routes that benefit from increased frequency and higher load factors; B737 flying will be redeployed to maximize the network
• Organizational structure: wholly owned subsidiary
• Fleet size: up to 45 x 78-seat Q400 turboprop aircraft
• Network and schedule– National operation (Eastern and Western)
– Domestic and transborder operations

29
Critical success factors remain the same for WestJet Encore
Guest experience and culture
• Consistent WestJet guest
experience
• Consistent WestJet values
• Maintain caring culture
• Engaged workforce
Low cost
• Obtain meaningful and
sustainable cost advantage
vs. regional competitors
• Low fares to stimulate
demand and steal traffic
• Expand low-fare high-value
proposition to new markets
Guest experience and low cost
We have the financial strengthto put our strategy into action
31
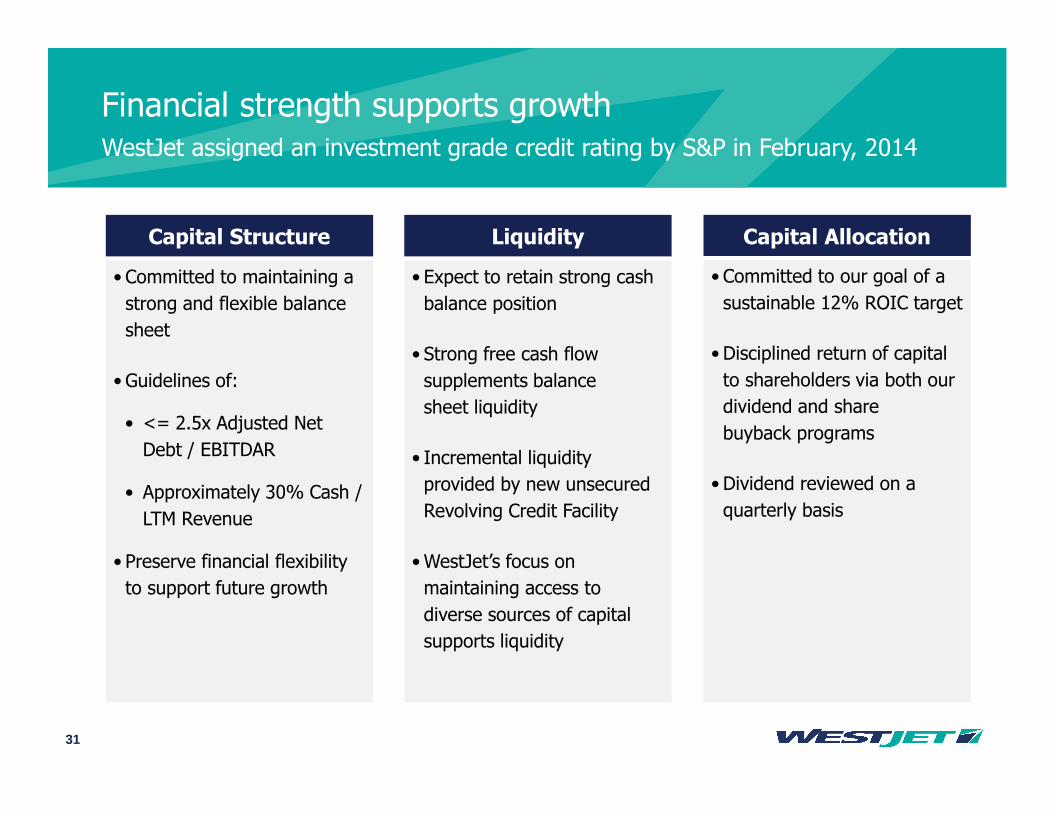
Financial strength supports growth
Capital Structure Capital AllocationLiquidity
• Committed to maintaining a
strong and flexible balance
sheet
• Guidelines of:
• <= 2.5x Adjusted Net
Debt / EBITDAR
• Approximately 30% Cash /
LTM Revenue
• Preserve financial flexibility
to support future growth
• Committed to our goal of a
sustainable 12% ROIC target
• Disciplined return of capital
to shareholders via both our
dividend and share
buyback programs
• Dividend reviewed on a
quarterly basis
• Expect to retain strong cash
balance position
• Strong free cash flow
supplements balance
sheet liquidity
• Incremental liquidity
provided by new unsecured
Revolving Credit Facility
•WestJet’s focus on
maintaining access to
diverse sources of capital
supports liquidity
WestJet assigned an investment grade credit rating by S&P in February, 2014

32
Capital structureExcess cash has been used to lower long term debt & buy back stock
0.0
1.0
2.0
3.0
4.0
5.0
6.0
0
300
600
900
1,200
1,500
2005 2006 2007 2008 2009 2010 2011 2012 2013 Q2
2014
Ra
tio
$ m
illio
n
Cash Adjusted Net Debt/ EBITDAR Adjusted Debt/ Equity
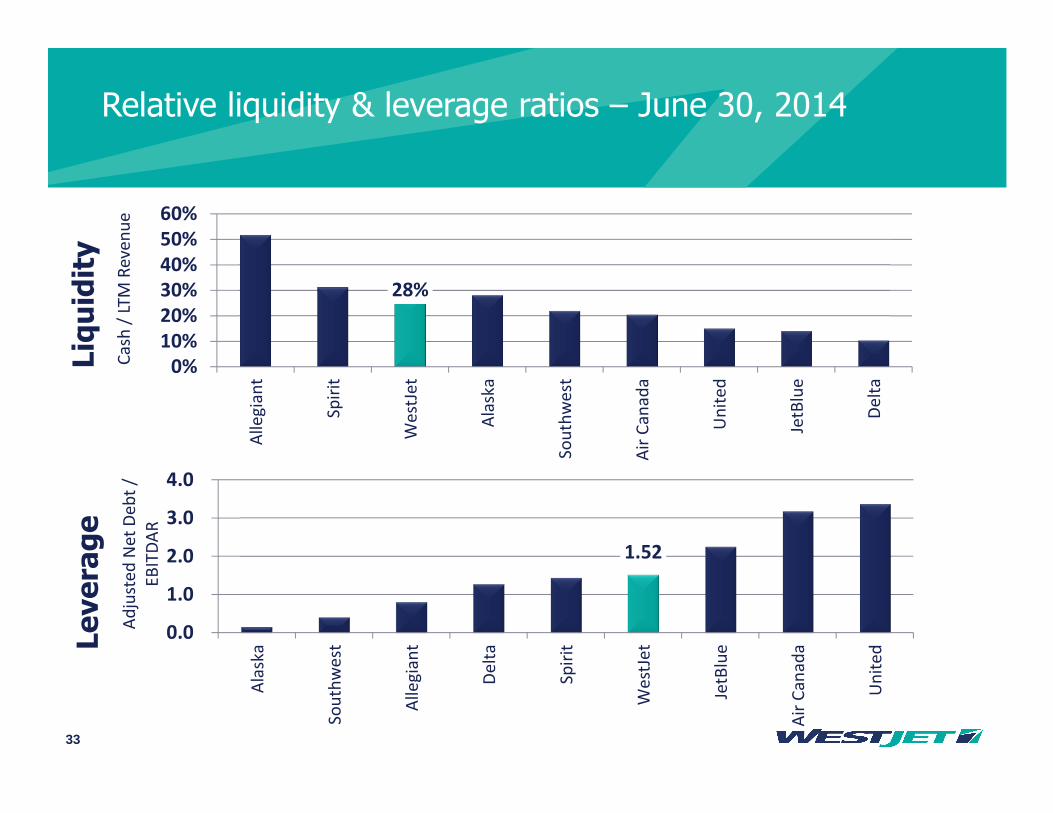
At June 30, 2014
Cash $1,077-mln
Cash to LTM Revenue 28%
Adjusted Net Debt to EBITDAR 1.52x
*Note: 2010-14 presented under IFRS; 2009 and prior presented under previous Canadian GAAP.
Based on a trailing 12 month basis. Debt ratios include aircraft operating leases.
33
1.52
0.0
1.0
2.0
3.0
4.0
Ala
ska
So
uth
we
st
Alle
gia
nt
De
lta
Sp
irit
We
stJe
t
JetB
lue
Air
Ca
na
da
Un
ite
d
Ad
just
ed
Ne
t D
eb
t /
EB
ITD
AR
Relative liquidity & leverage ratios – June 30, 2014
28%
0%
10%
20%
30%
40%
50%
60%
Alle
gia
nt
Sp
irit
We
stJe
t
Ala
ska
So
uth
we
st
Air
Ca
na
da
Un
ite
d
JetB
lue
De
lta
Ca
sh /
LT
M R
eve
nu
e
Liquidity
Leverage
34
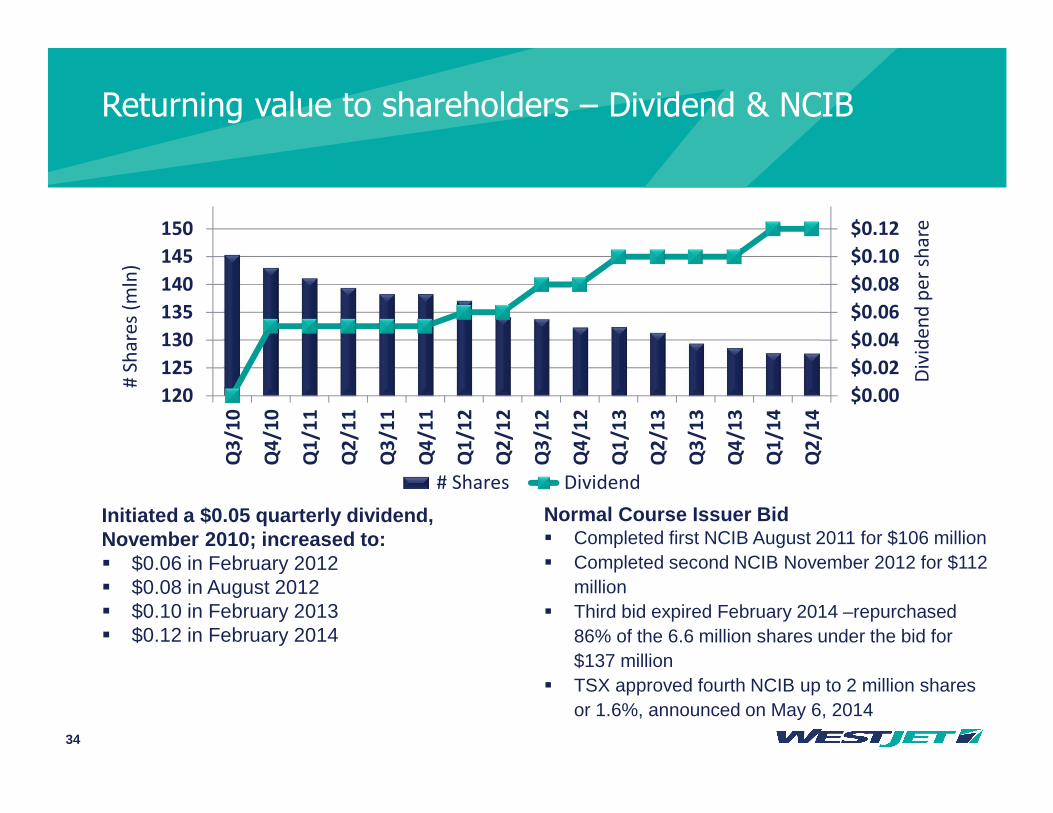
Normal Course Issuer Bid� Completed first NCIB August 2011 for $106 million � Completed second NCIB November 2012 for $112
million� Third bid expired February 2014 –repurchased
86% of the 6.6 million shares under the bid for $137 million
� TSX approved fourth NCIB up to 2 million shares or 1.6%, announced on May 6, 2014
Returning value to shareholders – Dividend & NCIB
$0.00
$0.02
$0.04
$0.06
$0.08
$0.10
$0.12
120
125
130
135
140
145
150Q
3/1
0
Q4
/10
Q1
/11
Q2
/11
Q3
/11
Q4
/11
Q1
/12
Q2
/12
Q3
/12
Q4
/12
Q1
/13
Q2
/13
Q3
/13
Q4
/13
Q1
/14
Q2
/14
Div
ide
nd
pe
r sh
are
# S
ha
res
(mln
)
# Shares Dividend
Initiated a $0.05 quarterly dividend, November 2010; increased to:� $0.06 in February 2012 � $0.08 in August 2012� $0.10 in February 2013� $0.12 in February 2014
35
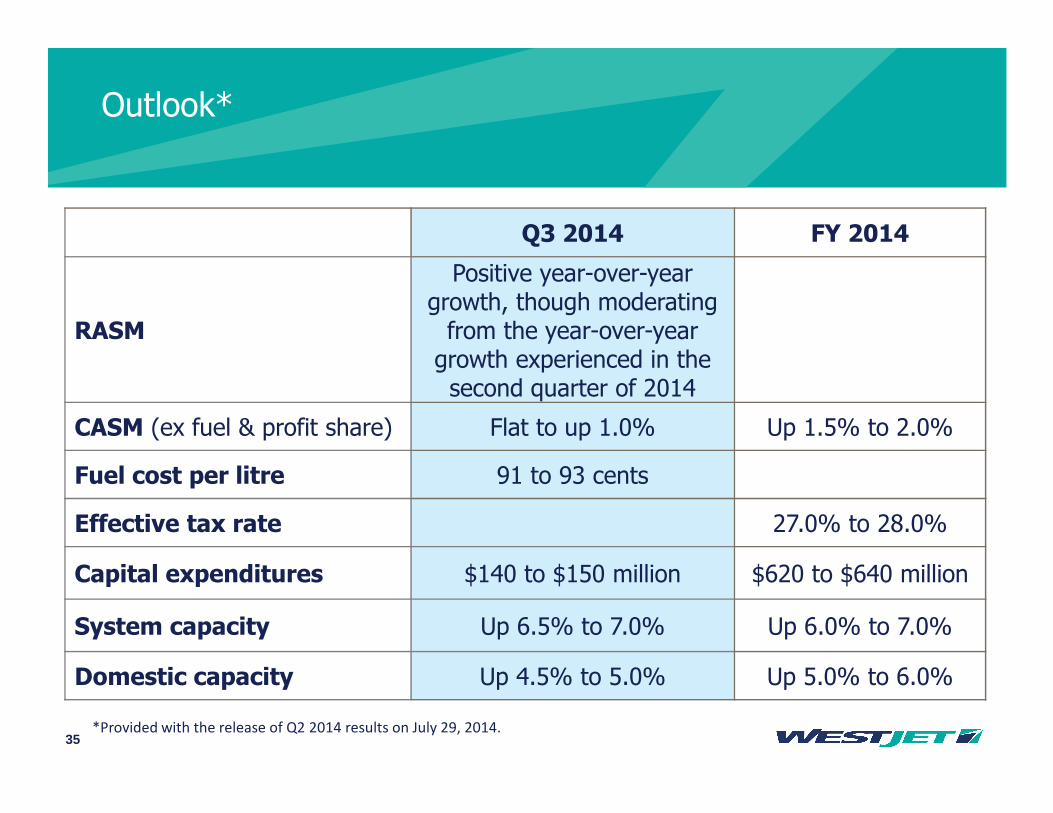
Outlook*
Q3 2014 FY 2014
RASM
Positive year-over-year growth, though moderating from the year-over-year growth experienced in the second quarter of 2014
CASM (ex fuel & profit share) Flat to up 1.0% Up 1.5% to 2.0%
Fuel cost per litre 91 to 93 cents
Effective tax rate 27.0% to 28.0%
Capital expenditures $140 to $150 million $620 to $640 million
System capacity Up 6.5% to 7.0% Up 6.0% to 7.0%
Domestic capacity Up 4.5% to 5.0% Up 5.0% to 6.0%
*Provided with the release of Q2 2014 results on July 29, 2014.
36
Summary – why invest in WestJet
• Proven track record of profitably, low cost structure and ROIC focus
• Award-winning culture and highly engaged workforce
• Pursuing profitable growth opportunities
• Strong brand in the marketplace and expanding airline partnerships
• Investment grade credit rating, strong balance sheet and liquidity
• Committed to generating and returning value to shareholders