Embed Size (px)
Citation preview


COVID experience in South Africa
0
100
200
300
400
500
600
INFE
CTIO
NS
PER
100
000
Eastern Cape Free State Gauteng KwaZulu-Natal Limpopo
Mpumalanga Northern Cape Western Cape National

Profmed testing and cases
0%
5%
10%
15%
20%
25%
30%
35%
40%
45%
50%
0
5 000
10 000
15 000
20 000
25 000
30 000
35 000
40 000
45 000
50 000
Apr May Jun Jul Aug Sep Oct Nov Dec Jan Feb Mar Apr May Jun Jul
Prop
ortio
n po
sitiv
e
NU
MBE
R O
F TE
STS
PERF
ORM
ED
Negative Positive tests Positive rate (7 day average)

COVID-19 FINANCIAL IMPACT

Pandemic impact on claims
• Low utilisation was greater than COVID costs in 2020
• Low utilisation has been fully offset by COVID costs in 2021
-70 000 000-65 000 000-60 000 000-55 000 000-50 000 000-45 000 000-40 000 000-35 000 000-30 000 000-25 000 000-20 000 000-15 000 000-10 000 000-5 000 000
- 5 000 000
10 000 000 15 000 000
20 000 000 25 000 000 30 000 000 35 000 000 40 000 000 45 000 000 50 000 000
Apr May Jun Jul Aug Sep Oct Nov Dec Jan Feb Mar Apr May Jun Jul2020 2021
CLAI
MS
COVID-19 claims Low healthcare utilisation Net impact on claims
0
50 000 000
100 000 000
150 000 000
200 000 000
250 000 000
300 000 000
0
1 000 000
2 000 000
3 000 000
4 000 000
5 000 000
6 000 000
7 000 000
Apr May Jun Jul Aug Sep Oct Nov Dec Jan Feb Mar Apr May June July Aug
CUM
ULA
TIV
E CL
AIM
S
DAI
LY C
LAIM
S
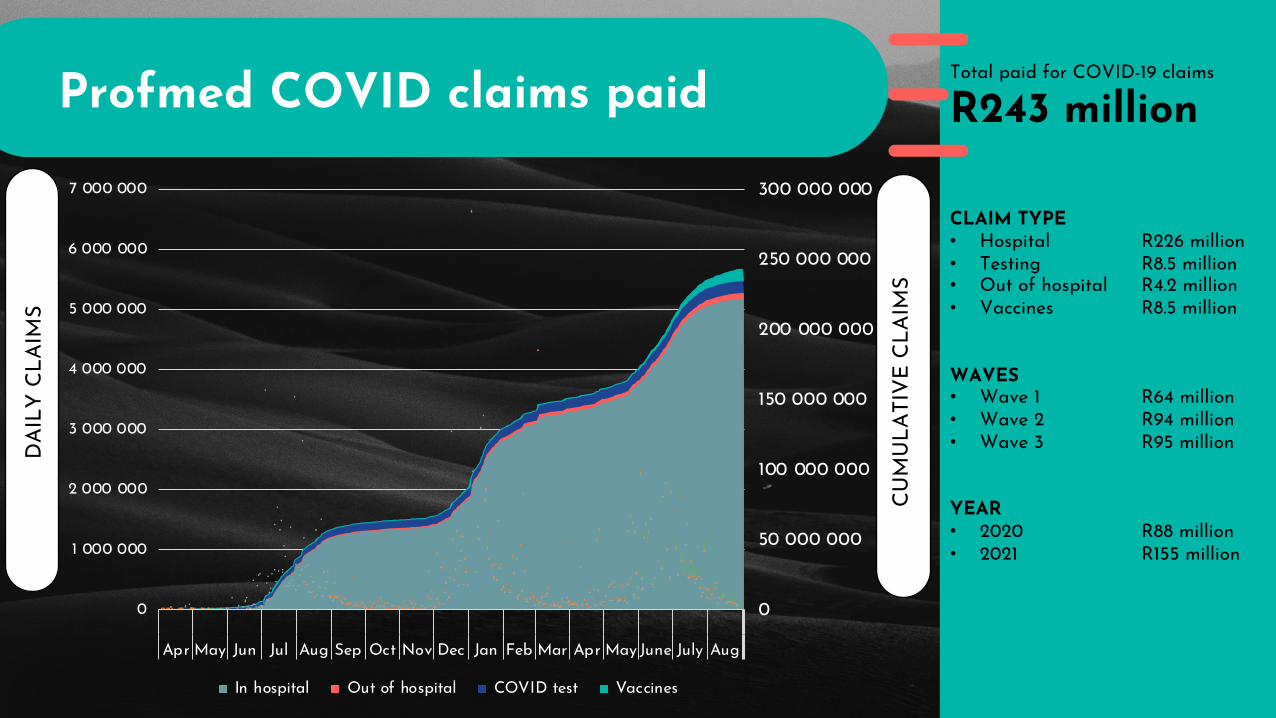
In hospital Out of hospital COVID test Vaccines
Total paid for COVID-19 claims
R243 million
CLAIM TYPE• Hospital R226 million• Testing R8.5 million• Out of hospital R4.2 million• Vaccines R8.5 million
WAVES• Wave 1 R64 million• Wave 2 R94 million• Wave 3 R95 million
YEAR• 2020 R88 million• 2021 R155 million
Profmed COVID claims paid
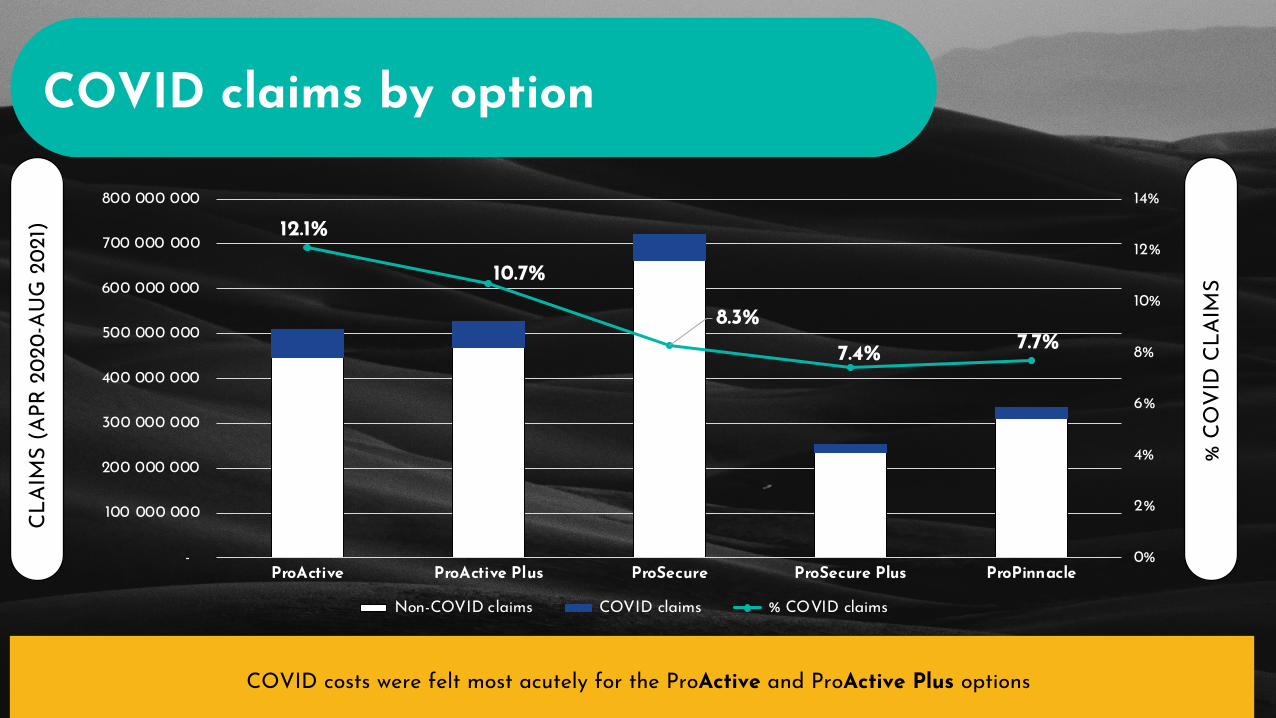
COVID costs were felt most acutely for the ProActive and ProActive Plus options
COVID claims by option
12.1%
10.7%
8.3%7.4% 7.7%
0%
2%
4%
6%
8%
10%
12%
14%
-
100 000 000
200 000 000
300 000 000
400 000 000
500 000 000
600 000 000
700 000 000
800 000 000
ProActive ProActive Plus ProSecure ProSecure Plus ProPinnacle
% C
OV
ID C
LAIM
S
CLAI
MS
(APR
202
0-AU
G 2
021)
Non-COVID claims COVID claims % COVID claims

Vaccine uptake
0
5 000
10 000
15 000
20 000
25 000
0
100
200
300
400
500
600
May June July August
CUM
ULA
TIV
E SH
OTS
DAI
LY S
HO
TS
Pfizer first dose Pfizer second dose Johnson and Johnson

MEMBERSHIP GROWTH

Membership growth
Profmed has shown consistent growth in membership, including during the COVID-19 pandemic
Membership Growth
-
5 000
10 000
15 000
20 000
25 000
30 000
35 000
40 000
2013 2014 2015 2016 2017 2018 2019 2020
NU
MBE
R O
F PR
INCI
PAL
MEM
BERS

-8%
-3%
3%
8%
13%
Profmed Bestmed Discovery Fedhealth Medihelp Medshield Momentum
Annu
al p
erce
ntag
e gr
owth
in b
enef
icia
ries
ANN
UAL
PER
CEN
TAG
E G
ROW
TH IN
BEN
EFIC
IARI
ES
Profmed has shown consistent growth in membership, including during the COVID-19 pandemic
Membership Growth (proportionate)

LONG-TERM UTILISATION TRENDS

95
100
105
110
115
120
125
130
Year 1 Year 2 Year 3
Claims Base Consumer Inflation :Tarriff Medical Inflation : Resources
Medical Inflation : Technology Utilisation Increases: Access to treatment Utilisation Increases: Disease Burden
109
127
118
Healthcare Inflation: Medical Schemes

-4%
-2%
0%
2%
4%
6%
8%
10%
12%
14%
16%
2016 2017 2018 2019 2020 2021 2022 2023 2024 2025 2026Projected
PERC
ENTA
GE
INCR
EASE
Claims increases Contribution increases
Long-term increases in claims
On average claims have increased by 12.3% from 2016 to 2019
2020 was an exception due to low healthcare utilisation during the pandemic
Claims increases have been driven by supplier-related increases, which have been volatile from year-to-year
Buy-down of members from high to low options (without a corresponding drop in claims) costs the Scheme about 1.6% of contributions annually

• Claims reverting to pre-pandemic levels
• The Scheme built R160 mil reserves in 2020
• All Surplus of funds are retained for future expenses
• How to keep pace with claims increases to avoid annual large losses
• The Scheme is taking a long-term view to protect it’s financial position
• Uncertainty around 4th waves, cost and impact of vaccines and need for future boosters
41.2%
37.5%
30.3% 30.1%
34.8%
38.0%
0%
5%
10%
15%
20%
25%
30%
35%
40%
45%
2021 2022 2023 2024 2025 2026 2027 2028 2029 2030
PRO
JECT
ED S
OLV
ENCY
RAT
IO
Budgeting for claims post-COVID

COMPETITIVE POSITIONIN MARKET

Premium options 2018
AVERAGE BENEFIT RICHNESS
AVER
AGE
CON
TRIB
UTI
ON

2019 saw introduction of the ProActive Plus day-to-day benefit
Premium options 2019AV
ERAG
E CO
NTR
IBU
TIO
N
AVERAGE BENEFIT RICHNESS

Premium options 2020AV
ERAG
E CO
NTR
IBU
TIO
N
AVERAGE BENEFIT RICHNESS

Premium options 2021AV
ERAG
E CO
NTR
IBU
TIO
N
AVERAGE BENEFIT RICHNESS
2022 will see further enhancements to the ProActive Plus day-to-day benefit, which increases by R500.

AVERAGE BENEFIT RICHNESS
AVERAGE BENEFIT RICHNESS
AVER
AGE
CON
TRIB
UTI
ON
ProActive and ProActive Plus
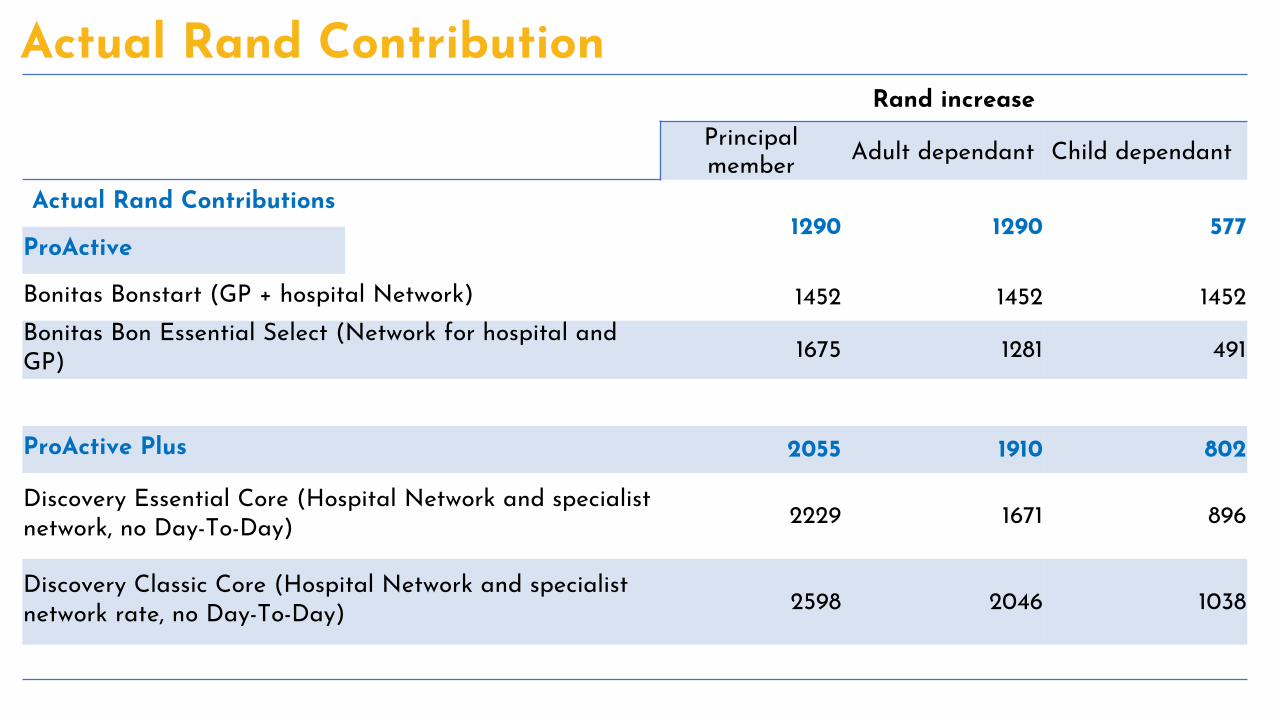
Rand increasePrincipal member Adult dependant Child dependant
Actual Rand Contributions1290 1290 577
ProActive
Bonitas Bonstart (GP + hospital Network) 1452 1452 1452Bonitas Bon Essential Select (Network for hospital and GP) 1675 1281 491
ProActive Plus 2055 1910 802
Discovery Essential Core (Hospital Network and specialist network, no Day-To-Day) 2229 1671 896
Discovery Classic Core (Hospital Network and specialist network rate, no Day-To-Day) 2598 2046 1038
Actual Rand Contribution

AVER
AGE
CON
TRIB
UTI
ON
AVERAGE BENEFIT RICHNESS
ProSecure and ProSecure Plus Premium

Actual Rand ContributionsRand increase
Principal member Adult dependant Child dependantProSecure (unlimited hospital and D2D R11654) 3672 3672 1434Bonnitas Standard (Copayments for certain procedures Orthopeadic, D2D R6 230 - 12 840) 4044 3506 1186
Bonnitas Bon Complete (Unlimited hospital, R8892 Savings and Threshhold) 4291 3436 1165
ProSecure Plus (unlimited hospital and D2D of R22842) 4079 3777 1594Discovery Classic Saver (Day Surgery Network and co-payment up to R6450, MSA R22 200) 3485 2750 1397
Medshield MediBonus (Major Copayments on hospital procedures R6000, Annual D2D is R18 000) 6147 4320 1218
Actual Rand Contribution Comparison

AVER
AGE
CON
TRIB
UTI
ON
AVERAGE BENEFIT RICHNESS
ProPinnacle Premium

CONTRIBUTION INCREASES

Contribution increase % comparison
1.00
1.10
1.20
1.30
1.40
1.50
1.60
0%
2%
4%
6%
8%
10%
12%
14%
16%
2017 2018 2019 2020 2021
CUM
ULA
TIV
E IN
CREA
SE
ANN
UAL
INCR
EASE
Profmed Discovery Momentum Medihelp Bestmed Medshield Fedhealth Bonitas

Projected Contribution Increases 2022• Based on our current experience, a projected contribution increase of 8.9% is needed
Percentage increase
Average Rand increasePRINCIPAL MEMBER
ADULT DEPENDANT
CHILD DEPENDANT
ProActive Premium and Savvy 9.1% 162 156 65
ProActivePlus
Premium and Savvy 9.1% 200 185 79
ProSecure Premium and Savvy 8.6% 335 315 130
ProSecure Plus
Premium and Savvy 8.6% 395 370 155
ProPinnacle Premium and Savvy 8.6% 722 665 212
*Percentage increases exclude an increase to ProActive dependent contributions and an increase to fund enhancement of the ProActive Plus day-to-day benefit

WEIGHTED INCREASE IS
6,68% SAVES R49 MILLION FOR MEMBERS
CONTRIBUTION INCREASES DEFERRED TO 1 APRIL 2022
We have considered the difficult economic situations of our members
Have had a surplus year in 2020 R160 mil (…but not 2021, COVID claims added R165 mil and still not finished)
Based on our current projections a contribution increase of 8.9% is needed
COVID Costs: Vaccines expected of total R40 mil
We may have a 4th wave in November/December 2021
Finalise increase in March but limited to 8,9% at that time
We remain extremely competitive

Contribution comparison – ProActive and ProActive Plus
-
500
1 000
1 500
2 000
2 500
3 000
2016 2017 2018 2019 2020 2021 2022 projected
PRIN
CIPA
L M
EMBE
R CO
NTI
RBU
TIO
N
Discovery Essential core Discovery Classic core Bonitas Primary Profmed ProActive Profmed ProActive Plus
Contribution comparisonContribution comparison ProActive and ProActive Plus

-
1 000
2 000
3 000
4 000
5 000
6 000
7 000
8 000
2016 2017 2018 2019 2020 2021 2022 projected
PRIN
CIPA
L M
EMBE
R CO
NTR
IBU
TIO
N
Discovery Essential Comprehensive Discovery Classic Comprehensive Bestmed Pace 1 Bonitas Standard Profmed ProSecure Profmed ProSecure Plus
Contribution comparison ProSecure and ProSecure Plus

Contribution comparison – ProPinnacle
-
1 000
2 000
3 000
4 000
5 000
6 000
7 000
8 000
9 000
10 000
2016 2017 2018 2019 2020 2021 2022 projected
PRIN
CIPA
L M
EMBE
R CO
NTR
IBU
TIO
N
Discovery Executive Bestmed Pace 4 Bonitas BonComprehensive Profmed ProPinnacle
Rand increase comparisonContribution comparison ProPinnacle

-
50
100
150
200
250
2016 2017 2018 2019 2020 2021 2022 projected
RAN
D IN
CREA
SE
Profmed ProActive Profmed ProActive Plus Discovery Essential core Discovery Classic core Bestmed Beat 1 Bonitas Primary
Rand increase comparison ProActive and ProActive Plus

Rand increase comparison
-
100
200
300
400
500
600
700
2016 2017 2018 2019 2020 2021 2022 projected
RAN
D IN
CREA
SE
Profmed ProSecure Profmed ProSecure Plus Discovery Essential Comprehensive Discovery Classic Comprehensive Bonitas Standard
Rand increase comparison ProSecure and ProSecure Plus

-
100
200
300
400
500
600
700
800
900
2016 2017 2018 2019 2020 2021 2022 projected
RAN
D IN
CREA
SE
Profmed ProPinnacle Discovery Executive Bonitas BonComprehensive
Rand increase comparison ProPinnacle

Projected Contribution Increases 2022• Based on our current experience, a projected contribution increase of 8.9% is needed
Percentage increase
Average Rand increasePRINCIPAL MEMBER
ADULT DEPENDANT
CHILD DEPENDANT
ProActive Premium and Savvy 9.1% 162 156 65
ProActivePlus
Premium and Savvy 9.1% 200 185 79
ProSecure Premium and Savvy 8.6% 335 315 130
ProSecure Plus
Premium and Savvy 8.6% 395 370 155
ProPinnacle Premium and Savvy 8.6% 722 665 212
*Percentage increases exclude an increase to ProActive dependent contributions and an increase to fund enhancement of the ProActive Plus day-to-day benefit