Embed Size (px)
Citation preview
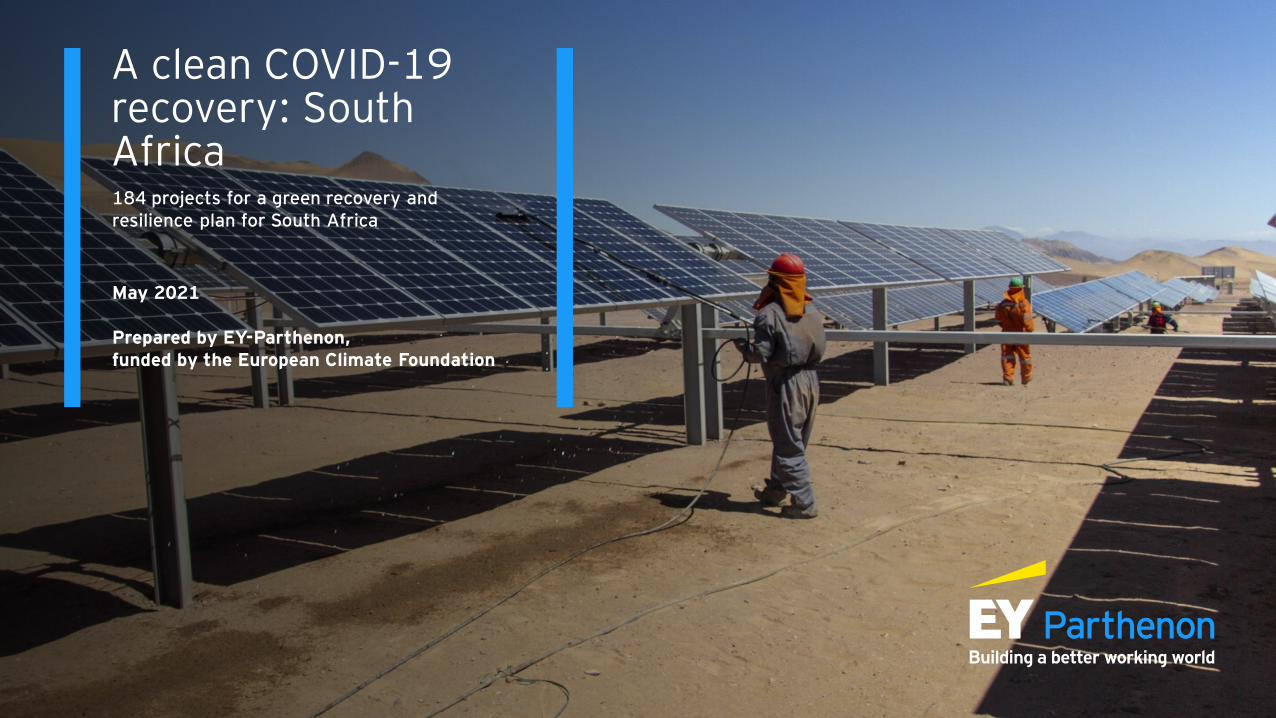
A clean COVID-19 recovery: South Africa 184 projects for a green recovery and resilience plan for South Africa
May 2021
Prepared by EY-Parthenon, funded by the European Climate Foundation
Page 2
Agenda
► Executive summary
► Scale of the opportunity
► Key policy recommendations
► Appendix
Page 3
South Africa has a unique opportunity to make a step-change on climate change mitigation and job creation through a green, post-COVID-19 economic recovery
Executive summary
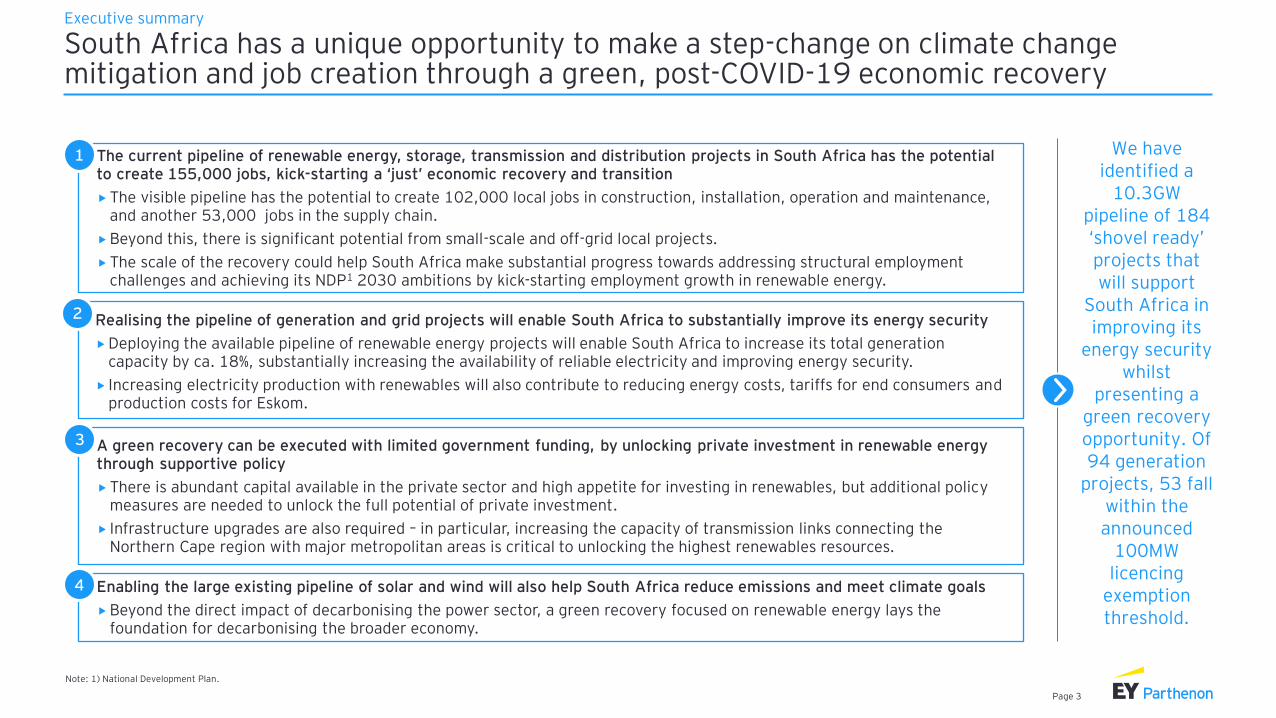
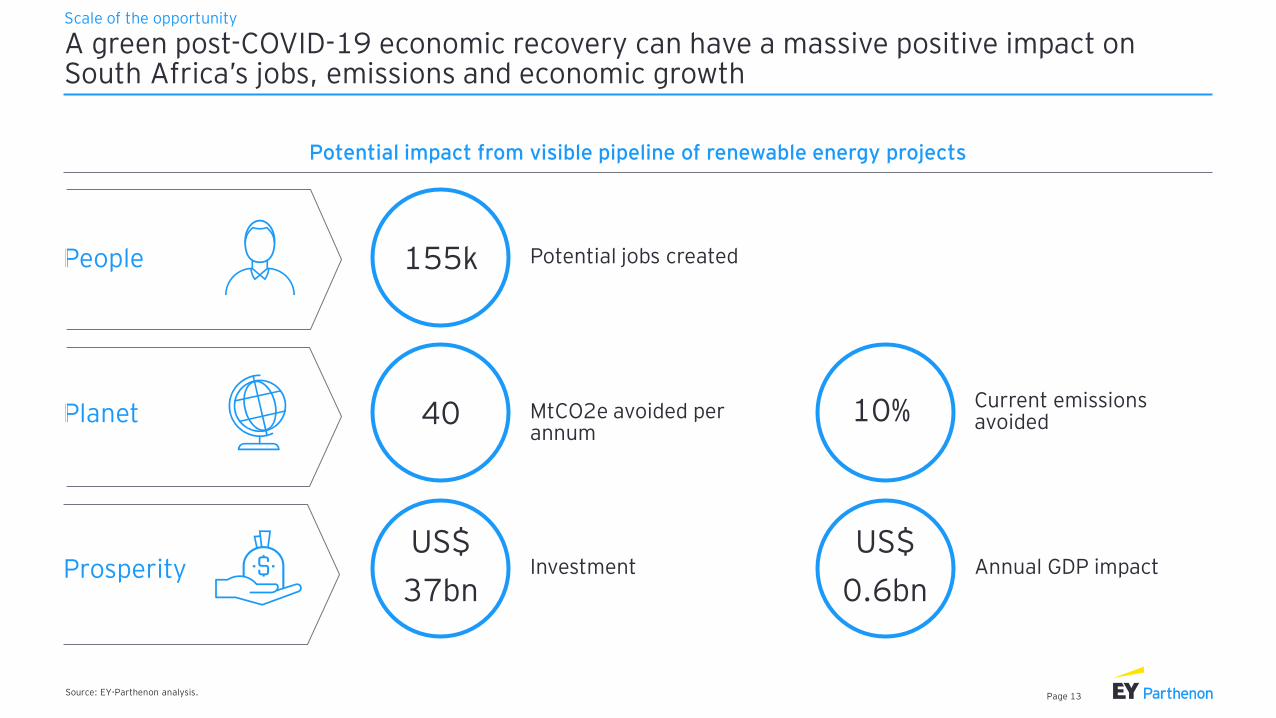
The current pipeline of renewable energy, storage, transmission and distribution projects in South Africa has the potential to create 155,000 jobs, kick-starting a ‘just’ economic recovery and transition
The visible pipeline has the potential to create 102,000 local jobs in construction, installation, operation and maintenance,and another 53,000 jobs in the supply chain.
Beyond this, there is significant potential from small-scale and off-grid local projects.
The scale of the recovery could help South Africa make substantial progress towards addressing structural employment challenges and achieving its NDP1 2030 ambitions by kick-starting employment growth in renewable energy.
1
Realising the pipeline of generation and grid projects will enable South Africa to substantially improve its energy security
Deploying the available pipeline of renewable energy projects will enable South Africa to increase its total generation capacity by ca. 18%, substantially increasing the availability of reliable electricity and improving energy security.
Increasing electricity production with renewables will also contribute to reducing energy costs, tariffs for end consumers and production costs for Eskom.
2
A green recovery can be executed with limited government funding, by unlocking private investment in renewable energy through supportive policy
There is abundant capital available in the private sector and high appetite for investing in renewables, but additional policy measures are needed to unlock the full potential of private investment.
Infrastructure upgrades are also required – in particular, increasing the capacity of transmission links connecting the Northern Cape region with major metropolitan areas is critical to unlocking the highest renewables resources.
3
We have identified a
10.3GW pipeline of 184 ‘shovel ready’ projects that will support
South Africa in improving its
energy security whilst
presenting a green recovery opportunity. Of 94 generation
projects, 53 fall within the announced
100MW licencing
exemption threshold.
Enabling the large existing pipeline of solar and wind will also help South Africa reduce emissions and meet climate goals
Beyond the direct impact of decarbonising the power sector, a green recovery focused on renewable energy lays the foundation for decarbonising the broader economy.
4
Note: 1) National Development Plan.

Page 4
40 Metric tons of carbon dioxide equivalent (MtCO2e) avoided
10GW of renewable generation capacity
155,000 potential jobs
There is a sufficient project pipeline to contribute significantly to South Africa’s renewable energy and climate agenda and support the economy as a whole
Executive summary
Note: An additional 210,000 manufacturing jobs could be created in-country with a localised supply chain.
Source: IRENA, EY-Parthenon analysis.
184 projects in the pipeline
US$37bn investment opportunity
The projects identified will require more than US$37bn of private and public investment, and have the potential to support more than 155,000 jobs
The low-carbon projects identified may make a major contribution to a green economic recovery in South Africa, and job creation would help kick-start employment growth post-COVID-19.
The majority of jobs will require a low-to-medium skill level, and can facilitate upskilling through on-the-job learning.
The visible pipeline of projects has the potential to unlock positive environmental value and contribute significantly to South Africa’s renewable energy and climate targets
The deployment of the identified projects will contribute positively to progress towards the achievement of South Africa’s ambition to be net zero by 2050.
The project pipeline is estimated to contribute a reductions in CO2 emissions of 40 MtCO2e per year – this represents a 9% reduction in South Africa’s total emissions.
Additional benefits include improved air quality and health outcomes, as well as improved gender equality – a 2019 International Renewable Energy Agency (IRENA) report found that representation of women is 10% better in the renewables sector compared with traditional energy industries.
US$600mn recurring GDP impact
Page 5
South Africa has several policy levers that can be pulled to unlock the potential in the visible renewable energy pipeline and accelerate broader renewables investment
Executive summary
Strengthen corporation with international finance institutions, such as the World Bank and European Bank for Reconstruction and Development (EBRD), to support guarantees as necessary for Eskom’s off-taker agreements and increase investor confidence
Increase size of allocation in future procurement rounds and ensure consistency in the timing of the REI4P bidding rounds; implement binding off-taker contracts to create greater certainty for developers and return confidence to the market
Invest in expanding grid infrastructure to large-scale parks in the Northern Cape, and in upgrading existing grid infrastructure that is under pressure
Streamline the permitting process for smaller projects, including lifting the licensing threshold for distributed-generation projects from 1MW to 100MW and allowing for the wheeling of excess electricity, as announced by the President in June 2021.
1
2
3
4
Strengthen local supply chains: in particular, manufacturing capability for wind generation
5
Page 6
“The green recovery is a once-in-a-generation opportunity to unlock South Africa’s potential for sustainable job creation, economic growth and equitability.
Page 7
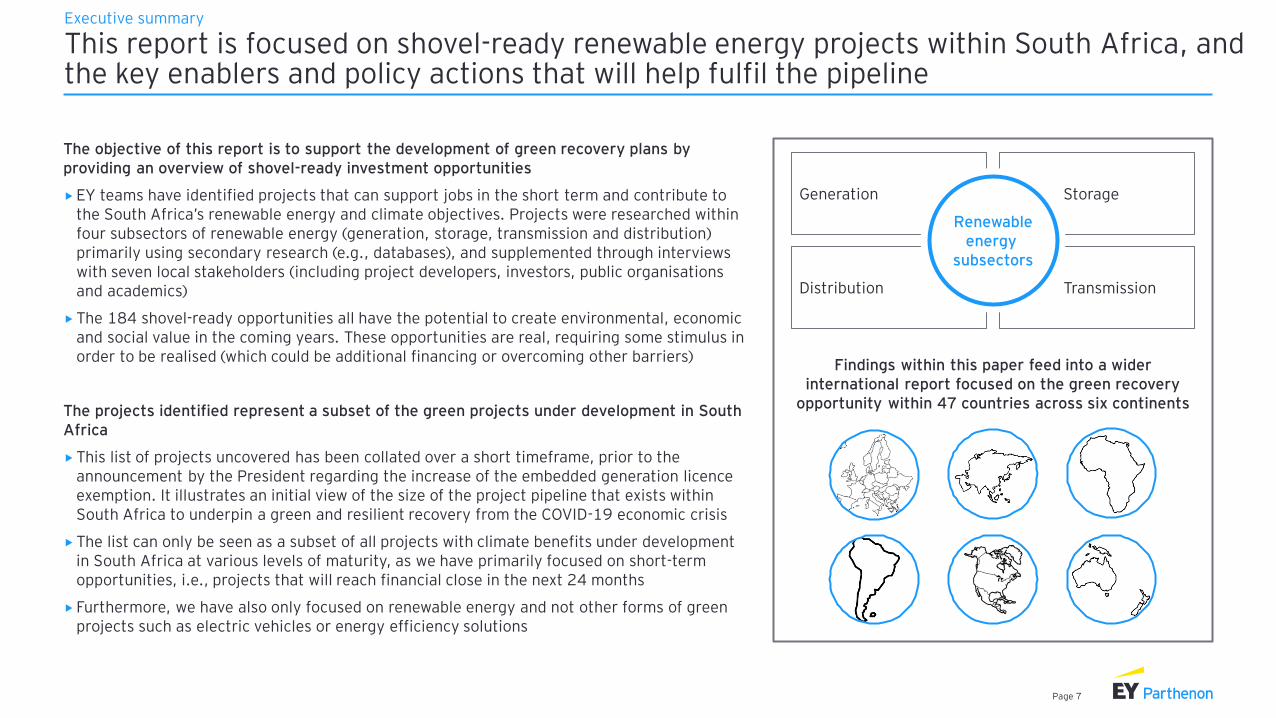
This report is focused on shovel-ready renewable energy projects within South Africa, and the key enablers and policy actions that will help fulfil the pipeline
Findings within this paper feed into a wider international report focused on the green recovery
opportunity within 47 countries across six continents
Generation
Distribution
Storage
Transmission
Renewableenergy
subsectors
The objective of this report is to support the development of green recovery plans by providing an overview of shovel-ready investment opportunities
EY teams have identified projects that can support jobs in the short term and contribute to the South Africa’s renewable energy and climate objectives. Projects were researched within four subsectors of renewable energy (generation, storage, transmission and distribution) primarily using secondary research (e.g., databases), and supplemented through interviews with seven local stakeholders (including project developers, investors, public organisations and academics)
The 184 shovel-ready opportunities all have the potential to create environmental, economic and social value in the coming years. These opportunities are real, requiring some stimulus in order to be realised (which could be additional financing or overcoming other barriers)
The projects identified represent a subset of the green projects under development in South Africa
This list of projects uncovered has been collated over a short timeframe, prior to the announcement by the President regarding the increase of the embedded generation licence exemption. It illustrates an initial view of the size of the project pipeline that exists within South Africa to underpin a green and resilient recovery from the COVID-19 economic crisis
The list can only be seen as a subset of all projects with climate benefits under development in South Africa at various levels of maturity, as we have primarily focused on short-term opportunities, i.e., projects that will reach financial close in the next 24 months
Furthermore, we have also only focused on renewable energy and not other forms of green projects such as electric vehicles or energy efficiency solutions
Executive summary
Page 8
Agenda
► Executive summary
► Scale of the opportunity
► Key policy recommendations
► Appendix
Page 9
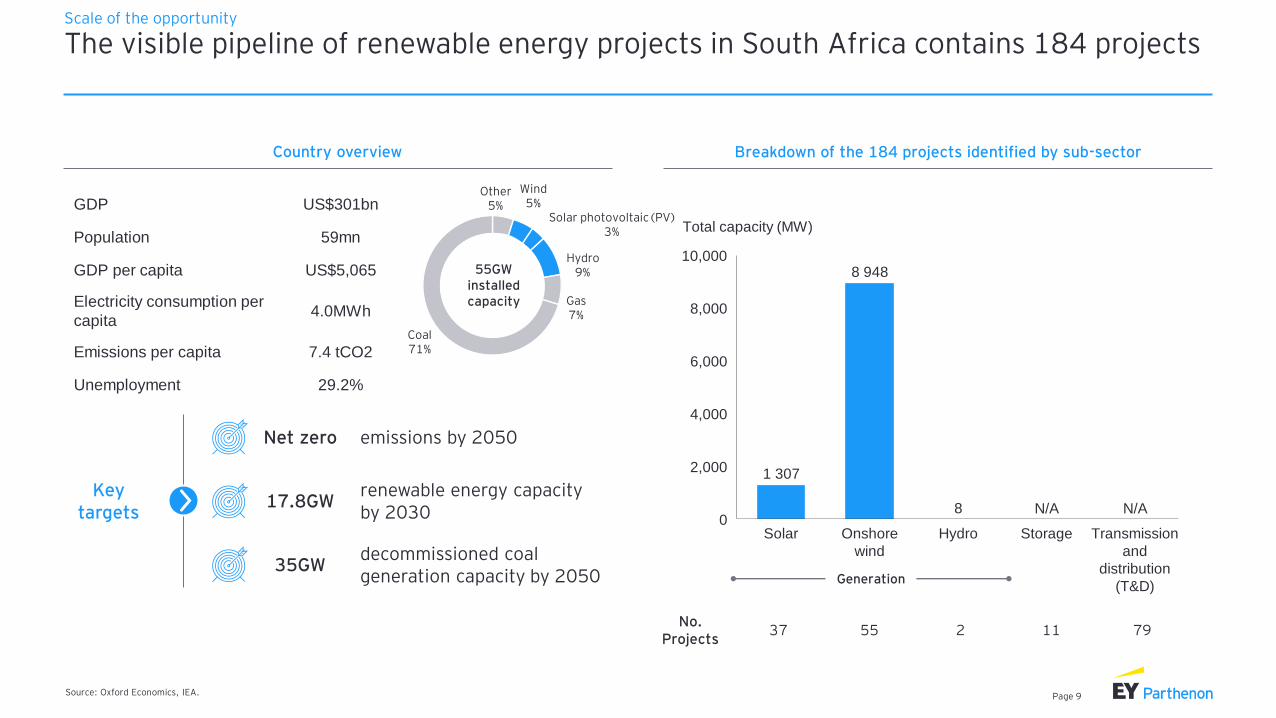
The visible pipeline of renewable energy projects in South Africa contains 184 projectsScale of the opportunity
Source: Oxford Economics, IEA.
Generation
GDP US$301bn
Population 59mn
GDP per capita US$5,065
Electricity consumption per
capita4.0MWh
Emissions per capita 7.4 tCO2
Unemployment 29.2%
Key targets
emissions by 2050Net zero
decommissioned coal generation capacity by 2050
35GW
renewable energy capacity by 2030
17.8GW
Country overview
Coal71%
Other5%
Wind5%
Gas7%
Solar photovoltaic (PV)3%
Hydro9%55GW
installed capacity
1 307
8 94810,000
0
4,000
2,000
6,000
8,000
Solar
Total capacity (MW)
Onshore
wind
Hydro Storage Transmission
and
distribution
(T&D)
N/A8 N/A
No. Projects
37 55 2 11 79
Breakdown of the 184 projects identified by sub-sector
Page 10
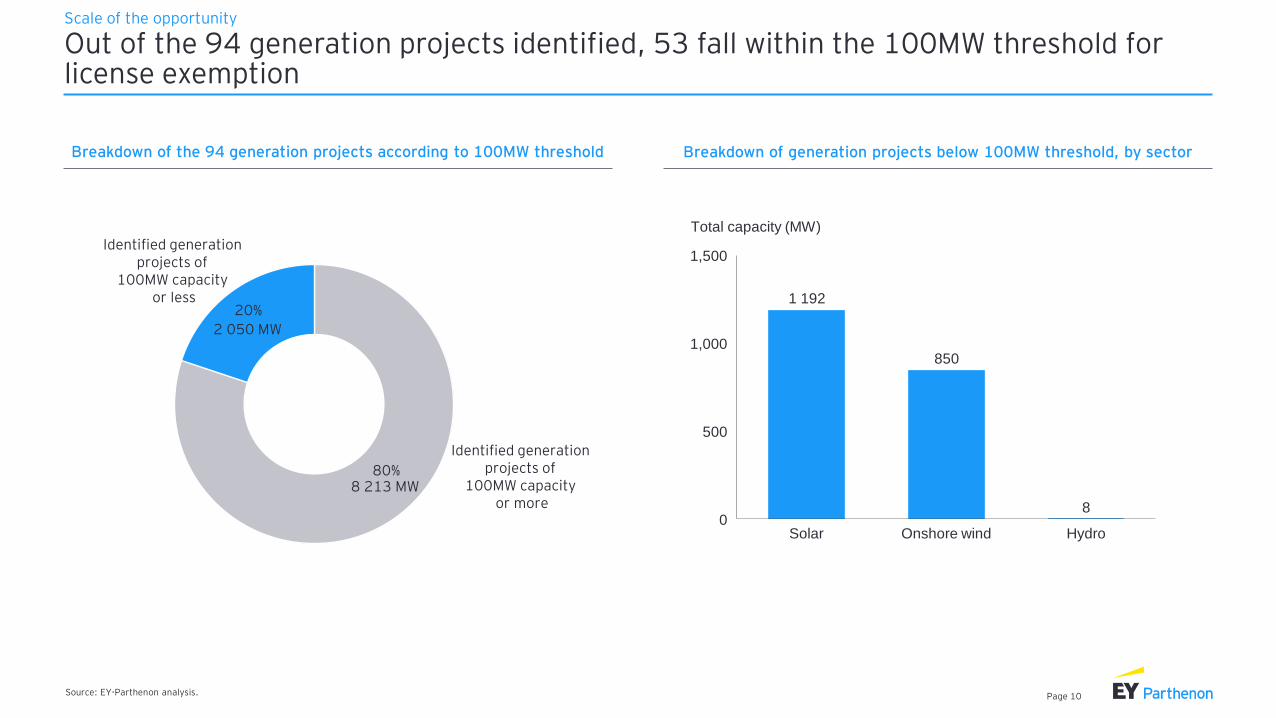
Out of the 94 generation projects identified, 53 fall within the 100MW threshold for license exemption
Scale of the opportunity
Source: EY-Parthenon analysis.
80%
20%
Identified generation projects of
100MW capacity or more
Identified generation projects of
100MW capacity or less
Breakdown of the 94 generation projects according to 100MW threshold
2 050 MW
8 213 MW
Breakdown of generation projects below 100MW threshold, by sector
1 192
850
80
500
1,000
1,500
Solar
Total capacity (MW)
HydroOnshore wind
Page 11
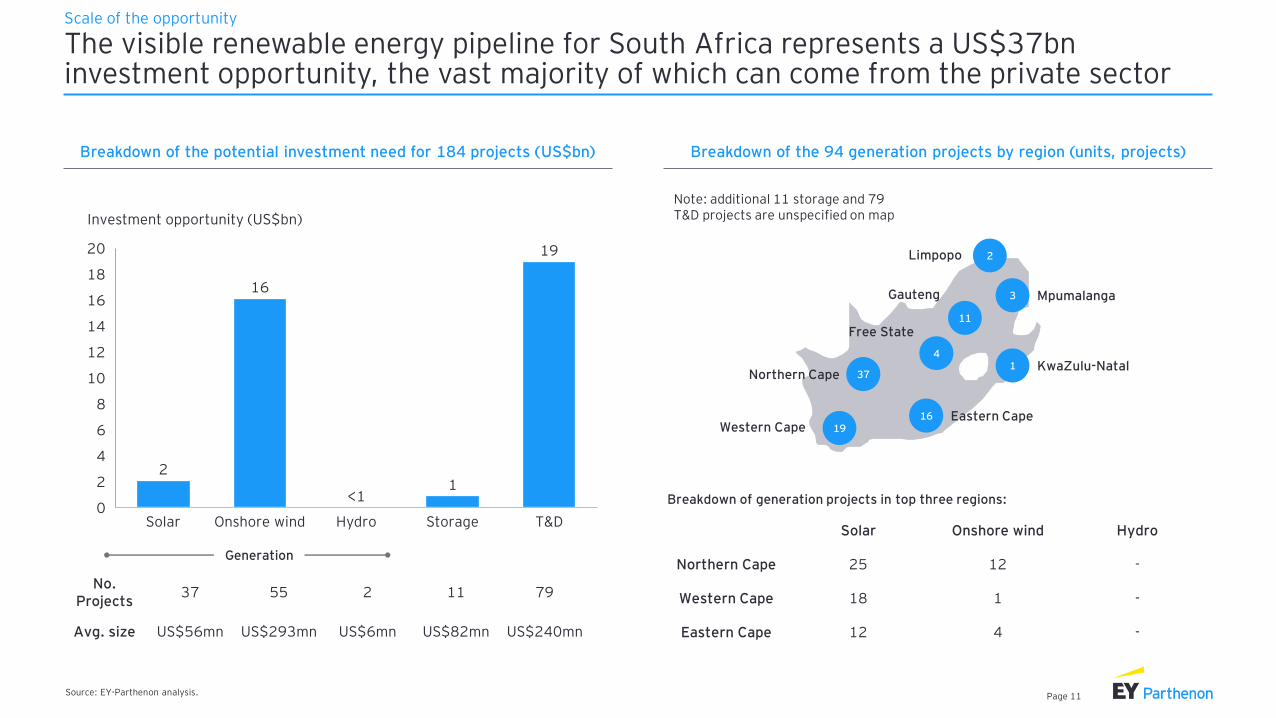
The visible renewable energy pipeline for South Africa represents a US$37bn investment opportunity, the vast majority of which can come from the private sector
Scale of the opportunity
Source: EY-Parthenon analysis.
Note: additional 11 storage and 79 T&D projects are unspecified on map
Breakdown of the 94 generation projects by region (units, projects)
Generation
14
10
2
0
4
6
18
8
12
16
20
1
Investment opportunity (US$bn)
Solar StorageOnshore wind Hydro T&D
19
2
16
<1
No. Projects
37 55 2 11 79
Avg. size US$56mn US$293mn US$6mn US$82mn US$240mn
Northern Cape 37
Western Cape 19Eastern Cape16
Gauteng
11
Free State
4
Mpumalanga3
Limpopo 2
KwaZulu-Natal1
Solar Onshore wind Hydro
Northern Cape 25 12 -
Western Cape 18 1 -
Eastern Cape 12 4 -
Breakdown of generation projects in top three regions:
Breakdown of the potential investment need for 184 projects (US$bn)
Page 12
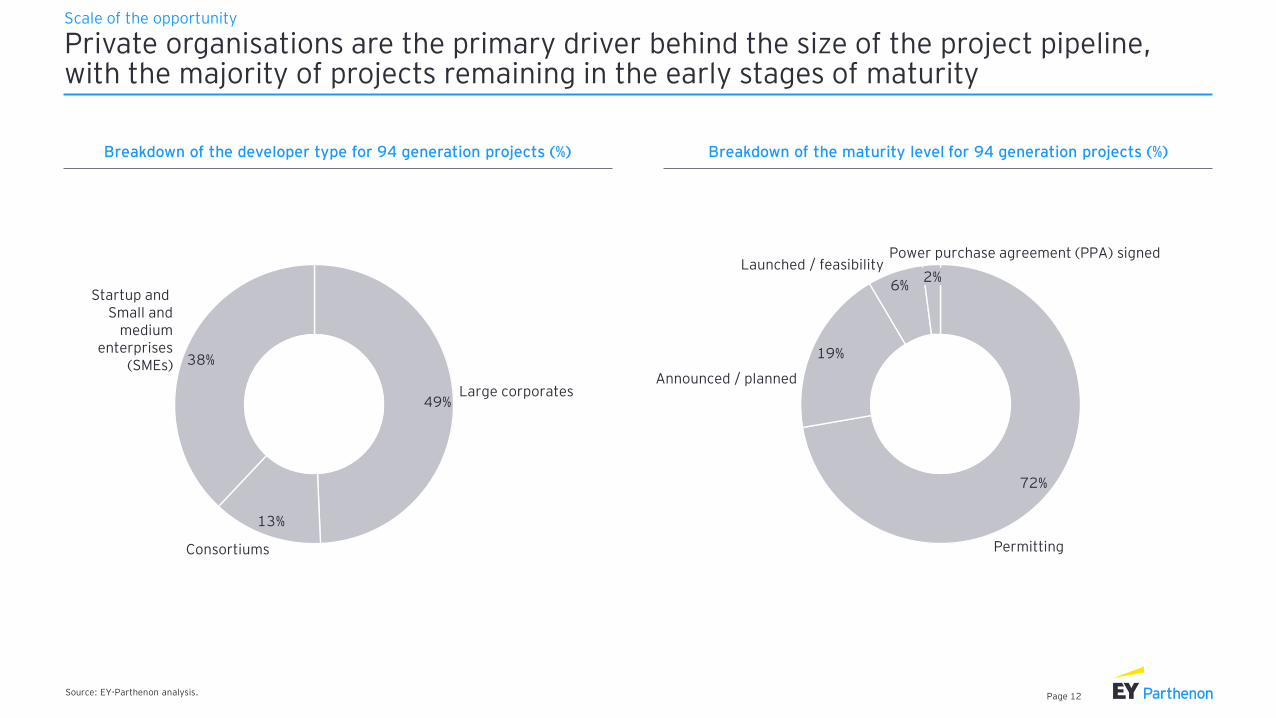
49%
13%
38%
Large corporates
Consortiums
Startup and Small and
mediumenterprises
(SMEs)
72%
19%
6%
Permitting
Power purchase agreement (PPA) signedLaunched / feasibility
Announced / planned
2%
Private organisations are the primary driver behind the size of the project pipeline, with the majority of projects remaining in the early stages of maturity
Scale of the opportunity
Source: EY-Parthenon analysis.
Breakdown of the maturity level for 94 generation projects (%)Breakdown of the developer type for 94 generation projects (%)
Page 13
A green post-COVID-19 economic recovery can have a massive positive impact on South Africa’s jobs, emissions and economic growth
Source: EY-Parthenon analysis.
Potential impact from visible pipeline of renewable energy projects
MtCO2e avoided per annum
Investment
Potential jobs created155kPeople
Planet
Prosperity
40
Annual GDP impact
Current emissions avoided10%
US$
0.6bn
US$
37bn
Scale of the opportunity
Page 14
The visible renewable energy pipeline in could create up to 155,000 jobs
Scale of the opportunity
Source: Minerals Council South Africa, EY-Parthenon analysis, IRENA.
Job creation potential from projects in pipeline, by sector Job potential from projects in pipeline vs. current employment in coal
People
Planet
Prosperity
75
175
100
0
50
25
125
150
102k
Jobs
Coal employment
53k
# Long-terms jobs generated by green recovery
Jobs insupply chain
Local jobs
92k
155k
1.7x
70
30
0
40
10
60
50
20
80
90
100
Transmission and distribution
2k
Storage
Jobs
30k
21k
5k
36k
Generation
3k
65k
Jobs insupply chain
Local jobs
56k
95k
Page 15
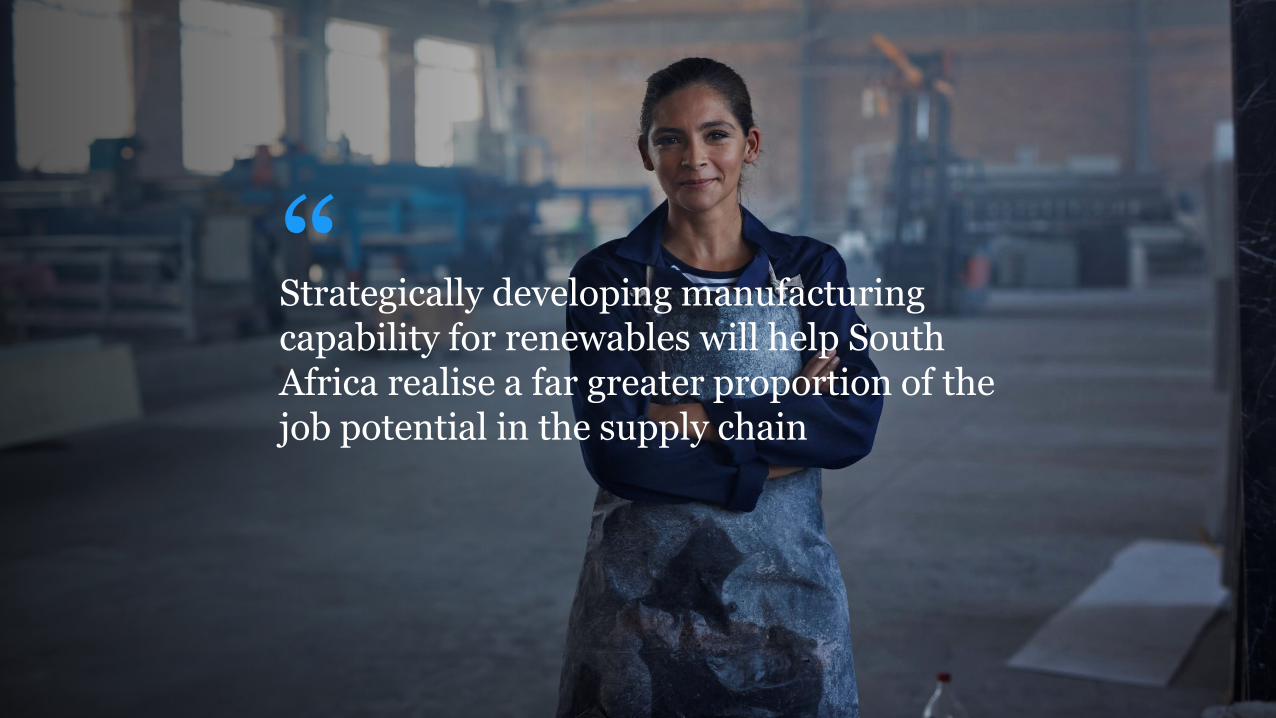
“Strategically developing manufacturing capability for renewables will help South Africa realise a far greater proportion of the job potential in the supply chain
Page 16
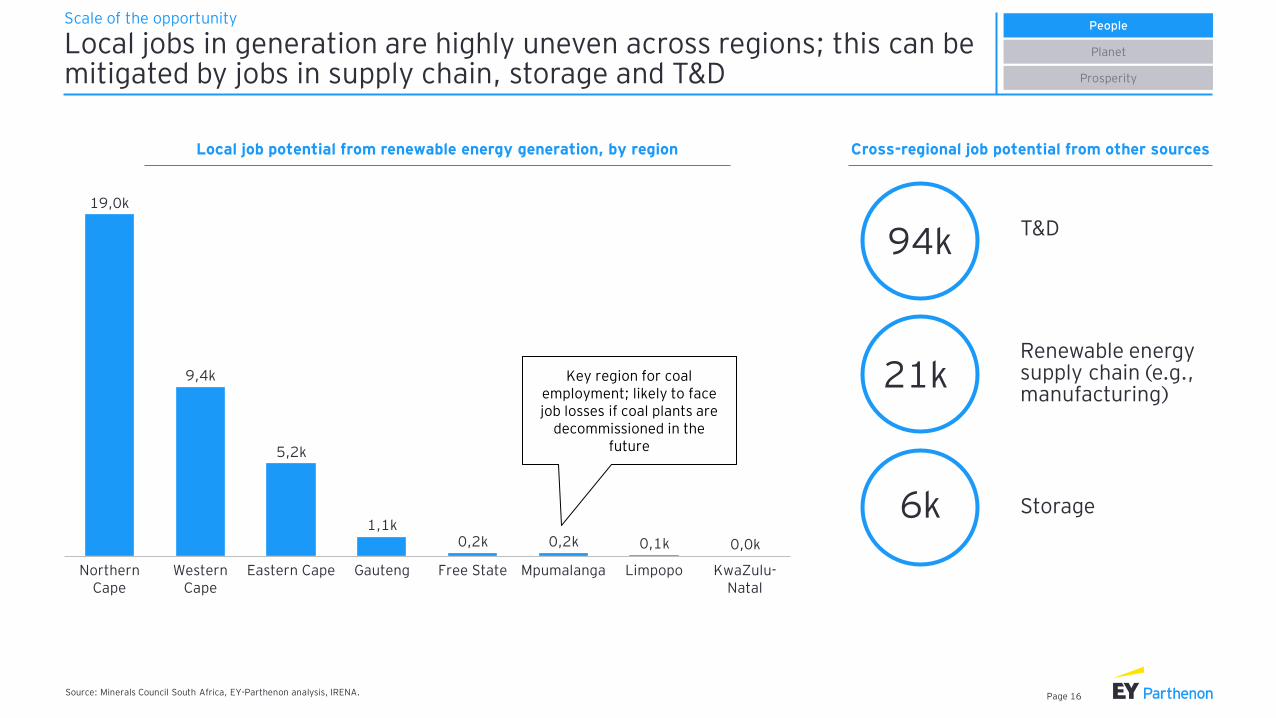
Local jobs in generation are highly uneven across regions; this can be mitigated by jobs in supply chain, storage and T&D
Scale of the opportunityPeople
Planet
Prosperity
Western Cape
0,1k
Northern Cape
Eastern Cape LimpopoGauteng Free State
0,2k
Mpumalanga KwaZulu-Natal
9,4k
5,2k
19,0k
1,1k0,2k 0,0k
Key region for coal employment; likely to face job losses if coal plants are
decommissioned in the future
Renewable energy supply chain (e.g., manufacturing)
Storage
T&D94k
21k
6k
Cross-regional job potential from other sourcesLocal job potential from renewable energy generation, by region
Source: Minerals Council South Africa, EY-Parthenon analysis, IRENA.
Page 17
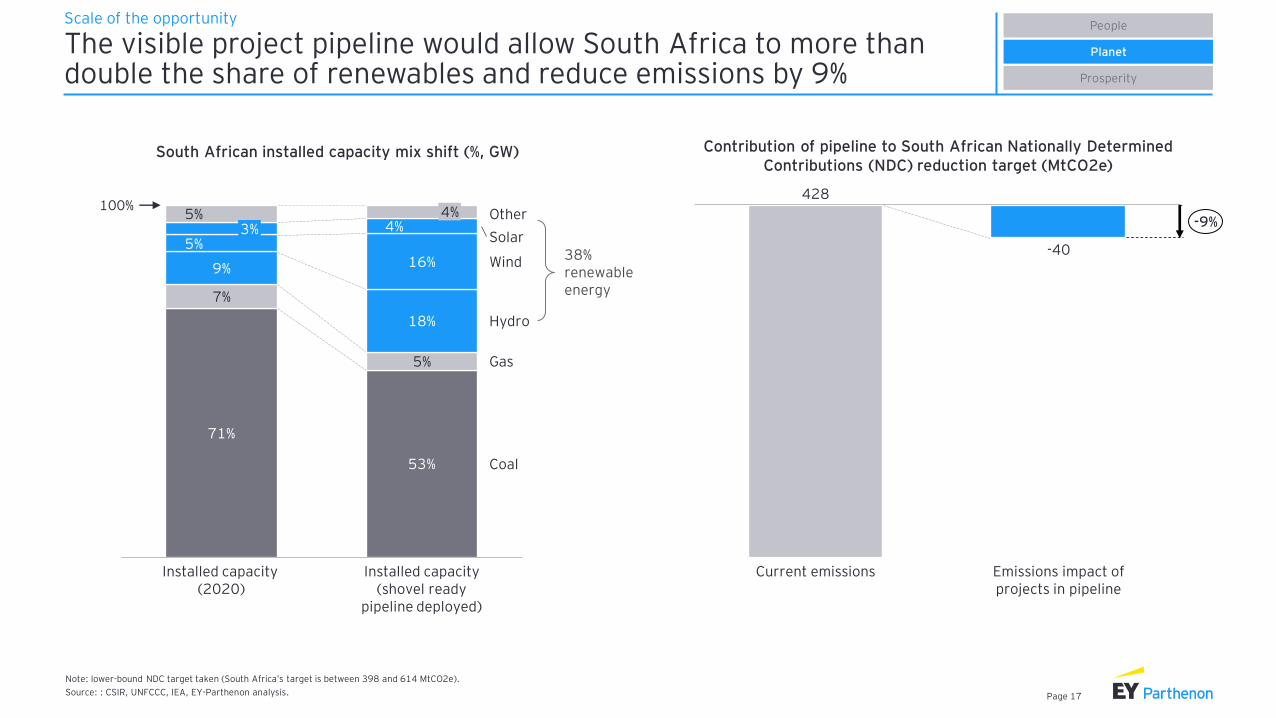
The visible project pipeline would allow South Africa to more than double the share of renewables and reduce emissions by 9%
Scale of the opportunity
Note: lower-bound NDC target taken (South Africa’s target is between 398 and 614 MtCO2e).
Source: : CSIR, UNFCCC, IEA, EY-Parthenon analysis.
People
Planet
Prosperity
South African installed capacity mix shift (%, GW) Contribution of pipeline to South African Nationally Determined Contributions (NDC) reduction target (MtCO2e)
71%
53%
7%
5%
9%
18%
5%16%
4%5%
3%
Gas
Installed capacity (2020)
Coal
4%
Installed capacity (shovel ready
pipeline deployed)
Hydro
Wind
Solar
Other100%
38% renewable energy
-40
Emissions impact of projects in pipeline
Current emissions
428
-9%
Page 18
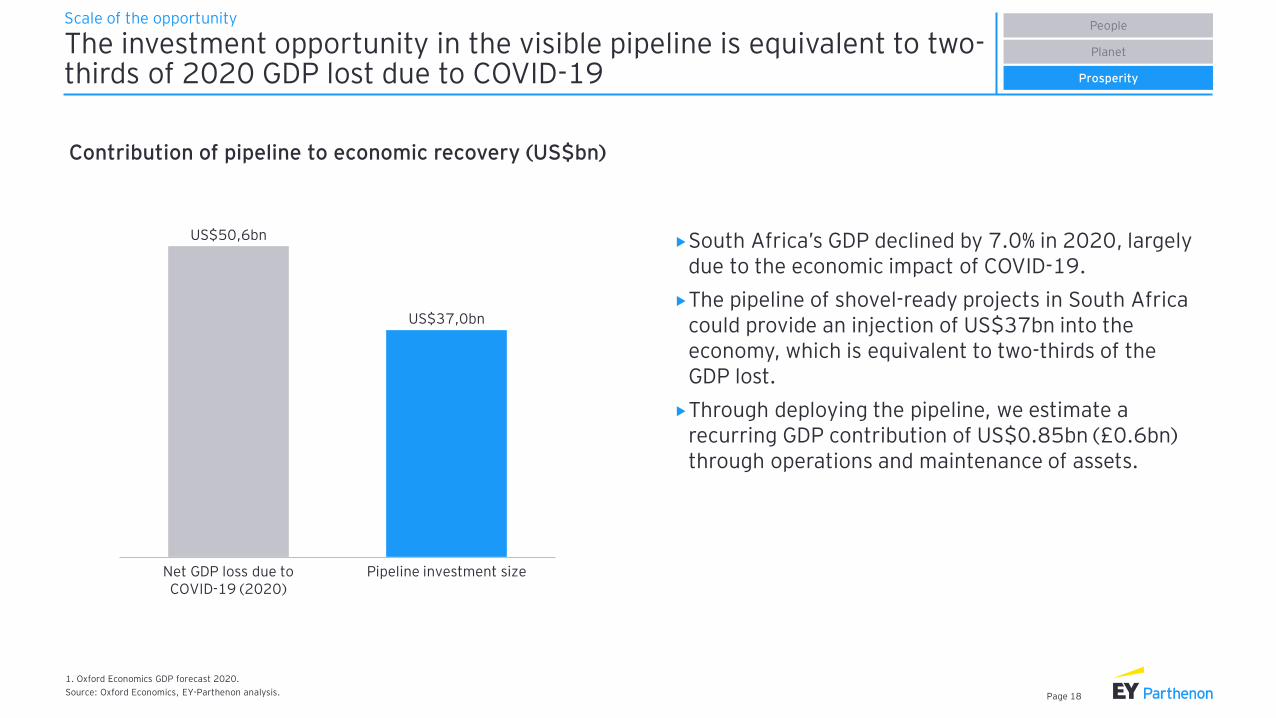
The investment opportunity in the visible pipeline is equivalent to two-thirds of 2020 GDP lost due to COVID-19
1. Oxford Economics GDP forecast 2020.
Source: Oxford Economics, EY-Parthenon analysis.
South Africa’s GDP declined by 7.0% in 2020, largely due to the economic impact of COVID-19.
The pipeline of shovel-ready projects in South Africa could provide an injection of US$37bn into the economy, which is equivalent to two-thirds of the GDP lost.
Through deploying the pipeline, we estimate a recurring GDP contribution of US$0.85bn (£0.6bn) through operations and maintenance of assets.
Scale of the opportunityPeople
Planet
Prosperity
Contribution of pipeline to economic recovery (US$bn)
US$50,6bn
US$37,0bn
Net GDP loss due to COVID-19 (2020)
Pipeline investment size
Page 19
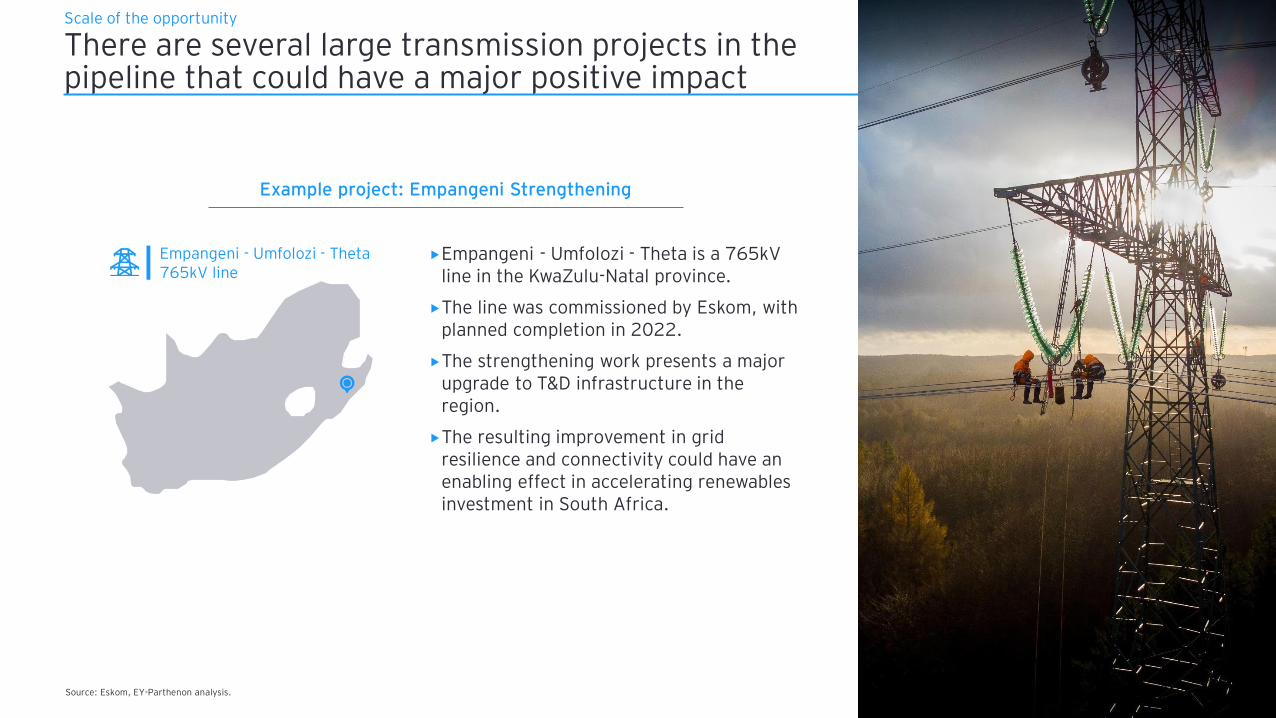
There are several large transmission projects in the pipeline that could have a major positive impact
Empangeni - Umfolozi - Theta is a 765kV line in the KwaZulu-Natal province.
The line was commissioned by Eskom, with planned completion in 2022.
The strengthening work presents a major upgrade to T&D infrastructure in the region.
The resulting improvement in grid resilience and connectivity could have an enabling effect in accelerating renewables investment in South Africa.
Source: Eskom, EY-Parthenon analysis.
Example project: Empangeni Strengthening
Empangeni - Umfolozi - Theta 765kV line
Scale of the opportunity
Page 20
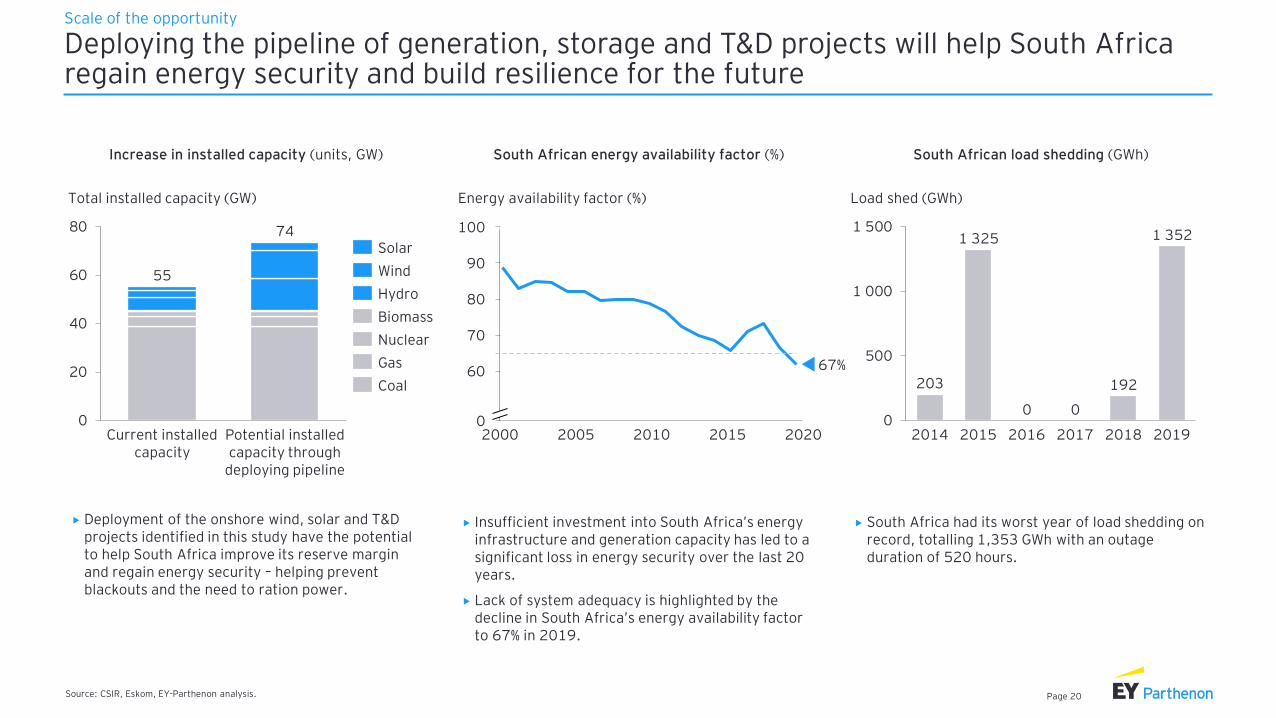
Deploying the pipeline of generation, storage and T&D projects will help South Africa regain energy security and build resilience for the future
Scale of the opportunity
Source: CSIR, Eskom, EY-Parthenon analysis.
South African energy availability factor (%) South African load shedding (GWh)
203
1 325
192
1 352
0
500
1 000
1 500
0
Load shed (GWh)
20182014 20192015 2016 2017
0
90
201520102000 2005 20200
60
70
80
100
Energy availability factor (%)
67%
South Africa had its worst year of load shedding on record, totalling 1,353 GWh with an outage duration of 520 hours.
Insufficient investment into South Africa’s energy infrastructure and generation capacity has led to a significant loss in energy security over the last 20 years.
Lack of system adequacy is highlighted by the decline in South Africa’s energy availability factor to 67% in 2019.
Increase in installed capacity (units, GW)
0
20
40
60
80
Total installed capacity (GW)
Potential installed capacity through
deploying pipeline
Current installed capacity
55
74
Nuclear
Solar
Wind
Hydro
Biomass
Gas
Coal
Deployment of the onshore wind, solar and T&D projects identified in this study have the potential to help South Africa improve its reserve margin and regain energy security – helping prevent blackouts and the need to ration power.
Page 21
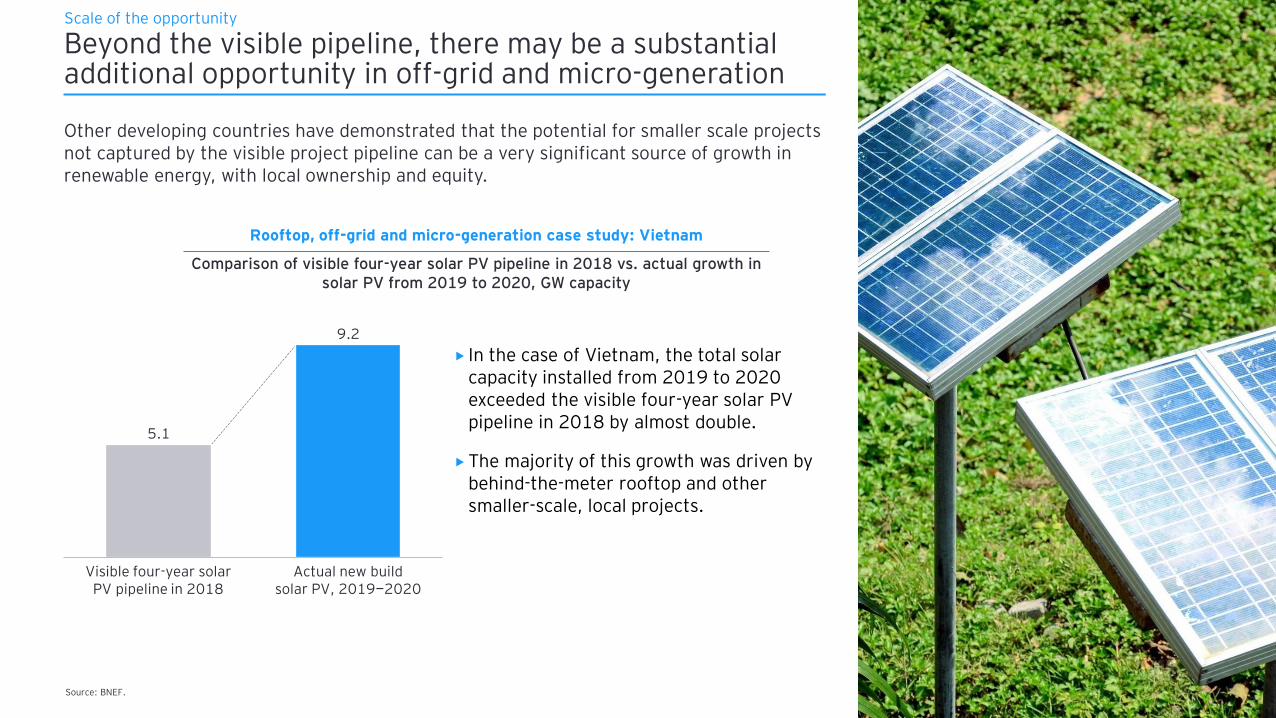
Beyond the visible pipeline, there may be a substantial additional opportunity in off-grid and micro-generation
Other developing countries have demonstrated that the potential for smaller scale projects not captured by the visible project pipeline can be a very significant source of growth in renewable energy, with local ownership and equity.
In the case of Vietnam, the total solar capacity installed from 2019 to 2020 exceeded the visible four-year solar PV pipeline in 2018 by almost double.
The majority of this growth was driven by behind-the-meter rooftop and other smaller-scale, local projects.
Source: BNEF.
Actual new build solar PV, 2019—2020
Visible four-year solar PV pipeline in 2018
5.1
9.2
Comparison of visible four-year solar PV pipeline in 2018 vs. actual growth in solar PV from 2019 to 2020, GW capacity
Scale of the opportunity
Rooftop, off-grid and micro-generation case study: Vietnam
Page 22
Agenda
► Executive summary
► Scale of the opportunity
► Key policy recommendations
► Appendix
Page 23
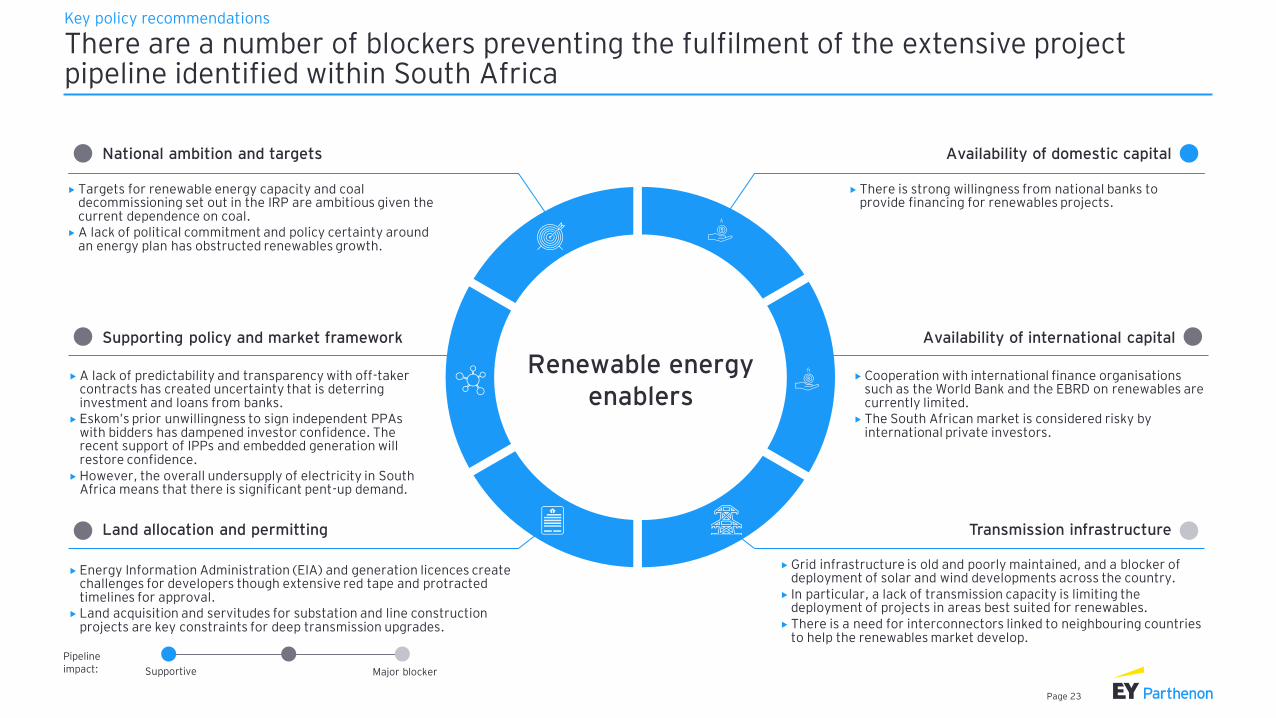
There are a number of blockers preventing the fulfilment of the extensive project pipeline identified within South Africa
Key policy recommendations
Availability of domestic capital
Availability of international capital
National ambition and targets
Supporting policy and market framework
Land allocation and permitting Transmission infrastructure
Renewable energy enablers
A lack of predictability and transparency with off-taker contracts has created uncertainty that is deterring investment and loans from banks.
Eskom’s prior unwillingness to sign independent PPAs with bidders has dampened investor confidence. The recent support of IPPs and embedded generation will restore confidence.
However, the overall undersupply of electricity in South Africa means that there is significant pent-up demand.
Targets for renewable energy capacity and coal decommissioning set out in the IRP are ambitious given the current dependence on coal.
A lack of political commitment and policy certainty around an energy plan has obstructed renewables growth.
Grid infrastructure is old and poorly maintained, and a blocker of deployment of solar and wind developments across the country.
In particular, a lack of transmission capacity is limiting the deployment of projects in areas best suited for renewables.
There is a need for interconnectors linked to neighbouring countries to help the renewables market develop.
Energy Information Administration (EIA) and generation licences create challenges for developers though extensive red tape and protracted timelines for approval.
Land acquisition and servitudes for substation and line construction projects are key constraints for deep transmission upgrades.
Cooperation with international finance organisations such as the World Bank and the EBRD on renewables are currently limited.
The South African market is considered risky by international private investors.
There is strong willingness from national banks to provide financing for renewables projects.
Supportive Major blocker
Pipeline impact:
Page 24
“With the right enablers in place, the potential in the pipeline can be unlocked rapidly.
Page 25
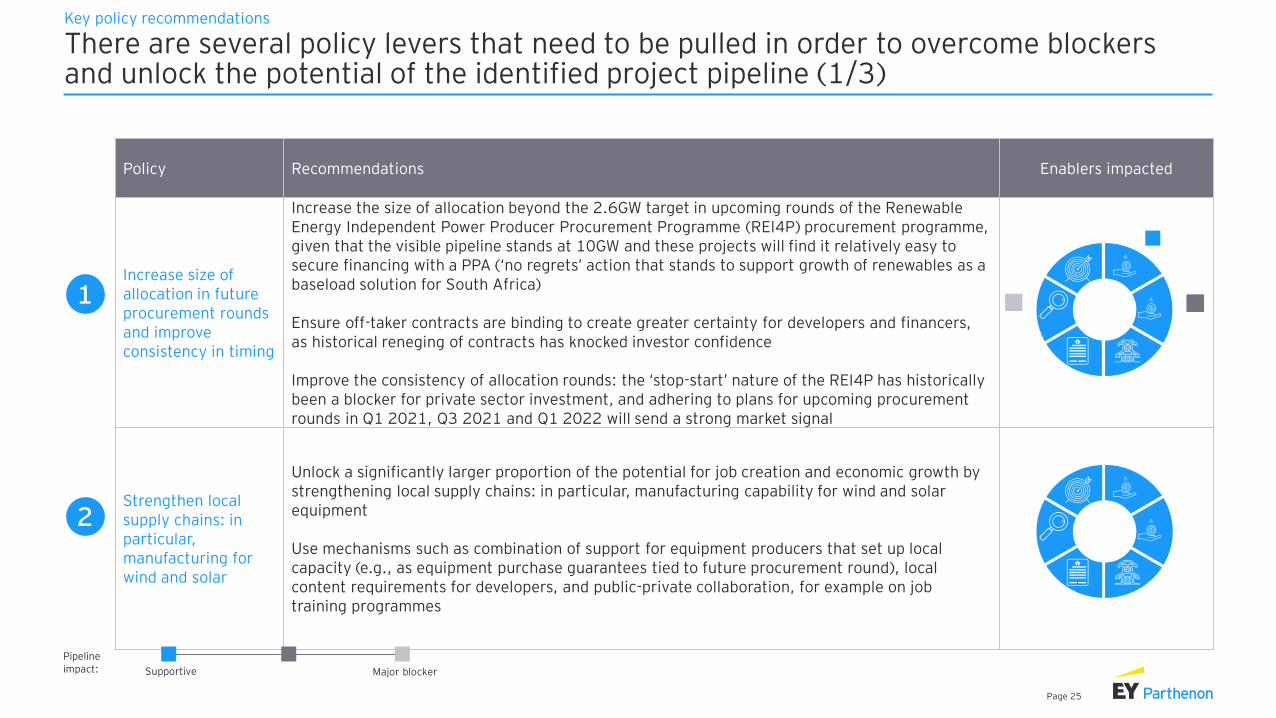
Policy Recommendations Enablers impacted
Increase size of allocation in future procurement rounds and improve consistency in timing
Increase the size of allocation beyond the 2.6GW target in upcoming rounds of the Renewable Energy Independent Power Producer Procurement Programme (REI4P) procurement programme, given that the visible pipeline stands at 10GW and these projects will find it relatively easy to secure financing with a PPA (‘no regrets’ action that stands to support growth of renewables as a baseload solution for South Africa)
Ensure off-taker contracts are binding to create greater certainty for developers and financers, as historical reneging of contracts has knocked investor confidence
Improve the consistency of allocation rounds: the ‘stop-start’ nature of the REI4P has historically been a blocker for private sector investment, and adhering to plans for upcoming procurement rounds in Q1 2021, Q3 2021 and Q1 2022 will send a strong market signal
Strengthen local supply chains: in particular, manufacturing for wind and solar
Unlock a significantly larger proportion of the potential for job creation and economic growth by strengthening local supply chains: in particular, manufacturing capability for wind and solar equipment
Use mechanisms such as combination of support for equipment producers that set up local capacity (e.g., as equipment purchase guarantees tied to future procurement round), local content requirements for developers, and public-private collaboration, for example on job training programmes
There are several policy levers that need to be pulled in order to overcome blockers and unlock the potential of the identified project pipeline (1/3)
Key policy recommendations
1
2
Supportive Major blocker
Pipeline impact:
Page 26
There are several policy levers that need to be pulled in order to overcome blockers and unlock the potential of the identified project pipeline (2/3)
Key policy recommendations
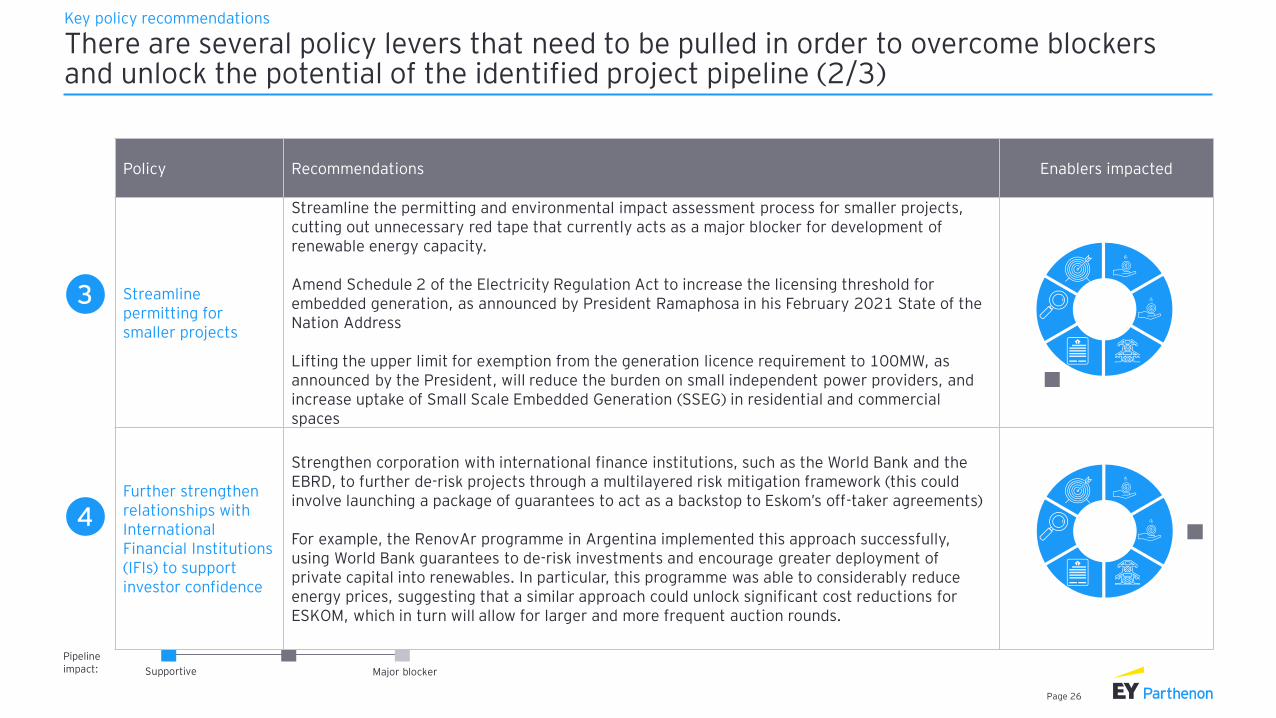
3
4
Supportive Major blocker
Pipeline impact:
Policy Recommendations Enablers impacted
Streamline permitting for smaller projects
Streamline the permitting and environmental impact assessment process for smaller projects, cutting out unnecessary red tape that currently acts as a major blocker for development of renewable energy capacity.
Amend Schedule 2 of the Electricity Regulation Act to increase the licensing threshold for embedded generation, as announced by President Ramaphosa in his February 2021 State of the Nation Address
Lifting the upper limit for exemption from the generation licence requirement to 100MW, as announced by the President, will reduce the burden on small independent power providers, and increase uptake of Small Scale Embedded Generation (SSEG) in residential and commercial spaces
Further strengthen relationships with International Financial Institutions (IFIs) to support investor confidence
Strengthen corporation with international finance institutions, such as the World Bank and the EBRD, to further de-risk projects through a multilayered risk mitigation framework (this could involve launching a package of guarantees to act as a backstop to Eskom’s off-taker agreements)
For example, the RenovAr programme in Argentina implemented this approach successfully, using World Bank guarantees to de-risk investments and encourage greater deployment of private capital into renewables. In particular, this programme was able to considerably reduce energy prices, suggesting that a similar approach could unlock significant cost reductions for ESKOM, which in turn will allow for larger and more frequent auction rounds.
Page 27
Policy Recommendations Enablers impacted
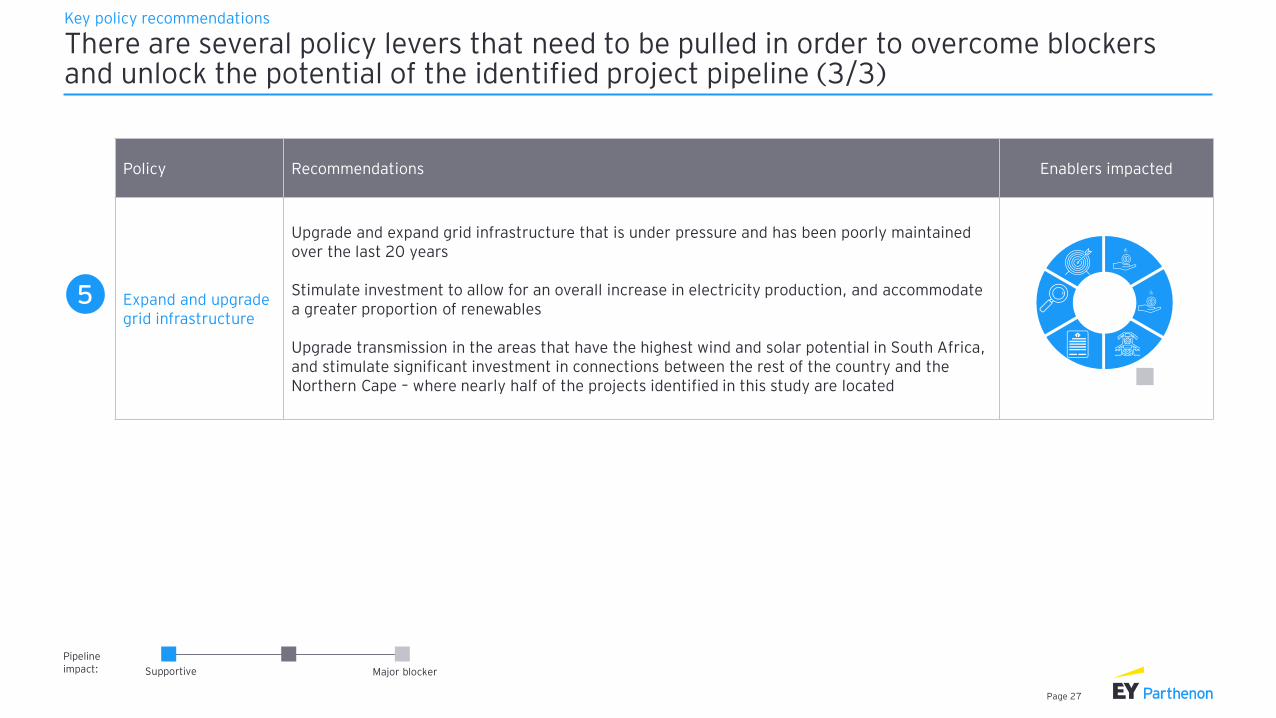
Expand and upgrade grid infrastructure
Upgrade and expand grid infrastructure that is under pressure and has been poorly maintained over the last 20 years
Stimulate investment to allow for an overall increase in electricity production, and accommodate a greater proportion of renewables
Upgrade transmission in the areas that have the highest wind and solar potential in South Africa, and stimulate significant investment in connections between the rest of the country and the Northern Cape – where nearly half of the projects identified in this study are located
There are several policy levers that need to be pulled in order to overcome blockers and unlock the potential of the identified project pipeline (3/3)
Key policy recommendations
5
Supportive Major blocker
Pipeline impact:
Page 28
Agenda
► Executive summary
► Scale of the opportunity
► Key policy recommendations
► Appendix
Page 29
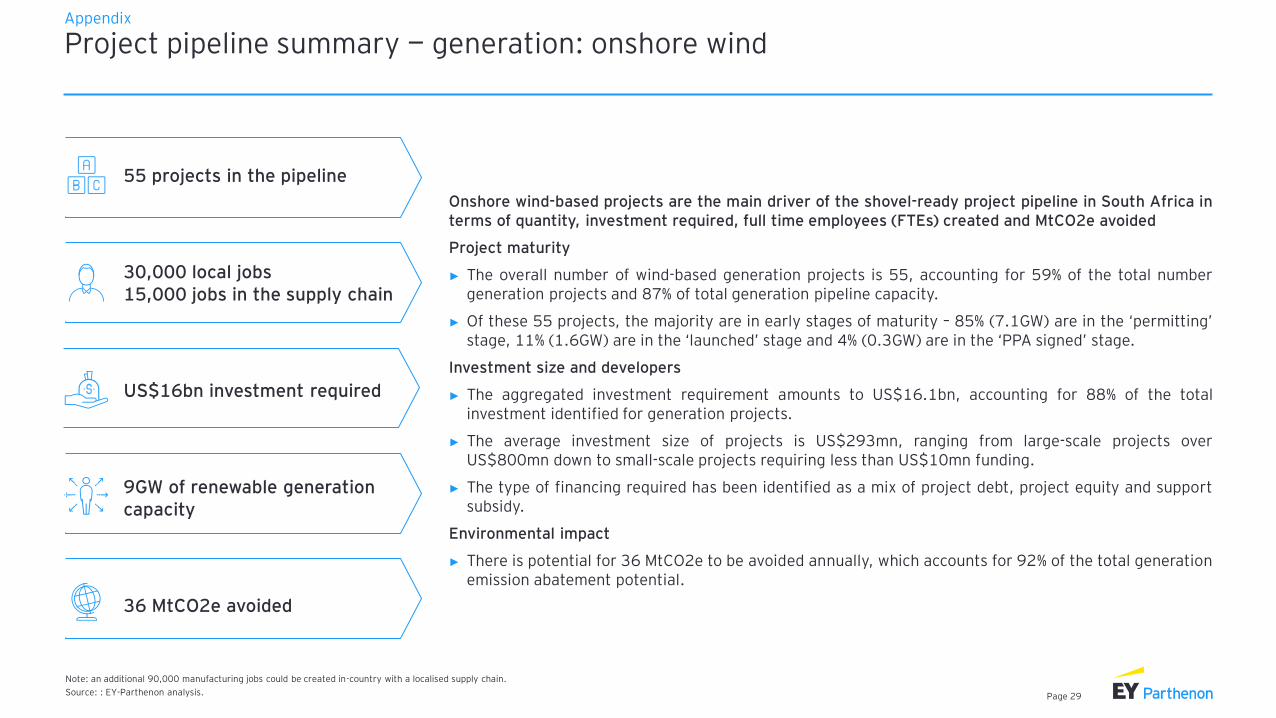
Project pipeline summary — generation: onshore windAppendix
Note: an additional 90,000 manufacturing jobs could be created in-country with a localised supply chain.
Source: : EY-Parthenon analysis.
Onshore wind-based projects are the main driver of the shovel-ready project pipeline in South Africa interms of quantity, investment required, full time employees (FTEs) created and MtCO2e avoided
Project maturity
► The overall number of wind-based generation projects is 55, accounting for 59% of the total numbergeneration projects and 87% of total generation pipeline capacity.
► Of these 55 projects, the majority are in early stages of maturity – 85% (7.1GW) are in the ‘permitting’stage, 11% (1.6GW) are in the ‘launched’ stage and 4% (0.3GW) are in the ‘PPA signed’ stage.
Investment size and developers
► The aggregated investment requirement amounts to US$16.1bn, accounting for 88% of the totalinvestment identified for generation projects.
► The average investment size of projects is US$293mn, ranging from large-scale projects overUS$800mn down to small-scale projects requiring less than US$10mn funding.
► The type of financing required has been identified as a mix of project debt, project equity and supportsubsidy.
Environmental impact
► There is potential for 36 MtCO2e to be avoided annually, which accounts for 92% of the total generationemission abatement potential.
US$16bn investment required
36 MtCO2e avoided
9GW of renewable generation capacity
55 projects in the pipeline
30,000 local jobs15,000 jobs in the supply chain

Page 30
Project pipeline summary — generation: solarAppendix
Note: an additional 12,000 manufacturing jobs could be created in-country with a localised supply chain.
Source: : EY-Parthenon analysis.
Solar-based projects are an important driver of the shovel-ready project pipeline in South Africa in
terms of quantity, investment required, FTEs created and MtCO2e avoided
Project maturity
The overall number of solar-based generation projects is 37, accounting for 39% of the total number
generation projects and 13% of total generation pipeline capacity.
Of these 37 projects, the majority are in early stages of maturity – 46% (0.6GW) are in the ‘announced’
stage and 54% (0.7GW) are in the ‘permitting’ stage.
Investment size and developers
The aggregated investment required amounts to US$2.1bn, accounting for 11% of the total investment
identified for generation projects.
The average investment size of projects is US$56mn, ranging from large scale projects over US$180mn
down to small-scale projects requiring less than US$2mn funding.
The type of financing required has been identified as a mix of project debt, project equity and support
subsidy.
Environmental impact
There is potential for 3 MtCO2e to be avoided annually, which accounts for 8% of the total generation
emission abatement potential.
US$2bn investment required
3 MtCO2e avoided
1GW of renewable generation capacity
37 projects in the pipeline
6,000 local jobs6,000 jobs in the supply chain
Page 31
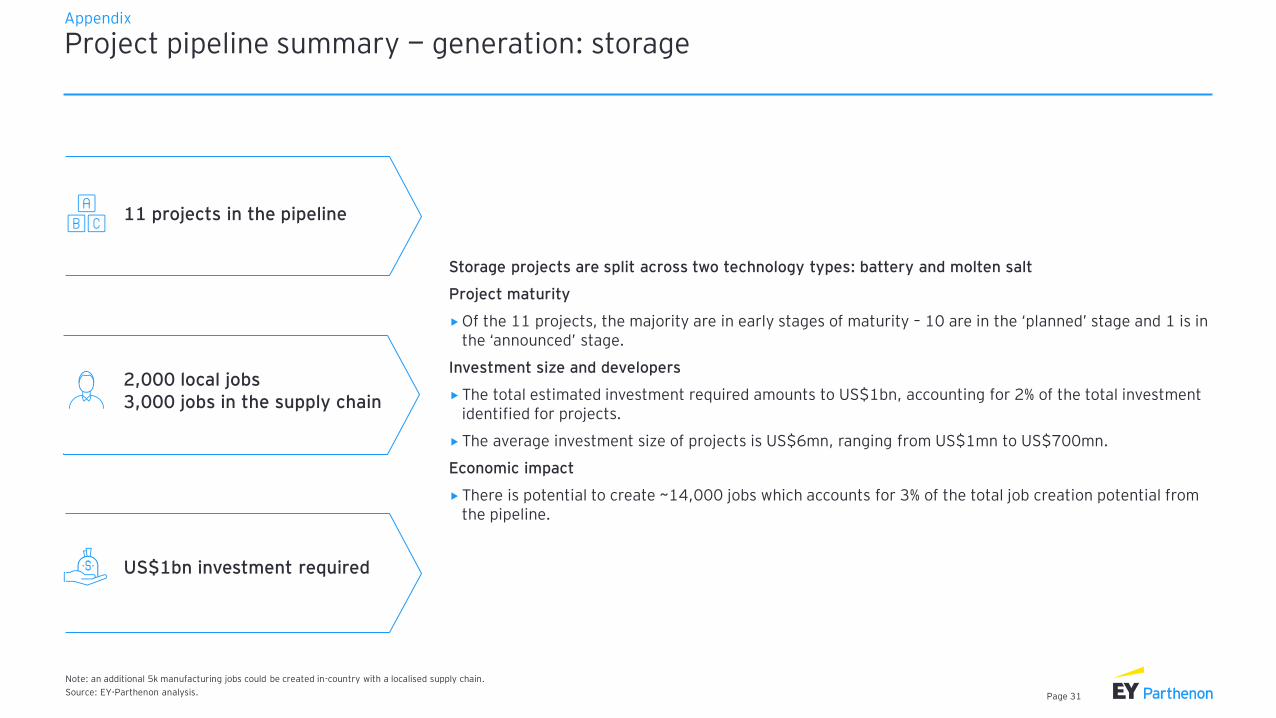
Project pipeline summary — generation: storageAppendix
Note: an additional 5k manufacturing jobs could be created in-country with a localised supply chain.
Source: EY-Parthenon analysis.
11 projects in the pipeline
2,000 local jobs3,000 jobs in the supply chain
Storage projects are split across two technology types: battery and molten salt
Project maturity
Of the 11 projects, the majority are in early stages of maturity – 10 are in the ‘planned’ stage and 1 is in the ‘announced’ stage.
Investment size and developers
The total estimated investment required amounts to US$1bn, accounting for 2% of the total investment identified for projects.
The average investment size of projects is US$6mn, ranging from US$1mn to US$700mn.
Economic impact
There is potential to create ~14,000 jobs which accounts for 3% of the total job creation potential from the pipeline.
US$1bn investment required
Page 32
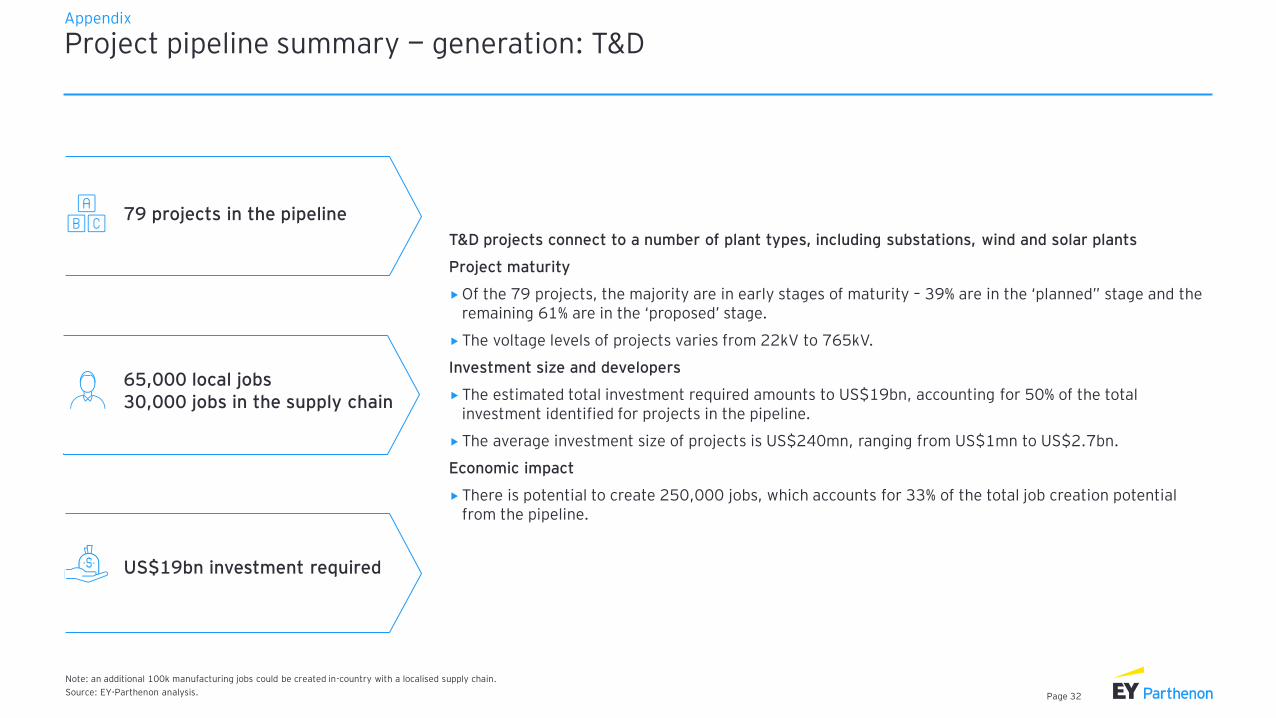
Project pipeline summary — generation: T&DAppendix
Note: an additional 100k manufacturing jobs could be created in-country with a localised supply chain.
Source: EY-Parthenon analysis.
79 projects in the pipeline
65,000 local jobs30,000 jobs in the supply chain
T&D projects connect to a number of plant types, including substations, wind and solar plants
Project maturity
Of the 79 projects, the majority are in early stages of maturity – 39% are in the ‘planned” stage and the remaining 61% are in the ‘proposed’ stage.
The voltage levels of projects varies from 22kV to 765kV.
Investment size and developers
The estimated total investment required amounts to US$19bn, accounting for 50% of the total investment identified for projects in the pipeline.
The average investment size of projects is US$240mn, ranging from US$1mn to US$2.7bn.
Economic impact
There is potential to create 250,000 jobs, which accounts for 33% of the total job creation potential from the pipeline.
US$19bn investment required
Page 33
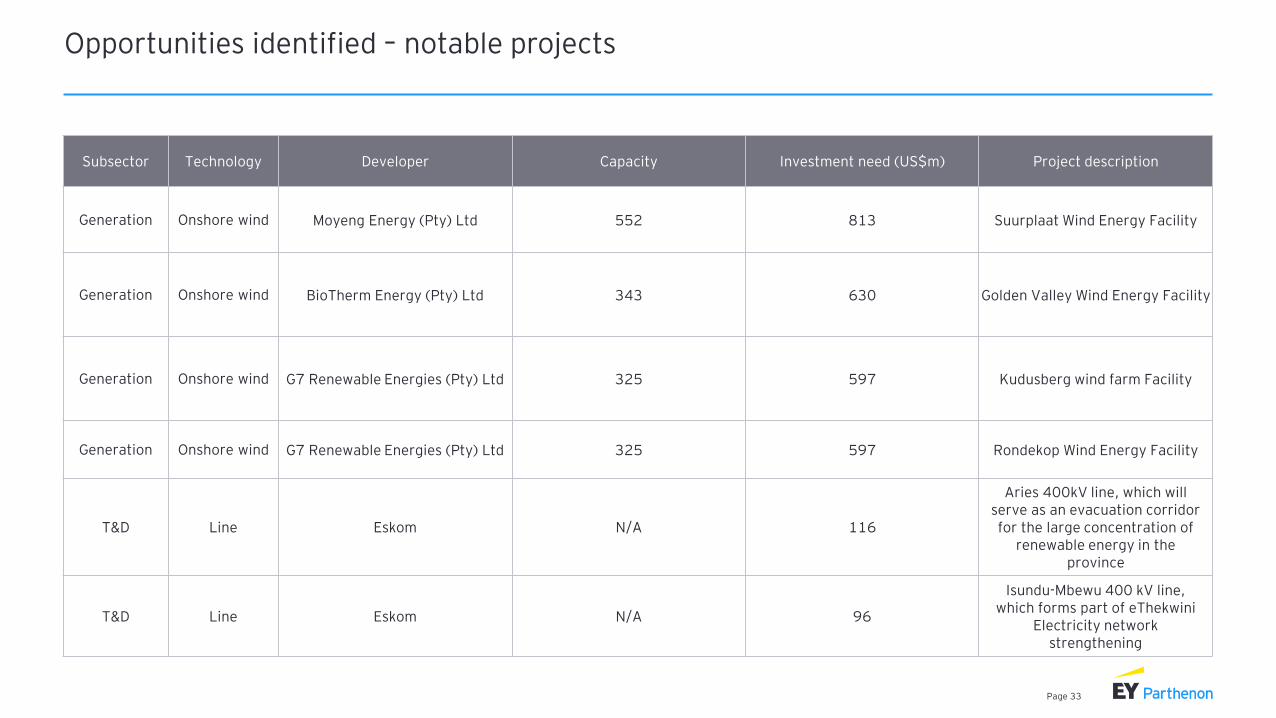
Opportunities identified – notable projects
Subsector Technology Developer Capacity Investment need (US$m) Project description
Generation Onshore wind Moyeng Energy (Pty) Ltd 552 813 Suurplaat Wind Energy Facility
Generation Onshore wind BioTherm Energy (Pty) Ltd 343 630 Golden Valley Wind Energy Facility
Generation Onshore wind G7 Renewable Energies (Pty) Ltd 325 597 Kudusberg wind farm Facility
Generation Onshore wind G7 Renewable Energies (Pty) Ltd 325 597 Rondekop Wind Energy Facility
T&D Line Eskom N/A 116
Aries 400kV line, which will serve as an evacuation corridor for the large concentration of
renewable energy in the province
T&D Line Eskom N/A 96
Isundu-Mbewu 400 kV line, which forms part of eThekwini
Electricity network strengthening
Page 34
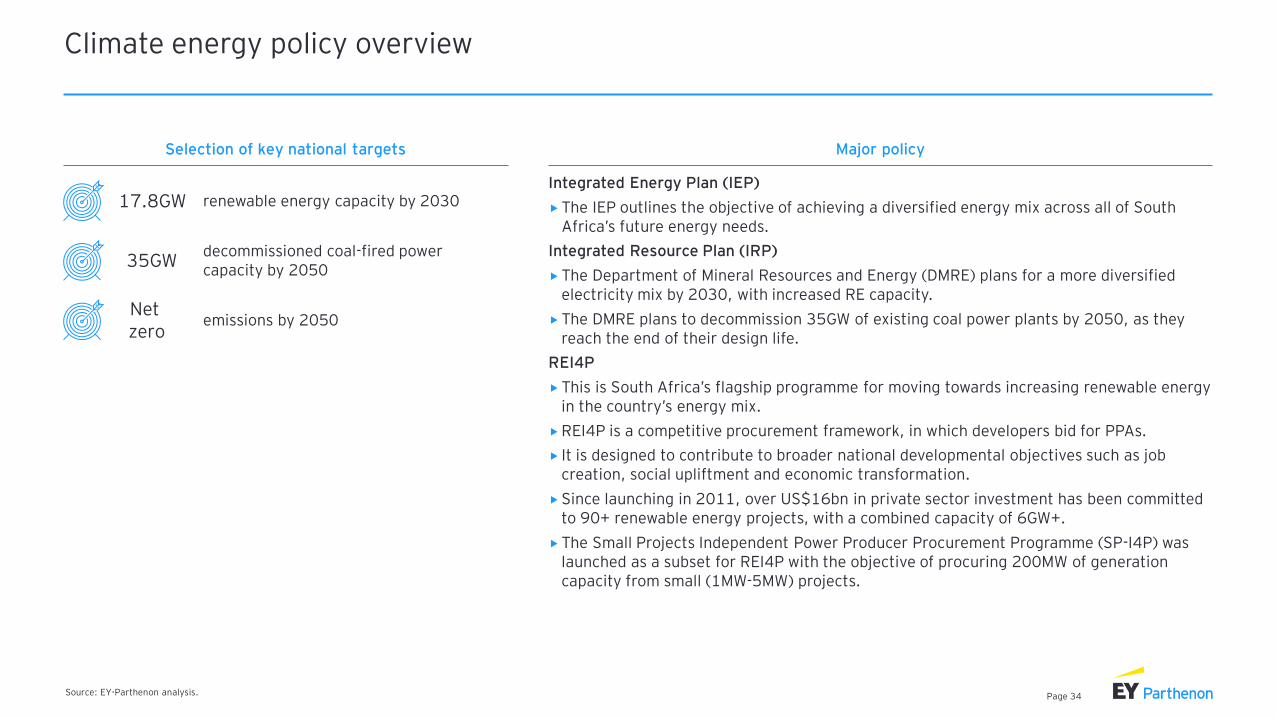
Climate energy policy overview
Source: EY-Parthenon analysis.
Selection of key national targets Major policy
Integrated Energy Plan (IEP)
The IEP outlines the objective of achieving a diversified energy mix across all of South Africa’s future energy needs.
Integrated Resource Plan (IRP)
The Department of Mineral Resources and Energy (DMRE) plans for a more diversified electricity mix by 2030, with increased RE capacity.
The DMRE plans to decommission 35GW of existing coal power plants by 2050, as they reach the end of their design life.
REI4P
This is South Africa’s flagship programme for moving towards increasing renewable energy in the country’s energy mix.
REI4P is a competitive procurement framework, in which developers bid for PPAs.
It is designed to contribute to broader national developmental objectives such as job creation, social upliftment and economic transformation.
Since launching in 2011, over US$16bn in private sector investment has been committed to 90+ renewable energy projects, with a combined capacity of 6GW+.
The Small Projects Independent Power Producer Procurement Programme (SP-I4P) was launched as a subset for REI4P with the objective of procuring 200MW of generation capacity from small (1MW-5MW) projects.
renewable energy capacity by 203017.8GW
decommissioned coal-fired power capacity by 2050
35GW
emissions by 2050Net zero
Page 35
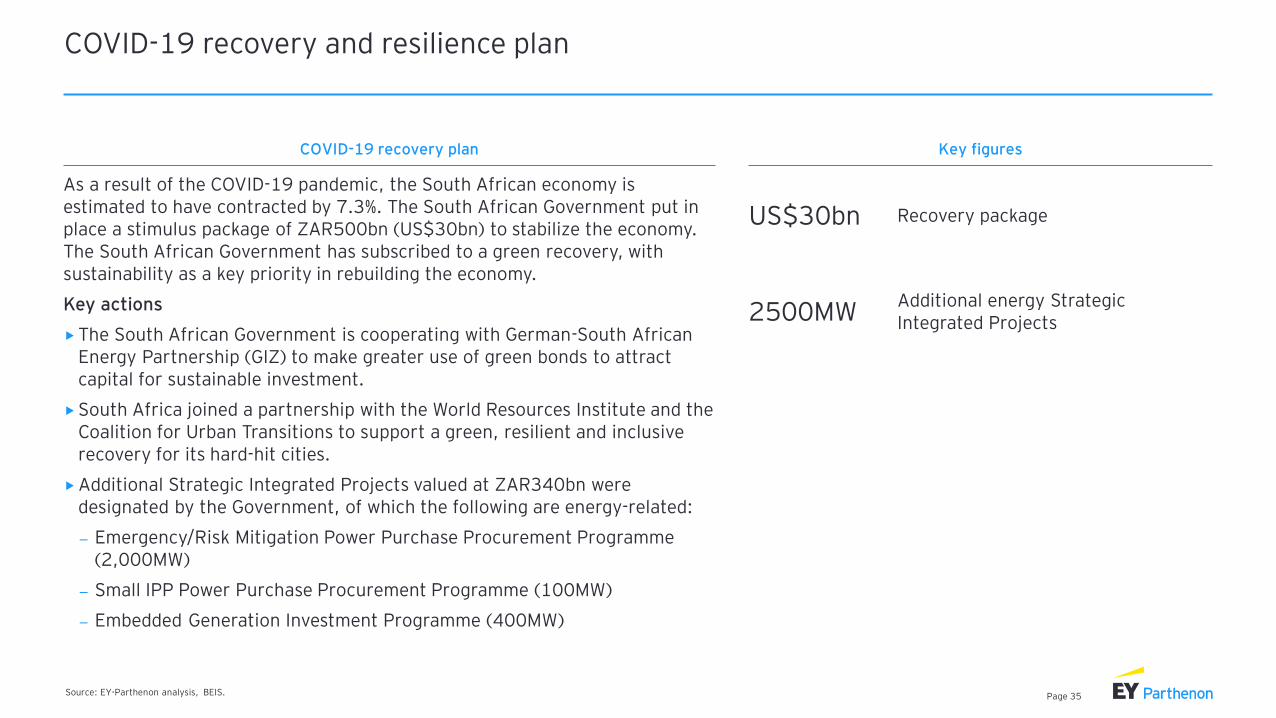
COVID-19 recovery and resilience plan
Source: EY-Parthenon analysis, BEIS.
COVID-19 recovery plan Key figures
As a result of the COVID-19 pandemic, the South African economy is estimated to have contracted by 7.3%. The South African Government put in place a stimulus package of ZAR500bn (US$30bn) to stabilize the economy. The South African Government has subscribed to a green recovery, with sustainability as a key priority in rebuilding the economy.
Key actions
The South African Government is cooperating with German-South African Energy Partnership (GIZ) to make greater use of green bonds to attract capital for sustainable investment.
South Africa joined a partnership with the World Resources Institute and the Coalition for Urban Transitions to support a green, resilient and inclusive recovery for its hard-hit cities.
Additional Strategic Integrated Projects valued at ZAR340bn were designated by the Government, of which the following are energy-related:
– Emergency/Risk Mitigation Power Purchase Procurement Programme (2,000MW)
– Small IPP Power Purchase Procurement Programme (100MW)
– Embedded Generation Investment Programme (400MW)
US$30bn
2500MW
Recovery package
Additional energy Strategic Integrated Projects
EY | Building a better working world
EY exists to build a better working world, helping to create long-term value for clients, people and society and build trust in the capital markets.
Enabled by data and technology, diverse EY teams in over 150 countries provide trust through assurance and help clients grow, transform and operate.
Working across assurance, consulting, law, strategy, tax and transactions, EY teams ask better questions to find new answers for the complex issues facing our world today.
EY refers to the global organization, and may refer to one or more, of the member firms of Ernst & Young Global Limited, each of which is a separate legal entity. Ernst & Young Global Limited, a UK company limited by guarantee, does not provide services to clients. Information about how EY collects and uses personal data and a description of the rights individuals have under data protection legislation are available via ey.com/privacy. EY member firms do not practice law where prohibited by local laws. For more information about our organization, please visit ey.com.
Ernst & Young LLP is a client-serving member firm of Ernst & Young Global Limited operating in the US. (For US-only material)
About EY-Parthenon
EY-Parthenon teams work with clients to navigate complexity by helping them to reimagine their eco-systems, reshape their portfolios and reinvent themselves for a better future. With global connectivity and scale, EY-Parthenon teams focus on Strategy Realized — helping CEOs design and deliver strategies to better manage challenges while maximizing opportunities as they look to transform their businesses. From idea to implementation, EY-Parthenon teams help organizations to build a better working world by fostering long-term value. EY-Parthenon is a brand under which a number of EY member firms across the globe provide strategy consulting services. For more information, please visit ey.com/parthenon.
© 2021 Ernst & Young LLP. or © 2021 EYGM Limited. or © 2021 Local member firm name.
All Rights Reserved.
SCORE No. XX0000 or EYG No. XX0000
ED None
This material has been prepared for general informational purposes only and is not intended to be relied upon as accounting, tax or other professional advice. Please refer to your advisors for specific advice.
ey.com