Embed Size (px)
Citation preview

1
Covered Bonds Investor Presentation
March 2018

2
Index
01 EXECUTIVE SUMMARY
Bankia Results……………………………………………………………………. 3
Covered Bonds Ratings…………………………………………………….. 5
02 MORTGAGE COVER POOL
Cover Pool Metrics…………………………………………………………….. 6
Residential Sub-Pool……………………………………..…………………. 8
Commercial Sub-Pool……………………………………………………….. 9
03 WHOLESALE MATURITIES
Wholesale Maturities profile………………………………………..… 10
04 ANNEXES
Macroeconomic Indicators……………………………………………. 11
Spanish Real Estate Markets…………………………………………. 12
D isclaimer
This do cument has beenpreparedbyBankia, S .A. (“Bankia”) and is presented e xclus ive ly fo r in formation purposes. It is no ta prospectus and does no t constitu te an offero r re commendation to invest.
This do cument does not cons titu te a commitment to subs cribe, o r an offer to finance , or an o ffer to se ll, o r a so licitation o f offers to bu yse cu rities of Bankia, allo f whichare s ubject to internal approval by Bankia.
Bankia does no t gu arantee the accu racy or comple teness of the info rmation contained in th is document. The in formation contained here in has been obtained fromsources that Bankia cons ide rs re liab le , bu tBankia does no t represent o r warrant that the information is comple te or accu rate, in particu lar with respect to data pro videdby th ird parties . Th is document may contain ab ridged o r unaudited info rmation and re cip ients are invited to consu lt the pub licdo cuments and information submittedbyBankia to the financial marke t superviso ry au thorities . All o p in ions and es timates are g iven as o f the d ate stated in the document and so maybe sub ject to change.The value o f any investment may flu ctuate as a result o f changes in the marke t. The information in th is do cument is no t intended to pred ict fu tu re resu lts and nogu arantee is given in that respect.
D is tribu tion o f th is do cument in o ther ju risd ictions may be prohib ited, and there fore re cip ients o f th is do cumento r any persons who maye ventually ob tain a copy of itare responsible for being aware of and complying with said restrictions. By accepting this document you accept the foregoing restrictions and warnings.
This document does not re veal all the ris ks o r o ther material facto rs relating to inves tments in the secu rities / transactions of Bankia. Befo re entering into anytrans action, po tential investo rs mus tensu re that they fu lly unders tand the terms o f the secu rities / transactions and the ris ks inhe rent in them. This do cument is no t aprospectus fo r the secu rities described in it. Po tential investo rs should only subscribe for se curities o f Bankia on the bas is of the info rmation pub lished in the appropriateBankia prospectus, noton the basis of the information contained in this document.

3
1Q18 HIGHLIGHTS
NON-PERFORMING LOANS(1) 11.6€
11.0
NPL COVERAGE RATIO 55.1% 53.7%
NPL RATIO 8.7% 9.5%
ATRIBUTABLE PROFIT 229 3M18€
FULLY LOADED CET1 12.7% 13.6%
%
ASSET QUALITY MAR 2018 MAR 2107
PROFITABILITY & CAPITAL MAR 2018 MAR 2017
COST OF RISK(3) 23 3M18
bps
%
%
€bn
ROE
€mn
%
%
CURRENT ISSUER RATINGS
LONG TERM OUTLOOK SHORT TERM
S&P GLOBAL RATINGS
FITCH RATINGS
BBB Stable A-2
BBB- Positive F3
01. EXECUTIVE SUMMARY
Bankia Results
1 COMMERCIAL ACTIVITY
€635mnNew residential
mortgages 3M 18
65%Average LTV new
mortgages
2 EFFICIENCY & PROFITABLITY
51.7%
Cost toIncome
ratio M ar18
0.8%
Operating expenses
1Q18 vs 1Q17 proforma Bankia+BMN
3 LIQUIDITY
92.7%LTD ratio
M ar18
€33.6bnLiquid Assets
M ar18
4 CAPITAL
+533bps
CET1 Phase in Buffer vs SREP
2018 requirements
DBRS BBB (high) Stable R-1 (low)
3043M17
7.5% 3M18
10.2% 3M17
15.67%
Total Solvency Ratio Fully Loaded
M ar18
SCOPE RATINGS BBB+ Stable S-2
31 3M17
(1) As of 31/12/2017 was €9.7bn before effect of consolidating BMN. Post BMN the amount as of 31/12/2017 was €12.1bn

4
ATTRIBUTABLE PROFIT (2)
€816mnNET INTEREST INCOME
€1,968mn
PHASE IN CET1
14.15%FULLY LOADED CET1(4)
12.46%
01. EXECUTIVE SUMMARY
Bankia Results
€
CUSTOMER FUNDS (3)
+22.8%€
BRANCHES
> 2,400CUSTOMER FUNDS
€175,960mnGROSS CUSTOMER LOANS
€128,782mn€
2017 HIGHLIGHTS (1)
UNIVERSAL BANKING MODEL, based on multi-channelmanagement, with a presence throughout Spain and highmarket shares in historical core regions, strengthened withthe merger of Banca Mare Nostrum (BMN).
BEST IN CLASS CORPORATE GOVERNANCE, optimalorganizational structure and highly respected managementteam.
SOLVENT, EFFICIENT AND PROFITABLE INSTITUTION, theGroup ended 2017 with an ROE of 6.6%.
CLEAN BALANCE SHEET, with continuing asset qualitydynamics post merger with BMN, with a reduction of €0.5bn in NPLs in 1Q18.
SUSTAINABLE CAPITAL AND LIQUIDITY GENERATION.Comfortable solvency levels with a Phase In CET1 ratio of14.15% and Fully Loaded CET1 ratio of 12.46%, as ofDecember 2017.
POSITIVE COMMERCIAL DYNAMICS, reflected in thegrowth of fee and commission income (+3.2% year-on-yearat Dec17 and +2.4% year-on-year at Mar18 vs proformaBankia+BMN), offsetting part of the pressure that theeuribor continues to exert on net interest income.
(1) Dec.17 data post merger between Bankia and BMN.
(2) The “Profit/(loss) attributable to the group asreported” amounts to €505mn after includingintegration cost with BMN for €312mn. The BankiaGroup reported income statement, includes BMN’scontribution to the results for the month of Decemberonly.
(3) Includes the off-balance sheet products marketedby BMN, which as from 2018 will be managed byBankia.
(4) Includes IFRS9 impact of -20 bps
5
01. EXECUTIVE SUMMARY
Covered Bonds Ratings
2013 2014 2015 2016 2017 2018
BBB
A-
A
S&P Global Ratings DBRS
2014 2015 2016 2017 2018
A-
A+
A+AA
A+AA +
AA-Positive
AAA
DBRS
APositive
AAAStable
Fitch Ratings
A-
BBB+
A
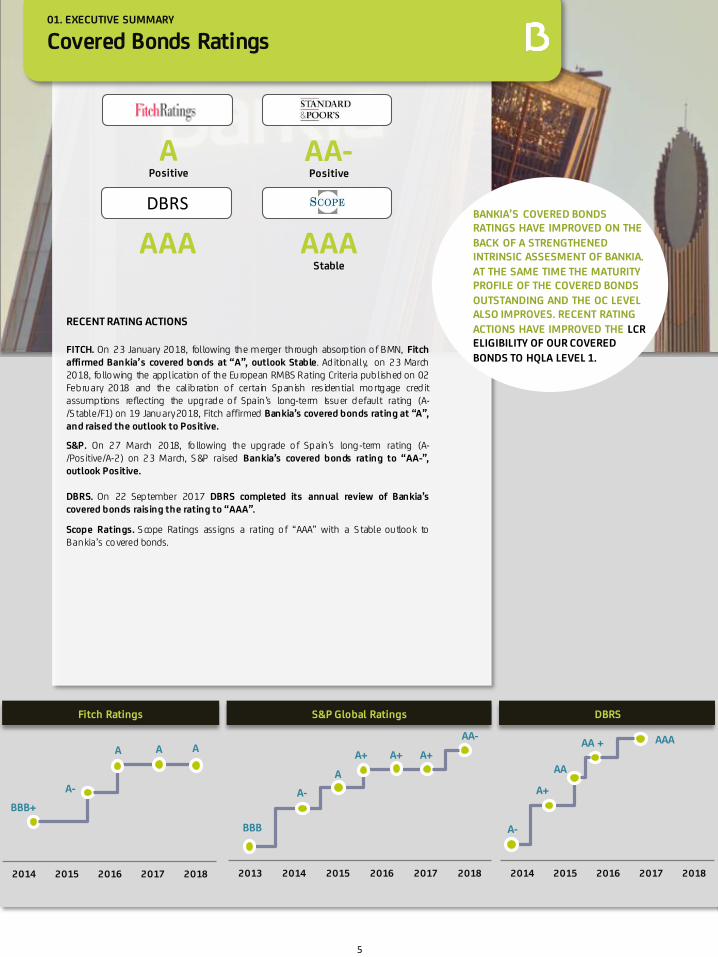
BANKIA’S COVERED BONDS RATINGS HAVE IMPROVED ON THE
BACK OF A STRENGTHENED INTRINSIC ASSESMENT OF BANKIA.
AT THE SAME TIME THE MATURITY PROFILE OF THE COVERED BONDS
OUTSTANDING AND THE OC LEVEL ALSO IMPROVES. RECENT RATING
ACTIONS HAVE IMPROVED THE LCR ELIGIBILITY OF OUR COVERED
BONDS TO HQLA LEVEL 1.
A+
AAA
2014 2015 2016 2017 2018
A AAA-
RECENT RATING ACTIONS
FITCH. On 23 January 2018, following the merger through absorption o f BMN, Fitchaffirmed Bankia’s covered bonds at “A”, outlook Stable. Ad itionally, on 23 March2018, fo llo wing the application of the European RMBS Rating Criteria published on 02February 2018 and the calibration o f certain Spanish res idential mo rtgage cred itassumptions reflecting the upgrade o f Spain’s long-term Issuer default rating (A-/S table/F1) on 19 January2018, Fitch affirmed Bankia’s covered bonds rating at “A”,and raised the outlook to Positive.
S&P. On 27 March 2018, fo llowing the upgrade o f Spain’s long-term rating (A-/Positive/A-2) on 23 March, S &P raised Bankia’s covered bonds rating to “AA-”,outlook Positive.
DBRS. On 22 September 2017 DBRS completed its annual review of Bankia’scovered bonds raising the rating to “AAA”.
Scope Ratings. S cope Ratings assigns a rating o f “AAA” with a S table outloo k toBankia’s co vered bonds.
6
0
10.000
20.000
30.000
40.000
50.000
60.000
70.000
80.000
90.000
Q1 Q2 Q3 Q4 Q1 Q2 Q3 Q4 Q1 Q2 Q3 Q4 Q1 Q2 Q3 Q4 Q1
Cartera Base Total Cédulas emitidas
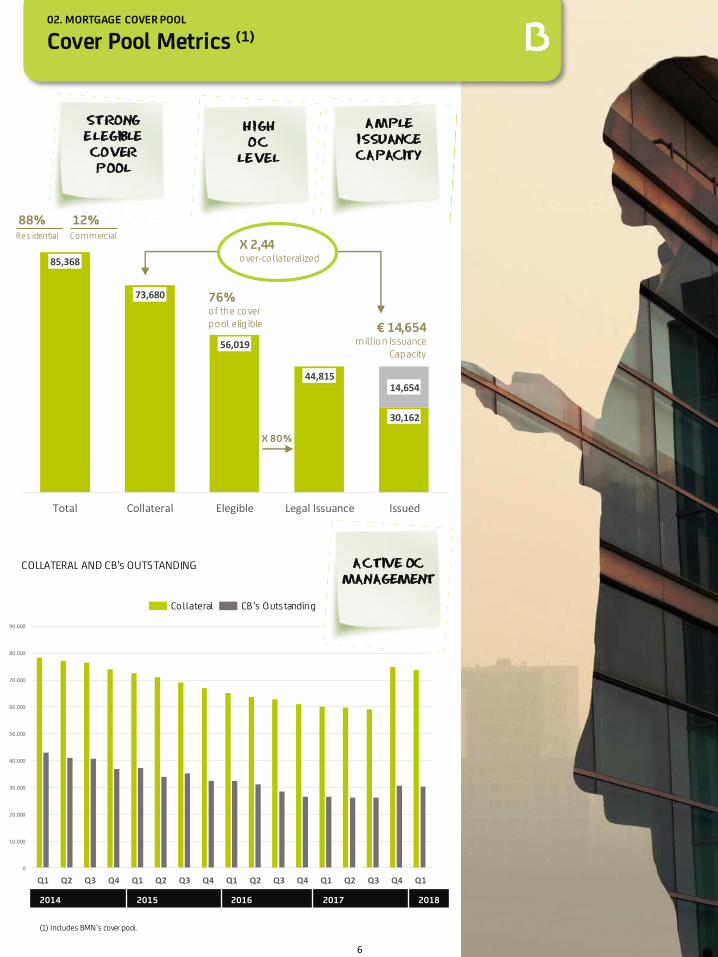
85,368
73,680
56,019
44,815
30,162
14,654
Total Collateral Elegible Legal Issuance Issued
02. MORTGAGE COVER POOL
Cover Pool Metrics (1)
AMPLE ISSUANCE CAPACITY
HIGHOC
LEVEL
STRONG ELEGIBLE COVER POOL
COLLATERAL AND CB’s OUTSTANDING
88%Res idential
12%Commercial
76% o f the co verpo ol elig ible € 14,654
millio n IssuanceCapacity
X 80%
2014 2015 2016 2017 2018
X 2,44 o ver-co llateralized
Co llateral CB’s Outstanding
ACTIVE OC MANAGEMENT
(1) Includes BMN`s cover pool.

7
02. MORTGAGE COVER POOL
Cover Pool Metrics (1)
Q1 2018 Q1 2017
Collateral Eligible Collateral Eligible
Outstanding (million €) 73,680 56,019 60,079 45,969
Number of loans 876,653 735,468 673,226 574,803
Number of debtors 795,549 674.367 605,719 529,085
Average S easoning (months) 102 110 94 104
Time to maturity (months) 239 224 244 233
Average LTV 59% 47% 58% 48%
Q1 2018 Q1 2017
Collateral Eligible Collateral Eligible
Residential 63,174 50,514 52.024 42.462
Co mmercial 10,506 5,505 8,055 3,507
COLLATERAL LTV DISTRIBUTION
NPL RATIO
83% OF THE COVER POOL
HAS A LTV RATIO BELOW
80%
NPL’S DECLINING TREND ALTERED BY THE MERGER WITH
BMN
2016 2017 2018
0
5.000
10.000
15.000
20.000
25.000
30.000
0-40% 40%-60% 60%-80% 80%-100% >100%
5,61% 5,48% 5,41% 5,35% 5,31%5,82%
Q4 Q1 Q2 Q3 Q4 Q1
(1) Includes BMN`s cover pool.

8
RESIDENTIAL PORTFOLIO
02. MORTGAGE COVER POOL
Residential Sub-Pool
RESIDENCIAL PORTFOLIO ELIGIBILITY
STANDS AT 79%
AVERAGE LTV OF THE
ELIGIBLE PORTFOLIO IS
49%
Q1 2018 Q1 2017
Collateral Eligible Collateral Eligible
O utstanding (million €) 63,174 50,514 52,024 42,462
Number of loans 821,432 699,232 634,688 548,106
Number of debtors 756,987 647,735 579,995 510,424
Average S easoning (months) 106 113 98 105
Time to maturity (months) 256 235 262 241
Average LTV 58.4% 48.7% 56.4% 49.2%
MATURITY DISTRIBUTION
GEOGRAPHIC DISTRIBUTION Collateral (€mn) Q1 2018
Madrid 17,240
C. Valenciana 9,798
Andalucía 8,840
Catalunya 7,773
Castilla La Mancha 2,736
Canarias 2,615
Castilla y León 2,105
Rest 12,067
87% LOANS FOR PRIMARY RESIDENCE
98% FIRST RANKED MORTGAGES
0
5.000
10.000
15.000
20.000
25.000
30.000
1-5 5-10 10-20 20-30 >30
27%
12%
16%4%
3%
4%
1%
1% 1%1%
1%1%
1%
14%
6%
7%

9
COMMERCIAL PORTFOLIO
RESTRICTIONS TO REAL ESTATE
LENDING IN RECENT YEARS
AVERAGE LTV OF THE ELIGIBLE COMMERCIAL
PORTFOLIO STANDS AT 36%
Q1 2018 Q1 2017
Collateral Eligible Collateral Eligible
O utstanding 10,507 5,506 8.055 3.508
Number of loans 55,221 36,236 38.538 26.697
Number of debtors 38,562 26,632 25.724 18.661
Average S easoning (months) 76 80 67 83
Time to maturity (months) 133 125 132 134
Average LTV 63,6 36,3 68,1% 36,7%
SPLIT BY INDUSTRY CODE
MATURITY DISTRIBUTION
02. MORTGAGE COVER POOL
Commercial Sub-Pool
Real Estate Building&
Materials
Business Services
Retail Food / Beverage/ Tobacco
Lodging/ Restaurants
ConsumerProducts
Healthcare Leisure / Entertainment
Utilities Farming/ Agricultural
Services
Others
21%
18%
12%9%
6%4% 3% 3% 3% 3% 3%
15%
0
500
1.000
1.500
2.000
2.500
3.000
3.500
4.000
4.500
1-5 5-10 10-20 20-30 >30

10
2.501 2.764 418
2.025
12.381
260 983
35
101
1.000
175
1.250
2018 2019 2020 2021 >2021
03. WHOLESALE MATURITIES
Wholesale Maturities Amortizing Profile
2,761 4,747 418 2,235 13,731
Amount Outstanding (€mn) 23,892
Covered Bonds (1) 20,088
Senior Debt 1,379
Subordinated debt 2,425
(1) No t including re ta ined covered bonds

11
04. ANNEXES
Macroeconomic Indicators
SPAIN SOVEREIGN DEBT RATING
LONG TERM OUTLOOK DATE
STANDARD & POOR’S
FITCH RATINGS
A- Positive Mar18
A- Stable Jan18
MOODY’S
DBRS
Baa1 Stable Apr18
A Stable Apr18
“GROWTH
CONSOLIDATION
”
“FAVOURABLE
EMPLOYMENT
TREND”
“HOUSEHOLD
SPENDING, MAIN
DRIVER OF THE
ECONOMY”
€
Sales (deflated and seasonally adjusted)
RETAIL TRADE INDEX (Annual Rate %)
UNEMPLOYMENT RATE IN SPAIN
QUARTERLY SERIES GDP. PREVIOUS QUARTER RATE (%)
0,2
0,5
1,1
1,7
2,3
1,7
0,7 0,61
-0,4
1,3
0,6
2,22 1,9
JAN17 FEB17 MAR17 APR17 MAY17 JUN17 JUL17 AUG17 SEP17 OCT17 NOV17 DIC17 ENE18 FEB18 MAR18
0,70,7
0,9
0,8
0,70,7
0,8
0,7
0,9
4T 20173T 20172T 20171T 20174T 20163T 20162T 20161T 20164T 2015
0%
5%
10%
15%
20%
25%
30%
1T 20184T 20173T 20172T 20171T 20174T 20163T 20162T 20161T 20164T 20153T 20152T 20151T 2015
12
04. ANNEX
Spanish Real Estate Market
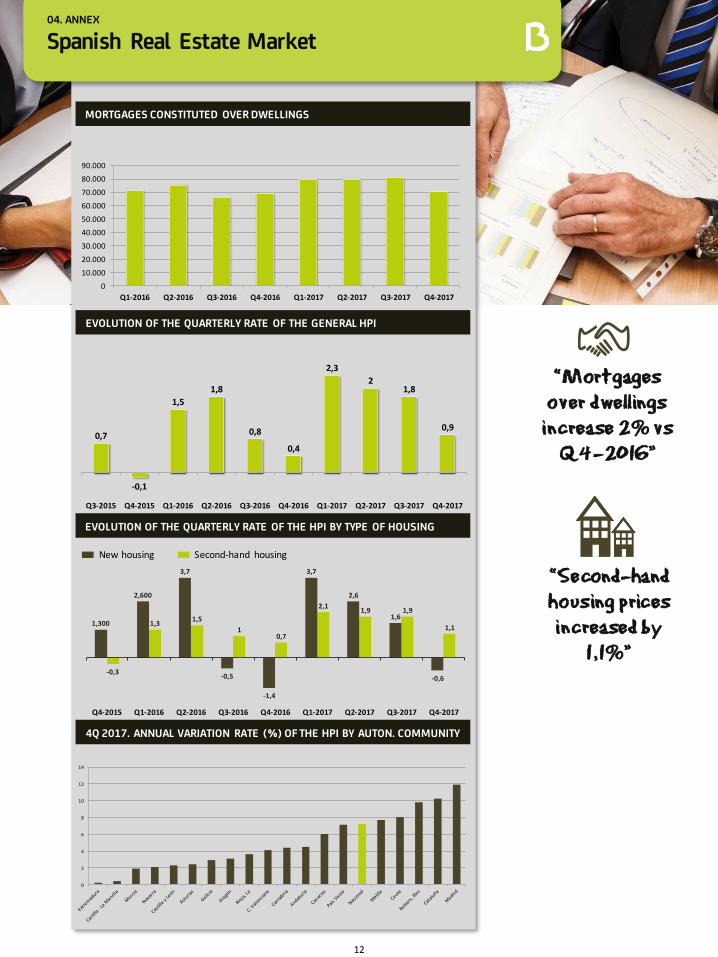
MORTGAGES CONSTITUTED OVER DWELLINGS
EVOLUTION OF THE QUARTERLY RATE OF THE GENERAL HPI
“Mortgages
over dwellings
increase 2% vs
Q4-2016”
“Second-hand
housing prices
increased by
1,1%”
EVOLUTION OF THE QUARTERLY RATE OF THE HPI BY TYPE OF HOUSING
1,1
1,91,92,1
0,71
1,51,3
-0,3-0,6
1,6
2,6
3,7
-1,4
-0,5
3,7
2,600
1,300
Q4-2017Q3-2017Q2-2017Q1-2017Q4-2016Q3-2016Q2-2016Q1-2016Q4-2015
0
2
4
6
8
10
12
14
4Q 2017. ANNUAL VARIATION RATE (%) OF THE HPI BY AUTON. COMMUNITY
New housing Second-hand housing
0
10.000
20.000
30.000
40.000
50.000
60.000
70.000
80.000
90.000
Q1-2016 Q2-2016 Q3-2016 Q4-2016 Q1-2017 Q2-2017 Q3-2017 Q4-2017
0,9
1,82
2,3
0,4
0,8
1,8
1,5
-0,1
0,7
Q4-2017Q3-2017Q2-2017Q1-2017Q4-2016Q3-2016Q2-2016Q1-2016Q4-2015Q3-2015

13