Embed Size (px)
Citation preview
58 B l u e C a r b o n S c i e n c e & P o l i c y : w i t h a P a r t i c u l a r R e f e r e n c e t o K a i m a n a , W e s t P a p u a

59B l u e C a r b o n S c i e n c e & P o l i c y : w i t h a P a r t i c u l a r R e f e r e n c e t o K a i m a n a , W e s t P a p u a
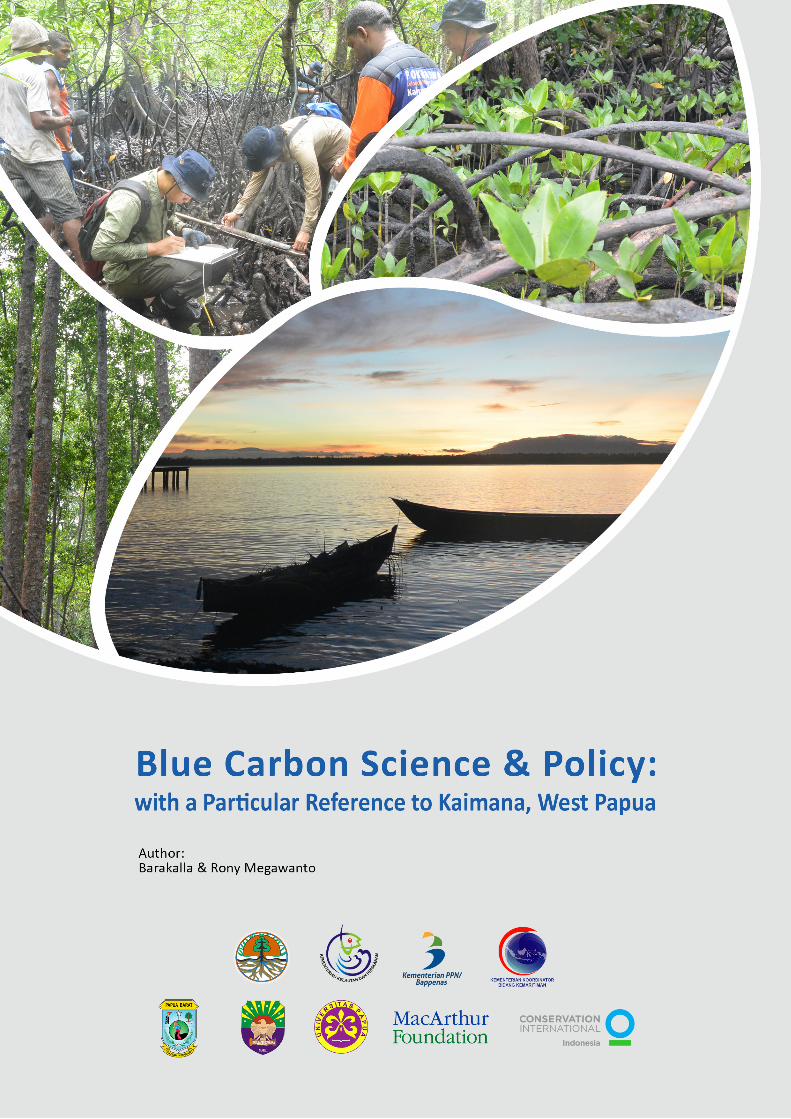
Cover Photos: © Anisa Pratiwi (Conservation International)
1B l u e C a r b o n S c i e n c e & P o l i c y : w i t h a P a r t i c u l a r R e f e r e n c e t o K a i m a n a , W e s t P a p u a
Blue Carbon Science & Policy:with a Particular Reference to Kaimana, West Papua
Author:Barakalla & Rony Megawanto
2 B l u e C a r b o n S c i e n c e & P o l i c y : w i t h a P a r t i c u l a r R e f e r e n c e t o K a i m a n a , W e s t P a p u a
AcknowledgementMinistry of Environment and Forestry, Republic of IndonesiaMinistry of Marine Affairs and Fisheries, Republic of IndonesiaMinistry of National Development Planning (Bappenas), Republic of IndonesiaCoordinating Ministry of Marritime Affairs, Republic of IndonesiaGovernment of Kaimana Regency, West Papua Balai Besar Konservasi Sumber Daya Alam Papua BaratUniversity of Papua (UNIPA) Institute of Marine Research and ObservationCenter for International Forestry Research (CIFOR) MacArthur FoundationConservation International
The Analysis was supported by Sigit Deni Sasmito and Jennifer Howard.This research was funded by MacArthur Foundation.A special thank you goes to Victor Nikijuluw and Jennifer Howard for the extensive review and comments.Valuable inputs and review also provided by Ketut Sarjana Putra, Daniel Murdiyarso and Emily Pidgeon.Our sincere gratitude to Kaimana government, Conservation International Kaimana Team, University of Papua team members, Institute of Marine Research and Observation.
Editors;
Chief Editors;Barakalla (Conservation International)Rony Megawanto (Conservation International).
Members;Ketut Sarjana Putra (Conservation International), Victor Nikijuluw (Conservation International), Iman Santoso (Conservation International), Emily Pidgeon (Conservation International), Jennifer Howard (Conservation International), Sigit Deni Sasmito (CIFOR / Charles Darwin University),Regina Nikijuluw (Conservation International), Dwiki Dewantoro (Conservation International), Anastasia Ramalo Sijabat (Conservation International), Ines Ayostina (Conservation International).
Contributors;Frida Sidik (Institute of Marine Research and Observation – Ministry of Marine and Fisheries), Nuryani Widagti (Institute of Marine Research and Observation – Ministry of Marine and Fisheries), Rina Jowei (University of Papua), Wolfram Y Mofu (University of Papua), Herry Kopalit (University of Papua), Hendri (University of Papua), Victor Simbiak (University of Papua), Alfredo Wanma (University of Papua), Ping Machmud (Conservation International), Irwan Pasambo (Conservation International), Sefrianto T Saleda (Conservation International), Annisa Pertiwi (Conservation International), Dortheus Rumere (Conservation International), Fini Lovita (Conservation International).
© Conservation International Indonesia, 2017
www.conservation.org
Reference for Citation;Barakalla & Megawanto.R, (2017) Blue Carbon Science and Policy : with particular reference to Kaimana, West Papua.
3B l u e C a r b o n S c i e n c e & P o l i c y : w i t h a P a r t i c u l a r R e f e r e n c e t o K a i m a n a , W e s t P a p u a
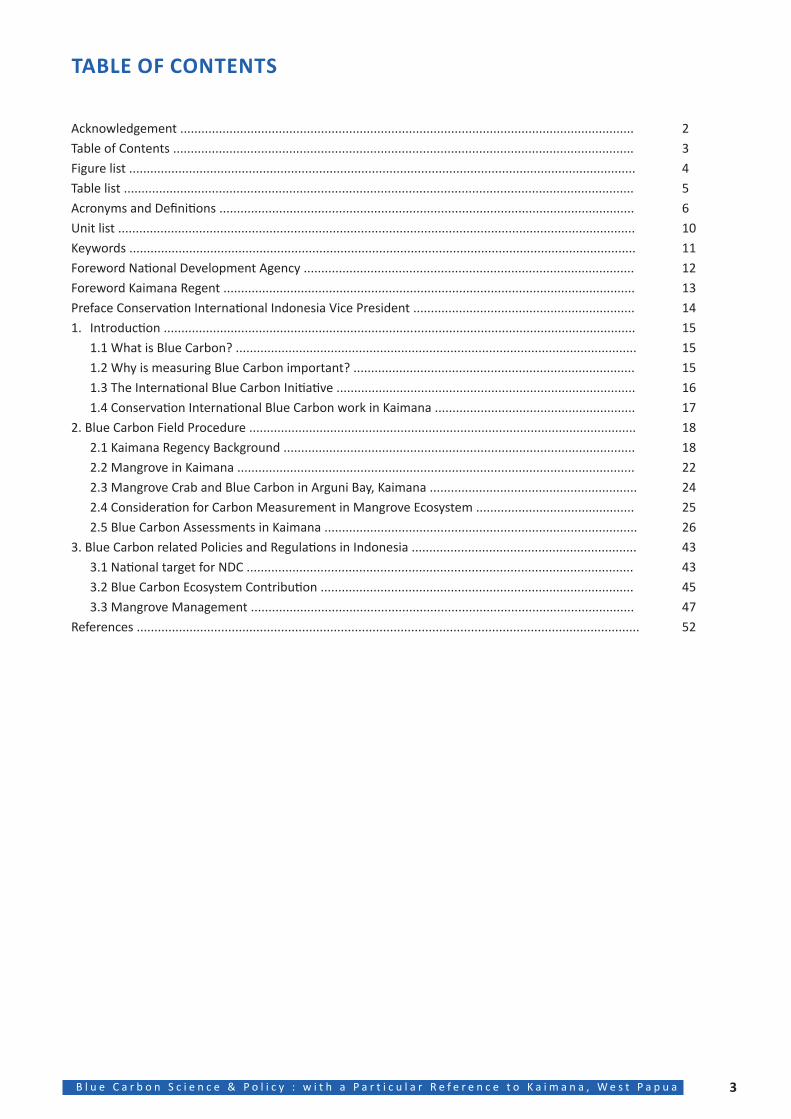
TABLE OF CONTENTS
Acknowledgement ................................................................................................................................. 2Table of Contents ................................................................................................................................... 3Figure list ................................................................................................................................................ 4Table list ................................................................................................................................................. 5Acronyms and Definitions ...................................................................................................................... 6Unit list ................................................................................................................................................... 10Keywords ................................................................................................................................................ 11Foreword National Development Agency .............................................................................................. 12Foreword Kaimana Regent ..................................................................................................................... 13Preface Conservation International Indonesia Vice President ............................................................... 141. Introduction ...................................................................................................................................... 15
1.1 What is Blue Carbon? .................................................................................................................. 151.2 Why is measuring Blue Carbon important? ................................................................................ 151.3 The International Blue Carbon Initiative ..................................................................................... 161.4 Conservation International Blue Carbon work in Kaimana ......................................................... 17
2. Blue Carbon Field Procedure .............................................................................................................. 182.1 Kaimana Regency Background .................................................................................................... 182.2 Mangrove in Kaimana ................................................................................................................. 222.3 Mangrove Crab and Blue Carbon in Arguni Bay, Kaimana ........................................................... 242.4 Consideration for Carbon Measurement in Mangrove Ecosystem ............................................. 252.5 Blue Carbon Assessments in Kaimana ......................................................................................... 26
3. Blue Carbon related Policies and Regulations in Indonesia ................................................................ 433.1 National target for NDC .............................................................................................................. 433.2 Blue Carbon Ecosystem Contribution ......................................................................................... 453.3 Mangrove Management ............................................................................................................. 47
References ............................................................................................................................................... 52
4 B l u e C a r b o n S c i e n c e & P o l i c y : w i t h a P a r t i c u l a r R e f e r e n c e t o K a i m a n a , W e s t P a p u a
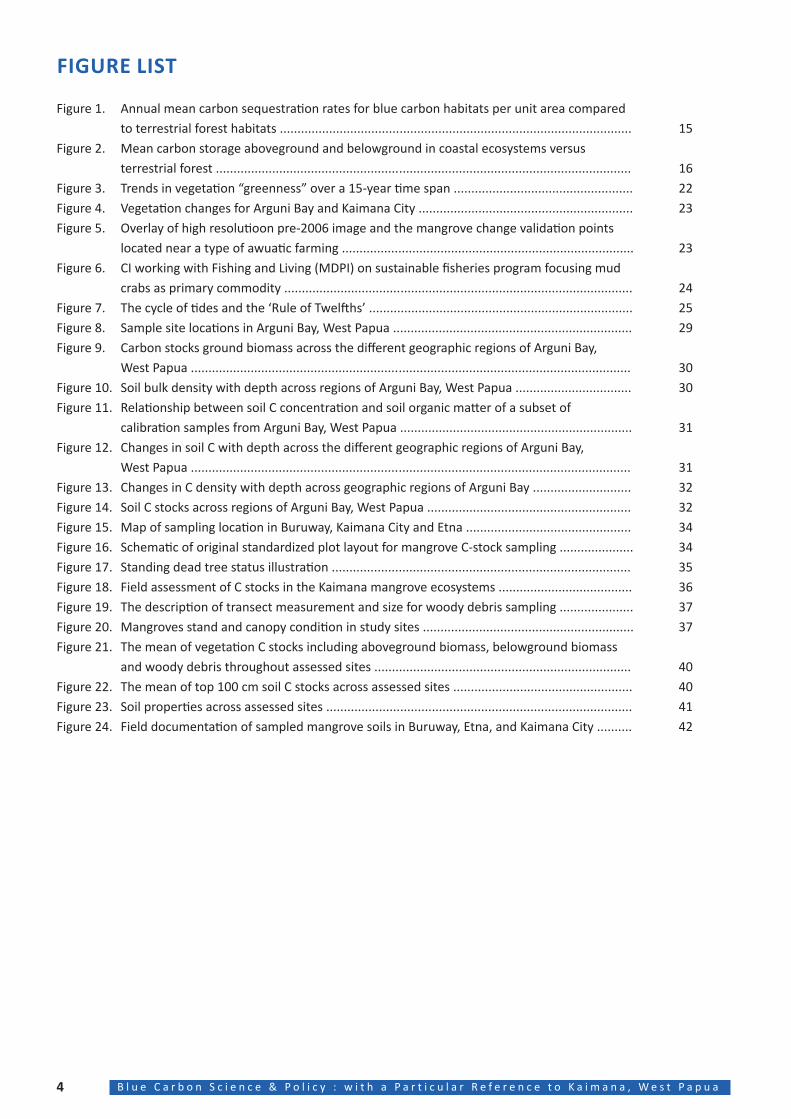
FIGURE LIST
Figure 1. Annual mean carbon sequestration rates for blue carbon habitats per unit area compared to terrestrial forest habitats .................................................................................................... 15Figure 2. Mean carbon storage aboveground and belowground in coastal ecosystems versus terrestrial forest ...................................................................................................................... 16Figure 3. Trends in vegetation “greenness” over a 15-year time span ................................................... 22Figure 4. Vegetation changes for Arguni Bay and Kaimana City ............................................................. 23Figure 5. Overlay of high resolutioon pre-2006 image and the mangrove change validation points located near a type of awuatic farming ................................................................................... 23Figure 6. CI working with Fishing and Living (MDPI) on sustainable fisheries program focusing mud crabs as primary commodity ................................................................................................... 24Figure 7. The cycle of tides and the ‘Rule of Twelfths’ ........................................................................... 25Figure 8. Sample site locations in Arguni Bay, West Papua .................................................................... 29Figure 9. Carbon stocks ground biomass across the different geographic regions of Arguni Bay, West Papua ............................................................................................................................. 30Figure 10. Soil bulk density with depth across regions of Arguni Bay, West Papua ................................. 30Figure 11. Relationship between soil C concentration and soil organic matter of a subset of calibration samples from Arguni Bay, West Papua .................................................................. 31Figure 12. Changes in soil C with depth across the different geographic regions of Arguni Bay, West Papua ............................................................................................................................. 31Figure 13. Changes in C density with depth across geographic regions of Arguni Bay ............................ 32Figure 14. Soil C stocks across regions of Arguni Bay, West Papua .......................................................... 32Figure 15. Map of sampling location in Buruway, Kaimana City and Etna ............................................... 34Figure 16. Schematic of original standardized plot layout for mangrove C-stock sampling ..................... 34Figure 17. Standing dead tree status illustration ..................................................................................... 35Figure 18. Field assessment of C stocks in the Kaimana mangrove ecosystems ...................................... 36Figure 19. The description of transect measurement and size for woody debris sampling ..................... 37Figure 20. Mangroves stand and canopy condition in study sites ............................................................ 37Figure 21. The mean of vegetation C stocks including aboveground biomass, belowground biomass and woody debris throughout assessed sites ......................................................................... 40Figure 22. The mean of top 100 cm soil C stocks across assessed sites ................................................... 40Figure 23. Soil properties across assessed sites ....................................................................................... 41Figure 24. Field documentation of sampled mangrove soils in Buruway, Etna, and Kaimana City .......... 42
5B l u e C a r b o n S c i e n c e & P o l i c y : w i t h a P a r t i c u l a r R e f e r e n c e t o K a i m a n a , W e s t P a p u a
TABLE LIST
Table 1. Estimates of carbon released by land-use change in coastal ecosystems globally and associated economic impacts .................................................................................................. 17Table 2. Mangrove extent and deforestation (2006-2016) in Kaimana ................................................. 17Table 3. Kaimana regency population density ....................................................................................... 18Table 4. Kaimana tribe population ......................................................................................................... 18Table 5. Crops plantation in Kaimana .................................................................................................... 20Table 6. Livestock in Kaimana ................................................................................................................ 20Table 7. Destructive fishing activities in Kaimana .................................................................................. 21Table 8. Carbon stock analysis for the Kaimana Regency ...................................................................... 26Table 9. Carbon stock analysis for project subsites ............................................................................... 27Table 10. Site gps coordinates and geographic region within Arguni Bay, West Papua ........................... 28Table 11. Basal area of mangrove stands across regions of Arguni Bay, West Papua .............................. 29Table 12. Basal area and relative dominance of mangrove species across Arguni Bay, West Papua ....... 29Table 13. Carbon stocks pool across regions of Arguni Bay ..................................................................... 32Table 14. Summary of data and sample collection for mangrove C-stock assessment ............................ 35Table 15. List of species composition and vegetation type throughout all sites in Kaimana Regency, West Papua .............................................................................................................................. 38Table 16. Important value index (Iv) of mangrove tree species across sampling sites in Kaimana Regency, West Papua ................................................................................................. 39Table 17. The summary of forest structure, site condition and organic soil depth ................................. 40Table 18. Projected BAU and greenhouse gas emission reduction from each sector category ............... 44
6 B l u e C a r b o n S c i e n c e & P o l i c y : w i t h a P a r t i c u l a r R e f e r e n c e t o K a i m a n a , W e s t P a p u a
ACRONYMS AND DEFINITIONS
AAFOLU Agriculture, Forestry and Other Land UseArcView ArcGIS Software that is used within the approach for spatial analysis needsATM (Indonesian) Ayo Tanam Mangrove MMAF program for Mangrove
BB BiomassBAU Business As UsualBappenas National Planning Agency (Indonesia)BD Bulk densityBetatas (native Papuan) PotatoBIG (Indonesian) Badan Informasi Geospasial Geospatial Information AgencyBMKG (Indonesian) Badan Meteorologi, Klimatologi dan Geofisika Meteorology, Climatology and Geophysics AgencyBwN Building with Nature
CC CarbonCaCO3 Calcium carbonateCDM Clean Development MechanismCGIAR Consultative Group on International Agricultural ResearchCHN analyzer Elemental analyzer of mainly carbon, hydrogen and nitrogenCI Confidence IntervalCI Conservation InternationalCIFOR Center for International Forestry ResearchCO2 Carbon DioxideCOP Conference of the PartiesCorg Organic Carbon
DD DiameterDAS (Indonesian) Daerah Aliran Sungai WatershedD30 Mainstem diameter at 30 cm heightDbase Mainstem basal diameterDBD Dry Bulk Densitydbh Diameter at Breast HeightDEM Digital Elevation MapsDIC Dissolved Inorganic CarbonDmax Mainstem maximum diameter of sampled treesDtop Mainstem top diameter
Eeq EquivalentESRI Environmental Systems Research Institute
FFAO Food and Agriculture OrganizationsFIP Fisheries Improvement Project
7B l u e C a r b o n S c i e n c e & P o l i c y : w i t h a P a r t i c u l a r R e f e r e n c e t o K a i m a n a , W e s t P a p u a
GGHG Greenhouse GasGIS Geographic Information SystemGPS Global Positioning System
HH HydrogenH2O2 Hydrogen peroxideHCl Hydrogen chlorideHmax Maximum HeightHGU (Indonesian) Hak Guna Usaha The right to use a land / concession by National law
IID Identity Document, IdentifierIMRO Institute of Marine Research and Observation (BROL KKP)INCAS Indonesian national Carbon Accounting SystemIOC Intergovernmental Oceanographic CommissionIPB (Indonesian) Institute Pertanian Bogor Bogor Agriculture InstituteIPCC Intergovernmental Panel on Climate ChangeIUCN International Union for Conservation of NatureIv Important Value Index
KKampung (Indonesian) VillageKKMTN (Indonesian) Kelompok Kerja Mangrove Tingkat Nasional National Mangrove Working GroupKKP Agency for Research and Development of Marine and Fisheries (Baltitbang KP), Indonesia
LLAPAN (Indonesian) Lembaga Penerbangan dan Antariksa Nasional National Institute of Aeronautics and SpaceLIPI (Indonesian) Lembaga Ilmu Pengetahuan Indonesia Indonesian Institute of Scienceln Natural LogarithmLOI Loss on Ignition
MMFF Mangrove for the FutureMH SET marker horizonMoEF Ministry of Environment and Forestry (Indonesia)MMAF Ministry of Marine Affairs and Fisheries (Indonesia)MPA Marine Protected Areas
Nn Number of subsamplesN NitrogenN2 DinitrogenN2O Nitrous oxideNASA National Aeronautics and Space AdministrationND No DataNDC Nationally Determined ContributionNDVI Normalized Difference Vegetation Index
8 B l u e C a r b o n S c i e n c e & P o l i c y : w i t h a P a r t i c u l a r R e f e r e n c e t o K a i m a n a , W e s t P a p u a
OO OxygenOM Organic Matter
PPDPT (Indonesian) Pengembangan Desa Pesisir Tangguh Coastal Development Programρ Wood densityPALSAR Phased Array L band Synthetic Aperture RadarPpt Part Per ThousandsPVC Polyvinyl chloride
RR2 Coefficient of determinationRAN GRK (Indonesian) Rencana Aksi Nasional Gas Rumah Kaca National Action Plan GHGREDD Reducing Emissions from Deforestation and Forest DegradationRHL (Indonesian) Rehabilitasi Hutan dan Lahan Forest and Land RehabilitationRp Rupiah (Indonesian currency)RTRW (Indonesian) Rencana tata Ruang Wilayah Regional Spatial Plan
SSD Standard DeviationSET Surface Elevation TableSNPEM (Indonesian) Strategi Nasional Pengelolaan Ekosistem Mangrove National Strategy for Mangrove Ecosystem ManagementSOM Soil Organic MatterSp (biological term) Species
TTambaks Aquaculture as a threat to mangrove ecosystem.T TempertureT1 Initial AssessmentT2 Subsequent Assessmentsth Tree Height
UUNEP United Nations Environment ProgrammeUNESCO United Nations Educational Scientific and Cultural OrganizationUNFCCC United Nations Framework Convention on Climate ChangeUNIPA University of PapuaUSD United States dollarUSGS US Geological Survey
VVCS Verified Carbon Standard
9B l u e C a r b o n S c i e n c e & P o l i c y : w i t h a P a r t i c u l a r R e f e r e n c e t o K a i m a n a , W e s t P a p u a
UNIT LIST
atmos AtmosphereºC Degree Celsiuscm Centimetercm3 Cubic centimeterh Hourha Hectareg GramGtCO2e Giga ton Carbon dioxide equivalentkg KilogramL Literm Meterm2 Square meter m3 Cubic meter Mg Megagrammg Milligrammm milimetermin MinutemL Millilitermol Mole% Percentπ Mathematical constant, the ratio of a circle’s circumference to its diameter, approximately equal to 3.14159$ Dollarσ Standard deviationt Metric ton
10 B l u e C a r b o n S c i e n c e & P o l i c y : w i t h a P a r t i c u l a r R e f e r e n c e t o K a i m a n a , W e s t P a p u a
KEYWORDS
Active Remote Sensing – A remote-sensing system, such as radar, that produces electromagnetic radiation and measures its reflection back from a surface.
Activity Data – Geographical data showing the types of land coverage and use in a given area.
Allochthonous Carbon – Carbon produced in one location and deposited in another. In the context of blue carbon systems, this type of carbon results from the hydrodynamic environment in which they are found where sediments and associated carbon is transported from neighboring ecosystems (offshore and terrestrial).
Allometric Equations – Allometric equations establish quantitative relationships between key characteristics that are easy to measure (i.e., stem height/diameter) and other properties that are often more difficult to assess (i.e., biomass).
Autochthonous Carbon – Carbon produced and deposited in the same location. In the context of blue carbon systems, this type of carbon results from vegetation uptake of CO2 from the ocean and/or atmosphere that gets converted for use by plant tissue and decomposes into the surrounding soil.
Blue Carbon – The carbon stored in mangroves, tidal salt marshes, and seagrass meadows within the soil, the living biomass above ground (leaves, branches, stems), the living biomass below ground (roots), an the non-living biomass (litter and dead wood).
Carbon Inventory – A carbon inventory is an accounting of carbon gains and losses emitted to or removed from the atmosphere/ocean over a period of time. Policy makers use inventories to establish a baseline for tracking emission trends, developing mitigation strategies and policies, and assessing progress
Carbon Pool – Carbon pools refer to carbon reservoirs such as soil, vegetation, water, and the atmosphere that absorb and release carbon. Together carbon pools make up a carbon stock.
Carbon Stock – A carbon stock is the total amount of organic carbon stored in a blue carbon ecosystem of a known size. A carbon stock is the sum of one or more carbon pools. Emission Factors – A term used to describe changes in the carbon content of a pre-defined area due to change in land coverage and use (i.e., conversion from mangroves to shrimp ponds) or changes within a land use type (i.e., nutrient enrichment of seagrass).
Gain-loss Method – This method estimates the difference in carbon stocks based on emissions factors for specific activities (e.g., plantings, drainage, rewetting, deforestation) derived from the scientific literature and country activity data and results in Tier 1 and 2 estimates.
Inorganic Soil Carbon – The term soil inorganic carbon refers to the carbon component of carbonates (i.e., calcium carbonate) and can be found in coastal soils in the form of shellsand/or pieces of coral.
IPCC Tiers – The IPCC has identified three tiers of detail in carbon inventories that reflect the degrees of certainty or accuracy of a carbon stock inventory (assessment).
Tier 1 – Tier 1 assessments have the least accuracy and certainty and are based on simplified assumptions and published IPCC default values for activity data and emissions factors. Tier 1 assessments may have a large error range of +/- 50% for aboveground pools and +/- 90% for the variable soil carbon pools.Tier 2 – Tier 2 assessments include some country or site-specific data and hence have increased accuracy and resolution. For example, a country may know the mean carbon stock for different ecosystem types within the country.
11B l u e C a r b o n S c i e n c e & P o l i c y : w i t h a P a r t i c u l a r R e f e r e n c e t o K a i m a n a , W e s t P a p u a
Tier 3 – Tier 3 assessments require highly specific data of the carbon stocks in each component ecosystem or land use area, and repeated measurements of key carbon stocks through time to provide estimates of change or flux of carbon into or out of the area. Estimates of carbon flux can be provided through direct field measurements or by modeling.
Kaimana – A regency in West Papua, wchich holds 76,000 Ha of mangrove ecosystem. And where the blue carbon project is conducted as well as the fisheries improvement project.
Mangrove – A mangrove is a tree, shrub, palm or ground fern, generally exceeding one half meter in height that normally grows above mean sea level in the intertidal zone of marine coastal environments and estuarine margins. A mangrove is also the tidal habitat comprising such trees and shrubs.
Passive Remote Sensing – A remote-sensing system, such as an aerial photography imaging system, that only detects energy naturally reflected or emitted by an object.
Resolution – In remote sensing resolution of an image is an indication of its potential detail, where the smaller the pixel the higher the detail. In other words, 250 meters resolution data could identify any earthly feature that is 250 meters by 250 meters (useful for mapping ecosystem extent). Higher resolution data, such as 30 meters can be used to monitor in more detail (useful for identifying encroachment by aquaculture).
Soil Organic Carbon – The term soil organic carbon refers to the carbon component of the soil organic matter. The amount of soil organic carbon depends on soil texture, climate, vegetation and historical and current land use/management.
Soil Organic Matter – The term soil organic matter is used to describe the organic constituents in the soil (undecyed tissues from dead plants and animals, products produced as these decompose and the soil microbial biomass).
Stratification – A technique used to divide large heterogeneous sites (which require manysamples to account for variation) into smaller more homogeneous areas (where fewer samplesare needed) and is also useful when field conditions, logistical issues, and resource limitationsprevent dense sampling regimes
12 B l u e C a r b o n S c i e n c e & P o l i c y : w i t h a P a r t i c u l a r R e f e r e n c e t o K a i m a n a , W e s t P a p u a
FOREWORDDirector of Marine Affairs and Fisheries of Indonesian National Development Planning Agency
I’m very grateful for the publication of this study report. In addition to comprehensive data, it offers a district-level approach that provides a greater insight into the natural wealth of our country. Unlike other smaller scope studies, this report is the first developed by our partner to examine the full extent of district-level potentials.
Mangrove is an ecosystem with many beneficial functions and services, one of which is climate change mitigation and adaptation. Indonesia has the largest mangrove population in the world – nearly a quarter of the world’s mangroves. For this reason, our mangroves play a major role in mitigating global warming and sequestering carbon as one of the global warming contributors.
Blue carbon is a term coined to describe the ecosystem services offered by mangroves. Other blue carbon contributors include seagrass meadows and tidal marshes. Recognizing the importance of blue carbon in climate change mitigation and adaptation, 50 countries are committed to the initiative under the Paris Agreement, and follow-through at both global and national levels has become a priority.
In terms of national program plans and directions, blue carbon is central to climate change mitigation and adaptation efforts. Furthermore, the fact that almost 60% of Indonesia’s population lives in and depends their livelihoods on coastal areas, which are home to mangrove ecosystem, places blue carbon as a key aspect in promoting coastal community welfare in Indonesia. The government will monitor and support the aligning of mangrove-related programs and blue carbon initiatives, which will then be translated into grassroot-level programs.
Going forward, we are envisioning a link and alignment between blue carbon and the Nationally Determined Contribution (NDC) as well as the Sustainable Development Goals (SDGs). Under the NDC, blue carbon contributes to potential carbon storage that supports efforts to achieve reduced greenhouse gas emissions, in which a 17.2% target is set for the forestry sector to secure potential carbon deposits in blue carbon ecosystems. Under the SDGs, blue carbon is included as SDG 13 for climate change and SDG 14 for ocean health.
I congratulate and thank Conservation International Indonesia for publishing this book, Blue Carbon Science & Policy : with a Particular Reference to Kaimana, West Papua. This report will serve as our collective source and reference for blue carbon approach, both in terms of science and research as well as policy and regulation.
Ir. R . Anang Noegroho Setyo Moeljono, M.E.MDirector of Marine Affairs and FisheriesNational Development Planning Agency
13B l u e C a r b o n S c i e n c e & P o l i c y : w i t h a P a r t i c u l a r R e f e r e n c e t o K a i m a n a , W e s t P a p u a
FOREWORDHead of Kaimana District
Global warming has long been a hot-button issue both nationally and globally. Indonesia has also made various efforts to mitigate and adapt to global warming. One that is starting to gain prominence is Blue Carbon.
Kaimana District covers more than 70 thousand hectares of mangrove forests with tremendous potential natural resources, which we, the locals, try very hard to protect. To conserve the environment, the Papuans maintain their own local wisdoms, such as sasi and hak ulayat, which are passed down for generations from the ancestors. Today, those local wisdoms are being reinforced with the support from Conservation International. On the other hand, the local government has also been trying to formulate local regulations that encourage environmental conservation, including for mangroves and the surrounding waters, to ensure sustainable and equitable distribution of welfare for Kaimana people.
National and local policies need to work in synergy to help Indonesia achieve its national commitment under the Paris Agreement, and also improve public welfare. For this purpose, Kaimana District is ready to become a National Blue Carbon Field Laboratory to support Indonesia’s national ambition. Since 70% of the people of Kaimana live in coastal areas, they heartily agree that mangroves need to be protected as an important source of livelihoods.
This document represents initiatives and collaborations of different stakeholders since 2014 to explore potentials of mangroves in Kaimana, West Papua. We hope this document can positively contribute to sustainable national management of Blue Carbon. Kaimana District is more than ready to become a model for other regions in Indonesia in the management of Blue Carbon, which offers enormous benefits to the local, national, and global communities.
Drs. Mathias MairumaHead of Kaimana District, West Papua
14 B l u e C a r b o n S c i e n c e & P o l i c y : w i t h a P a r t i c u l a r R e f e r e n c e t o K a i m a n a , W e s t P a p u a
First of all, we’d like to thank all contributors who have been involved and supported the writing of this book, Blue Carbon Science & Policy : with a Particular Reference to Kaimana, West Papua. As part of the Blue Carbon program initiative undertaken by Conservation International (CI) Indonesia, this book provides an overview of blue carbon
ecosystems (particularly mangroves), CI Indonesia programs in Kaimana, and blue carbon-related policies.
Since launching the initiative in 2014, as a scientific organization, CI has always been relying on scientific data when formulating policy recommendations and program plans. Under this program, mangrove conservation is part of a three-pronged integrated approach: natural resources conservation, improved governance and policy support, and alternative community economic empowerment; to creating model blue carbon ecosystem management in Indonesia.
This study is the first to base its research on regional jurisdiction and has managed to provide an overview of comprehensive carbon stock accounting (that includes below- and above-ground carbon). The study was conducted in four locations to attempt to obtain a comprehensive description of district-level data. Further reading of this book will confirm the importance of mangroves for Indonesia, especially towards meeting the National Determined Contribution target set by the government in the forestry sector.
Besides lending significant benefits to conservation target, CI Indonesia has proven firsthand the economic benefits of mangrove conservation from mud crab farming. This serves as another valid proof for “mutualistic symbiosis between conservation and economy”, and an important consideration for policymakers at various levels when developing model mangrove management in Indonesia.
We sincerely hope this book can serve as a scientific reference for improved mangrove conservation management, and specifically as a reference for blue carbon ecosystem positioning in the Government of Indonesia’s national strategy for climate change mitigation and adaptation.
Ketut Sarjana PutraVice PresidentConservation International Indonesia
PREFACE Vice President Conservation International Indonesia
15B l u e C a r b o n S c i e n c e & P o l i c y : w i t h a P a r t i c u l a r R e f e r e n c e t o K a i m a n a , W e s t P a p u a
1.1 WHAT IS BLUE CARBON?The coastal ecosystems of mangroves, tidal marshes, and
seagrass meadows provide numerous benefits and services
that are essential for climate change adaptation along
coasts globally, including protection from storms and sea
level rise, prevention of shoreline erosion, regulation of
coastal water quality, provision of habitat for commercially
important fisheries and endangered marine species, and
food security for many coastal communities. Additionally,
these ecosystems sequester and store significant amounts
of coastal blue carbon from the atmosphere and ocean and
hence are now recognized for their role in mitigating climate
change.
Despite these benefits and services, coastal blue carbon
ecosystems are some of the most threatened ecosystems
on Earth, with an estimated 340,000 to 980,000 hectares
being destroyed each year. It is estimated that up to 67% and
at least 35% and 29% of the global coverage of mangroves
tidal marshes and seagrass meadows respectively have
been lost. If these trends continue at current rates, a
further 30–40% of tidal marshes and seagrasses and
nearly all unprotected mangroves could be lost in the next
100 years. When degraded or lost, these ecosystems can
become significant sources of the greenhouse gas carbon
dioxide.
Blue Carbon provides a new opportunity for motivating and
supporting coastal ecosystem conservation (restoration
and protection) globally, and hence for sustaining the
multiple benefits these ecosystems provide. Conservation
and restoration of these coastal ecosystems has been
increasingly addressed in international and national
climate change mitigation policy and finance mechanisms.
However, to date, countries have not incorporated coastal
blue carbon into their portfolio of climate change mitigation
or coastal management policies and actions.
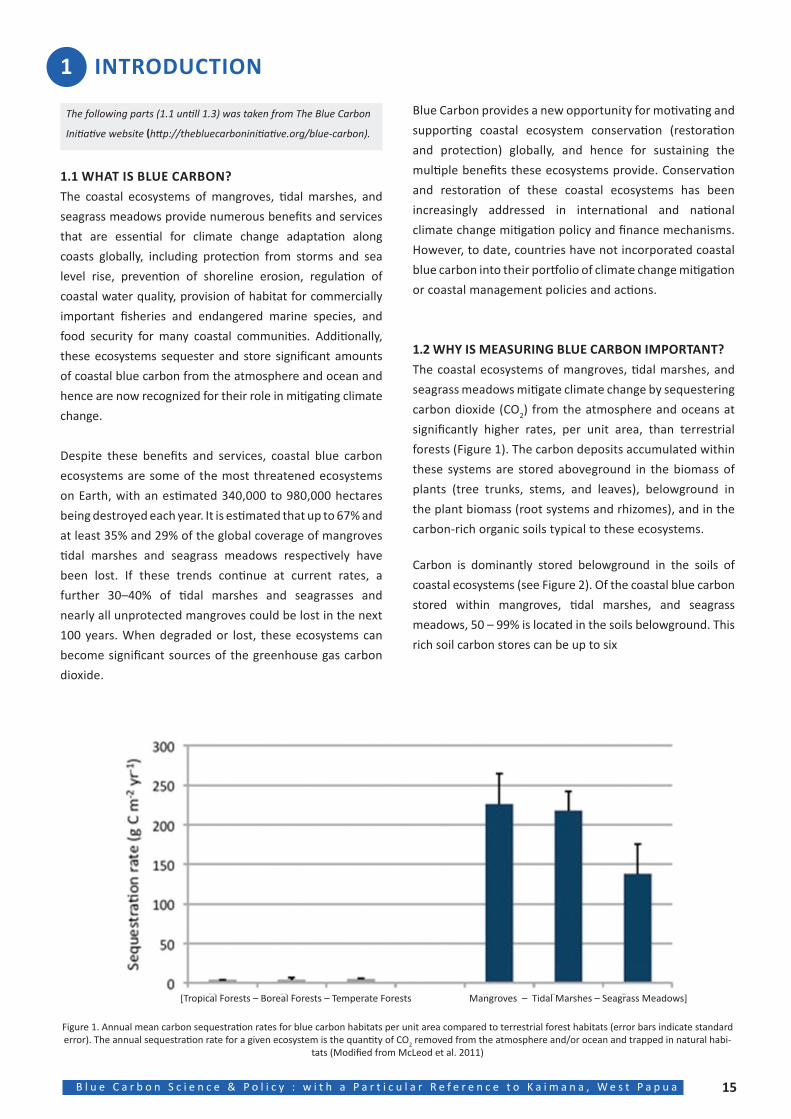
1.2 WHY IS MEASURING BLUE CARBON IMPORTANT?The coastal ecosystems of mangroves, tidal marshes, and
seagrass meadows mitigate climate change by sequestering
carbon dioxide (CO2) from the atmosphere and oceans at
significantly higher rates, per unit area, than terrestrial
forests (Figure 1). The carbon deposits accumulated within
these systems are stored aboveground in the biomass of
plants (tree trunks, stems, and leaves), belowground in
the plant biomass (root systems and rhizomes), and in the
carbon-rich organic soils typical to these ecosystems.
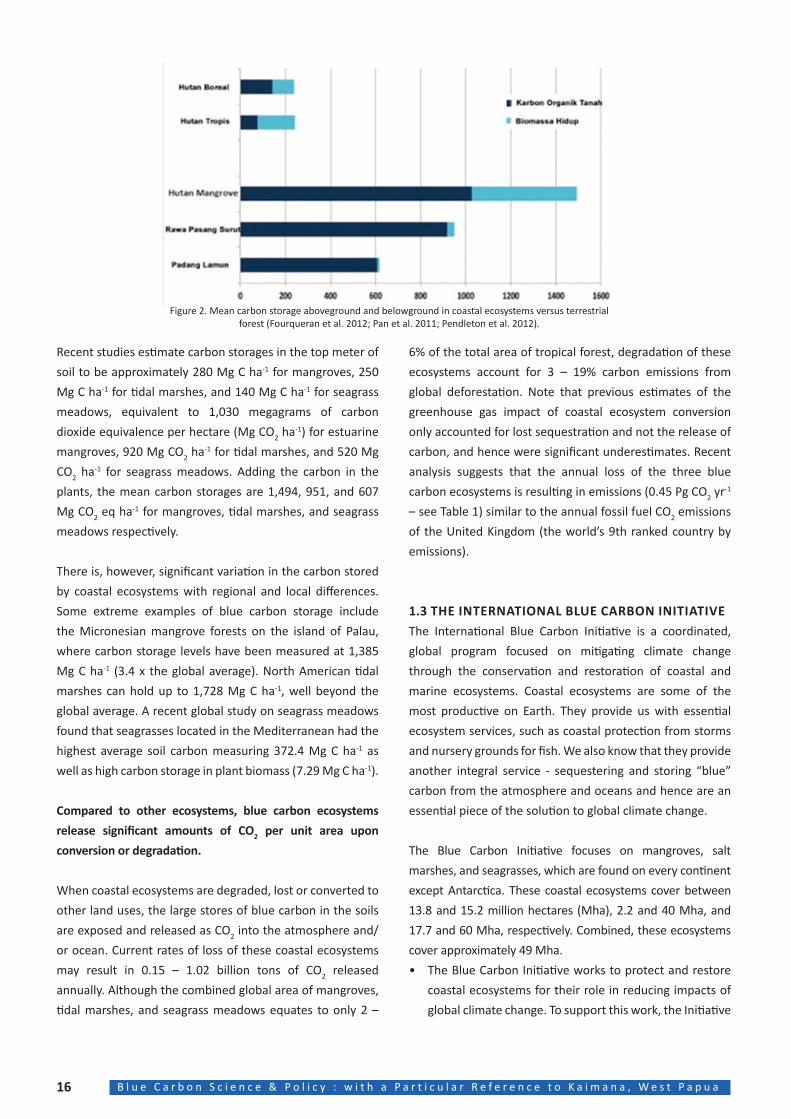
Carbon is dominantly stored belowground in the soils of
coastal ecosystems (see Figure 2). Of the coastal blue carbon
stored within mangroves, tidal marshes, and seagrass
meadows, 50 – 99% is located in the soils belowground. This
rich soil carbon stores can be up to six
Figure 1. Annual mean carbon sequestration rates for blue carbon habitats per unit area compared to terrestrial forest habitats (error bars indicate standard error). The annual sequestration rate for a given ecosystem is the quantity of CO2 removed from the atmosphere and/or ocean and trapped in natural habi-
tats (Modified from McLeod et al. 2011)
[Tropical Forests – Boreal Forests – Temperate Forests Mangroves – Tidal Marshes – Seagrass Meadows]
1 INTRODUCTION
The following parts (1.1 untill 1.3) was taken from The Blue Carbon
Initiative website (http://thebluecarboninitiative.org/blue-carbon).
16 B l u e C a r b o n S c i e n c e & P o l i c y : w i t h a P a r t i c u l a r R e f e r e n c e t o K a i m a n a , W e s t P a p u a
Recent studies estimate carbon storages in the top meter of
soil to be approximately 280 Mg C ha-1 for mangroves, 250
Mg C ha-1 for tidal marshes, and 140 Mg C ha-1 for seagrass
meadows, equivalent to 1,030 megagrams of carbon
dioxide equivalence per hectare (Mg CO2 ha-1) for estuarine
mangroves, 920 Mg CO2 ha-1 for tidal marshes, and 520 Mg
CO2 ha-1 for seagrass meadows. Adding the carbon in the
plants, the mean carbon storages are 1,494, 951, and 607
Mg CO2 eq ha-1 for mangroves, tidal marshes, and seagrass
meadows respectively.
There is, however, significant variation in the carbon stored
by coastal ecosystems with regional and local differences.
Some extreme examples of blue carbon storage include
the Micronesian mangrove forests on the island of Palau,
where carbon storage levels have been measured at 1,385
Mg C ha-1 (3.4 x the global average). North American tidal
marshes can hold up to 1,728 Mg C ha-1, well beyond the
global average. A recent global study on seagrass meadows
found that seagrasses located in the Mediterranean had the
highest average soil carbon measuring 372.4 Mg C ha-1 as
well as high carbon storage in plant biomass (7.29 Mg C ha-1).
Compared to other ecosystems, blue carbon ecosystems
release significant amounts of CO2 per unit area upon
conversion or degradation.
When coastal ecosystems are degraded, lost or converted to
other land uses, the large stores of blue carbon in the soils
are exposed and released as CO2 into the atmosphere and/
or ocean. Current rates of loss of these coastal ecosystems
may result in 0.15 – 1.02 billion tons of CO2 released
annually. Although the combined global area of mangroves,
tidal marshes, and seagrass meadows equates to only 2 –
Figure 2. Mean carbon storage aboveground and belowground in coastal ecosystems versus terrestrial forest (Fourqueran et al. 2012; Pan et al. 2011; Pendleton et al. 2012).
6% of the total area of tropical forest, degradation of these
ecosystems account for 3 – 19% carbon emissions from
global deforestation. Note that previous estimates of the
greenhouse gas impact of coastal ecosystem conversion
only accounted for lost sequestration and not the release of
carbon, and hence were significant underestimates. Recent
analysis suggests that the annual loss of the three blue
carbon ecosystems is resulting in emissions (0.45 Pg CO2 yr-1
– see Table 1) similar to the annual fossil fuel CO2 emissions
of the United Kingdom (the world’s 9th ranked country by
emissions).
1.3 THE INTERNATIONAL BLUE CARBON INITIATIVEThe International Blue Carbon Initiative is a coordinated,
global program focused on mitigating climate change
through the conservation and restoration of coastal and
marine ecosystems. Coastal ecosystems are some of the
most productive on Earth. They provide us with essential
ecosystem services, such as coastal protection from storms
and nursery grounds for fish. We also know that they provide
another integral service - sequestering and storing “blue”
carbon from the atmosphere and oceans and hence are an
essential piece of the solution to global climate change.
The Blue Carbon Initiative focuses on mangroves, salt
marshes, and seagrasses, which are found on every continent
except Antarctica. These coastal ecosystems cover between
13.8 and 15.2 million hectares (Mha), 2.2 and 40 Mha, and
17.7 and 60 Mha, respectively. Combined, these ecosystems
cover approximately 49 Mha.
• The Blue Carbon Initiative works to protect and restore
coastal ecosystems for their role in reducing impacts of
global climate change. To support this work, the Initiative
17B l u e C a r b o n S c i e n c e & P o l i c y : w i t h a P a r t i c u l a r R e f e r e n c e t o K a i m a n a , W e s t P a p u a
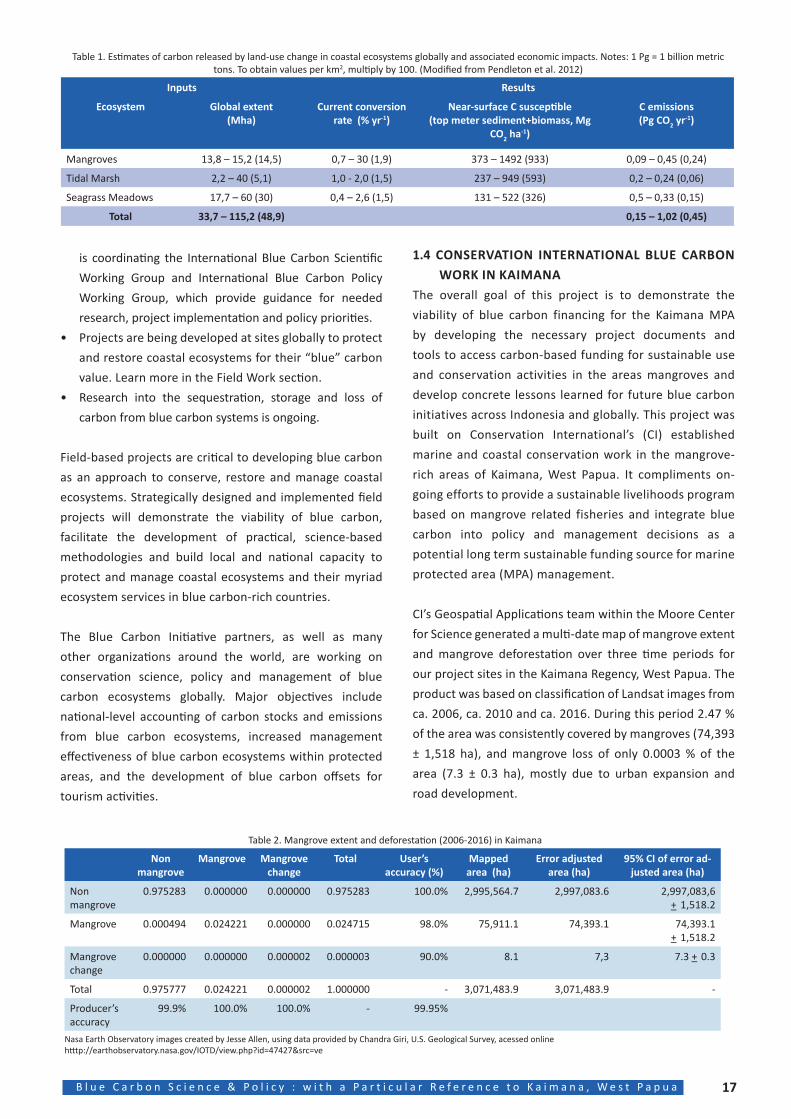
Table 1. Estimates of carbon released by land-use change in coastal ecosystems globally and associated economic impacts. Notes: 1 Pg = 1 billion metric tons. To obtain values per km2, multiply by 100. (Modified from Pendleton et al. 2012)
Inputs Results
Ecosystem Global extent(Mha)
Current conversion rate (% yr-1)
Near-surface C susceptible(top meter sediment+biomass, Mg
CO2 ha-1)
C emissions(Pg CO2 yr-1)
Mangroves 13,8 – 15,2 (14,5) 0,7 – 30 (1,9) 373 – 1492 (933) 0,09 – 0,45 (0,24)
Tidal Marsh 2,2 – 40 (5,1) 1,0 - 2,0 (1,5) 237 – 949 (593) 0,2 – 0,24 (0,06)
Seagrass Meadows 17,7 – 60 (30) 0,4 – 2,6 (1,5) 131 – 522 (326) 0,5 – 0,33 (0,15)
Total 33,7 – 115,2 (48,9) 0,15 – 1,02 (0,45)
is coordinating the International Blue Carbon Scientific
Working Group and International Blue Carbon Policy
Working Group, which provide guidance for needed
research, project implementation and policy priorities.
• Projects are being developed at sites globally to protect
and restore coastal ecosystems for their “blue” carbon
value. Learn more in the Field Work section.
• Research into the sequestration, storage and loss of
carbon from blue carbon systems is ongoing.
Field-based projects are critical to developing blue carbon
as an approach to conserve, restore and manage coastal
ecosystems. Strategically designed and implemented field
projects will demonstrate the viability of blue carbon,
facilitate the development of practical, science-based
methodologies and build local and national capacity to
protect and manage coastal ecosystems and their myriad
ecosystem services in blue carbon-rich countries.
The Blue Carbon Initiative partners, as well as many
other organizations around the world, are working on
conservation science, policy and management of blue
carbon ecosystems globally. Major objectives include
national-level accounting of carbon stocks and emissions
from blue carbon ecosystems, increased management
effectiveness of blue carbon ecosystems within protected
areas, and the development of blue carbon offsets for
tourism activities.
1.4 CONSERVATION INTERNATIONAL BLUE CARBON WORK IN KAIMANA
The overall goal of this project is to demonstrate the
viability of blue carbon financing for the Kaimana MPA
by developing the necessary project documents and
tools to access carbon-based funding for sustainable use
and conservation activities in the areas mangroves and
develop concrete lessons learned for future blue carbon
initiatives across Indonesia and globally. This project was
built on Conservation International’s (CI) established
marine and coastal conservation work in the mangrove-
rich areas of Kaimana, West Papua. It compliments on-
going efforts to provide a sustainable livelihoods program
based on mangrove related fisheries and integrate blue
carbon into policy and management decisions as a
potential long term sustainable funding source for marine
protected area (MPA) management.
CI’s Geospatial Applications team within the Moore Center
for Science generated a multi-date map of mangrove extent
and mangrove deforestation over three time periods for
our project sites in the Kaimana Regency, West Papua. The
product was based on classification of Landsat images from
ca. 2006, ca. 2010 and ca. 2016. During this period 2.47 %
of the area was consistently covered by mangroves (74,393
± 1,518 ha), and mangrove loss of only 0.0003 % of the
area (7.3 ± 0.3 ha), mostly due to urban expansion and
road development.
Table 2. Mangrove extent and deforestation (2006-2016) in Kaimana
Nonmangrove
Mangrove Mangrove change
Total User’saccuracy (%)
Mappedarea (ha)
Error adjusted area (ha)
95% CI of error ad-justed area (ha)
Nonmangrove
0.975283 0.000000 0.000000 0.975283 100.0% 2,995,564.7 2,997,083.6 2,997,083,6 + _ 1,518.2
Mangrove 0.000494 0.024221 0.000000 0.024715 98.0% 75,911.1 74,393.1 74,393.1 + _ 1,518.2
Mangrovechange
0.000000 0.000000 0.000002 0.000003 90.0% 8.1 7,3 7.3 + _ 0.3
Total 0.975777 0.024221 0.000002 1.000000 - 3,071,483.9 3,071,483.9 -
Producer’s accuracy
99.9% 100.0% 100.0% - 99.95%
Nasa Earth Observatory images created by Jesse Allen, using data provided by Chandra Giri, U.S. Geological Survey, acessed online htttp://earthobservatory.nasa.gov/IOTD/view.php?id=47427&src=ve
18 B l u e C a r b o n S c i e n c e & P o l i c y : w i t h a P a r t i c u l a r R e f e r e n c e t o K a i m a n a , W e s t P a p u a
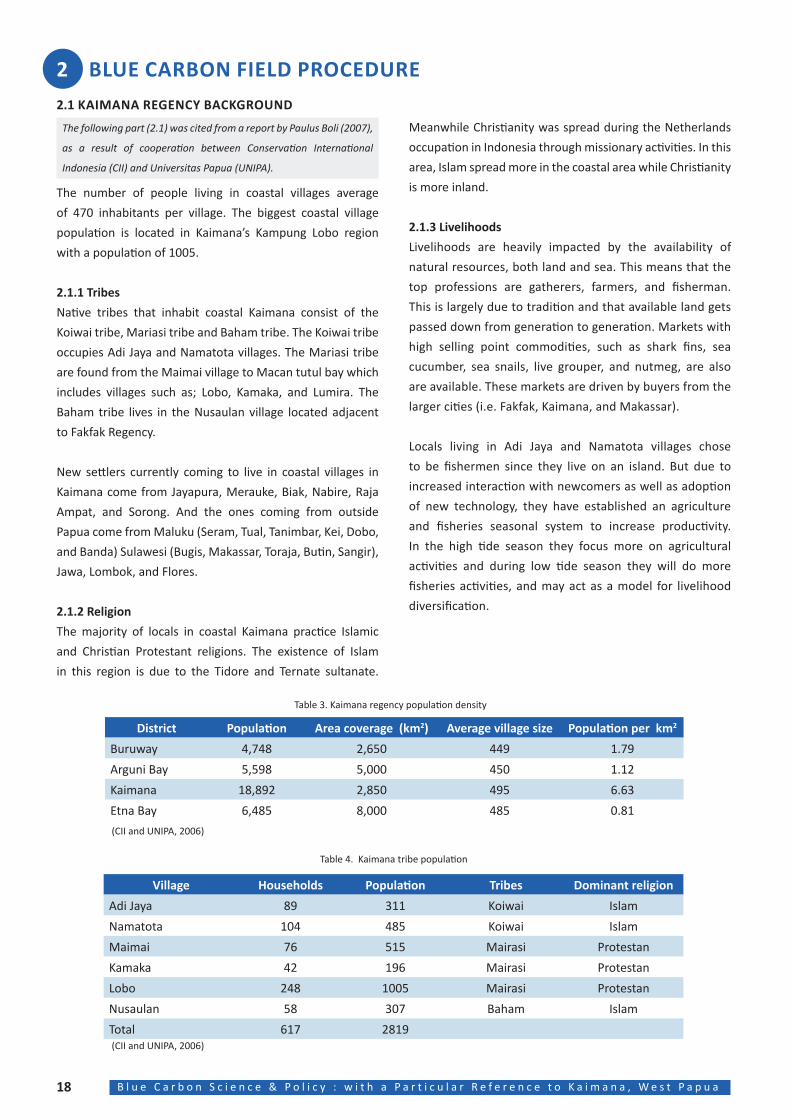
The number of people living in coastal villages average
of 470 inhabitants per village. The biggest coastal village
population is located in Kaimana’s Kampung Lobo region
with a population of 1005.
2.1.1 Tribes
Native tribes that inhabit coastal Kaimana consist of the
Koiwai tribe, Mariasi tribe and Baham tribe. The Koiwai tribe
occupies Adi Jaya and Namatota villages. The Mariasi tribe
are found from the Maimai village to Macan tutul bay which
includes villages such as; Lobo, Kamaka, and Lumira. The
Baham tribe lives in the Nusaulan village located adjacent
to Fakfak Regency.
New settlers currently coming to live in coastal villages in
Kaimana come from Jayapura, Merauke, Biak, Nabire, Raja
Ampat, and Sorong. And the ones coming from outside
Papua come from Maluku (Seram, Tual, Tanimbar, Kei, Dobo,
and Banda) Sulawesi (Bugis, Makassar, Toraja, Butin, Sangir),
Jawa, Lombok, and Flores.
2.1.2 Religion
The majority of locals in coastal Kaimana practice Islamic
and Christian Protestant religions. The existence of Islam
in this region is due to the Tidore and Ternate sultanate.
Table 4. Kaimana tribe population
Meanwhile Christianity was spread during the Netherlands
occupation in Indonesia through missionary activities. In this
area, Islam spread more in the coastal area while Christianity
is more inland.
2.1.3 Livelihoods
Livelihoods are heavily impacted by the availability of
natural resources, both land and sea. This means that the
top professions are gatherers, farmers, and fisherman.
This is largely due to tradition and that available land gets
passed down from generation to generation. Markets with
high selling point commodities, such as shark fins, sea
cucumber, sea snails, live grouper, and nutmeg, are also
are available. These markets are driven by buyers from the
larger cities (i.e. Fakfak, Kaimana, and Makassar).
Locals living in Adi Jaya and Namatota villages chose
to be fishermen since they live on an island. But due to
increased interaction with newcomers as well as adoption
of new technology, they have established an agriculture
and fisheries seasonal system to increase productivity.
In the high tide season they focus more on agricultural
activities and during low tide season they will do more
fisheries activities, and may act as a model for livelihood
diversification.
2 BLUE CARBON FIELD PROCEDURE
Table 3. Kaimana regency population density
District Population Area coverage (km2) Average village size Population per km2
Buruway 4,748 2,650 449 1.79
Arguni Bay 5,598 5,000 450 1.12
Kaimana 18,892 2,850 495 6.63
Etna Bay 6,485 8,000 485 0.81
(CII and UNIPA, 2006)
(CII and UNIPA, 2006)
Village Households Population Tribes Dominant religion
Adi Jaya 89 311 Koiwai Islam
Namatota 104 485 Koiwai Islam
Maimai 76 515 Mairasi Protestan
Kamaka 42 196 Mairasi Protestan
Lobo 248 1005 Mairasi Protestan
Nusaulan 58 307 Baham Islam
Total 617 2819
2.1 KAIMANA REGENCY BACKGROUND
The following part (2.1) was cited from a report by Paulus Boli (2007),
as a result of cooperation between Conservation International
Indonesia (CII) and Universitas Papua (UNIPA).
19B l u e C a r b o n S c i e n c e & P o l i c y : w i t h a P a r t i c u l a r R e f e r e n c e t o K a i m a n a , W e s t P a p u a
2.1.3.1 Agriculture
Before farming became popular, the people of Kaimana
survived largely from gleaning the forest and fields. And
while agriculture has taken off in the region, the practice of
gleaning is still a large source of food for many people. In
many instances, agriculture is used to meet dietary needs
for carbohydrates (i.e., sweet potatoes, and bananas)
while gleaning, hunting, and fishing supplies all other
requirements.
Being a heavily forested location, clearing of land must be
done prior to planting. This is usually carried out by a group,
clan, and/or family members. The location of the planting
area is based on specific criteria: (1) does it have a layer of
thick soil; (2) how far away is it from their home; and (3) is
it somewhat protected from pests such as boar and deer.
Clearing of agricultural land includes cutting down trees
and shrubs but good tree types for manufacturing housing
material and firewood are set aside. The leaves, branches
and other woody stems are left to dry for about a week and
then burned. The ash becomes an organic layer on top of the
soil surface that acts as a fertilizer. Land processing taking
about 3 to 4 weeks, after that the process of planting seeds
or young plants cultivated in a village nursery is started.
The most popular crops are taro, sweet potatoes (betatas),
cassava, corn, bananas, and vegetables. Short term crops
like sweet potatoes are planted around 4 to 6 months before
they can be harvested and must be planted every year.
Banana trees are planted only once and allowed to produce
for as long as the soil can sustain them.
When the soil looses capacity to grow enough food, the
farmer will move on and clear a new area of land. The used
patch of land is left to rest for about 5 years and then the
farmer may come back and re-establish the farm once the
soil has been restored, but by that time the land will usually
require clearing again. The communities in Kampung Maimai
work to not let the soil deplete by implementing crop
rotation using long-term crops that have high economical
value such as, nutmeg and cocoa. Farmers do not use any
artificial fertilizers or pesticides (boars are considered the
biggest pest).
Change of consumption patterns
The unfolding relationship between Kaimana and other areas
in Indonesia brought changes in the pattern of consumption.
Before, local communities main ingredients were sweet
potatoes and bananas, nowadays it has shifted to rice to
follow the majority of the population in the western part
of Indonesia. This change is largely due to a government
program to assist the poor by providing rice rations on a
monthly basis (at Rp. 1,000 per kg, approximately $0.08
USD). This program began to be implemented in 2000 and
continues to present day. Rice rations are made available to
Kaimana families in 30 kg rations every three months and
the average family will consume this in as little as 7-10 days.
After the rations are gone the family must travel to the city
and purchase rice at around Rp. 5,000 per kg. The residents
of villages that have more money will purchase rice, the
families in poorer villages will revert to eating other crops
namely sweet potatoes, banana and sago.
The forest is still full of various birds, reptiles and mammals;
including cockatoos, parrots, snakes, crocodiles, wild pigs,
deer and kangaroos. Locals typically utilize some of these
animal to meet their protein needs or sell them to earn
money. The animals most commonly hunted are deer, wild
boar, and some kinds of birds.
Plantation Crops
The most common types of plantation crops grown by
farmers and plantation companies in Kaimana are coconuts,
cocoa, nutmeg, and cloves. Nutmeg and coconut employ the
most people in Kaimana with cocoa mainly comes from a
single plantation on the island of Adi Jaya.
Coastal communities in Kaimana produce nutmeg as a main
source of household income. Therefore almost all villages
have nutmeg gardens. Local interest in planting nutmeg trees
is also high, based on the consideration that the selling price
of this commodity is quite high (Rp. 7,000 – 10,000 rupiah
per kg). In addition, demand for nutmeg is high enough that
the farmers never outstrip the demand. The interest of the
local population is also influenced by the relatively easy
handling of the nutmeg trees, ranging from planting and
caring for trees up to the harvesting and processing of the
fruit.
Coconut is the second most important plantation crop
after nutmeg. Coconut trees can be found along the beach
throughout Kaimana. Community interest in working with
this crop is mainly due to its low maintenance and coconut
trees are often used as a sign or evidence of land tenure of
a clan or family. The selling price of coconut ranges from Rp.
500 up to Rp.1000 per fruit. However, this crop is really only
feasible for villages near Kaimana city due to the high cost
of transportation. One way to make transporting of coconut
easier is to dry it but this is a difficult since the coconut
needs to be skinned first and separated from the shell, then
20 B l u e C a r b o n S c i e n c e & P o l i c y : w i t h a P a r t i c u l a r R e f e r e n c e t o K a i m a n a , W e s t P a p u a
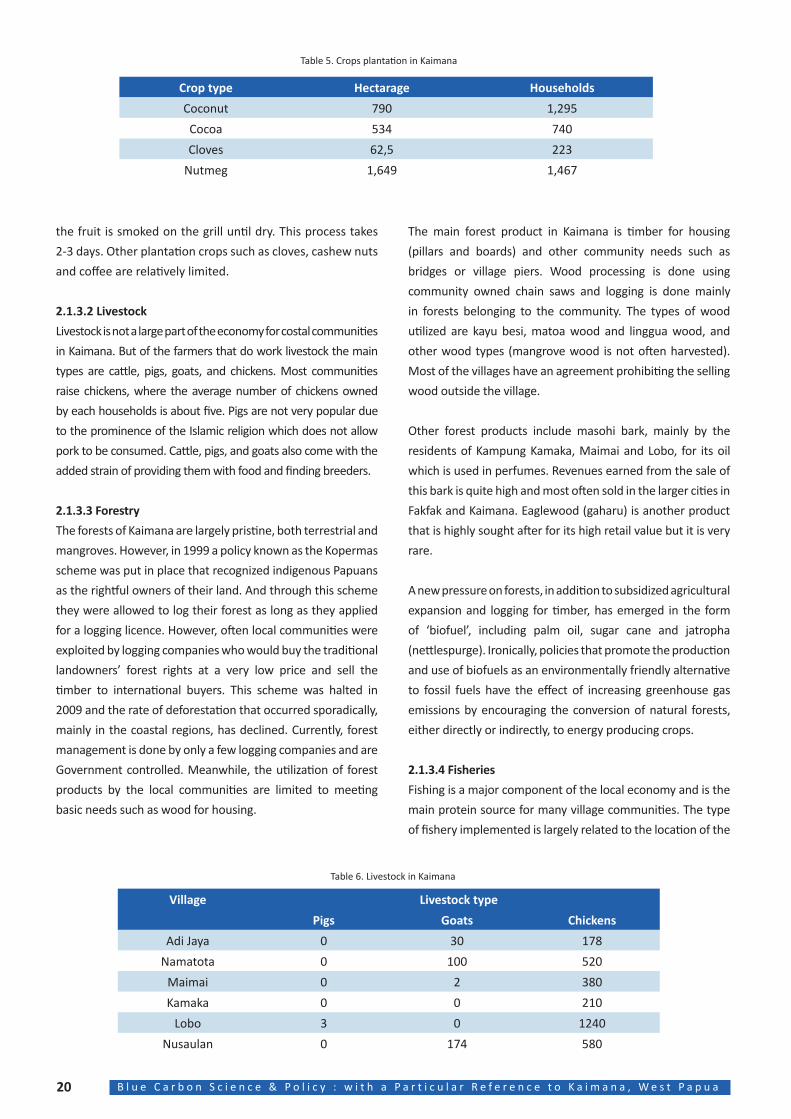
Table 5. Crops plantation in Kaimana
the fruit is smoked on the grill until dry. This process takes
2-3 days. Other plantation crops such as cloves, cashew nuts
and coffee are relatively limited.
2.1.3.2 Livestock
Livestock is not a large part of the economy for costal communities
in Kaimana. But of the farmers that do work livestock the main
types are cattle, pigs, goats, and chickens. Most communities
raise chickens, where the average number of chickens owned
by each households is about five. Pigs are not very popular due
to the prominence of the Islamic religion which does not allow
pork to be consumed. Cattle, pigs, and goats also come with the
added strain of providing them with food and finding breeders.
2.1.3.3 Forestry
The forests of Kaimana are largely pristine, both terrestrial and
mangroves. However, in 1999 a policy known as the Kopermas
scheme was put in place that recognized indigenous Papuans
as the rightful owners of their land. And through this scheme
they were allowed to log their forest as long as they applied
for a logging licence. However, often local communities were
exploited by logging companies who would buy the traditional
landowners’ forest rights at a very low price and sell the
timber to international buyers. This scheme was halted in
2009 and the rate of deforestation that occurred sporadically,
mainly in the coastal regions, has declined. Currently, forest
management is done by only a few logging companies and are
Government controlled. Meanwhile, the utilization of forest
products by the local communities are limited to meeting
basic needs such as wood for housing.
The main forest product in Kaimana is timber for housing
(pillars and boards) and other community needs such as
bridges or village piers. Wood processing is done using
community owned chain saws and logging is done mainly
in forests belonging to the community. The types of wood
utilized are kayu besi, matoa wood and linggua wood, and
other wood types (mangrove wood is not often harvested).
Most of the villages have an agreement prohibiting the selling
wood outside the village.
Other forest products include masohi bark, mainly by the
residents of Kampung Kamaka, Maimai and Lobo, for its oil
which is used in perfumes. Revenues earned from the sale of
this bark is quite high and most often sold in the larger cities in
Fakfak and Kaimana. Eaglewood (gaharu) is another product
that is highly sought after for its high retail value but it is very
rare.
A new pressure on forests, in addition to subsidized agricultural
expansion and logging for timber, has emerged in the form
of ‘biofuel’, including palm oil, sugar cane and jatropha
(nettlespurge). Ironically, policies that promote the production
and use of biofuels as an environmentally friendly alternative
to fossil fuels have the effect of increasing greenhouse gas
emissions by encouraging the conversion of natural forests,
either directly or indirectly, to energy producing crops.
2.1.3.4 Fisheries
Fishing is a major component of the local economy and is the
main protein source for many village communities. The type
of fishery implemented is largely related to the location of the
Table 6. Livestock in Kaimana
Crop type Hectarage Households
Coconut 790 1,295
Cocoa 534 740
Cloves 62,5 223
Nutmeg 1,649 1,467
Village Livestock type
Pigs Goats Chickens
Adi Jaya 0 30 178
Namatota 0 100 520
Maimai 0 2 380
Kamaka 0 0 210
Lobo 3 0 1240
Nusaulan 0 174 580
21B l u e C a r b o n S c i e n c e & P o l i c y : w i t h a P a r t i c u l a r R e f e r e n c e t o K a i m a n a , W e s t P a p u a
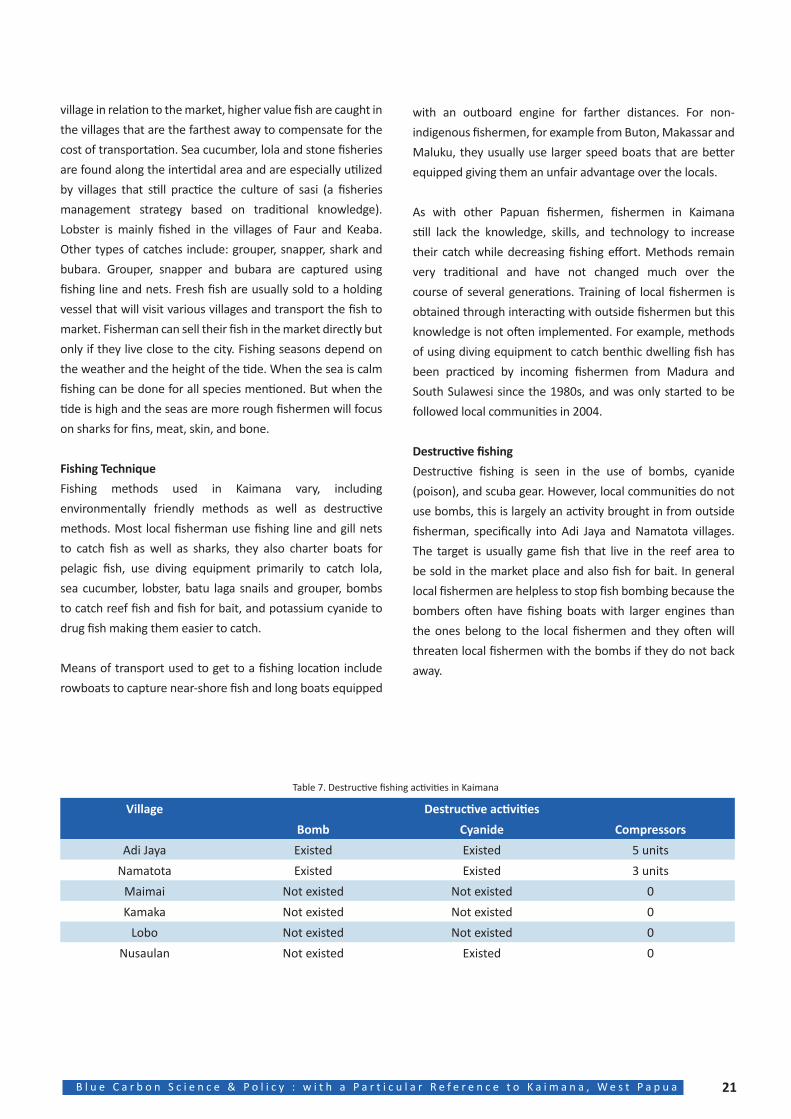
Table 7. Destructive fishing activities in Kaimana
Village Destructive activities
Bomb Cyanide Compressors
Adi Jaya Existed Existed 5 units
Namatota Existed Existed 3 units
Maimai Not existed Not existed 0
Kamaka Not existed Not existed 0
Lobo Not existed Not existed 0
Nusaulan Not existed Existed 0
village in relation to the market, higher value fish are caught in
the villages that are the farthest away to compensate for the
cost of transportation. Sea cucumber, lola and stone fisheries
are found along the intertidal area and are especially utilized
by villages that still practice the culture of sasi (a fisheries
management strategy based on traditional knowledge).
Lobster is mainly fished in the villages of Faur and Keaba.
Other types of catches include: grouper, snapper, shark and
bubara. Grouper, snapper and bubara are captured using
fishing line and nets. Fresh fish are usually sold to a holding
vessel that will visit various villages and transport the fish to
market. Fisherman can sell their fish in the market directly but
only if they live close to the city. Fishing seasons depend on
the weather and the height of the tide. When the sea is calm
fishing can be done for all species mentioned. But when the
tide is high and the seas are more rough fishermen will focus
on sharks for fins, meat, skin, and bone.
Fishing Technique
Fishing methods used in Kaimana vary, including
environmentally friendly methods as well as destructive
methods. Most local fisherman use fishing line and gill nets
to catch fish as well as sharks, they also charter boats for
pelagic fish, use diving equipment primarily to catch lola,
sea cucumber, lobster, batu laga snails and grouper, bombs
to catch reef fish and fish for bait, and potassium cyanide to
drug fish making them easier to catch.
Means of transport used to get to a fishing location include
rowboats to capture near-shore fish and long boats equipped
with an outboard engine for farther distances. For non-
indigenous fishermen, for example from Buton, Makassar and
Maluku, they usually use larger speed boats that are better
equipped giving them an unfair advantage over the locals.
As with other Papuan fishermen, fishermen in Kaimana
still lack the knowledge, skills, and technology to increase
their catch while decreasing fishing effort. Methods remain
very traditional and have not changed much over the
course of several generations. Training of local fishermen is
obtained through interacting with outside fishermen but this
knowledge is not often implemented. For example, methods
of using diving equipment to catch benthic dwelling fish has
been practiced by incoming fishermen from Madura and
South Sulawesi since the 1980s, and was only started to be
followed local communities in 2004.
Destructive fishing
Destructive fishing is seen in the use of bombs, cyanide
(poison), and scuba gear. However, local communities do not
use bombs, this is largely an activity brought in from outside
fisherman, specifically into Adi Jaya and Namatota villages.
The target is usually game fish that live in the reef area to
be sold in the market place and also fish for bait. In general
local fishermen are helpless to stop fish bombing because the
bombers often have fishing boats with larger engines than
the ones belong to the local fishermen and they often will
threaten local fishermen with the bombs if they do not back
away.
22 B l u e C a r b o n S c i e n c e & P o l i c y : w i t h a P a r t i c u l a r R e f e r e n c e t o K a i m a n a , W e s t P a p u a
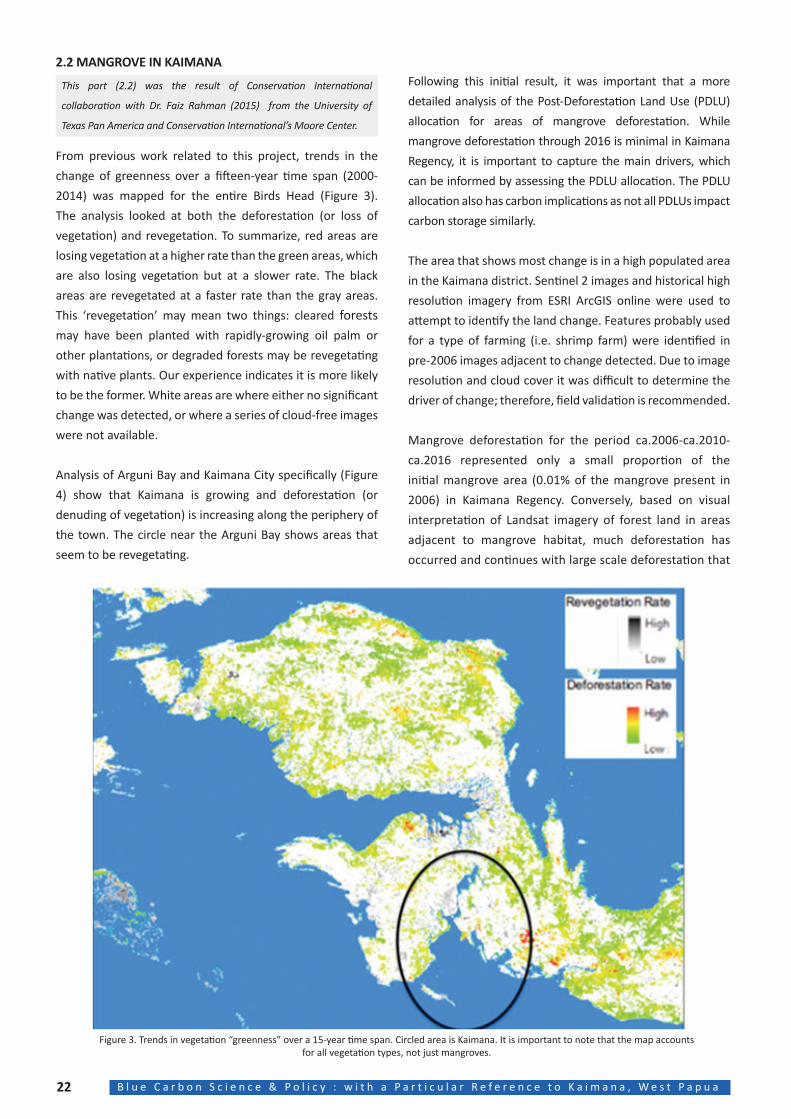
From previous work related to this project, trends in the
change of greenness over a fifteen-year time span (2000-
2014) was mapped for the entire Birds Head (Figure 3).
The analysis looked at both the deforestation (or loss of
vegetation) and revegetation. To summarize, red areas are
losing vegetation at a higher rate than the green areas, which
are also losing vegetation but at a slower rate. The black
areas are revegetated at a faster rate than the gray areas.
This ‘revegetation’ may mean two things: cleared forests may have been planted with rapidly-growing oil palm or
other plantations, or degraded forests may be revegetating
with native plants. Our experience indicates it is more likely
to be the former. White areas are where either no significant
change was detected, or where a series of cloud-free images
were not available.
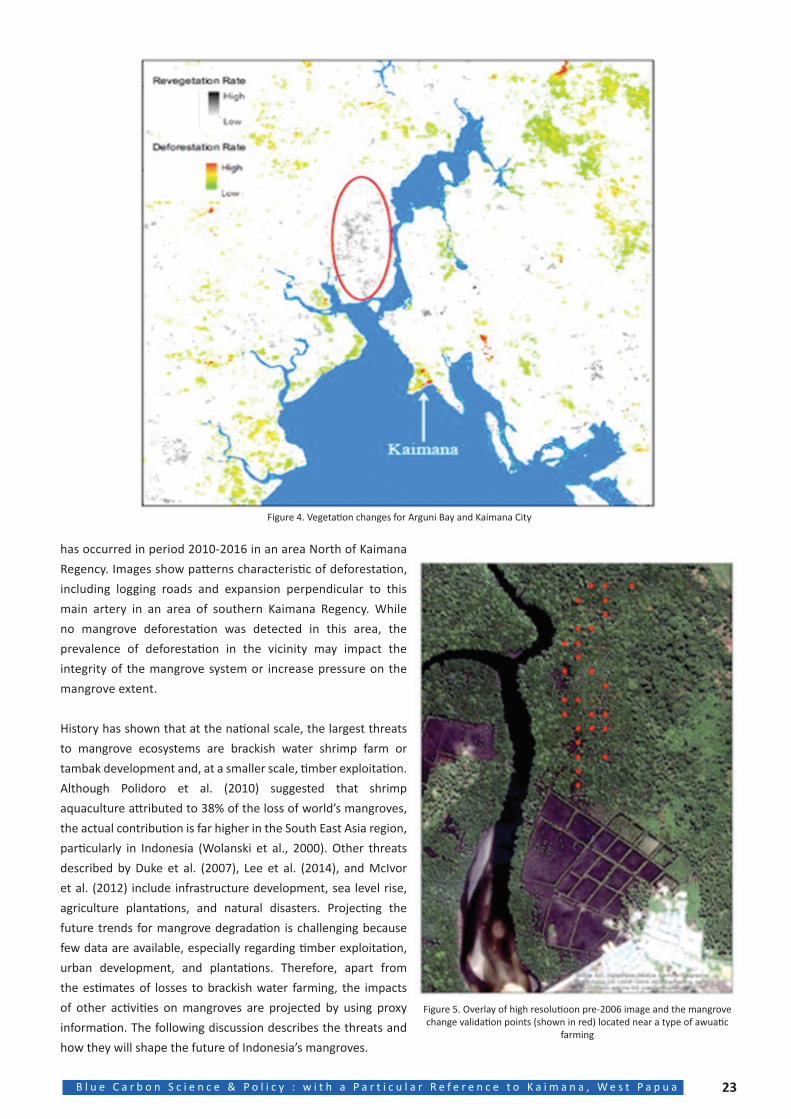
Analysis of Arguni Bay and Kaimana City specifically (Figure
4) show that Kaimana is growing and deforestation (or
denuding of vegetation) is increasing along the periphery of
the town. The circle near the Arguni Bay shows areas that
seem to be revegetating.
Following this initial result, it was important that a more
detailed analysis of the Post-Deforestation Land Use (PDLU)
allocation for areas of mangrove deforestation. While
mangrove deforestation through 2016 is minimal in Kaimana
Regency, it is important to capture the main drivers, which
can be informed by assessing the PDLU allocation. The PDLU
allocation also has carbon implications as not all PDLUs impact
carbon storage similarly.
The area that shows most change is in a high populated area
in the Kaimana district. Sentinel 2 images and historical high
resolution imagery from ESRI ArcGIS online were used to
attempt to identify the land change. Features probably used
for a type of farming (i.e. shrimp farm) were identified in
pre-2006 images adjacent to change detected. Due to image
resolution and cloud cover it was difficult to determine the
driver of change; therefore, field validation is recommended.
Mangrove deforestation for the period ca.2006-ca.2010-
ca.2016 represented only a small proportion of the
initial mangrove area (0.01% of the mangrove present in
2006) in Kaimana Regency. Conversely, based on visual
interpretation of Landsat imagery of forest land in areas
adjacent to mangrove habitat, much deforestation has
occurred and continues with large scale deforestation that
Figure 3. Trends in vegetation “greenness” over a 15-year time span. Circled area is Kaimana. It is important to note that the map accounts for all vegetation types, not just mangroves.
2.2 MANGROVE IN KAIMANA
This part (2.2) was the result of Conservation International
collaboration with Dr. Faiz Rahman (2015) from the University of
Texas Pan America and Conservation International’s Moore Center.
23B l u e C a r b o n S c i e n c e & P o l i c y : w i t h a P a r t i c u l a r R e f e r e n c e t o K a i m a n a , W e s t P a p u a
Figure 5. Overlay of high resolutioon pre-2006 image and the mangrove change validation points (shown in red) located near a type of awuatic
farming
Figure 4. Vegetation changes for Arguni Bay and Kaimana City
has occurred in period 2010-2016 in an area North of Kaimana
Regency. Images show patterns characteristic of deforestation,
including logging roads and expansion perpendicular to this
main artery in an area of southern Kaimana Regency. While
no mangrove deforestation was detected in this area, the
prevalence of deforestation in the vicinity may impact the
integrity of the mangrove system or increase pressure on the
mangrove extent.
History has shown that at the national scale, the largest threats
to mangrove ecosystems are brackish water shrimp farm or
tambak development and, at a smaller scale, timber exploitation.
Although Polidoro et al. (2010) suggested that shrimp
aquaculture attributed to 38% of the loss of world’s mangroves,
the actual contribution is far higher in the South East Asia region,
particularly in Indonesia (Wolanski et al., 2000). Other threats
described by Duke et al. (2007), Lee et al. (2014), and McIvor
et al. (2012) include infrastructure development, sea level rise,
agriculture plantations, and natural disasters. Projecting the
future trends for mangrove degradation is challenging because
few data are available, especially regarding timber exploitation,
urban development, and plantations. Therefore, apart from
the estimates of losses to brackish water farming, the impacts
of other activities on mangroves are projected by using proxy
information. The following discussion describes the threats and
how they will shape the future of Indonesia’s mangroves.
24 B l u e C a r b o n S c i e n c e & P o l i c y : w i t h a P a r t i c u l a r R e f e r e n c e t o K a i m a n a , W e s t P a p u a
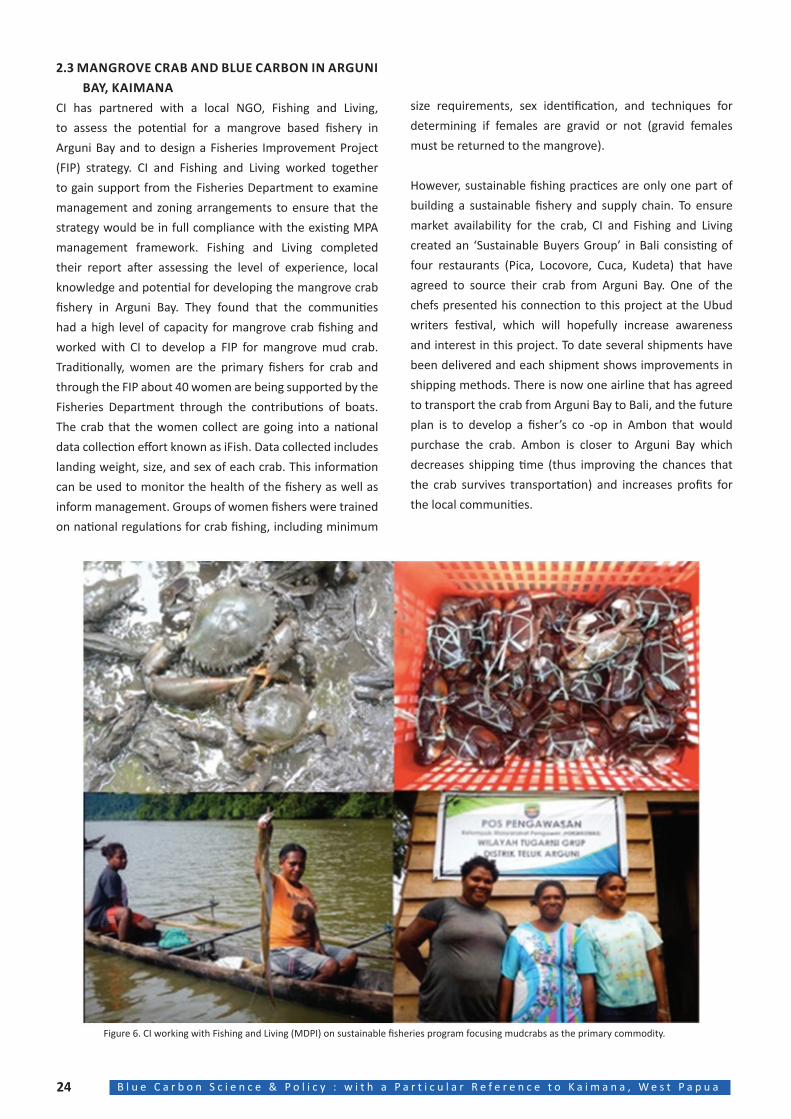
2.3 MANGROVE CRAB AND BLUE CARBON IN ARGUNI BAY, KAIMANA
CI has partnered with a local NGO, Fishing and Living,
to assess the potential for a mangrove based fishery in
Arguni Bay and to design a Fisheries Improvement Project
(FIP) strategy. CI and Fishing and Living worked together
to gain support from the Fisheries Department to examine
management and zoning arrangements to ensure that the
strategy would be in full compliance with the existing MPA
management framework. Fishing and Living completed
their report after assessing the level of experience, local
knowledge and potential for developing the mangrove crab
fishery in Arguni Bay. They found that the communities
had a high level of capacity for mangrove crab fishing and
worked with CI to develop a FIP for mangrove mud crab.
Traditionally, women are the primary fishers for crab and
through the FIP about 40 women are being supported by the
Fisheries Department through the contributions of boats.
The crab that the women collect are going into a national
data collection effort known as iFish. Data collected includes
landing weight, size, and sex of each crab. This information
can be used to monitor the health of the fishery as well as
inform management. Groups of women fishers were trained
on national regulations for crab fishing, including minimum
size requirements, sex identification, and techniques for
determining if females are gravid or not (gravid females
must be returned to the mangrove).
However, sustainable fishing practices are only one part of
building a sustainable fishery and supply chain. To ensure
market availability for the crab, CI and Fishing and Living
created an ‘Sustainable Buyers Group’ in Bali consisting of
four restaurants (Pica, Locovore, Cuca, Kudeta) that have
agreed to source their crab from Arguni Bay. One of the
chefs presented his connection to this project at the Ubud
writers festival, which will hopefully increase awareness
and interest in this project. To date several shipments have
been delivered and each shipment shows improvements in
shipping methods. There is now one airline that has agreed
to transport the crab from Arguni Bay to Bali, and the future
plan is to develop a fisher’s co -op in Ambon that would
purchase the crab. Ambon is closer to Arguni Bay which
decreases shipping time (thus improving the chances that
the crab survives transportation) and increases profits for
the local communities.
Figure 6. CI working with Fishing and Living (MDPI) on sustainable fisheries program focusing mudcrabs as the primary commodity.
25B l u e C a r b o n S c i e n c e & P o l i c y : w i t h a P a r t i c u l a r R e f e r e n c e t o K a i m a n a , W e s t P a p u a
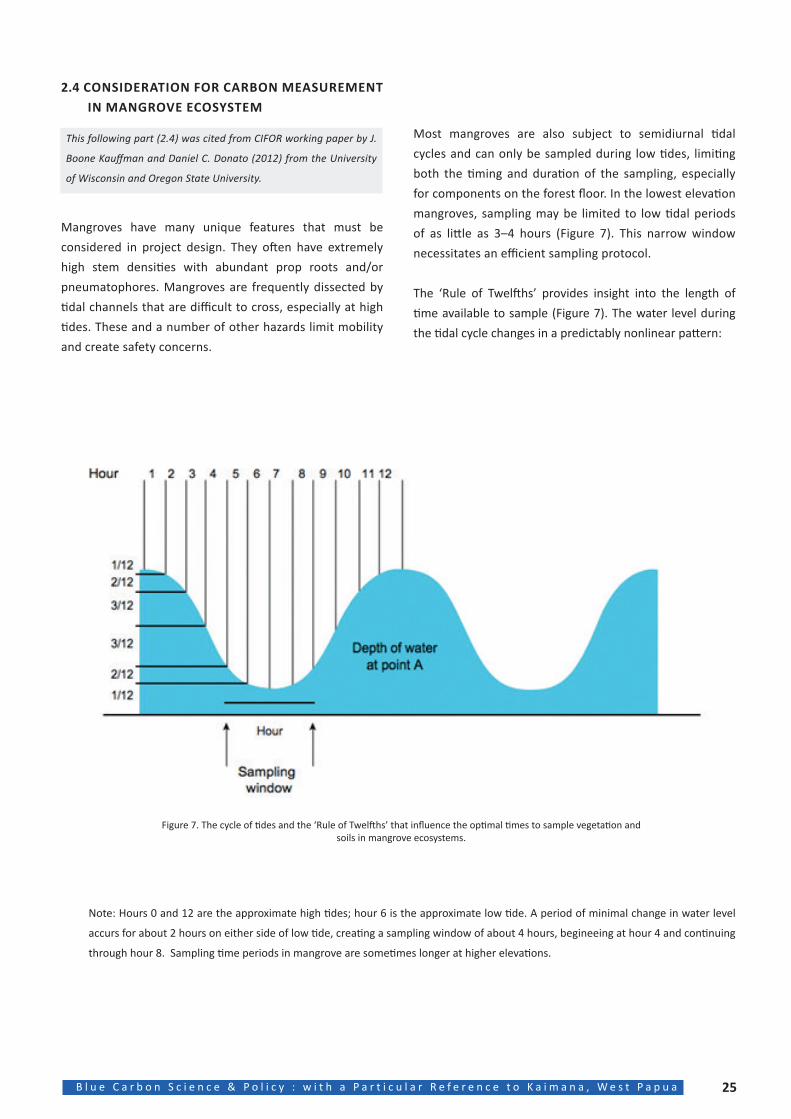
Figure 7. The cycle of tides and the ‘Rule of Twelfths’ that influence the optimal times to sample vegetation and soils in mangrove ecosystems.
Note: Hours 0 and 12 are the approximate high tides; hour 6 is the approximate low tide. A period of minimal change in water level
accurs for about 2 hours on either side of low tide, creating a sampling window of about 4 hours, begineeing at hour 4 and continuing
through hour 8. Sampling time periods in mangrove are sometimes longer at higher elevations.
2.4 CONSIDERATION FOR CARBON MEASUREMENT IN MANGROVE ECOSYSTEM
Mangroves have many unique features that must be
considered in project design. They often have extremely
high stem densities with abundant prop roots and/or
pneumatophores. Mangroves are frequently dissected by
tidal channels that are difficult to cross, especially at high
tides. These and a number of other hazards limit mobility
and create safety concerns.
Most mangroves are also subject to semidiurnal tidal
cycles and can only be sampled during low tides, limiting
both the timing and duration of the sampling, especially
for components on the forest floor. In the lowest elevation
mangroves, sampling may be limited to low tidal periods
of as little as 3–4 hours (Figure 7). This narrow window
necessitates an efficient sampling protocol.
The ‘Rule of Twelfths’ provides insight into the length of
time available to sample (Figure 7). The water level during
the tidal cycle changes in a predictably nonlinear pattern:
This following part (2.4) was cited from CIFOR working paper by J.
Boone Kauffman and Daniel C. Donato (2012) from the University
of Wisconsin and Oregon State University.
26 B l u e C a r b o n S c i e n c e & P o l i c y : w i t h a P a r t i c u l a r R e f e r e n c e t o K a i m a n a , W e s t P a p u a
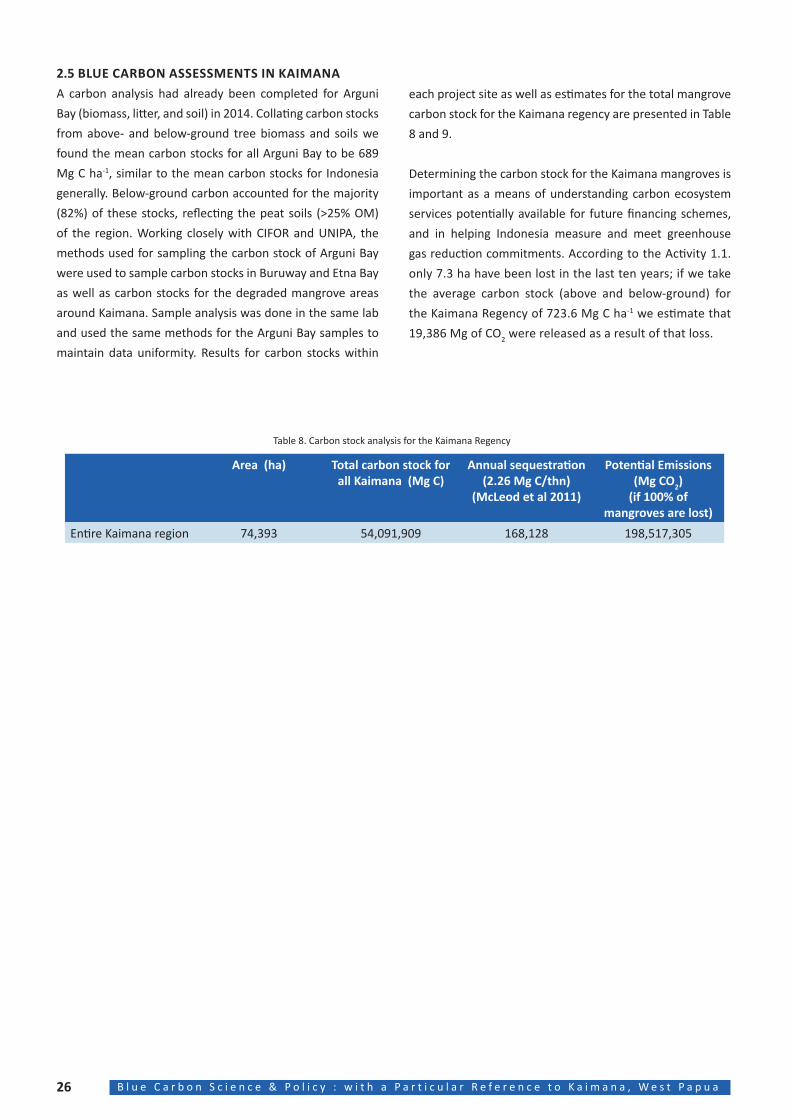
Table 8. Carbon stock analysis for the Kaimana Regency
each project site as well as estimates for the total mangrove
carbon stock for the Kaimana regency are presented in Table
8 and 9.
Determining the carbon stock for the Kaimana mangroves is
important as a means of understanding carbon ecosystem
services potentially available for future financing schemes,
and in helping Indonesia measure and meet greenhouse
gas reduction commitments. According to the Activity 1.1.
only 7.3 ha have been lost in the last ten years; if we take
the average carbon stock (above and below-ground) for
the Kaimana Regency of 723.6 Mg C ha-1 we estimate that
19,386 Mg of CO2 were released as a result of that loss.
Area (ha) Total carbon stock for all Kaimana (Mg C)
Annual sequestration (2.26 Mg C/thn)
(McLeod et al 2011)
Potential Emissions (Mg CO2)
(if 100% ofmangroves are lost)
Entire Kaimana region 74,393 54,091,909 168,128 198,517,305
2.5 BLUE CARBON ASSESSMENTS IN KAIMANAA carbon analysis had already been completed for Arguni
Bay (biomass, litter, and soil) in 2014. Collating carbon stocks
from above- and below-ground tree biomass and soils we
found the mean carbon stocks for all Arguni Bay to be 689
Mg C ha-1, similar to the mean carbon stocks for Indonesia
generally. Below-ground carbon accounted for the majority
(82%) of these stocks, reflecting the peat soils (>25% OM)
of the region. Working closely with CIFOR and UNIPA, the
methods used for sampling the carbon stock of Arguni Bay
were used to sample carbon stocks in Buruway and Etna Bay
as well as carbon stocks for the degraded mangrove areas
around Kaimana. Sample analysis was done in the same lab
and used the same methods for the Arguni Bay samples to
maintain data uniformity. Results for carbon stocks within
27B l u e C a r b o n S c i e n c e & P o l i c y : w i t h a P a r t i c u l a r R e f e r e n c e t o K a i m a n a , W e s t P a p u a
Man
grov
e A
rea
(ha
)M
ean
Soil
Carb
on
(Mg
C/ha
)M
ean
Plan
t Car
bon
(M
g C/
ha)
Tota
l Mea
n Ca
r-bo
n St
ock
(Mg
C/ha
)
Tota
l Car
bon
Stoc
k
(Mg
C)
Sequ
estr
ation
Rat
e
(Mg
C/ha
/thn
) (M
cLeo
d et
al
2011
)
Ann
ual
Sequ
estr
ation
(M
g C/
yr)
Pote
ntial
Emis
sion
s (M
g CO
2) (if
100
% o
fm
angr
oves
are
lost
)
Num
ber
of
spec
ies
Arg
uni
6,03
156
812
3*69
14,
167,
421
2.26
±0.3
913
,630
.06
15,2
94,4
35.0
77
Buru
way
10,9
3144
2.1
± 17
9.8
291.
2 ±
63.8
733.
3 ±
232
8,01
5,70
22.
26±0
.39
24,7
04.0
629
,417
,627
.44
30
Etna
17,3
0245
6.8
± 12
9.3
291
± 34
748
± 13
512
,941
,896
2.26
±0.3
939
,102
.52
47,4
96,7
58.3
216
Kaim
ana
175
274.
3 ±
241.
447
± 3
232
1 ±
239
56,1
752.
26±0
.39
395.
5020
6,16
2.25
12
Out
side
of
Site
s39
,954
488.
623
572
3.6
28,9
10,7
142.
26±0
.39
90,2
96.0
410
6,10
2,32
1.85
(bas
ed o
n a
tota
l ar
ea o
f 74,
393
ha)
Aver
age
acro
ss A
rgun
i, Bu
ruw
ay, a
nd E
tna
Aver
age
acro
ss A
rgun
i, Bu
ruw
ay, a
nd E
tna
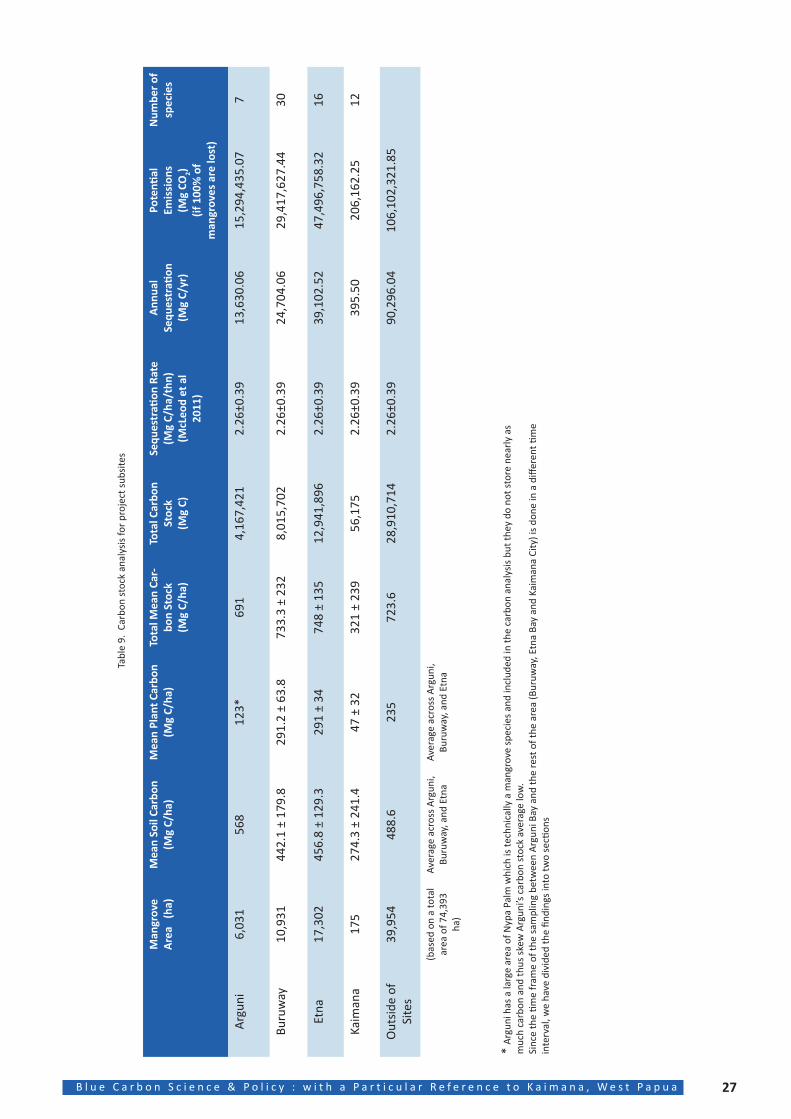
Tabl
e 9.
Car
bon
stoc
k an
alys
is fo
r pr
ojec
t sub
site
s
* A
rgun
i has
a la
rge
area
of N
ypa
Palm
whi
ch is
tech
nica
lly a
man
grov
e sp
ecie
s an
d in
clud
ed in
the
carb
on a
naly
sis
but t
hey
do n
ot s
tore
nea
rly
as
muc
h ca
rbon
and
thus
ske
w A
rgun
i’s c
arbo
n st
ock
aver
age
low
.Si
nce
the
time
fram
e of
the
sam
plin
g be
twee
n A
rgun
i Bay
and
the
rest
of t
he a
rea
(Bur
uway
, Etn
a Ba
y an
d Ka
iman
a Ci
ty) i
s do
ne in
a d
iffer
ent ti
me
inte
rval
, we
have
div
ided
the
findi
ngs
into
two
secti
ons
28 B l u e C a r b o n S c i e n c e & P o l i c y : w i t h a P a r t i c u l a r R e f e r e n c e t o K a i m a n a , W e s t P a p u a
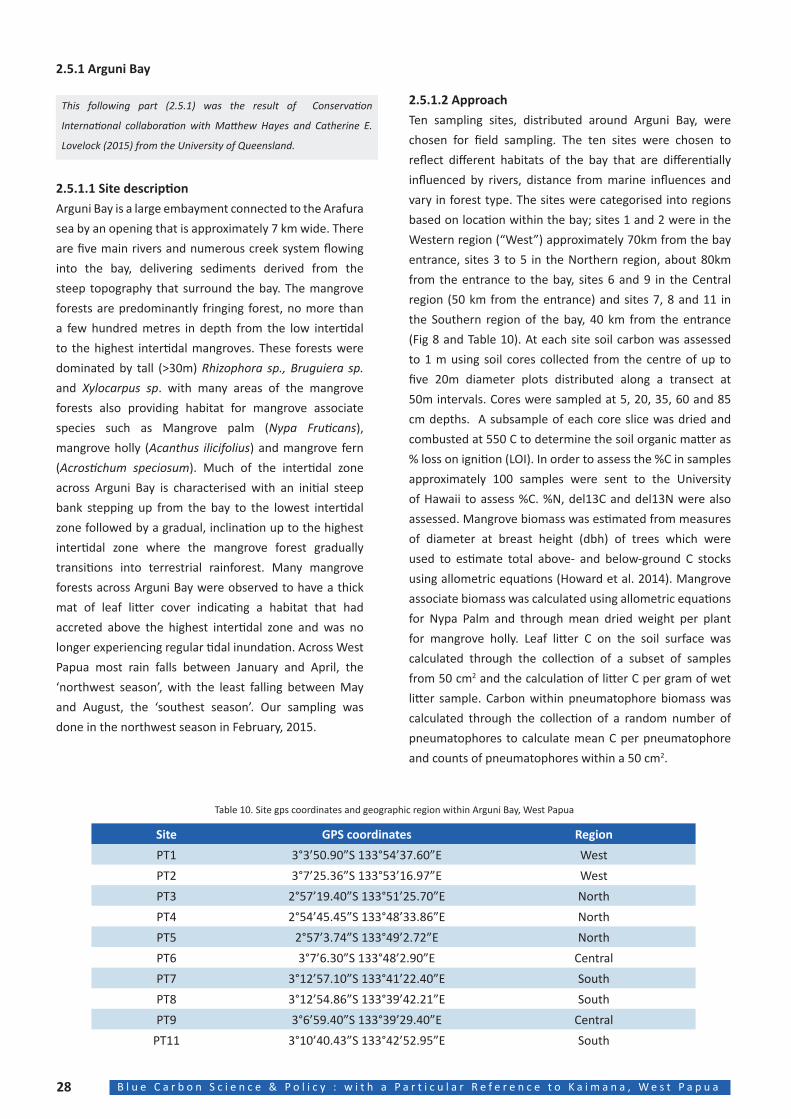
Table 10. Site gps coordinates and geographic region within Arguni Bay, West Papua
2.5.1 Arguni Bay
2.5.1.1 Site descriptionArguni Bay is a large embayment connected to the Arafura
sea by an opening that is approximately 7 km wide. There
are five main rivers and numerous creek system flowing
into the bay, delivering sediments derived from the
steep topography that surround the bay. The mangrove
forests are predominantly fringing forest, no more than
a few hundred metres in depth from the low intertidal
to the highest intertidal mangroves. These forests were
dominated by tall (>30m) Rhizophora sp., Bruguiera sp. and Xylocarpus sp. with many areas of the mangrove
forests also providing habitat for mangrove associate
species such as Mangrove palm (Nypa Fruticans),
mangrove holly (Acanthus ilicifolius) and mangrove fern
(Acrostichum speciosum). Much of the intertidal zone
across Arguni Bay is characterised with an initial steep
bank stepping up from the bay to the lowest intertidal
zone followed by a gradual, inclination up to the highest
intertidal zone where the mangrove forest gradually
transitions into terrestrial rainforest. Many mangrove
forests across Arguni Bay were observed to have a thick
mat of leaf litter cover indicating a habitat that had
accreted above the highest intertidal zone and was no
longer experiencing regular tidal inundation. Across West
Papua most rain falls between January and April, the
‘northwest season’, with the least falling between May
and August, the ‘southest season’. Our sampling was
done in the northwest season in February, 2015.
2.5.1.2 ApproachTen sampling sites, distributed around Arguni Bay, were
chosen for field sampling. The ten sites were chosen to
reflect different habitats of the bay that are differentially
influenced by rivers, distance from marine influences and
vary in forest type. The sites were categorised into regions
based on location within the bay; sites 1 and 2 were in the
Western region (“West”) approximately 70km from the bay
entrance, sites 3 to 5 in the Northern region, about 80km
from the entrance to the bay, sites 6 and 9 in the Central
region (50 km from the entrance) and sites 7, 8 and 11 in
the Southern region of the bay, 40 km from the entrance
(Fig 8 and Table 10). At each site soil carbon was assessed
to 1 m using soil cores collected from the centre of up to
five 20m diameter plots distributed along a transect at
50m intervals. Cores were sampled at 5, 20, 35, 60 and 85
cm depths. A subsample of each core slice was dried and
combusted at 550 C to determine the soil organic matter as
% loss on ignition (LOI). In order to assess the %C in samples
approximately 100 samples were sent to the University
of Hawaii to assess %C. %N, del13C and del13N were also
assessed. Mangrove biomass was estimated from measures
of diameter at breast height (dbh) of trees which were
used to estimate total above- and below-ground C stocks
using allometric equations (Howard et al. 2014). Mangrove
associate biomass was calculated using allometric equations
for Nypa Palm and through mean dried weight per plant
for mangrove holly. Leaf litter C on the soil surface was
calculated through the collection of a subset of samples
from 50 cm2 and the calculation of litter C per gram of wet
litter sample. Carbon within pneumatophore biomass was
calculated through the collection of a random number of
pneumatophores to calculate mean C per pneumatophore
and counts of pneumatophores within a 50 cm2.
Site GPS coordinates Region
PT1 3°3’50.90”S 133°54’37.60”E West
PT2 3°7’25.36”S 133°53’16.97”E West
PT3 2°57’19.40”S 133°51’25.70”E North
PT4 2°54’45.45”S 133°48’33.86”E North
PT5 2°57’3.74”S 133°49’2.72”E North
PT6 3°7’6.30”S 133°48’2.90”E Central
PT7 3°12’57.10”S 133°41’22.40”E South
PT8 3°12’54.86”S 133°39’42.21”E South
PT9 3°6’59.40”S 133°39’29.40”E Central
PT11 3°10’40.43”S 133°42’52.95”E South
This following part (2.5.1) was the result of Conservation
International collaboration with Matthew Hayes and Catherine E.
Lovelock (2015) from the University of Queensland.
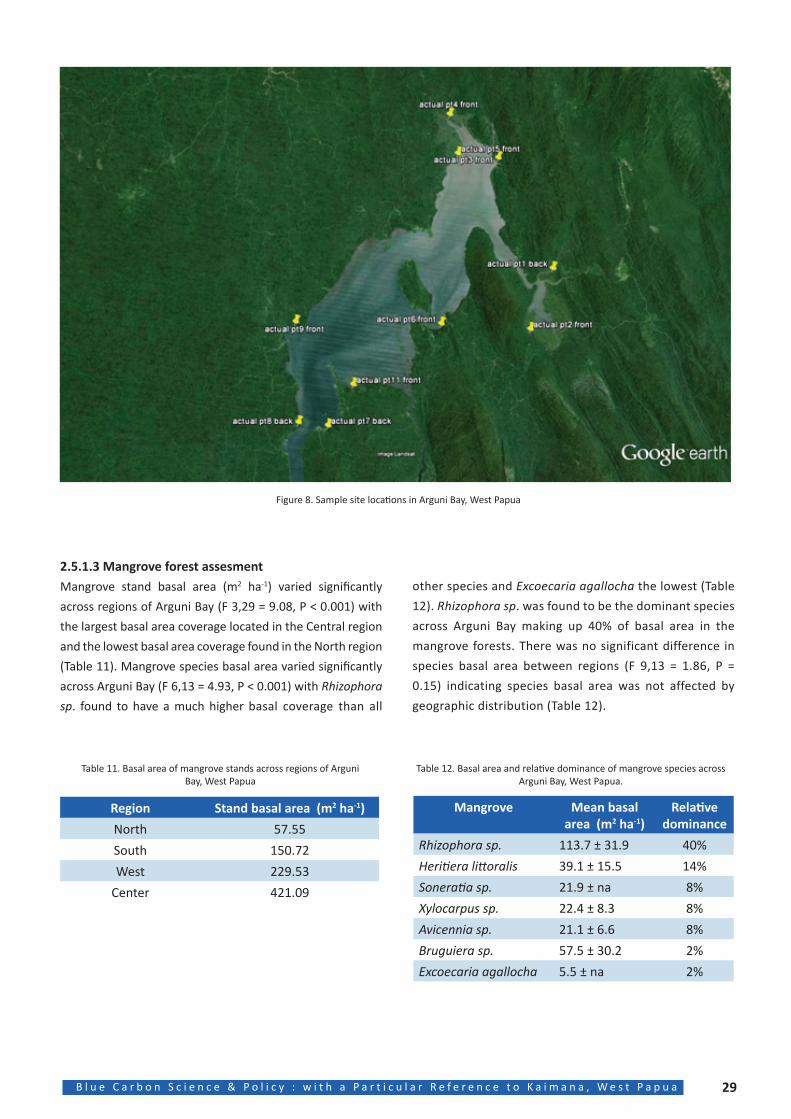
29B l u e C a r b o n S c i e n c e & P o l i c y : w i t h a P a r t i c u l a r R e f e r e n c e t o K a i m a n a , W e s t P a p u a
Figure 8. Sample site locations in Arguni Bay, West Papua
other species and Excoecaria agallocha the lowest (Table
12). Rhizophora sp. was found to be the dominant species
across Arguni Bay making up 40% of basal area in the
mangrove forests. There was no significant difference in
species basal area between regions (F 9,13 = 1.86, P =
0.15) indicating species basal area was not affected by
geographic distribution (Table 12).
2.5.1.3 Mangrove forest assesmentMangrove stand basal area (m2 ha-1) varied significantly
across regions of Arguni Bay (F 3,29 = 9.08, P < 0.001) with
the largest basal area coverage located in the Central region
and the lowest basal area coverage found in the North region
(Table 11). Mangrove species basal area varied significantly
across Arguni Bay (F 6,13 = 4.93, P < 0.001) with Rhizophora sp. found to have a much higher basal coverage than all
Region Stand basal area (m2 ha-1)
North 57.55
South 150.72
West 229.53
Center 421.09
Table 11. Basal area of mangrove stands across regions of Arguni Bay, West Papua
Mangrove Mean basal area (m2 ha-1)
Relative dominance
Rhizophora sp. 113.7 ± 31.9 40%
Heritiera littoralis 39.1 ± 15.5 14%
Soneratia sp. 21.9 ± na 8%
Xylocarpus sp. 22.4 ± 8.3 8%
Avicennia sp. 21.1 ± 6.6 8%
Bruguiera sp. 57.5 ± 30.2 2%
Excoecaria agallocha 5.5 ± na 2%
Table 12. Basal area and relative dominance of mangrove species across Arguni Bay, West Papua.
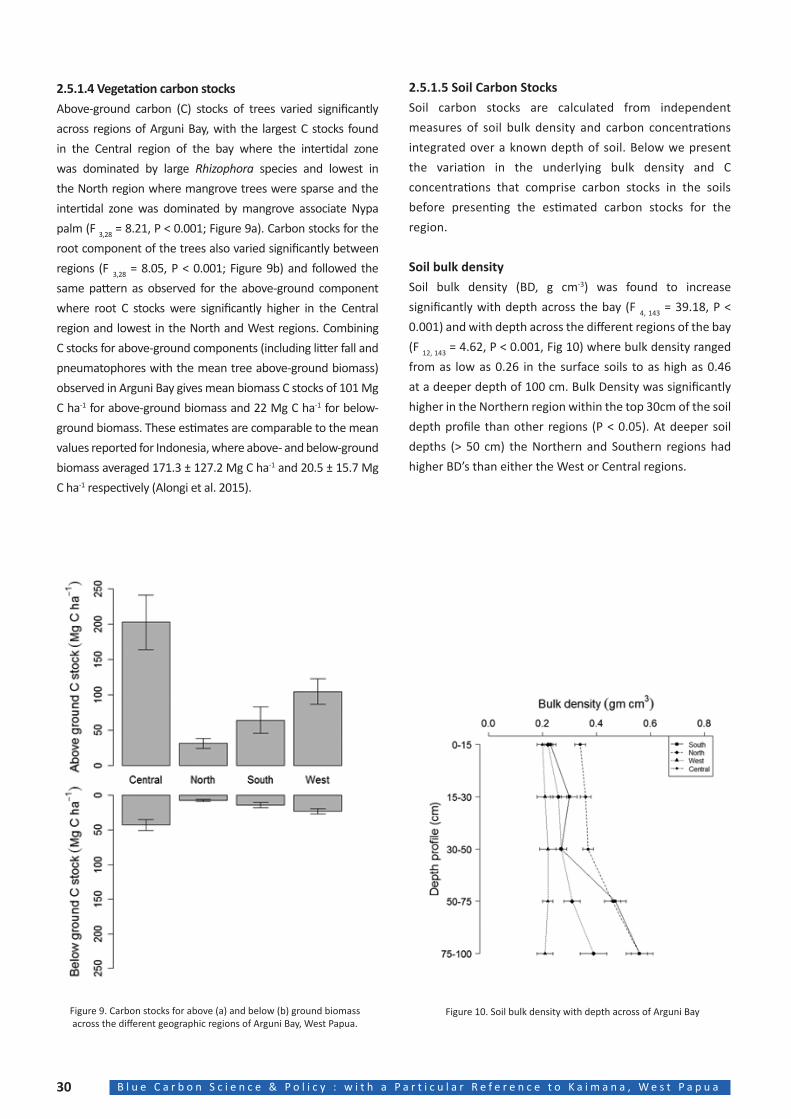
30 B l u e C a r b o n S c i e n c e & P o l i c y : w i t h a P a r t i c u l a r R e f e r e n c e t o K a i m a n a , W e s t P a p u a
2.5.1.4 Vegetation carbon stocksAbove-ground carbon (C) stocks of trees varied significantly
across regions of Arguni Bay, with the largest C stocks found
in the Central region of the bay where the intertidal zone
was dominated by large Rhizophora species and lowest in
the North region where mangrove trees were sparse and the
intertidal zone was dominated by mangrove associate Nypa
palm (F 3,28 = 8.21, P < 0.001; Figure 9a). Carbon stocks for the
root component of the trees also varied significantly between
regions (F 3,28 = 8.05, P < 0.001; Figure 9b) and followed the
same pattern as observed for the above-ground component
where root C stocks were significantly higher in the Central
region and lowest in the North and West regions. Combining
C stocks for above-ground components (including litter fall and
pneumatophores with the mean tree above-ground biomass)
observed in Arguni Bay gives mean biomass C stocks of 101 Mg
C ha-1 for above-ground biomass and 22 Mg C ha-1 for below-
ground biomass. These estimates are comparable to the mean
values reported for Indonesia, where above- and below-ground
biomass averaged 171.3 ± 127.2 Mg C ha-1 and 20.5 ± 15.7 Mg
C ha-1 respectively (Alongi et al. 2015).
2.5.1.5 Soil Carbon StocksSoil carbon stocks are calculated from independent
measures of soil bulk density and carbon concentrations
integrated over a known depth of soil. Below we present
the variation in the underlying bulk density and C
concentrations that comprise carbon stocks in the soils
before presenting the estimated carbon stocks for the
region.
Soil bulk densitySoil bulk density (BD, g cm-3) was found to increase
significantly with depth across the bay (F 4, 143 = 39.18, P <
0.001) and with depth across the different regions of the bay
(F 12, 143 = 4.62, P < 0.001, Fig 10) where bulk density ranged
from as low as 0.26 in the surface soils to as high as 0.46
at a deeper depth of 100 cm. Bulk Density was significantly
higher in the Northern region within the top 30cm of the soil
depth profile than other regions (P < 0.05). At deeper soil
depths (> 50 cm) the Northern and Southern regions had
higher BD’s than either the West or Central regions.
Figure 9. Carbon stocks for above (a) and below (b) ground biomass across the different geographic regions of Arguni Bay, West Papua.
Figure 10. Soil bulk density with depth across of Arguni Bay
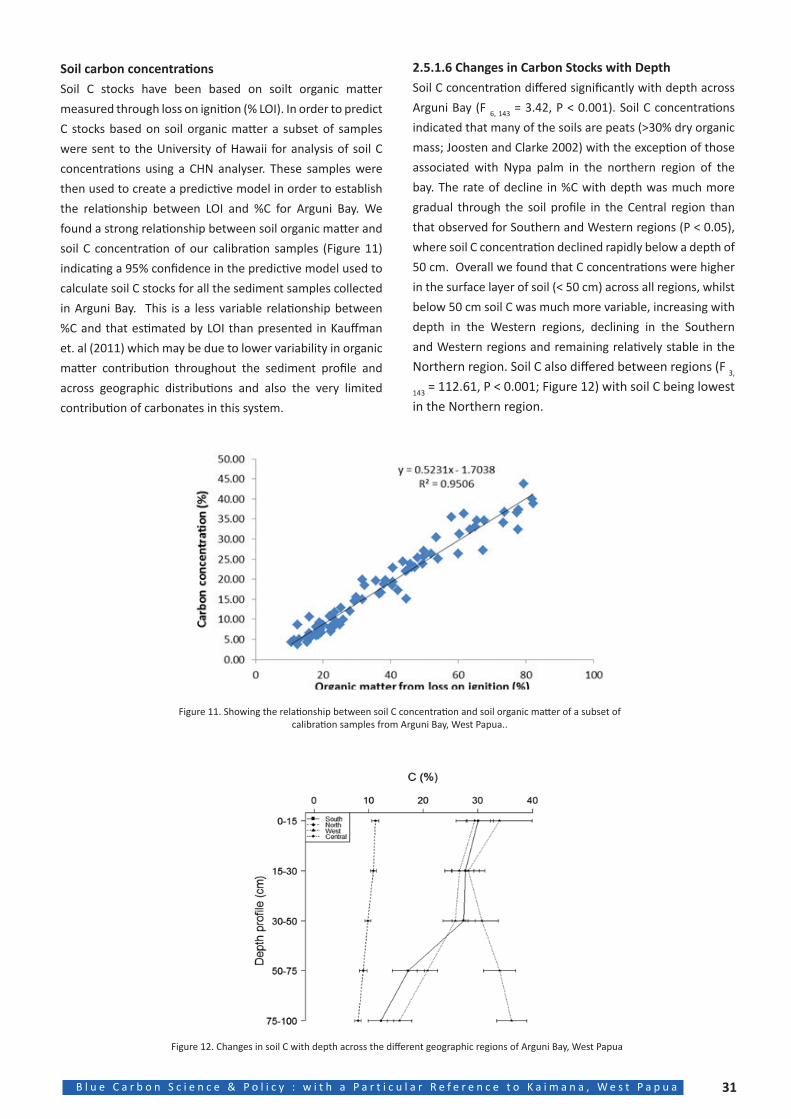
31B l u e C a r b o n S c i e n c e & P o l i c y : w i t h a P a r t i c u l a r R e f e r e n c e t o K a i m a n a , W e s t P a p u a
Soil carbon concentrationsSoil C stocks have been based on soilt organic matter
measured through loss on ignition (% LOI). In order to predict
C stocks based on soil organic matter a subset of samples
were sent to the University of Hawaii for analysis of soil C
concentrations using a CHN analyser. These samples were
then used to create a predictive model in order to establish
the relationship between LOI and %C for Arguni Bay. We
found a strong relationship between soil organic matter and
soil C concentration of our calibration samples (Figure 11)
indicating a 95% confidence in the predictive model used to
calculate soil C stocks for all the sediment samples collected
in Arguni Bay. This is a less variable relationship between
%C and that estimated by LOI than presented in Kauffman
et. al (2011) which may be due to lower variability in organic
matter contribution throughout the sediment profile and
across geographic distributions and also the very limited
contribution of carbonates in this system.
2.5.1.6 Changes in Carbon Stocks with DepthSoil C concentration differed significantly with depth across
Arguni Bay (F 6, 143 = 3.42, P < 0.001). Soil C concentrations
indicated that many of the soils are peats (>30% dry organic
mass; Joosten and Clarke 2002) with the exception of those
associated with Nypa palm in the northern region of the
bay. The rate of decline in %C with depth was much more
gradual through the soil profile in the Central region than
that observed for Southern and Western regions (P < 0.05),
where soil C concentration declined rapidly below a depth of
50 cm. Overall we found that C concentrations were higher
in the surface layer of soil (< 50 cm) across all regions, whilst
below 50 cm soil C was much more variable, increasing with
depth in the Western regions, declining in the Southern
and Western regions and remaining relatively stable in the
Northern region. Soil C also differed between regions (F 3,
143 = 112.61, P < 0.001; Figure 12) with soil C being lowest in the Northern region.
Figure 11. Showing the relationship between soil C concentration and soil organic matter of a subset of calibration samples from Arguni Bay, West Papua..
Figure 12. Changes in soil C with depth across the different geographic regions of Arguni Bay, West Papua
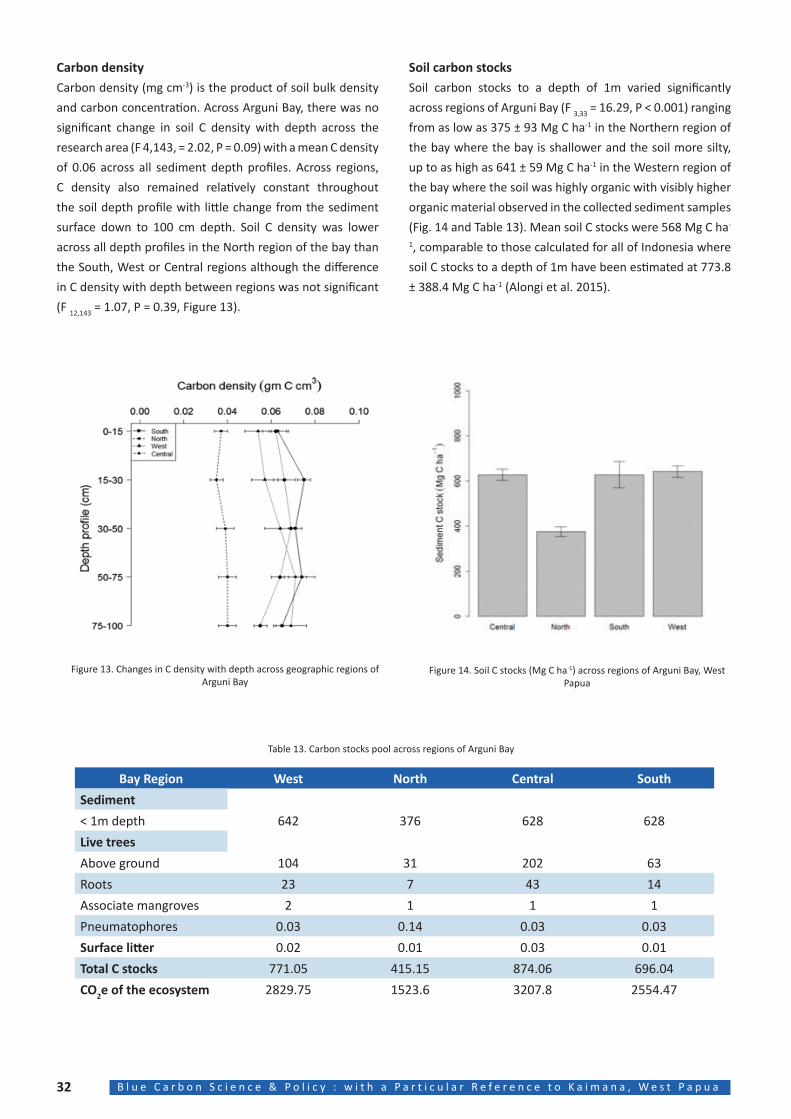
32 B l u e C a r b o n S c i e n c e & P o l i c y : w i t h a P a r t i c u l a r R e f e r e n c e t o K a i m a n a , W e s t P a p u a
Carbon densityCarbon density (mg cm-3) is the product of soil bulk density
and carbon concentration. Across Arguni Bay, there was no
significant change in soil C density with depth across the
research area (F 4,143, = 2.02, P = 0.09) with a mean C density
of 0.06 across all sediment depth profiles. Across regions,
C density also remained relatively constant throughout
the soil depth profile with little change from the sediment
surface down to 100 cm depth. Soil C density was lower
across all depth profiles in the North region of the bay than
the South, West or Central regions although the difference
in C density with depth between regions was not significant
(F 12,143 = 1.07, P = 0.39, Figure 13).
Figure 13. Changes in C density with depth across geographic regions of Arguni Bay
Figure 14. Soil C stocks (Mg C ha-1) across regions of Arguni Bay, West Papua
Soil carbon stocksSoil carbon stocks to a depth of 1m varied significantly
across regions of Arguni Bay (F 3,33 = 16.29, P < 0.001) ranging
from as low as 375 ± 93 Mg C ha-1 in the Northern region of
the bay where the bay is shallower and the soil more silty,
up to as high as 641 ± 59 Mg C ha-1 in the Western region of
the bay where the soil was highly organic with visibly higher
organic material observed in the collected sediment samples
(Fig. 14 and Table 13). Mean soil C stocks were 568 Mg C ha-
1, comparable to those calculated for all of Indonesia where
soil C stocks to a depth of 1m have been estimated at 773.8
± 388.4 Mg C ha-1 (Alongi et al. 2015).
Table 13. Carbon stocks pool across regions of Arguni Bay
Bay Region West North Central South
Sediment
< 1m depth 642 376 628 628
Live trees
Above ground 104 31 202 63
Roots 23 7 43 14
Associate mangroves 2 1 1 1
Pneumatophores 0.03 0.14 0.03 0.03
Surface litter 0.02 0.01 0.03 0.01
Total C stocks 771.05 415.15 874.06 696.04
CO2e of the ecosystem 2829.75 1523.6 3207.8 2554.47
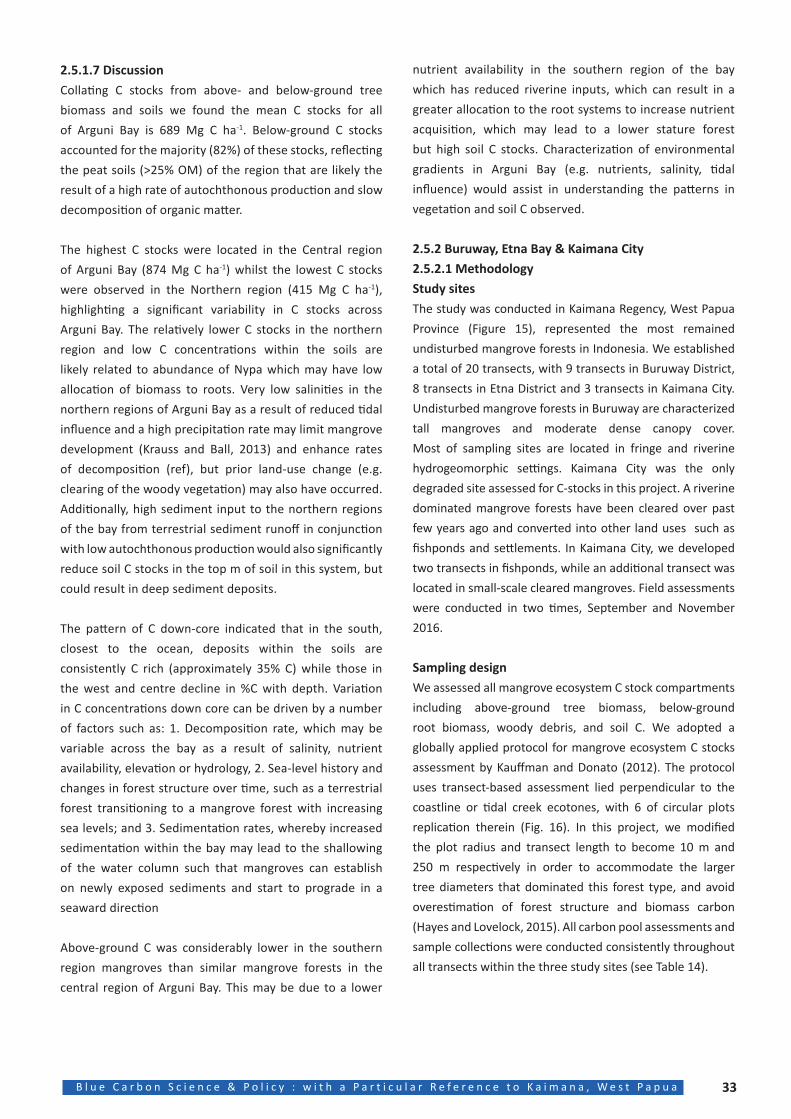
33B l u e C a r b o n S c i e n c e & P o l i c y : w i t h a P a r t i c u l a r R e f e r e n c e t o K a i m a n a , W e s t P a p u a
2.5.1.7 DiscussionCollating C stocks from above- and below-ground tree
biomass and soils we found the mean C stocks for all
of Arguni Bay is 689 Mg C ha-1. Below-ground C stocks
accounted for the majority (82%) of these stocks, reflecting
the peat soils (>25% OM) of the region that are likely the
result of a high rate of autochthonous production and slow
decomposition of organic matter.
The highest C stocks were located in the Central region
of Arguni Bay (874 Mg C ha-1) whilst the lowest C stocks
were observed in the Northern region (415 Mg C ha-1),
highlighting a significant variability in C stocks across
Arguni Bay. The relatively lower C stocks in the northern
region and low C concentrations within the soils are
likely related to abundance of Nypa which may have low
allocation of biomass to roots. Very low salinities in the
northern regions of Arguni Bay as a result of reduced tidal
influence and a high precipitation rate may limit mangrove
development (Krauss and Ball, 2013) and enhance rates
of decomposition (ref), but prior land-use change (e.g.
clearing of the woody vegetation) may also have occurred.
Additionally, high sediment input to the northern regions
of the bay from terrestrial sediment runoff in conjunction
with low autochthonous production would also significantly
reduce soil C stocks in the top m of soil in this system, but
could result in deep sediment deposits.
The pattern of C down-core indicated that in the south,
closest to the ocean, deposits within the soils are
consistently C rich (approximately 35% C) while those in
the west and centre decline in %C with depth. Variation
in C concentrations down core can be driven by a number
of factors such as: 1. Decomposition rate, which may be
variable across the bay as a result of salinity, nutrient
availability, elevation or hydrology, 2. Sea-level history and
changes in forest structure over time, such as a terrestrial
forest transitioning to a mangrove forest with increasing
sea levels; and 3. Sedimentation rates, whereby increased
sedimentation within the bay may lead to the shallowing
of the water column such that mangroves can establish
on newly exposed sediments and start to prograde in a
seaward direction
Above-ground C was considerably lower in the southern
region mangroves than similar mangrove forests in the
central region of Arguni Bay. This may be due to a lower
nutrient availability in the southern region of the bay
which has reduced riverine inputs, which can result in a
greater allocation to the root systems to increase nutrient
acquisition, which may lead to a lower stature forest
but high soil C stocks. Characterization of environmental
gradients in Arguni Bay (e.g. nutrients, salinity, tidal
influence) would assist in understanding the patterns in
vegetation and soil C observed.
2.5.2 Buruway, Etna Bay & Kaimana City2.5.2.1 Methodology Study sitesThe study was conducted in Kaimana Regency, West Papua
Province (Figure 15), represented the most remained
undisturbed mangrove forests in Indonesia. We established
a total of 20 transects, with 9 transects in Buruway District,
8 transects in Etna District and 3 transects in Kaimana City.
Undisturbed mangrove forests in Buruway are characterized
tall mangroves and moderate dense canopy cover.
Most of sampling sites are located in fringe and riverine
hydrogeomorphic settings. Kaimana City was the only
degraded site assessed for C-stocks in this project. A riverine
dominated mangrove forests have been cleared over past
few years ago and converted into other land uses such as
fishponds and settlements. In Kaimana City, we developed
two transects in fishponds, while an additional transect was
located in small-scale cleared mangroves. Field assessments
were conducted in two times, September and November
2016.
Sampling designWe assessed all mangrove ecosystem C stock compartments
including above-ground tree biomass, below-ground
root biomass, woody debris, and soil C. We adopted a
globally applied protocol for mangrove ecosystem C stocks
assessment by Kauffman and Donato (2012). The protocol
uses transect-based assessment lied perpendicular to the
coastline or tidal creek ecotones, with 6 of circular plots
replication therein (Fig. 16). In this project, we modified
the plot radius and transect length to become 10 m and
250 m respectively in order to accommodate the larger
tree diameters that dominated this forest type, and avoid
overestimation of forest structure and biomass carbon
(Hayes and Lovelock, 2015). All carbon pool assessments and
sample collections were conducted consistently throughout
all transects within the three study sites (see Table 14).
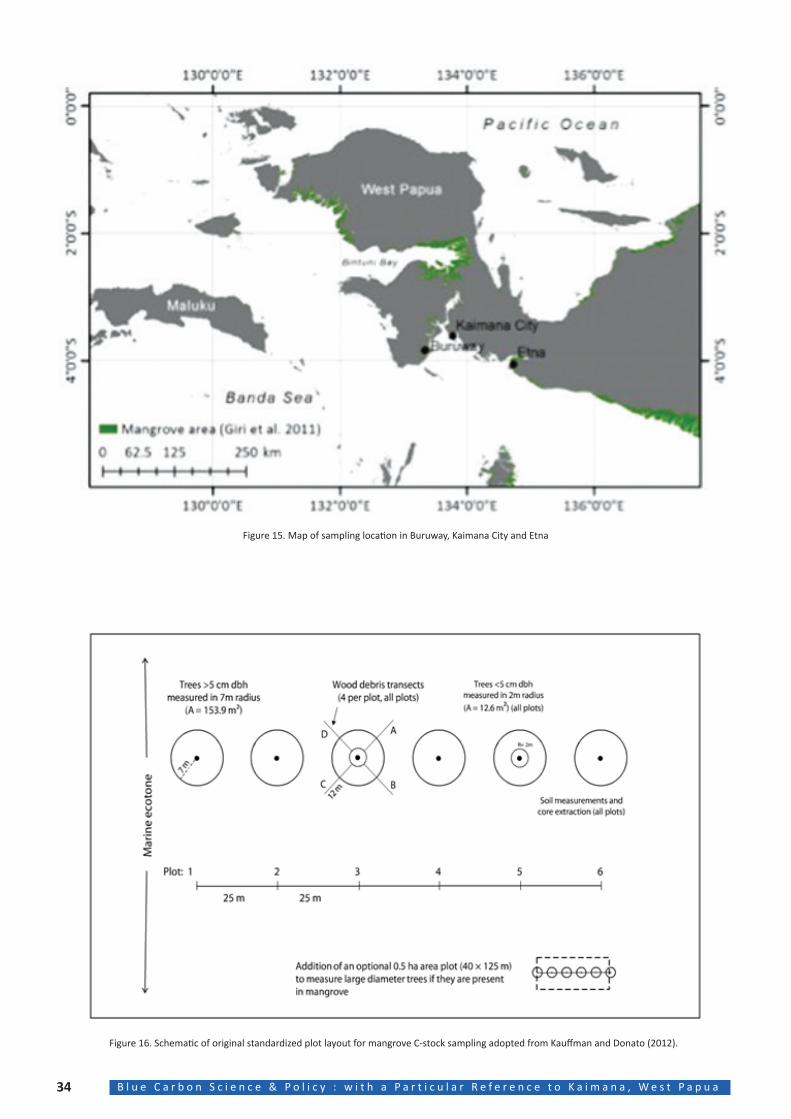
34 B l u e C a r b o n S c i e n c e & P o l i c y : w i t h a P a r t i c u l a r R e f e r e n c e t o K a i m a n a , W e s t P a p u a
Figure 15. Map of sampling location in Buruway, Kaimana City and Etna
Figure 16. Schematic of original standardized plot layout for mangrove C-stock sampling adopted from Kauffman and Donato (2012).
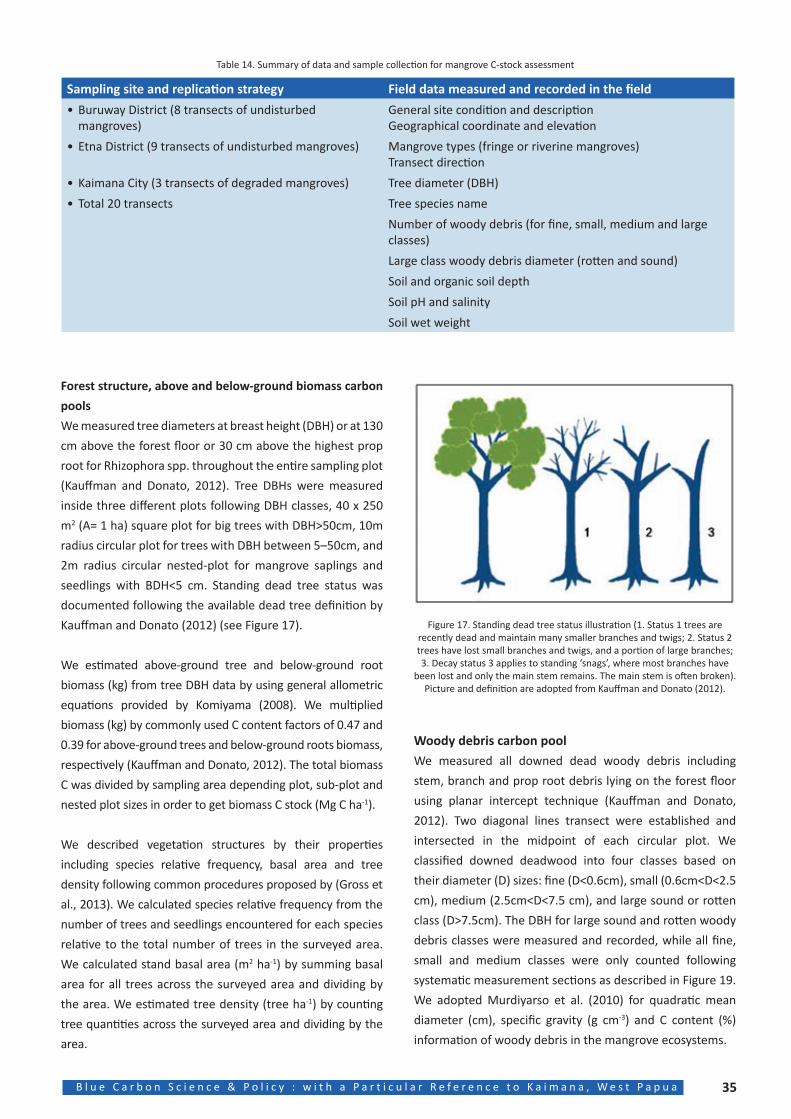
35B l u e C a r b o n S c i e n c e & P o l i c y : w i t h a P a r t i c u l a r R e f e r e n c e t o K a i m a n a , W e s t P a p u a
Forest structure, above and below-ground biomass carbon
pools
We measured tree diameters at breast height (DBH) or at 130
cm above the forest floor or 30 cm above the highest prop
root for Rhizophora spp. throughout the entire sampling plot
(Kauffman and Donato, 2012). Tree DBHs were measured
inside three different plots following DBH classes, 40 x 250
m2 (A= 1 ha) square plot for big trees with DBH>50cm, 10m
radius circular plot for trees with DBH between 5–50cm, and
2m radius circular nested-plot for mangrove saplings and
seedlings with BDH<5 cm. Standing dead tree status was
documented following the available dead tree definition by
Kauffman and Donato (2012) (see Figure 17).
We estimated above-ground tree and below-ground root
biomass (kg) from tree DBH data by using general allometric
equations provided by Komiyama (2008). We multiplied
biomass (kg) by commonly used C content factors of 0.47 and
0.39 for above-ground trees and below-ground roots biomass,
respectively (Kauffman and Donato, 2012). The total biomass
C was divided by sampling area depending plot, sub-plot and
nested plot sizes in order to get biomass C stock (Mg C ha-1).
We described vegetation structures by their properties
including species relative frequency, basal area and tree
density following common procedures proposed by (Gross et
al., 2013). We calculated species relative frequency from the
number of trees and seedlings encountered for each species
relative to the total number of trees in the surveyed area.
We calculated stand basal area (m2 ha-1) by summing basal
area for all trees across the surveyed area and dividing by
the area. We estimated tree density (tree ha-1) by counting
tree quantities across the surveyed area and dividing by the
area.
Sampling site and replication strategy Field data measured and recorded in the field
• Buruway District (8 transects of undisturbed mangroves)
General site condition and descriptionGeographical coordinate and elevation
• Etna District (9 transects of undisturbed mangroves) Mangrove types (fringe or riverine mangroves)Transect direction
• Kaimana City (3 transects of degraded mangroves) Tree diameter (DBH)
• Total 20 transects Tree species name
Number of woody debris (for fine, small, medium and large classes)
Large class woody debris diameter (rotten and sound)
Soil and organic soil depth
Soil pH and salinity
Soil wet weight
Table 14. Summary of data and sample collection for mangrove C-stock assessment
Figure 17. Standing dead tree status illustration (1. Status 1 trees are recently dead and maintain many smaller branches and twigs; 2. Status 2 trees have lost small branches and twigs, and a portion of large branches; 3. Decay status 3 applies to standing ‘snags’, where most branches have
been lost and only the main stem remains. The main stem is often broken). Picture and definition are adopted from Kauffman and Donato (2012).
Woody debris carbon poolWe measured all downed dead woody debris including
stem, branch and prop root debris lying on the forest floor
using planar intercept technique (Kauffman and Donato,
2012). Two diagonal lines transect were established and
intersected in the midpoint of each circular plot. We
classified downed deadwood into four classes based on
their diameter (D) sizes: fine (D<0.6cm), small (0.6cm<D<2.5
cm), medium (2.5cm<D<7.5 cm), and large sound or rotten
class (D>7.5cm). The DBH for large sound and rotten woody
debris classes were measured and recorded, while all fine,
small and medium classes were only counted following
systematic measurement sections as described in Figure 19.
We adopted Murdiyarso et al. (2010) for quadratic mean
diameter (cm), specific gravity (g cm-3) and C content (%)
information of woody debris in the mangrove ecosystems.
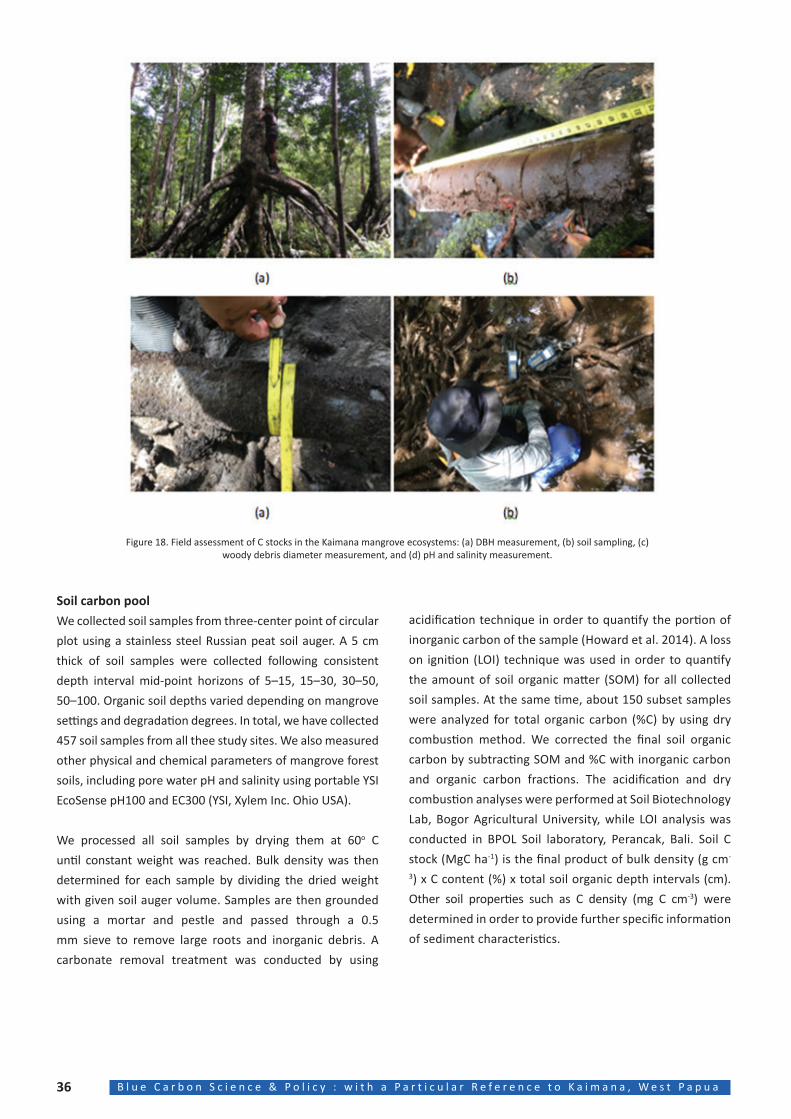
36 B l u e C a r b o n S c i e n c e & P o l i c y : w i t h a P a r t i c u l a r R e f e r e n c e t o K a i m a n a , W e s t P a p u a
Soil carbon poolWe collected soil samples from three-center point of circular
plot using a stainless steel Russian peat soil auger. A 5 cm
thick of soil samples were collected following consistent
depth interval mid-point horizons of 5–15, 15–30, 30–50,
50–100. Organic soil depths varied depending on mangrove
settings and degradation degrees. In total, we have collected
457 soil samples from all thee study sites. We also measured
other physical and chemical parameters of mangrove forest
soils, including pore water pH and salinity using portable YSI
EcoSense pH100 and EC300 (YSI, Xylem Inc. Ohio USA).
We processed all soil samples by drying them at 60o C
until constant weight was reached. Bulk density was then
determined for each sample by dividing the dried weight
with given soil auger volume. Samples are then grounded
using a mortar and pestle and passed through a 0.5
mm sieve to remove large roots and inorganic debris. A
carbonate removal treatment was conducted by using
acidification technique in order to quantify the portion of
inorganic carbon of the sample (Howard et al. 2014). A loss
on ignition (LOI) technique was used in order to quantify
the amount of soil organic matter (SOM) for all collected
soil samples. At the same time, about 150 subset samples
were analyzed for total organic carbon (%C) by using dry
combustion method. We corrected the final soil organic
carbon by subtracting SOM and %C with inorganic carbon
and organic carbon fractions. The acidification and dry
combustion analyses were performed at Soil Biotechnology
Lab, Bogor Agricultural University, while LOI analysis was
conducted in BPOL Soil laboratory, Perancak, Bali. Soil C
stock (MgC ha-1) is the final product of bulk density (g cm-
3) x C content (%) x total soil organic depth intervals (cm).
Other soil properties such as C density (mg C cm-3) were
determined in order to provide further specific information
of sediment characteristics.
Figure 18. Field assessment of C stocks in the Kaimana mangrove ecosystems: (a) DBH measurement, (b) soil sampling, (c) woody debris diameter measurement, and (d) pH and salinity measurement.
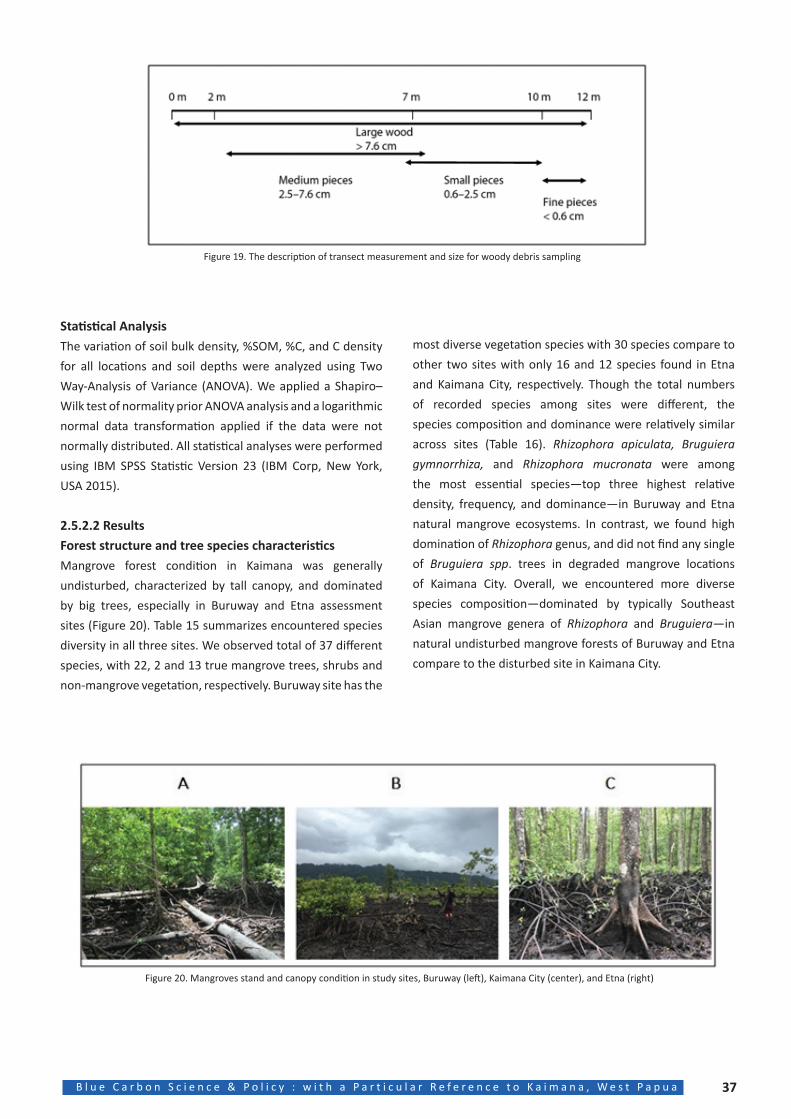
37B l u e C a r b o n S c i e n c e & P o l i c y : w i t h a P a r t i c u l a r R e f e r e n c e t o K a i m a n a , W e s t P a p u a
most diverse vegetation species with 30 species compare to
other two sites with only 16 and 12 species found in Etna
and Kaimana City, respectively. Though the total numbers
of recorded species among sites were different, the
species composition and dominance were relatively similar
across sites (Table 16). Rhizophora apiculata, Bruguiera gymnorrhiza, and Rhizophora mucronata were among
the most essential species—top three highest relative
density, frequency, and dominance—in Buruway and Etna
natural mangrove ecosystems. In contrast, we found high
domination of Rhizophora genus, and did not find any single
of Bruguiera spp. trees in degraded mangrove locations
of Kaimana City. Overall, we encountered more diverse
species composition—dominated by typically Southeast
Asian mangrove genera of Rhizophora and Bruguiera—in
natural undisturbed mangrove forests of Buruway and Etna
compare to the disturbed site in Kaimana City.
Statistical AnalysisThe variation of soil bulk density, %SOM, %C, and C density
for all locations and soil depths were analyzed using Two
Way-Analysis of Variance (ANOVA). We applied a Shapiro–
Wilk test of normality prior ANOVA analysis and a logarithmic
normal data transformation applied if the data were not
normally distributed. All statistical analyses were performed
using IBM SPSS Statistic Version 23 (IBM Corp, New York,
USA 2015).
2.5.2.2 ResultsForest structure and tree species characteristicsMangrove forest condition in Kaimana was generally
undisturbed, characterized by tall canopy, and dominated
by big trees, especially in Buruway and Etna assessment
sites (Figure 20). Table 15 summarizes encountered species
diversity in all three sites. We observed total of 37 different
species, with 22, 2 and 13 true mangrove trees, shrubs and
non-mangrove vegetation, respectively. Buruway site has the
Figure 20. Mangroves stand and canopy condition in study sites, Buruway (left), Kaimana City (center), and Etna (right)
Figure 19. The description of transect measurement and size for woody debris sampling
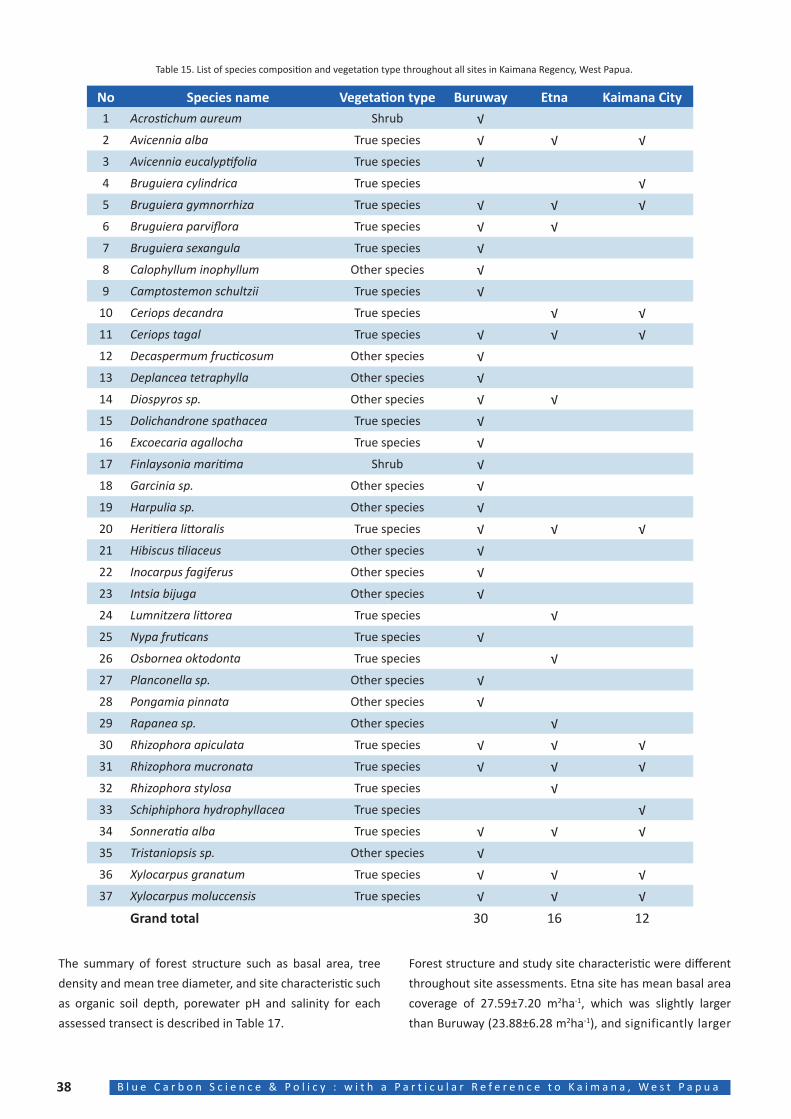
38 B l u e C a r b o n S c i e n c e & P o l i c y : w i t h a P a r t i c u l a r R e f e r e n c e t o K a i m a n a , W e s t P a p u a
Table 15. List of species composition and vegetation type throughout all sites in Kaimana Regency, West Papua.
No Species name Vegetation type Buruway Etna Kaimana City1 Acrostichum aureum Shrub √2 Avicennia alba True species √ √ √3 Avicennia eucalyptifolia True species √4 Bruguiera cylindrica True species √5 Bruguiera gymnorrhiza True species √ √ √6 Bruguiera parviflora True species √ √7 Bruguiera sexangula True species √8 Calophyllum inophyllum Other species √9 Camptostemon schultzii True species √
10 Ceriops decandra True species √ √11 Ceriops tagal True species √ √ √12 Decaspermum fructicosum Other species √13 Deplancea tetraphylla Other species √14 Diospyros sp. Other species √ √15 Dolichandrone spathacea True species √16 Excoecaria agallocha True species √17 Finlaysonia maritima Shrub √18 Garcinia sp. Other species √19 Harpulia sp. Other species √20 Heritiera littoralis True species √ √ √21 Hibiscus tiliaceus Other species √22 Inocarpus fagiferus Other species √23 Intsia bijuga Other species √24 Lumnitzera littorea True species √25 Nypa fruticans True species √26 Osbornea oktodonta True species √27 Planconella sp. Other species √28 Pongamia pinnata Other species √29 Rapanea sp. Other species √30 Rhizophora apiculata True species √ √ √31 Rhizophora mucronata True species √ √ √32 Rhizophora stylosa True species √33 Schiphiphora hydrophyllacea True species √34 Sonneratia alba True species √ √ √35 Tristaniopsis sp. Other species √36 Xylocarpus granatum True species √ √ √37 Xylocarpus moluccensis True species √ √ √
Grand total 30 16 12
The summary of forest structure such as basal area, tree
density and mean tree diameter, and site characteristic such
as organic soil depth, porewater pH and salinity for each
assessed transect is described in Table 17.
Forest structure and study site characteristic were different
throughout site assessments. Etna site has mean basal area
coverage of 27.59±7.20 m2ha-1, which was slightly larger
than Buruway (23.88±6.28 m2ha-1), and significantly larger
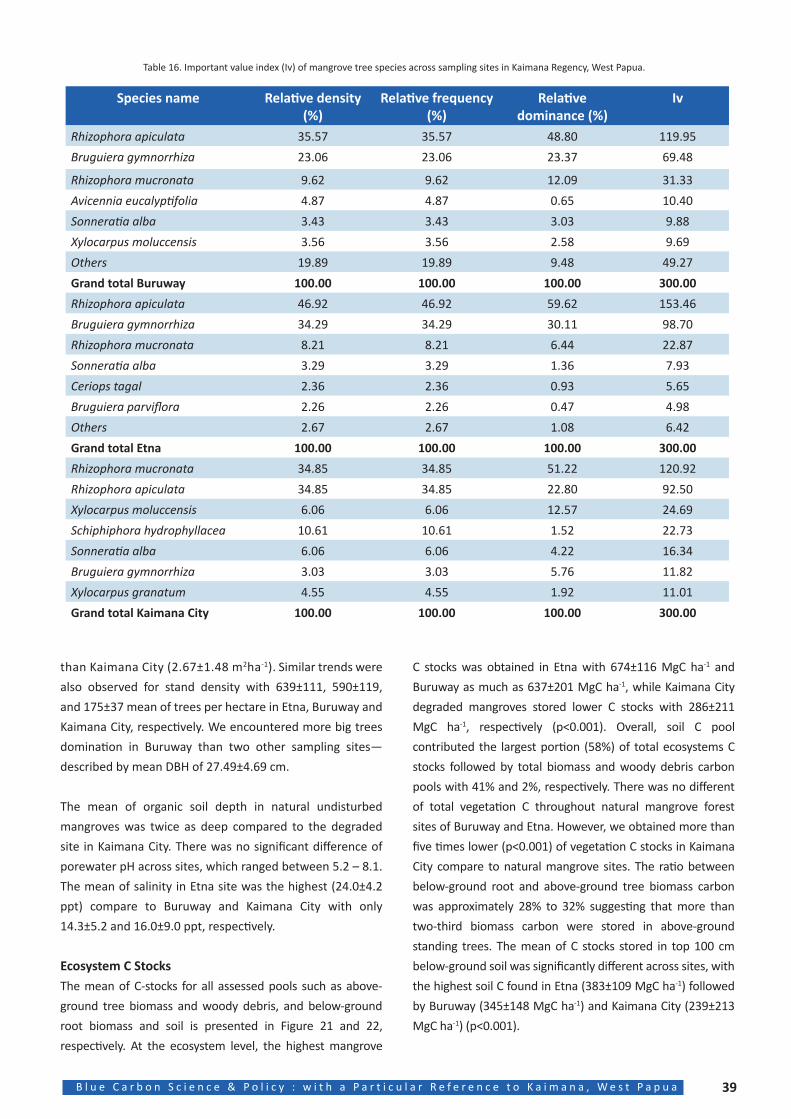
39B l u e C a r b o n S c i e n c e & P o l i c y : w i t h a P a r t i c u l a r R e f e r e n c e t o K a i m a n a , W e s t P a p u a
Table 16. Important value index (Iv) of mangrove tree species across sampling sites in Kaimana Regency, West Papua.
Species name Relative density (%)
Relative frequency (%)
Relative dominance (%)
Iv
Rhizophora apiculata 35.57 35.57 48.80 119.95
Bruguiera gymnorrhiza 23.06 23.06 23.37 69.48
Rhizophora mucronata 9.62 9.62 12.09 31.33
Avicennia eucalyptifolia 4.87 4.87 0.65 10.40
Sonneratia alba 3.43 3.43 3.03 9.88
Xylocarpus moluccensis 3.56 3.56 2.58 9.69
Others 19.89 19.89 9.48 49.27
Grand total Buruway 100.00 100.00 100.00 300.00
Rhizophora apiculata 46.92 46.92 59.62 153.46
Bruguiera gymnorrhiza 34.29 34.29 30.11 98.70
Rhizophora mucronata 8.21 8.21 6.44 22.87
Sonneratia alba 3.29 3.29 1.36 7.93
Ceriops tagal 2.36 2.36 0.93 5.65
Bruguiera parviflora 2.26 2.26 0.47 4.98
Others 2.67 2.67 1.08 6.42
Grand total Etna 100.00 100.00 100.00 300.00
Rhizophora mucronata 34.85 34.85 51.22 120.92
Rhizophora apiculata 34.85 34.85 22.80 92.50
Xylocarpus moluccensis 6.06 6.06 12.57 24.69
Schiphiphora hydrophyllacea 10.61 10.61 1.52 22.73
Sonneratia alba 6.06 6.06 4.22 16.34
Bruguiera gymnorrhiza 3.03 3.03 5.76 11.82
Xylocarpus granatum 4.55 4.55 1.92 11.01
Grand total Kaimana City 100.00 100.00 100.00 300.00
C stocks was obtained in Etna with 674±116 MgC ha-1 and
Buruway as much as 637±201 MgC ha-1, while Kaimana City
degraded mangroves stored lower C stocks with 286±211
MgC ha-1, respectively (p<0.001). Overall, soil C pool
contributed the largest portion (58%) of total ecosystems C
stocks followed by total biomass and woody debris carbon
pools with 41% and 2%, respectively. There was no different
of total vegetation C throughout natural mangrove forest
sites of Buruway and Etna. However, we obtained more than
five times lower (p<0.001) of vegetation C stocks in Kaimana
City compare to natural mangrove sites. The ratio between
below-ground root and above-ground tree biomass carbon
was approximately 28% to 32% suggesting that more than
two-third biomass carbon were stored in above-ground
standing trees. The mean of C stocks stored in top 100 cm
below-ground soil was significantly different across sites, with
the highest soil C found in Etna (383±109 MgC ha-1) followed
by Buruway (345±148 MgC ha-1) and Kaimana City (239±213
MgC ha-1) (p<0.001).
than Kaimana City (2.67±1.48 m2ha-1). Similar trends were
also observed for stand density with 639±111, 590±119,
and 175±37 mean of trees per hectare in Etna, Buruway and
Kaimana City, respectively. We encountered more big trees
domination in Buruway than two other sampling sites—
described by mean DBH of 27.49±4.69 cm.
The mean of organic soil depth in natural undisturbed
mangroves was twice as deep compared to the degraded
site in Kaimana City. There was no significant difference of
porewater pH across sites, which ranged between 5.2 – 8.1.
The mean of salinity in Etna site was the highest (24.0±4.2
ppt) compare to Buruway and Kaimana City with only
14.3±5.2 and 16.0±9.0 ppt, respectively.
Ecosystem C StocksThe mean of C-stocks for all assessed pools such as above-
ground tree biomass and woody debris, and below-ground
root biomass and soil is presented in Figure 21 and 22,
respectively. At the ecosystem level, the highest mangrove
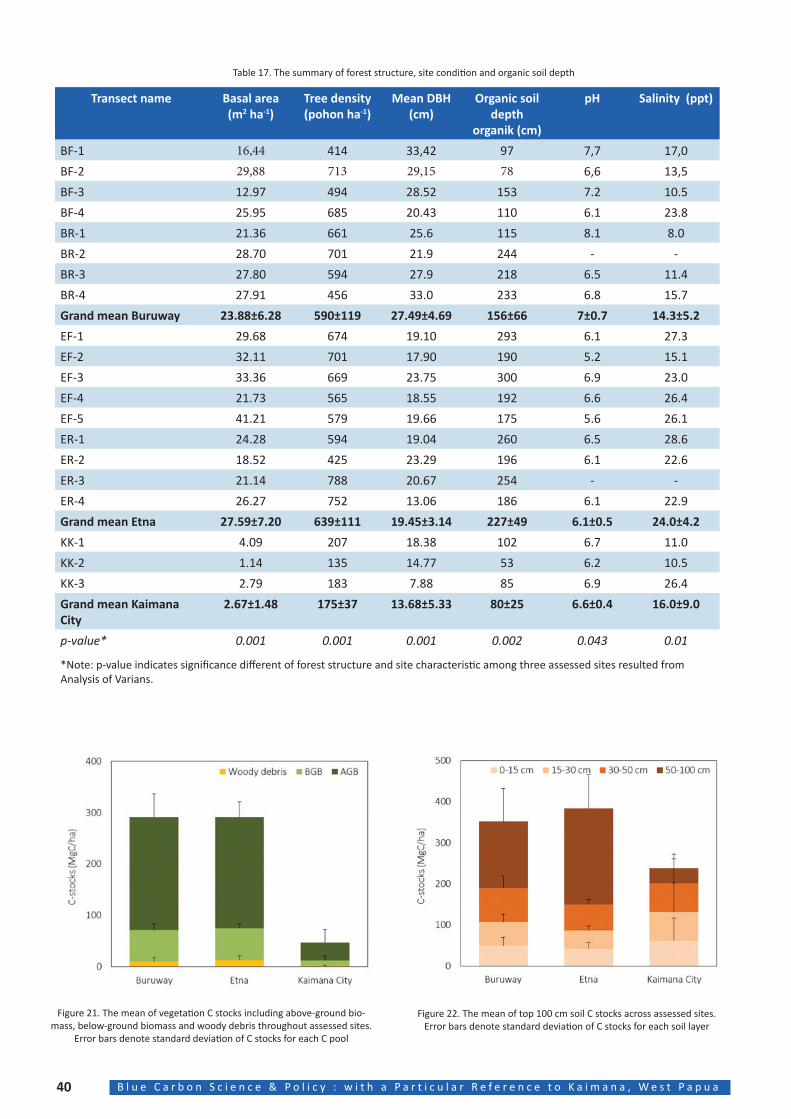
40 B l u e C a r b o n S c i e n c e & P o l i c y : w i t h a P a r t i c u l a r R e f e r e n c e t o K a i m a n a , W e s t P a p u a
Transect name Basal area(m2 ha-1)
Tree density(pohon ha-1)
Mean DBH (cm)
Organic soil depth
organik (cm)
pH Salinity (ppt)
BF-1 16,44 414 33,42 97 7,7 17,0
BF-2 29,88 713 29,15 78 6,6 13,5
BF-3 12.97 494 28.52 153 7.2 10.5
BF-4 25.95 685 20.43 110 6.1 23.8
BR-1 21.36 661 25.6 115 8.1 8.0
BR-2 28.70 701 21.9 244 - -
BR-3 27.80 594 27.9 218 6.5 11.4
BR-4 27.91 456 33.0 233 6.8 15.7
Grand mean Buruway 23.88±6.28 590±119 27.49±4.69 156±66 7±0.7 14.3±5.2
EF-1 29.68 674 19.10 293 6.1 27.3
EF-2 32.11 701 17.90 190 5.2 15.1
EF-3 33.36 669 23.75 300 6.9 23.0
EF-4 21.73 565 18.55 192 6.6 26.4
EF-5 41.21 579 19.66 175 5.6 26.1
ER-1 24.28 594 19.04 260 6.5 28.6
ER-2 18.52 425 23.29 196 6.1 22.6
ER-3 21.14 788 20.67 254 - -
ER-4 26.27 752 13.06 186 6.1 22.9
Grand mean Etna 27.59±7.20 639±111 19.45±3.14 227±49 6.1±0.5 24.0±4.2
KK-1 4.09 207 18.38 102 6.7 11.0
KK-2 1.14 135 14.77 53 6.2 10.5
KK-3 2.79 183 7.88 85 6.9 26.4
Grand mean Kaimana City
2.67±1.48 175±37 13.68±5.33 80±25 6.6±0.4 16.0±9.0
p-value* 0.001 0.001 0.001 0.002 0.043 0.01
Table 17. The summary of forest structure, site condition and organic soil depth
*Note: p-value indicates significance different of forest structure and site characteristic among three assessed sites resulted from Analysis of Varians.
Figure 21. The mean of vegetation C stocks including above-ground bio-mass, below-ground biomass and woody debris throughout assessed sites.
Error bars denote standard deviation of C stocks for each C pool
Figure 22. The mean of top 100 cm soil C stocks across assessed sites. Error bars denote standard deviation of C stocks for each soil layer
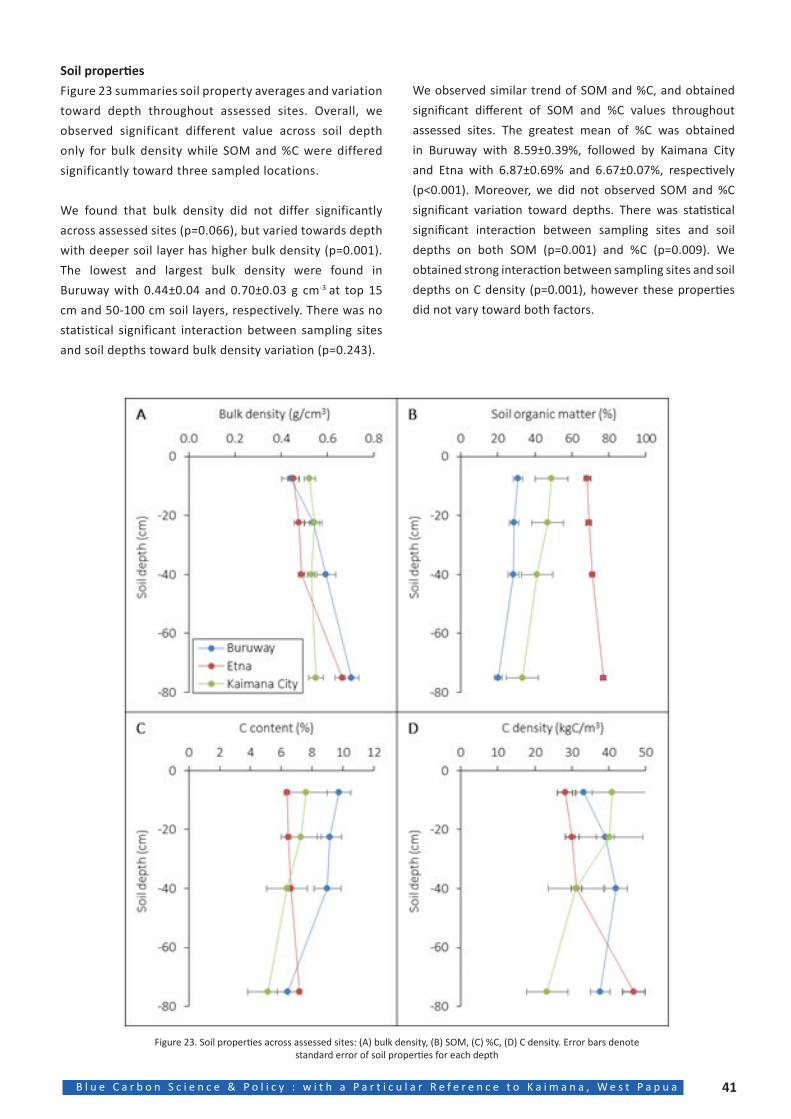
41B l u e C a r b o n S c i e n c e & P o l i c y : w i t h a P a r t i c u l a r R e f e r e n c e t o K a i m a n a , W e s t P a p u a
Soil propertiesFigure 23 summaries soil property averages and variation
toward depth throughout assessed sites. Overall, we
observed significant different value across soil depth
only for bulk density while SOM and %C were differed
significantly toward three sampled locations.
We found that bulk density did not differ significantly
across assessed sites (p=0.066), but varied towards depth
with deeper soil layer has higher bulk density (p=0.001).
The lowest and largest bulk density were found in
Buruway with 0.44±0.04 and 0.70±0.03 g cm-3 at top 15
cm and 50-100 cm soil layers, respectively. There was no
statistical significant interaction between sampling sites
and soil depths toward bulk density variation (p=0.243).
We observed similar trend of SOM and %C, and obtained
significant different of SOM and %C values throughout
assessed sites. The greatest mean of %C was obtained
in Buruway with 8.59±0.39%, followed by Kaimana City
and Etna with 6.87±0.69% and 6.67±0.07%, respectively
(p<0.001). Moreover, we did not observed SOM and %C
significant variation toward depths. There was statistical
significant interaction between sampling sites and soil
depths on both SOM (p=0.001) and %C (p=0.009). We
obtained strong interaction between sampling sites and soil
depths on C density (p=0.001), however these properties
did not vary toward both factors.
Figure 23. Soil properties across assessed sites: (A) bulk density, (B) SOM, (C) %C, (D) C density. Error bars denote standard error of soil properties for each depth
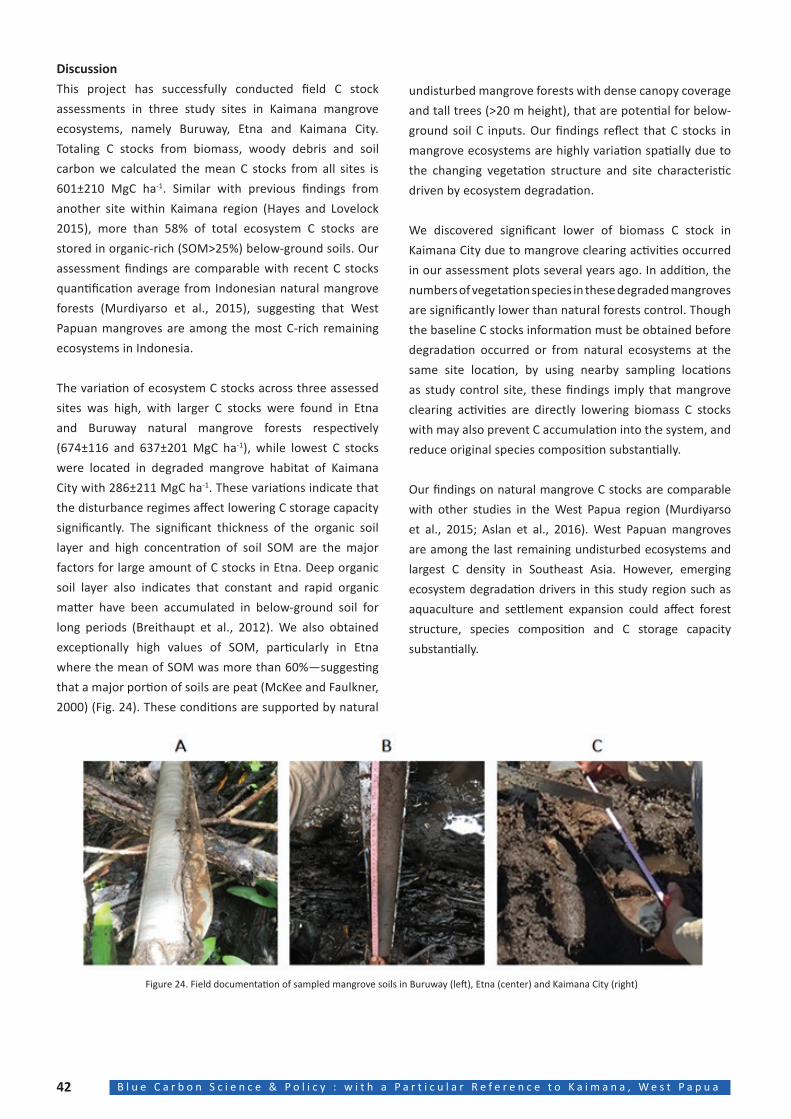
42 B l u e C a r b o n S c i e n c e & P o l i c y : w i t h a P a r t i c u l a r R e f e r e n c e t o K a i m a n a , W e s t P a p u a
DiscussionThis project has successfully conducted field C stock
assessments in three study sites in Kaimana mangrove
ecosystems, namely Buruway, Etna and Kaimana City.
Totaling C stocks from biomass, woody debris and soil
carbon we calculated the mean C stocks from all sites is
601±210 MgC ha-1. Similar with previous findings from
another site within Kaimana region (Hayes and Lovelock
2015), more than 58% of total ecosystem C stocks are
stored in organic-rich (SOM>25%) below-ground soils. Our
assessment findings are comparable with recent C stocks
quantification average from Indonesian natural mangrove
forests (Murdiyarso et al., 2015), suggesting that West
Papuan mangroves are among the most C-rich remaining
ecosystems in Indonesia.
The variation of ecosystem C stocks across three assessed
sites was high, with larger C stocks were found in Etna
and Buruway natural mangrove forests respectively
(674±116 and 637±201 MgC ha-1), while lowest C stocks
were located in degraded mangrove habitat of Kaimana
City with 286±211 MgC ha-1. These variations indicate that
the disturbance regimes affect lowering C storage capacity
significantly. The significant thickness of the organic soil
layer and high concentration of soil SOM are the major
factors for large amount of C stocks in Etna. Deep organic
soil layer also indicates that constant and rapid organic
matter have been accumulated in below-ground soil for
long periods (Breithaupt et al., 2012). We also obtained
exceptionally high values of SOM, particularly in Etna
where the mean of SOM was more than 60%—suggesting
that a major portion of soils are peat (McKee and Faulkner,
2000) (Fig. 24). These conditions are supported by natural
undisturbed mangrove forests with dense canopy coverage
and tall trees (>20 m height), that are potential for below-
ground soil C inputs. Our findings reflect that C stocks in
mangrove ecosystems are highly variation spatially due to
the changing vegetation structure and site characteristic
driven by ecosystem degradation.
We discovered significant lower of biomass C stock in
Kaimana City due to mangrove clearing activities occurred
in our assessment plots several years ago. In addition, the
numbers of vegetation species in these degraded mangroves
are significantly lower than natural forests control. Though
the baseline C stocks information must be obtained before
degradation occurred or from natural ecosystems at the
same site location, by using nearby sampling locations
as study control site, these findings imply that mangrove
clearing activities are directly lowering biomass C stocks
with may also prevent C accumulation into the system, and
reduce original species composition substantially.
Our findings on natural mangrove C stocks are comparable
with other studies in the West Papua region (Murdiyarso
et al., 2015; Aslan et al., 2016). West Papuan mangroves
are among the last remaining undisturbed ecosystems and
largest C density in Southeast Asia. However, emerging
ecosystem degradation drivers in this study region such as
aquaculture and settlement expansion could affect forest
structure, species composition and C storage capacity
substantially.
Figure 24. Field documentation of sampled mangrove soils in Buruway (left), Etna (center) and Kaimana City (right)
43B l u e C a r b o n S c i e n c e & P o l i c y : w i t h a P a r t i c u l a r R e f e r e n c e t o K a i m a n a , W e s t P a p u a
The government plays an important role in
mainstreaming blue carbon in Indonesia,
considering that it involves different government
institutions and various stakeholders. Integrated policies
and coordinated institutional arrangements will create
blue carbon governance that benefits the people and
contributes positively to the environment.
In global context, Indonesia supports the UNFCCC (United
Nations Framework Convention on Climate Change), not
only as part of its global responsibility, but also because
of a realization that as an archipelagic state, Indonesia
is particularly vulnerable to impacts of climate change.
Furthermore, Indonesia is also one of the top contributors
to carbon emissions from forest land use change, forest
fire, industry, transportation, etc. The government’s formal
support for the global treaty takes for as Law No. 6 of 1994 on
the Ratification of the United Nations Framework Convention
on Climate Change. This law confirms Indonesia’s active
participation alongside other members of international
community in preventing rising atmospheric concentrations
of greenhouse gases.
3.1 NATIONAL TARGET FOR NDCThe UNFCCC is an international treaty adopted in the
1992 Earth Summit in Rio de Janeiro, Brazil. It entered into
force in 1994 after a sufficient number of countries had
ratified it. In general, the UNFCCC’s objective is to stabilize
greenhouse gas concentrations in the atmosphere at
a level that would prevent dangerous anthropogenic
interference with the climate system.
The signatories to the UNFCCC meet in regular meetings
known as Conferences of the Parties (COP) to discuss
issues related to a global effort to address climate
change. The third session of the COP (COP3) in 1997 in
Kyoto, Japan adopted the Kyoto Protocol, to which the
parties agree to lower their greenhouse gas emissions
to 5% below the 1990 level in the period of 2008-2012.
However, compared to the emission levels that would
be expected by 2010 without the Kyoto Protocol, this
limitation represents a 29% cut.
The Kyoto Protocol is agreed based on the principle of
common but differentiated responsibilities, which means
that the world’s countries have a common responsibility
but at differentiated portions. In this case, developed
countries should take the lead in reducing greenhouse
gas emissions on the basis that they are historically
responsible for producing greenhouse gases since
the industrialization period. Meanwhile, developing
countries have no obligation to reduce their greenhouse
gas emissions and instead are entitled to support from
developed countries to lower their greenhouse gas
emissions voluntarily. Agreed mechanisms include
Joint Implementation, Emissions Trading, and Clean
Development Mechanism.
Developed countries are called Annex-1 countries,
while developing countries are non-Annex 1 countries.
Indonesia ratified the Kyoto Protocol under Law No.
17 of 2004 on the Ratification of the Kyoto Protocol to
The United Nations Framework Convention on Climate
Change. As a developing (non-Annex 1) country, Indonesia
has no-binding target for emission reduction based on
the Kyoto Protocol.
Further to the COP13 in Bali, which adopted the Bali
Action Plan, and the COP16 in Cancun, Mexico, the
Government of Indonesia has pledged to reduce
greenhouse gas emissions by 26% on its own efforts and
41% with international support against the business as
usual (BAU) scenario by 2020. The target is included in
the Presidential Regulation No. 61 of 2011 (Presidential
Regulation 61/2011) on the Action Plan for Greenhouse
Gas Emission reduction (Rencana Aksi Nasional Penurunan Emisi Gas Rumah Kaca/RAN GRK).
According to the Presidential Regulation 61/2011, RAN GRK
is a work plan for implementing activities that directly and
indirectly reduce greenhouse gas emissions consistent with
the national development targets. The core activities under
the greenhouse gas emission reduction target (26% & 41%)
are divided into five sectors (Appendix I), i.e. agriculture,
forestry and peatland, energy and transportation, industry,
and waste management. In addition to the core sectors,
the regulation proposes other supporting activities
(Appendix II) assigned to different ministries/institutions,
i.e. Meteorological, Climatological, and Geophysical Agency
(Badan Meteorologi, Klimatologi, dan Geofisika/BMKG);
Ministry of Environment; Ministry of Marine Affairs and
Fisheries; and cross-sector collaboration. No target of
emission reduction is set for the supporting activities.
3 BLUE CARBON RELATED POLICIES AND REGULATIONS IN INDONESIA
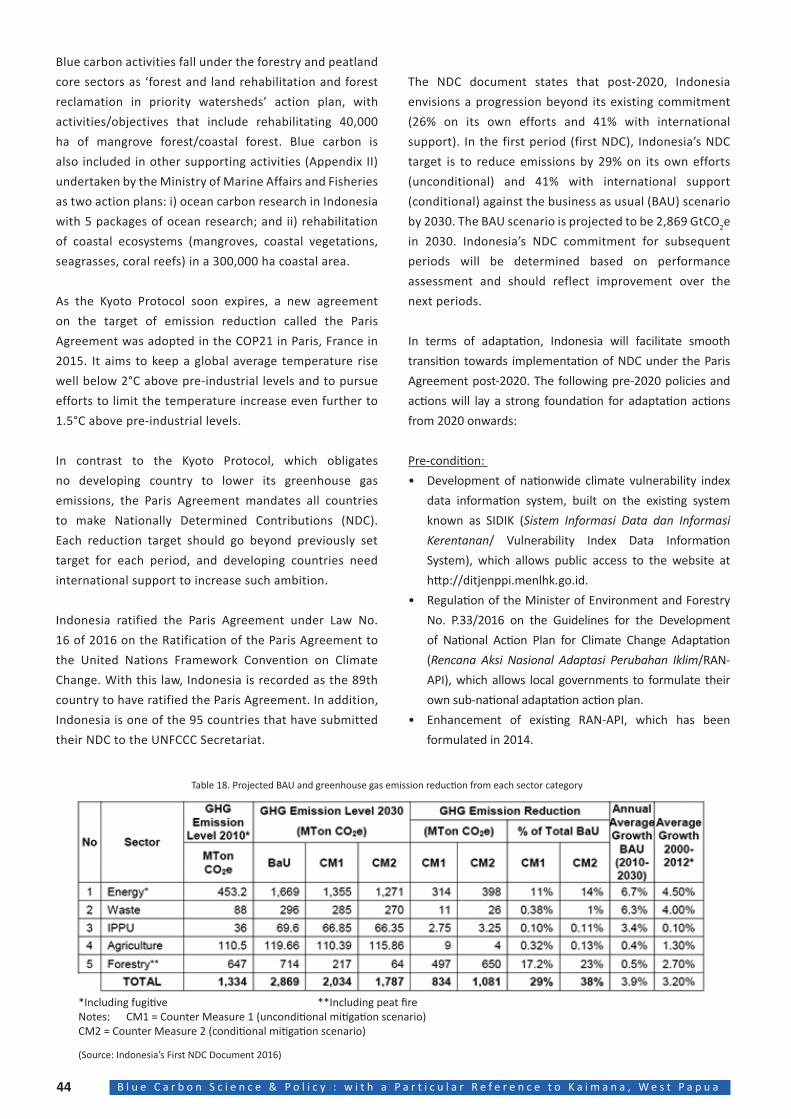
44 B l u e C a r b o n S c i e n c e & P o l i c y : w i t h a P a r t i c u l a r R e f e r e n c e t o K a i m a n a , W e s t P a p u a
Blue carbon activities fall under the forestry and peatland
core sectors as ‘forest and land rehabilitation and forest
reclamation in priority watersheds’ action plan, with
activities/objectives that include rehabilitating 40,000
ha of mangrove forest/coastal forest. Blue carbon is
also included in other supporting activities (Appendix II)
undertaken by the Ministry of Marine Affairs and Fisheries
as two action plans: i) ocean carbon research in Indonesia
with 5 packages of ocean research; and ii) rehabilitation
of coastal ecosystems (mangroves, coastal vegetations,
seagrasses, coral reefs) in a 300,000 ha coastal area.
As the Kyoto Protocol soon expires, a new agreement
on the target of emission reduction called the Paris
Agreement was adopted in the COP21 in Paris, France in
2015. It aims to keep a global average temperature rise
well below 2°C above pre-industrial levels and to pursue
efforts to limit the temperature increase even further to
1.5°C above pre-industrial levels.
In contrast to the Kyoto Protocol, which obligates
no developing country to lower its greenhouse gas
emissions, the Paris Agreement mandates all countries
to make Nationally Determined Contributions (NDC).
Each reduction target should go beyond previously set
target for each period, and developing countries need
international support to increase such ambition.
Indonesia ratified the Paris Agreement under Law No.
16 of 2016 on the Ratification of the Paris Agreement to
the United Nations Framework Convention on Climate
Change. With this law, Indonesia is recorded as the 89th
country to have ratified the Paris Agreement. In addition,
Indonesia is one of the 95 countries that have submitted
their NDC to the UNFCCC Secretariat.
The NDC document states that post-2020, Indonesia
envisions a progression beyond its existing commitment
(26% on its own efforts and 41% with international
support). In the first period (first NDC), Indonesia’s NDC
target is to reduce emissions by 29% on its own efforts
(unconditional) and 41% with international support
(conditional) against the business as usual (BAU) scenario
by 2030. The BAU scenario is projected to be 2,869 GtCO2e
in 2030. Indonesia’s NDC commitment for subsequent
periods will be determined based on performance
assessment and should reflect improvement over the
next periods.
In terms of adaptation, Indonesia will facilitate smooth
transition towards implementation of NDC under the Paris
Agreement post-2020. The following pre-2020 policies and
actions will lay a strong foundation for adaptation actions
from 2020 onwards:
Pre-condition:
• Development of nationwide climate vulnerability index
data information system, built on the existing system
known as SIDIK (Sistem Informasi Data dan Informasi Kerentanan/ Vulnerability Index Data Information
System), which allows public access to the website at
http://ditjenppi.menlhk.go.id.
• Regulation of the Minister of Environment and Forestry
No. P.33/2016 on the Guidelines for the Development
of National Action Plan for Climate Change Adaptation
(Rencana Aksi Nasional Adaptasi Perubahan Iklim/RAN-
API), which allows local governments to formulate their
own sub-national adaptation action plan.
• Enhancement of existing RAN-API, which has been
formulated in 2014.
(Source: Indonesia’s First NDC Document 2016)
Table 18. Projected BAU and greenhouse gas emission reduction from each sector category
*Including fugitive **Including peat fireNotes: CM1 = Counter Measure 1 (unconditional mitigation scenario)CM2 = Counter Measure 2 (conditional mitigation scenario)
45B l u e C a r b o n S c i e n c e & P o l i c y : w i t h a P a r t i c u l a r R e f e r e n c e t o K a i m a n a , W e s t P a p u a
Environment and Socio-economic area:
• Law No. 37/2014 on Soil and Water Conservation, which
leads to sustainable agriculture and land use. The law
guides stakeholders in conserving lands and increasing
productivity towards conservation agricultural approach.
• Governmental Regulation No. 37/2012 on Watershed
Management, which leads to enhanced watershed
carrying capacity. The regulation provides guideline to
identify watersheds that need to be protected, restored,
and rehabilitated.
• Community-based forest management will enhance
community income and at the same time reduce
pressure on primary forests that leads to deforestation
and forest degradation.
• Enhance role of ProKlim (joint climate change adaptation
and mitigation) as a bottom-up approach in village-
level climate resilience program. ProKlim will enable
to account for its contribution to the achievement of
greenhouse gas emission reduction both pre- and post-
2020.
3.2 BLUE CARBON ECOSYSTEM CONTRIBUTIONThe NDC target is divided into five sectors, i.e. forestry
(17.2%), energy (11%), agriculture (0.32%), industry (0.10%),
and waste (0.38%). Blue carbon ecosystems, especially
mangroves, have the potential to contribute to achieving
the NDC target through the forestry sector. Meanwhile,
contributions from other blue carbon ecosystems, i.e.
seagrass meadows and tidal marshes, greenhouse gas
emission reduction are harder to account for since they are
not included in the five designated sectors.
Indonesia is a country with the largest mangrove ecosystems
in the world, covering an extensive area of more than 31
million hectares, containing 23% of the world’s mangroves.
Australia is the second largest, with an area of less than 1
million hectares, containing 7% of the world’s mangroves.
The world’s potential carbon stocks in blue carbon
ecosystems (mangroves, seagrass meadows, and tidal
marshes) are estimated at 1 billion tons (1015 gr C), of which
3.315 gr C is stored in Indonesia.
In climate change mitigation context, forest plays an
important role since the primary source of emissions in
Indonesia (63%) in 2005 was land use changes and forest and
land fires. In 2012, the top contributor to emissions (47.8%)
was the LUCF (Land-Use Change and Forestry) sector, which
includes peat fires.
The COP13 in Bali in 2007 adopted the Bali Action Plan. One
of its key points is to agree on an REDD (Reducing Emissions
from Deforestation and Forest Degradation) scheme, which
is a mechanism to reduce greenhouse gas emissions by
compensating the parties for preventing deforestation
and forest degradation. In the framework of REDD, the
Government of Indonesia submitted a Forest Reference
Emission Level (FREL) to the UNFCCC Secretariat in 2015,
which covers deforestation and forest degradation as well as
peat decomposition.
The FREL is set at 0.568 GtCO2e/year for Aboveground
Biomass carbon pool, with 1990-2012 as the reference
period. The deforestation rate for business as usual (BAU)
2013-2020 based on FREL-REDD baseline is at 0.920 million
ha/year for both unplanned and planned deforestation.
According to the baseline, the Indonesia’s NDC document
assumes deforestation rate for BAU 2021-2030 to be
0.820 million ha/year. The emission reduction target for
unconditional scenario (CM1) and conditional scenario
(CM2) is 0.325 million ha/year, respectively.
An MRV (Measurement, Reporting, and Verification)
system is needed to measure whether or not the emission
reduction target set in the NDC has been achieved. Such
status information is important not only for the government
but also for the relevant stakeholders and the public. With
this information, the parties can provide input and even
directly contribute to the efforts of reducing greenhouse gas
emissions. Therefore, the MRV system must be accurate, use
an internationally-recognized method, and produce reliable
results for both national and global communities.
The IPCC (Intergovernmental Panel on Climate Change) has
published a set of guidelines for methods of measuring
greenhouse gas emissions, such as IPCC 2003 Good Practice
Guidance for Land Use, Land Use Change and Forestry
(LULUCF) and IPCC 2006 Guidelines for National Greenhouse
Gas Inventories-Volume 4 Agriculture, Forestry and Other
Land Use (AFOLU). For blue carbon measurement, the IPCC
has issued IPCC 2013 Supplement to the 2006 IPPC Guidelines
for National Greenhouse Gas Inventories: Wetlands. The
term used in this document is not ‘blue carbon’ but ‘coastal
wetland’; however both refer to the same ecosystems, i.e.
mangroves, seagrass meadows, and tidal marshes.
46 B l u e C a r b o n S c i e n c e & P o l i c y : w i t h a P a r t i c u l a r R e f e r e n c e t o K a i m a n a , W e s t P a p u a
To build the MRV system, the government has issued
Presidential Regulation No. 71 of 2011 (Presidential
Regulation 71/2011) on the Implementation of National
Greenhouse Gas Inventory. This Presidential Regulation
aims to provide regular information on the level, status, and
trend of in GHG emission change and absorption, including
national, provincial, and district/city carbon stocks. In
addition, it also mandates the provision of information
on GHG emission reduction from national climate change
mitigation.
In 2015, the Ministry of Environment and Forestry
developed a standard method to quantify estimated
greenhouse gas emissions from the forestry sector, known
as INCAS (Indonesian National Carbon Accounting System).
The INCAS was developed to support the MRV requirements
for greenhouse gas emissions from land-based sectors,
particularly the forestry sector.
The INCAS describes in detail the standard methods
developed to quantify net greenhouse gas (GHG) emissions
for the forestry sector in Indonesia. These standard methods
describe the approach and methods used for data collation,
data analysis, quality control (QC), quality assurance (QA),
modeling, and reporting. The standard methods include:
1. Standard Method – Initial Conditions: describes the
process for defining initial conditions that are used as
inputs for modeling GHG emissions and removals. This
includes aboveground biomass, belowground biomass,
litter, and dead wood for each biomass class.
2. Standard Method – Forest Growth and Turnover:
describes the process for defining the rate of growth,
turnover of aboveground and belowground biomass,
decomposition of dead wood for each component of
each biomass class to be used as inputs in modeling GHG
emissions and removals.
3. Standard Method – Forest Management Events and
Regimes: describes the process for defining forest
management events and regimes and their impact on
carbon stocks as inputs for modeling GHG emissions and
removals.
4. Standard Method – Regimes Spatial Allocation: elaborates
on how the existing spatial data is used consistently to
allocate the area of management regime for analysis and
to generate annual land area change statistics to be used
in INCAS modeling.
5. Standard Method – Peatland GHG Emissions: describes
the process for quantifying GHG emissions from
biological oxidation of drained peat, direct emissions
from drained organic soils and canal drainage, as well as
emissions from peat fire.
6. Standard Method – Modeling and Reporting: describes
the process used to bring together data from the
other INCAS standard method (1-5) and to model GHG
emissions and removals from deforestation, forest
degradation, conservation role, sustainable forest
management, and forest carbon stock enhancement in
Indonesia.
In addition, the standard methods used to monitor changes
in forest in Indonesia are described in detail in The Remote
Sensing Monitoring Program of Indonesia’s National Carbon
Accounting System: Methodology and Products, Version
1 (Program Pemantauan Sistem Penghitungan Karbon Nasional Indonesia dengan Penginderaan Jauh: Metodologi dan Hasil, Versi 1) (LAPAN, 2014).
Based on the description above, the INCAS does not
seem to include a standard method for quantifying carbon
stored in soils/sediments in mangrove ecosystems (below
the ground carbon). This is an opportunity to refine the
INCAS by incorporating blue carbon contributions into the
national accounting of greenhouse gas emissions.
The Intergovernmental Panel on Climate Change (IPCC)
has actually published a document describing the carbon
accounting standard methods for wetlands, titled: 2013
Supplement to the 2006 IPCC Guidelines for National Greenhouse Gas Inventories: Wetlands. Chapter IV of this
document specifically discusses coastal wetlands that
cover three coastal ecosystems, i.e. mangroves, seagrass
meadows, and tidal marshes. It means that substantively,
coastal wetlands are blue carbon ecosystems. The chapter
provides guidance on estimating GHG emissions associated
with specific activities on coastal wetlands (blue carbon
ecosystems) that may or may not result in a land use change.
The estimated greenhouse gas emissions include not only
biomass and dead organic matter (aboveground), but also
more importantly, soil carbon (belowground).
47B l u e C a r b o n S c i e n c e & P o l i c y : w i t h a P a r t i c u l a r R e f e r e n c e t o K a i m a n a , W e s t P a p u a
3.3 MANGROVE MANAGEMENTThere are two somewhat overlapping legal bases for mangrove
management, i.e. Law No. 41 of 1999 (Law 41/1999) on
Forestry and Law No. 27 of 2007 in conjunction with Law No.
1 of 2014 (Law 27/2007 jo. Law 1/2014) on the Management
of Coastal Areas and Small Islands.
Law 41/1999 states that forest is an integral unit of ecosystem
in the form of lands containing biological resources,
dominated by trees in their natural environment (Article
1 paragraph 2). By this definition, a mangrove ecosystem is
classified as a forest. Meanwhile, Law 27/2007 jo. Law 1/2014
state that coastal area is the transitional area between land
and sea ecosystem influenced by a change in the land and sea.
By this definition, a mangrove ecosystem is also classified as
a coastal area. Therefore, mangrove ecosystems are natural
resources subjected to two Laws, i.e. Law 41/1999 and Law
27/2007 jo. Law 1/2014.
For implementation, two ministries are responsible for
mangrove management based on both laws, i.e. Ministry
of Environment and Forestry (MoEF), under Law 41/1999
and Ministry of Marine Affairs and Fisheries (MMAF), under
Law 27/2007 jo. Law 1/2014. This overlapping authority is
the source of a potential management problem. Both can
deny responsibility or fight over responsibility. Some argue
that management by more than one entity equals to no
management, which is similar to the ‘common property’
concept that often interprets as ‘nobody’s property’.
An example of this problematic double authority is when the
MoEF launched a program called ‘Rantai Emas’ (Gold Chain)
in Demak District in 2013. The main activity of this program
was Forest and Land Rehabilitation (Rehabilitasi Hutan dan Lahan/RHL) of coastal areas/beaches through mangrove
planting. However, in 2012 the MMAF had undertaken
a similar program in Demark District called ‘Ayo Tanam Mangrove’/ATM (Let’s Plant Mangrove), followed by several
other mangrove planting activities from 2013 to 2016 under
programs such as Mangrove for the Future (MFF), Building
with Nature (BwN), and Coastal Development Program
(Pengembangan Desa Pesisir Tangguh/PDPT).
Fortunately, the problem did not last long and ended with
the MoEF and the MMAF’s agreeing to divide authority
according to the status of forest area. The MoEF now is
responsible for managing any mangrove ecosystems which
are part of a forest area, while the MMAF manages any
mangroves ecosystems outside a forest area. Law 41/1999
defines forest area as a government designated area that
is to be preserved as permanent forest. Currently, both
ministries are waiting for the government’s decision on
which mangroves are classified as forest areas and which
ones are not.
To avoid the negative impact of double authority, the
government has also issued Presidential Regulation No. 73
of 2012 (Presidential Regulation 73/2012) on the National
Strategy for Mangrove Ecosystem Management. Two
major considerations base the issuance of this Presidential
Regulation:
1. Mangrove ecosystems are invaluable coastal wetland
natural resources and life support system as well as
natural wealth. For this reason, they need to be protected,
conserved, and used sustainably for promoting public
welfare;
2. Coordination, integration, synchronization, and synergy
across sectors, agencies, and institutions are necessary to
sustainably manage mangrove ecosystems as an integral
part of integrated coastal and watershed management.
A National Coordinating Team for Mangrove Ecosystem
Management was established under Presidential Regulation
73/2012 and consists of Steering and Executive Committees.
The Head of the Steering Committee is the Coordinating
Minister for Economic Affairs, with members consisting of
the Minister of Home Affairs, Minister of Finance, Minister
of Environment, Minister of Public Works, and Minister
of National Development Planning/Head of (Bappenas).
Meanwhile, the Head of the Executive Committee is the
Minister of Forestry and the Alternate Head is the Minister
of Marine Affairs and Fisheries, with members consisting
of echelon 1 officials from various ministries, such as the
Coordinating Ministry for Economic Affairs, Coordinating
Ministry for People’s Welfare, Ministry of Forestry, Ministry
of Marine Affairs and Fisheries, LIPI (Indonesian Institute of
Science), Bappenas, Ministry of Public Works, Ministry of
Home Affairs, Geospatial Information Agency, and National
Land Agency.
Presidential Regulation 73/2012 has mandated two
important tasks to the National Coordinating Team for
Mangrove Ecosystem Management:
1. To formulate policies, strategies, programs, and
performance indicators for mangrove management.
2. To establish a National Mangrove Working Group
(Kelompok Kerja Mangrove Tingkat Nasional/KKMTN).
48 B l u e C a r b o n S c i e n c e & P o l i c y : w i t h a P a r t i c u l a r R e f e r e n c e t o K a i m a n a , W e s t P a p u a
The first task was accomplished in 2017 through Regulation
of the Coordinating Minister for Economic Affairs No.
4 of 2017 (Coordinating Minister for Economic Affairs
Regulation 2/2017) on Policies, Strategies, Programs, and
Performance Indicators for Mangrove Management. As
stated in Presidential Regulation 73/2012 and Regulation of
the Coordinating Minister for Economic Affairs 4/2017, the
National Strategy for Mangrove Ecosystem Management
(Strategi Nasional Pengelolaan Ekosistem Mangrove/
SNPEM) aims to synergize policies and programs for
mangrove ecosystem management that deal with ecology,
social and economy, institutional capacity, and laws and
regulations to ensure functions and benefits of sustainable
mangrove ecosystems for public welfare. SNPEM is also said
to be a coordinated basis and guideline for the government,
local governments, businesses, and communities. The
policy direction of SNPEM in Regulation of the Coordinating
Minister for Economic Affairs 4/2017 is also guided by
Presidential Regulation 73/2012, as follows:
1. Control on mangrove ecosystem conversion and utilization
based on the principles of sustainability (no net lost).
2. Improvement of mangrove ecosystem function in
biodiversity conservation, coastline and coastal resources
conservation, and increase in resulting products as
sources of income for the country and the people.
3. Mangrove ecosystem management as an integral part of
integrated coastal and watershed management.
4. Strong political commitment and support from central
and local governments as well as other parties.
5. Vertical and horizontal coordination and cooperation
across agencies and relevant parties to ensure the
implementation of SNPEM policy.
6. Community-based mangrove ecosystem management
that takes into account ecological, economic, and
sociocultural values, and aims to create better community
livelihoods and supports sustainable development.
7. Local government capacity building for exercising authority
and performing obligation of mangrove ecosystem
management based on local conditions and aspirations.
8. Development of research, science and technology, and
information system needed for stronger sustainable
mangrove ecosystem management.
9. Mangrove ecosystem management through partnership
between central and local governments, businesses,
and communities with support from international
organizations and communities as an effort to
accomplish the global environmental commitment.
Regulation of the Coordinating Minister for Economic Affairs
4/2017 divides the missions, objectives, targets, strategies,
programs, performance indicators, and roles of the
parties into four important values, i.e. ecology, social and
economy, institutional capacity, and laws and regulations.
One of the key programs and activities in the ‘important
ecological value’ category is expediting the designation of
mangrove area status (legality), whether as a protected area
(conservation zone) or as a cultivated area (general use zone).
The regulation is targeting for 3.49 million hectares of good
mangrove cover by 2045, with incremental implementation
from 2017 to 2045.
Meanwhile, the second task mandated by Presidential
Regulation 73/2012 (to establish a National Mangrove
Working Group (KKMTN)) was completed through Decree
of the Minister of Forestry No. SK. 504/Menhut-V/2013 on
the Establishment of National Mangrove Working Group.
KKMTN is tasked with:
1. Helping the National Coordinating Team formulate
policies, national strategies, and programs for mangrove
ecosystem management.
2. Encouraging the formation of province- and district/
city-level Coordinating Teams for Mangrove Ecosystem
Management, implementation of programs and
activities according to SNPEM, capacity building and
public awareness raising of mangrove conservation,
development of sustainable mangrove management
demo sites, and preparation of baseline data for
mangroves in Indonesia.
3. Synergizing the implementation of mangrove
management programs across sectors, central and
local governments, and other stakeholders, as well as
monitoring and evaluation of mangrove ecosystem
management.
4. Performing other tasks as instructed by the Coordinating
Team for Mangrove Ecosystem Management.
Interestingly, under Decree of the Minister of Forestry
504/2013, the Head of KKMTN is appointed alternately every
two consecutive years from the Ministry of Forestry, Ministry
of Marine Affairs and Fisheries, Ministry of Home Affairs,
and Ministry of Environment (Note: since 2014, the Ministry
of Forestry has merged with the Ministry of Environment to
form the Ministry of Environment and Forestry, or MoEF).
In addition to the head, KKMTN membership consists of
Bappenas, Geospatial Information Agency (Badan Informasi
Geospasial/BIG), National Land Agency, Ministry of Public
Works, Indonesian National Police, Attorney General’s
Office, LIPI, HNSI, IPB, and mangrove specialists.
49B l u e C a r b o n S c i e n c e & P o l i c y : w i t h a P a r t i c u l a r R e f e r e n c e t o K a i m a n a , W e s t P a p u a
Some suggest amending Decree of the Minister of Forestry
504/2013 to accommodate changes of nomenclature in
many ministries’ organizational structure. Furthermore,
KKMTN needs to recruit other stakeholders directly
dealing with mangrove management as members. Another
important consideration for such amendment is Law No.
23 of 2014 (Law 23/2014) on Local Governments, which
revokes a district/city government’s authority to administer
government affairs in the forestry, marine affairs, energy and
mineral resources sectors.
Mangrove management programs have been carried out
by different parties, including central-local government
partnership and environmental agencies and organizations,
to support to government policies. Some of the mangrove
programs launched by the central government are as follows:
1. Coastal Rehabilitation by Local Communities Program
(Rehabilitasi Pantai Entaskan Masyarakat Setempat/Rantai EMAS) – Deputy of Environmental Damage
Control and Climate Change, MoEF
• Year: 2011 – 2014
• Location: 63 locations in 13 districts/cities, 10
provinces, i.e. North Sumatra, Banten, West Java,
Central Java, East Java, Bali, East Nusa Tenggara,
Southeast Sulawesi, Gorontalo, and West Kalimantan.
• Objective: Rehabilitate mangrove ecosystems and
alleviate poverty in coastal communities.
• Activity: Mangrove planting in degraded coastal areas
involving 25-50 members of community groups. Each
participating community member is rewarded an
incentive of Rp100,000 - Rp150,000 for 8 months.
• Result: In 2011, 550,000 mangroves were planted.
In 2012, 1,130,000 mangroves were planted.
In 2013, 790,000 mangroves were planted.
2. Let’s Plant Mangrove/(Ayo Tanam Mangrove/ATM) –
MMAF
• Year : Since 2009
• Location: All Indonesian coastal areas
• Objective: Restore coastal areas in the long term, raise
public awareness of the importance of mangrove
ecosystems, engage communities to improve the
quality of coastal areas, rehabilitate mangrove
ecosystems, and build community capacity.
• Activity: Mangrove planting involving community
groups and other relevant parties.
• Result: From 2009 to 2011, 420,000 mangroves were
planted in 7 villages in 4 provinces.
3. One Map Program – BIG
• Year: Since 2013, following Presidential Instruction
No. 10 of 2011 on the Suspension of Granting of New
Licenses and Improvement of Governance of Natural
Primary Forest and Peat Land.
• Location: Entire Indonesia
• Objective: BIG together with the MoEF, Ministry of
Agriculture, and National Land Agency generate a
map with one reference, one standard, one database,
and one geoportal, as well as renew the Moratorium
Map every 6 months.
• Activity: Formation of 12 national working groups for
thematic geospatial information.
• Result: Mangrove Mapping Book (Sumatra)
Salt Pond Mapping Book
Shallow Water Characteristic Mapping Book
(Gorontalo, South Sulawesi)
Local governments have also implemented mangrove
conservation programs, as follows:
1. Village Regulation No. 1 of 2015 on Mangrove
Management in Wedung Village, Wedung Sub-district,
Demak District, Central Java Province. The regulation
was issued to deal with a threat of massive mangrove
ecosystem degradation in Wedung Village as a
consequence of land clearing for tambaks and housing.
The most severe damage occurs in the estuary and along
the coastline. With the full support of LPPSP Semarang
NGO and under the Medium Grant Project (MGF) of
Mangroves for the Future (MFF) program, Wedung Village
Government issued the regulation upon the approvals of
Demak District Government and Central Java Provincial
Government in March 2015. The regulation provides
for various activities, including coastal rehabilitation,
milkfish aquaculture with silvo-fishery method, local
economic capacity building (home business upscaling),
as well as communication and learning, which involve all
community elements.
2. Local Regulation of Penajam District Government No. 24
of 2012 on Mangrove Forest Management. The regulation
was issued by the local government in response to the
poor conditions of watersheds and coasts in North
Penajam Paser as a consequence of environmentally
destructive land use practices. Designating Buluminung
Industrial Estate in the district’s regional spatial plan
(Rencana Tata Ruang Wilayah/RTRW) has been a
double-edged sword for the local government since the
industrial estate envelopes a 4,000 ha mangrove forest
50 B l u e C a r b o n S c i e n c e & P o l i c y : w i t h a P a r t i c u l a r R e f e r e n c e t o K a i m a n a , W e s t P a p u a
that is in danger because of the estate. Nevertheless, the
local government guarantees 30% of the mangrove forest
will be preserved in accordance with the environmental
management law.
Meanwhile, some of the mangrove programs undertaken
by NGOs and private sector (CSR program) through public-
private partnership include: :
1. Mangroves for the Future (MFF) Program – IUCN and
UNDP
• Year: Initiated in 2006, implementation began in
2008
• Location: 32 small, medium, and large projects in 35
villages in 9 provinces, i.e. DKI Jakarta, West Java,
Banten, Central Java, DI Yogyakarta, East Java, North
Sulawesi, Gorontalo, and South Sulawesi.
• Objective: Initiated in 2006 (as a response to tsunami)
and implemented in 2008, the regional program is
a multiparty collaboration in coastal management,
especially in areas impacted by climate change and
disaster-prone areas (tsunami, flash flood, etc.),
involving the government, NGOs, community groups,
educational institutions, and private sector.
• Activity: Community group capacity building in the
process of climate change impact adaptation and
mitigation, community livelihood improvement
involving more than 30 women groups, or around
300 women in coastal areas.
• Result: More than 1,500,000 mangroves have been
planted in an area of more than 150 ha, more than 30
small businesses have been developed by community
groups using local wisdom and resources, several fish
cultivation pilot projects have been launched in West
Java, Central Java, and East Java.
2. Partnership for Resilience (PfR) – Wetlands International
Indonesia (WII)
• Year: Period I: 2011-2015, Period II: 2016-2021
• Location: 9 countries, including Indonesia (East Nusa
Tenggara and Banten Bay), Ethiopia, Guatemala,
India, Kenya, etc.
• Objective: Contribute to improved community
resilience through ecosystem management by
incorporating climate change adaptation (CCA) and
ecosystem management and restoration (EMR) into
Disaster Risk Reduction (DRR), and build community
capacity to cope with disaster impacts.
• Activity: Community and local partner capacity
building, collaboration with local governments,
environmental quality improvement through
mangrove planting and semi-permeable method
pilot project.
• Result: Community capacity building and mangrove
planting in more than 30 villages in 9 locations in 2
provinces have been carried out with more than
54,000 people as beneficiaries.
3. Coastal carbon corridor – Yayasan Gajah Sumatra
(YAGASU)
• Year: Initiated in 2001, actively implemented in 2003.
• Location: Medan, North Sumatra and Aceh, DI Aceh
• Objective: Improve environmental carrying capacity
and forest ecosystem conservation for the purposes
of climate change mitigation and adaptation,
biodiversity conservation, disaster risk reduction, and
as improved green livelihood.
• Activity: Increased carbon stocks through mangrove
ecosystems, public welfare improvement, carbon
research and economic valuations, research grants,
and conservation of certain animal species.
• Result: Carbon credit from mangrove ecosystems in
the eastern coast of North Sumatra has been prepared
for mitigating GHG emissions, environmental
education has been provided at public schools,
YAGASU research center has been built in Aceh, and
Mangrove Protected Area has been established in
Belawan Sicanang Village.
4. LESTARI – USAID
• Year: Began in 2015
• Location: 6 strategic locations in Aceh, Central
Kalimantan, and Papua
• Objective: Support the Government of Indonesia in
reducing GHG emissions and carry out biodiversity
conservation through carbon storages and mangrove
and forest ecosystems. Use landscape, integrated
forest, and peat land conservation approaches to low
emission development in degraded lands.
• Activity: Advocacy and institutional capacity for land
and forest use, conservation through collaborative
management, and private sector engagement.
• Result: MoU between LESTARI and Aceh Provincial
Government has been signed, two more MoUs
with Papua and Central Kalimantan Provincial
Governments are being prepared, forest patrol has
been carried out at national parks, cooperation
with BRG has been established to conduct rapid
hydrological assessment of Block C, sustainable
community livelihoods have been developed, signing
for Cyclop Natural Reserve has been completed
51B l u e C a r b o n S c i e n c e & P o l i c y : w i t h a P a r t i c u l a r R e f e r e n c e t o K a i m a n a , W e s t P a p u a
with the relevant parties, gender training has been
provided, and grant has been awarded to a project of
creating 5 videos related to fire and smoke in Central
Kalimantan.
5. Restoring Coastal Livelihood (RCL) – OXFAM
• Year: 2010 – 2015
• Location: 60 villages in the western coast of South
Sulawesi
• Objective: Increase ecological and economic resilience
of coastal communities through mangrove forest
restoration, develop saline soil farming, encourage
small business growth, and encourage female
participation in development.
• Activity: Establishment of 60 business groups, beach
schools, and mangrove forest area restoration.
• Result: 1,000 beneficiaries (mostly women) from
60 small businesses (some have been upscaled), 44
small business training, restoration of more than 300
ha of mangrove forests.
6. Mangrove planting program by PT Pertamina in
Indramayu District, West Java
• Year: 2010
• Location: Karangsong Village
• Objective: Conserve and rehabilitate coastal areas to
contribute to improved local economy.
• Activity: Mangrove planting involving community
groups and development of mangrove tourism site.
• Result: 15,000 mangroves have been planted followed
by replication by other parties, and mangrove tourism
site has been developed with direct contributions to
local economy.
7. Mangrove planting program by PT. Jawa Power in
Probolinggo District, East Java
• Year: Began in 2009
• Location: Randutatah Village
• Objective: Develop a coastal conservation area that
supports stronger community institutional capacity.
• Activity: Mangrove and sea pine cultivation and
planting, development of mangrove and sea pine
ecotourism site by engaging community groups.
• Result: In 2014 and 2015, 83,000 mangroves and
sea pines were planted, and mangrove and sea
pine ecotourism site has been developed with
direct management by the local government and
community.
Below are the mangrove management activities carried out
by community groups and individuals in many locations in
Indonesia:
11. Pancer Pindang Community Self-Supporting Group in
Indramayu District, West Java cultivates and plants
mangroves around Laut Cilik in Cangkring Village, Cantigi
Sub-district, runs home fish processing businesses using
fish from local fishermen, and develops home hydroponic
vegetable farming.
2. Sido Agung Tambak Farmer Group in Probolinggo District,
East Java cultivates and plants mangroves in tambaks,
rivers, and salt fields. The group also runs home fish
processing businesses using fish from local fishermen and
has started a unique initiative called Salt Bank, where salt
farmers set aside some of their profits to buy and plant
mangroves around the salt fields.
3. Paddakauang Environmentally Aware Group in Pohuwato
District, Gorontalo cultivates and plants mangroves and runs
reef fish aquaculture businesses. The group has managed
to restore mangrove ecosystems by adopting local wisdom
through continuous self-taught learning (autodidact). This
achievement has attracted Gorontalo State University
(UNG) to collaborate as partners in studies of mangrove
ecosystem in Pohuwato District. UNG and Paddakauang
have signed a Memorandum of Understanding (MoU) for
mangrove ecosystem rehabilitation and restoration.
4. Mukhlis from Sinar Pagi Farmer Group in Probolinggo
Municipality, East Java has been planting and growing
mangroves (using his own money and efforts) since 1987
and was once nominated for the province’s Kalpataru
Award. His wife processes mangrove seeds into flour
and uses it to make different kinds of snack with high-
economic value.
52 B l u e C a r b o n S c i e n c e & P o l i c y : w i t h a P a r t i c u l a r R e f e r e n c e t o K a i m a n a , W e s t P a p u a
REFERENCES
Abidin, HZ. et al (2012) Land subsidence in coastal city of
Semarang (Indonesia): characteristics, impacts, and
causes. Geomat. Nat. Hazards Risk, 4, 226-240.
Abood, SA. et al. (2015) Relevant contributions of the
logging, fiber, oil pam, and mining industries to forest
loss in Indonesia. Conserv. Lett. 8, 58-67.
Adame, MF. et al. (2013) Carbon stocks of tropical coastal
wetlands within the karstic landscape of the Mexican
Caribbean. PLoS ONE 8, e56569.
Alongi, DM. et al. (2015) Indonesia’s blue carbon: a globally
significant and vulnerable sink for seagrass and
mangrove carbon. Wetlands Ecology & Management,
Vol 24, Issue 1 pp.3-13
Badan Pusat Statistik, 2015a. Statistical of Forest Concession
Estates 2014. BPS, Indonesia, Jakarta, p. 102.
Badan Pusat Statistik, 2015b. Statistical Year Book of
Indonesia 2015. BPS, Indonesia, Jakarta, p. 676.
Barbier, E.B., Hacker, S.D., Kennedy, C., Koch, E.W., Stier, A.C.
and Silliman, B.R. (2011): The value of estuarine and coastal ecosystem services. Ecological Monographs
81: 169–193.
Boli, P. (2007). Survei Sosial Ekonomi Kabupaten Fak Fak
dan Kabupaten Kaimana: Conservation International
Indonesia in cooperation with Universitas Papua.
Bredbenner, A. (n.d.). Encouraging Study Shows Blue Carbon Demonstrated in the Field. The Blue Carbon Initiative. Retrieved http://thebluecarboninitiative.
org /encouraging-study-shows-blue-carbon-
demonstrated-in-the-field/
Briggs, RW. et al. (2008) Persistent elastic behaviour above a
megathrust rupture patch: Nias island West Sumatra.
J. Geophys. Res.,113.
Burbridge, PR. et al. (1982) Management of mangrove
exploitation in Indonesia. Appl. Geogr. 2,39-54
Canary Current Large Marine Ecosystem : CCLME mangrove
project. (October, 2013). Retrieved from http://www.
canarycurrent.org/about/demonstration-projects-1/
mangrove-project/cclme-mangrove-project
Casson, A. et al. (2014) Large-scale plantations, bio-energy
developments and land use change in Indonesia
(accessed online at http://www.cifor.org/
library/5434/large-scale-plantations-bioenergy-
developments-and-land-use-change-in-indonesia/)
Cecep K. et al. (2003) Jenis-Jenis Pohon Mangrove di Teluk Bintani Papua, Bogor, Fakultas IPB, pp. 16-40.
Climate Focus (2011): Blue Carbon Policy options Assessment. Washington DC. URL: www.
c l i m a t e fo c u s . c o m / d o c u m e n t s / f i l e s / b l u e _
carbon_.pdf
Conservation International (2008): Economic Value of Coral Reefs, Mangroves, and Seagrasses: A Global Compilation. Center for Applied Biodiversity Science,
Conservation International, Arlington.
Davie, J. et al. (1998) The protection of forested coastal
wetlands in Southern Sumatra: A regional strategy
for integrating conservation and development. Pac.
Conserv. Biol. 3, 366-378.
Donato, DC. et al. (2011) Mangroves among the most
carbon-rich forests in the tropics. Nature Geoscience
4:293-297.
Duarte CM. et al. (2013) The role of coastal plant communities
for climate change mitigation and adaptation. Nature
Clim. Change 3:961-968.
Duarte, C.M., Middelburg, J., and Caraco, N. (2005): Major
role of marine vegetation on the oceanic carbon
cycle. Biogeosciences 2: 1–8.
Duke, NC. et al. (2007) A world without mangroves? Science
317, 41-42.
53B l u e C a r b o n S c i e n c e & P o l i c y : w i t h a P a r t i c u l a r R e f e r e n c e t o K a i m a n a , W e s t P a p u a
Dutrieux, E. et al. (2014) Mangrove restoration in the
vicinity of oil and gas facilities: lessons learned from
a large-scale project. Soc. Pet. www.onepetro.org/
conference-paper/SPE-168449-MS.
Environmental Agency – Abu Dhabi (Dikunjungi bulan
Oktober 2013): AGEDI. URL: www.agedi.ae/Pages/
index.aspx
Firman A. & L. Azhar, (2006) Atlas Sumberdaya Pesisir Raja
Ampat Provinsi Irian Jaya Barat, Sorong, Pemerintah
Kabupaten Raja Ampat, p. 46
Food and Agriculture Organization of the United Nations
(2005): Global Forest Resource Assessment 2005.
(Food and Agriculture Organization of the United
Nations, Rome) FAO Forestry Paper 147.
Food and Agriculture Organization of the United Nations
(2007): The world’s mangroves, 1980-2005. (Food
and Agriculture Organization of the United Nations,
Rome) FAO Forestry Paper 153.
Fourqurean, J.W., Duarte, C.M., Kennedy, H., Marba, N.,
Holmer, M., Mateo, M.A., Apostolaki, E.T., Kendrick,
G.A., Krause-Jensen, D., McGlathery, K.J. and
Serrano, O. (2012): Seagrass ecosystems as a globally significant carbon stock. Nature Geoscience 5: 505–
509.
Furukawa, H. (1994) Coastal wetlands of Indonesia:
environment, subsistence and exploitation. Kyoto
University Press, Kyoto, 228 pp
Geospatial Information Agency, 2012. Informasi geospasial
mangrove Indonesia (Mangrove geospatial
information of Indonesia). Pusat Pemetaan
dan Informasi Tematik, Badan Informasi Geospasial
Indonesia, Bogor, p. 335
Giri, C et.al. (2011) Status and distribution of mangrove
forests of the world using Earth Observation Satellite
data. Global Ecology and Biogeography, Vol. 20, pp.
154-159
Global Forest Watch, 2014. Indonesia Oil Palm Concessions.
World Resources Institute, Washington.
Green Climate Fund (Dikunjungi bulan Oktober 2013):
Mandate and Governance. URL: http://gcfund.net/
about-the-fund/mandate-and-governance.html
Hayes, M., & Lovelock C.E. (2015). Carbon stock assessment
for Arguni Bay, West Papua.
Herr, D., Pidgeon, E. and Laffoley, D. (eds.) (2011): Blue Carbon Policy Framework: Based on the first workshop of the International Blue Carbon Policy Working Group.
Gland, Switzerland: IUCN and Arlington.
Hinrichs, S et al. (2009) Status, diversity and distribution
patterns of mangrove vegetation in the Segara
Anakan lagoon, Java, Indonesia. Reg. Environ. Change
9, 275–289
Howard, J. et al. (2014) Coastal Blue Carbon: Methods
for assessing carbon stocks and emissions
factors in mangroves, tidal salt marshes, and
seagrass meadows. Conservation International,
Intergovernmental Oceanographic Commission of
UNESCO, International Union for Conservation of
Nature., Arlington, Virginia, USA.
Intergovernmental Panel on Climate Change (2011):
Activities of the Task Force on National Greenhouse Gas Inventories. Thirty-Third Session of the IPCC.
URL: www.ipcc.ch/meetings/session33/doc07_p33_
tfi_activities.pdf
Joosten, H. and D. Clarke (2002) Wise use of mires and
peatlands. International mire conservation group ;
International peat society, Greifswald (Allemagne);
Jyväskylä (Finlande).
Kauffman, JB. Et al. (2014) Carbon stocks of intact mangroves
and carbon emissions arising from their conversion in
the Dominican Republic. Ecol. Appl. 24, 518–527
Kauffman, JB. Et al. (2011) Ecosystem Carbon Stocks of
Micronesian Mangrove Forests. Wetlands 31:343-
352.
Kauffman, J.B. and Donato, D.C. (2012): Protocols for the measurement, monitoring and reporting of structure, biomass and carbon stocks in mangrove forests.
Working Paper 86. Bogor: Center for International
Forestry Research
54 B l u e C a r b o n S c i e n c e & P o l i c y : w i t h a P a r t i c u l a r R e f e r e n c e t o K a i m a n a , W e s t P a p u a
Krauss, K. and M. Ball (2013) On the halophytic nature of
mangroves. Trees 27:7-11.
Kusmana, C. (2014) Distribution and current status of
mangrove forests in Indonesia. In: Faridah- Hanum,
I., Latiff, A., Hakeem, K.R., Ozturk, M. (Eds.),
Mangroves Ecosystems of Asia, Status, Challenges
and Management Strategies. Springer, New York, pp.
37-60
Kusmana, C. & Onrizal (1999) . Hasil inventarisasi dan
identifikasi hutan mangrove diProvinsi Riau,
Fakultas Kehutanan Institut Pertanian Bogor
Direktorat JenderalReboisasi dan Rehabilitasi Lahan
Departemen Kehutanan dan PerkebunanRepublik
Indonesia, Bogor.
Lawson, S. (2014) Consumer goods and deforestation: An
analysis of the extent and nature of illegality in forest
conversion for agriculture and timber plantations,
Forest Trends. (accessed online www.forest-trends.
org/documents/files/doc_4718.pdf)
Lee JH. et al. (2014) Environmental impacts of large-scale
oil palm enterprises exceed that of small holdings in
Indonesia. Conserv. Lett. 7, 25-33
Livelihoods Venture (Dikunjungi bulan Oktober 2013): About us. URL: www.livelihoods.ey/about-us.html
Lovelock, CE. et al. (2014) Contemporary Rates of Carbon
Sequestration Through Vertical Accretion of
Sediments in Mangrove Forests and Saltmarshes
of South East Queensland, Australia. Estuaries and
Coasts 37:763-771.
Lovelock, CE. et al. (2015) The vulnerability of Indo-Pacific
mangrove forests to sea-level rise. Nat. Adv., online
publication
McLeod, E., Chmura, G.L., Bouillon, S., Salm, R., Bjork, M.,
Duarte, C.M., Lovelock, C.E., Schlesinger, W.H. and
Silliman, B.R. (2011): A blueprint for blue carbon: toward an improved understanding of the role of vegetated coastal habitats in sequestering CO2.
Frontiers in Ecology and the Environment 9: 552–560.
McIvor, A. et al. (2012) Storm surge reduction by mangroves
Natural Coastal Protection Series: Report 2. In:
Cambridge Coastal Research Unit Working Paper 41.
The Nature Conservancy and Wetlands International,
p. 35
McIvor, A. et al. (2013) The response of mangrove soil surface
elevation to sea level rise Natural Coastal Protection
Series: Report 3.In: Cambridge Coastal Research Unit
Working Paper 42. The Nature Conservancy and
Wetlands International, p. 59.
Murdiyarso, D. et al. (2010) Carbon storage in mangrove
and peatland ecosystems: a preliminary account
from plots in Indonesia. Center for International
Forestry Research (CIFOR), Bogor, Indonesia.
Murdiyarso, D. et. al. (2015) The potential of Indonesian
mangrove forests for global climate change
mitigation. Nature Climate Change, Vol. 5 No.12,
pp.1089-1092.
Murray, B.C., Pendleton, L. and Sifleet, S. (2011): State of the Science on Coastal Blue Carbon: A Summary for Policy Makers. In: Nicholas Institute for Environmental
Policy Solutions Report NIR 11-06, P. 1-43
Nellemann, C. et al. (2009) Blue carbon. A rapid response
assessment. United Nations Environment
Programme. UNEP, FAO, IOC/UNESCO.
Pada, Defy Nathaniel. et al. (2011) Persepsi Masyarakat di Kawasan Konservasi Laut Daerah Kabupaten Kaimana, Indonesia. Consservation International.
p14-15
Pan, Y., Birdsey, R.A., Fang, J., Houghton,R., Kauppi, P.E.,
Kurz, W.A., Phillips, O.L., Shvidenko, A., Lewis, S.L..,
Canadell, J.G., Ciais, P., Jackson, R.B., Pacala, S.,
McGuire, A.D., Piao, S., Rautiainen, A., Sitch, S. and
Hayes, D. (2011): A Large and Persistent Carbon Sink in the World’s Forests. Science 333: 988-993.
Pemerintah Republik Indonesia. (2016) First Nationally Determined Contributions.
55B l u e C a r b o n S c i e n c e & P o l i c y : w i t h a P a r t i c u l a r R e f e r e n c e t o K a i m a n a , W e s t P a p u a
Pemerintah Republik Indonesia. (2013) Keputusan Menteri Kehutanan tentang Pembentukan Kelompok Kerja Mangrove Tingkat Nasional, Kepmen No. SK. 504/
Menhut-V/2013. Jakarta: Sekretariat Negara.
Pemerintah Republik Indonesia. (2017) Peraturan Menteri Koordinator Bidang Perekonomian tentang Kebijakan, Strategi, Program, dan Indikator Kinerja Pengelolaan Mangrove, Permenko Perekonomian No. 4 Tahun
2017. Jakarta: Sekretariat Negara.
Pemerintah Republik Indonesia. (2011) Peraturan Presiden tentang Penyelenggaraan Inventarisasi Gas Rumah Kaca Nasional, Perpres No. 71 Tahun 2011. Jakarta:
Sekretariat Negara.
Pemerintah Republik Indonesia. (2011) Peraturan Presiden tentang Rencana Aksi nasional Penurunan Emisi Gas Rumah Kaca, Perpres No. 61 Tahun 2011. Jakarta:
Sekretariat Negara.
Pemerintah Republik Indonesia. (2012) Peraturan Presiden tentang Strategi Nasional Pengelolaan Ekosistem Mangrove. Perpres No. 73 Tahun 2012. Jakarta:
Sekretariat Negara.
Pemerintah Republik Indonesia. (1999) Undang-Undang tentang Kehutanan, UU No. 41 Tahun 1999. Jakarta:
Sekretariat Negara.
Pemerintah Republik Indonesia. (2014) Undang-Undang tentang Pemerintahan Daerah, UU No. 23 Tahun
2014. Jakarta: Sekretariat Negara.
Pemerintah Republik Indonesia. (2016) Undang-Undang tentang Pengesahan Paris Agreement to the United Nations Framework Convention on Climate Change,
UU No. 16 Tahun 2016. Jakarta: Sekretariat Negara.
Pemerintah Republik Indonesia. (1994) Undang-Undang tentang Pengesahan United Nations Framework Convention on Climate Change (Konvensi Kerangka Kerja Perserikatan Bangsa Bangsa Mengenai Perubahan Iklim), UU No. 6 tahun 1994. Jakarta:
Sekretariat Negara.
Pemerintah Republik Indonesia. (2007) Undang-Undang tentang Pengelolaan Wilayah Pesisir dan Pulau-Pulau Kecil, UU No. 27 Tahun 2007. Jakarta: Sekretariat
Negara.
Pemerintah Republik Indonesia. (2014) Undang-Undang tentang Perubahan atas Undang-Undang Nomor 27 Tahun 2007 Pengelolaan Wilayah Pesisir dan Pulau-Pulau Kecil, UU No. 1 Tahun 2014. Jakarta: Sekretariat
Negara.
Pendleton, L., Donato, D.C., Murray, B.C., Crooks, S., Jenkins,
W.A., Sifleet, S., Craft, C., Fourqueran, J.W., Kauffman,
J.B., Marbà, N., Megonigal, P., Pidgeon, E., Herr, D.,
Gordon, D. and Balder, A. (2012): Estimating Global “Blue Carbon” Emissions from Conversion and Degradation of Vegetated Coastal Ecosystems. PLoS
ONE 7(9): e43542.
Polidoro, B. et al. (2010) The Loss of Species: Mangrove Extinction Risk and Geographic Areas of Global Concern. Ed. Dennis Marinus Hansen. PLoS ONE 5.4
e10095.
Provinsi Kalimantan Barat (Economic valuation and
conservation strategy analysis in Kubu Raya regency
of West Kalimantan Province), MayorKonservasi
Biodiversitas Tropika. Institut Pertanian, Bogor
Putra, RR. Et al. (2012) Seismic hazard analysis for Indonesia.
J. Nat. Disaster Sci. 33,59-70.
Rahman, F. (2015). Mapping on Arguni Bay Deforestation.
Ramdani, F. & Hino, M. (2013) Land use changes and ghg
emissions from tropical forest conversion by oil palm
plantations in Riau Province, Indonesia. PLoS One8,
e70323.
Saintilan, N. et al. (2013) Allochthonous and autochthonous
contributions to carbon accumulation and carbon
store in southeastern Australian coastal wetlands.
Estuarine, Coastal and Shelf Science 128:84-92.
Schuster, W.H. (1952) Fish-culture in brackish-water ponds
of Java. In: Indo-PacificFisheries Council Special
Publications No. 1. FAO, p. 143
Siikamäki, J., Sanchirico, J.N. and Jardine, S.L. (2012): Global economic potential for reducing carbon dioxide emissions from mangrove loss. Proceedings of the
National Academy of Sciences of the United States of
America 109 (36): 14369-14374.
56 B l u e C a r b o n S c i e n c e & P o l i c y : w i t h a P a r t i c u l a r R e f e r e n c e t o K a i m a n a , W e s t P a p u a
Siregar, AF. (2012) Valuasi ekonomi dan analisis strategi
konservasi di Kabupaten KubuRaya.
Sobari, MP. et al. (2006) Analisis ekonomi alternatif
pengelolaanekosistem mangrove Kecamatan Barru,
Kabupaten Barru. Buletin EkonomiPerikanan VI. 22
The East African Forum for Payment for Ecosystem Services.
(2013, October). A Small Scale Carbon – offset Project in Mangroves. Retrieved from www.eafpes.
org/index.php/researchandpublications/extensions/
mikoko-pamoja-outline
Trettin, C. (2013, October). Assessing Mangrove Carbon Pools in the Zambezi Delta, Mozambique: A Pilot Basement Assessment for REDD+ Reporting and Monitoring. Africa Biodiversity Collaborative
Group. retrieved from http://frameweb.org/
CommunityBrowser.aspx?id=10045
Wibowo A. (2010) Kerentanan Lingkungan Pantai Kota
Pesisir di Indonesia. J. Ilmu dan Teknologi Kelautan
Tropis 3, 1–20
Wicke, B. et al. (2011) Exploring land use changes and the
role of palm oil production in Indonesia and Malaysia.
Land Use Policy 28, 193-206
Wolanski E. et al. (2000) Modelling and visualizing the fate
of shrimp pond effluent in a mangrove-fringed tidal
creek. Estuar. Coast. Shelf Sci. 50, 85-97
World Bank (2013) Fish to 2030: prospects for fisheries and
aquaculture. In: WorldBank Report Number 38177-
GLB. The World Bank, Washington D.C.

57B l u e C a r b o n S c i e n c e & P o l i c y : w i t h a P a r t i c u l a r R e f e r e n c e t o K a i m a n a , W e s t P a p u a