Embed Size (px)
Citation preview
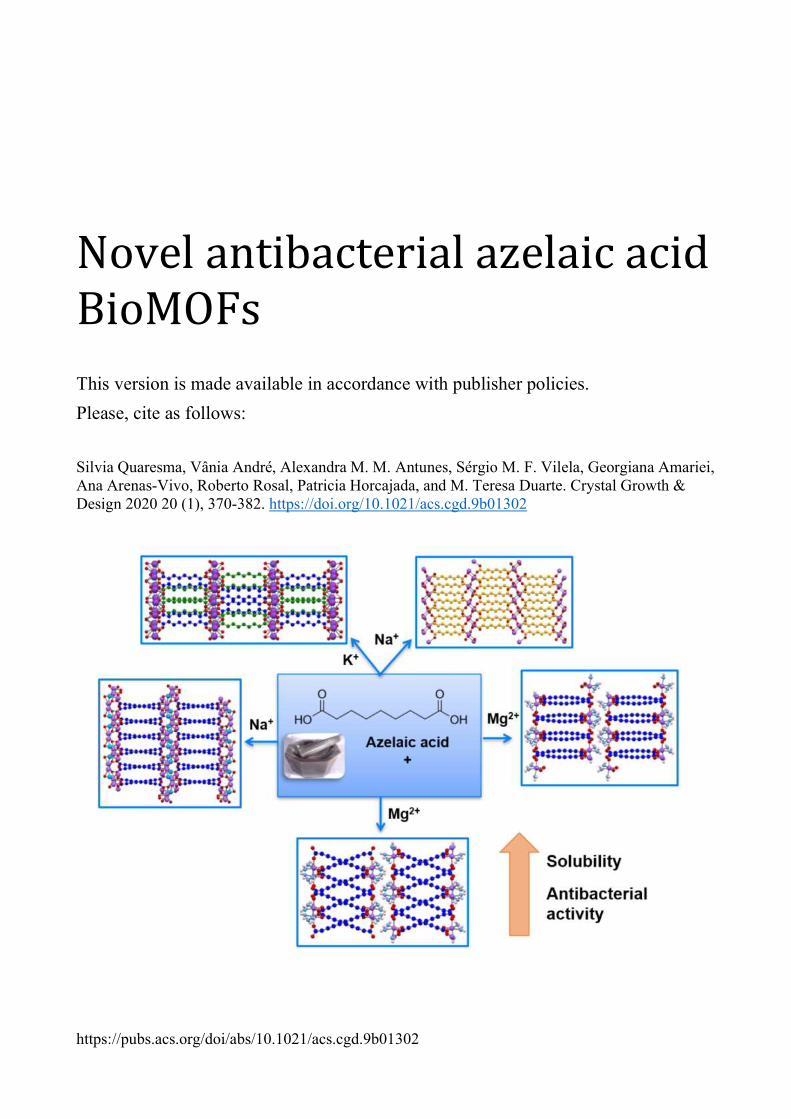
Novel antibacterial azelaic acid BioMOFs
This version is made available in accordance with publisher policies.
Please, cite as follows:
Silvia Quaresma, Vânia André, Alexandra M. M. Antunes, Sérgio M. F. Vilela, Georgiana Amariei, Ana Arenas-Vivo, Roberto Rosal, Patricia Horcajada, and M. Teresa Duarte. Crystal Growth & Design 2020 20 (1), 370-382. https://doi.org/10.1021/acs.cgd.9b01302
https://pubs.acs.org/doi/abs/10.1021/acs.cgd.9b01302
Cryst. Growth Des. 20, 370-382, 2020
Novel antibacterial azelaic acid BioMOFs
Silvia Quaresma1, Vânia André1,2, Alexandra M. M. Antunes1, Sérgio M. F. Vilela3, Georgiana Amariei4, Ana Arenas-Vivo3, Roberto Rosal4, Patricia Horcajada3,*, M. Teresa Duarte1,* 1 Centro de Química Estrutural, Instituto Superior Técnico, Universidade de Lisboa, Av. Rovisco Pais, 1,
1049-001 Lisboa, Portugal 2 Associação do Instituto Superior Técnico para a Investigação e Desenvolvimento, Av. Rovisco Pais,1,
1049-003 Lisboa, Portugal 3 Advanced Porous Materials Unit (APMU), IMDEA Energy Institute, Av. Ramón de la Sagra 3, E-28935
Móstoles, Madrid, Spain 4 Department of Chemical Engineering, University of Alcalá, E-28871 Alcalá de Henares, Madrid, Spain * Corresponding authors: [email protected]; [email protected]
Abstract
The development of metal–organic frameworks (MOFs) for bioapplications has gained great relevance over the last few years, mainly due to their potential as drug carriers and/or imaging agents. Although the bioactive azelaic acid has also been widely used as an antibacterial and anti-inflammatory drug, it presents low solubility, so of utmost importance is the development of more soluble formulations with sustained activity. In this contribution, we prove that new azelaic acid-based metal biomolecule frameworks (BioMOFs) are a viable pathway to achieve this goal. Therefore, five novel MOFs were prepared by a simple, low-cost, and environmentally friendly mechanochemical approach, combining azelaic acid with endogenous cations (i.e., K+, Na+, and Mg2+): [K2(H2AZE)(AZE)] (1), [Na4(HAZE)4] (2), [Na2(AZE)(H2O)] (3), and two different polymorphic forms of [Mg(AZE)(H2O)3] (4) and (5) (where H2AZE - neutral azelaic acid; HAZE - mono-deprotonated azelaic acid; AZE - di-deprotonated azelaic acid). After full structural characterization using single-crystal X-ray diffraction data and other complementary standard solid-state techniques, their thermal and moisture stabilities as well as aqueous solubility were assessed. Finally, their antibacterial activity was evaluated against two Gram-positive bacteria (Staphylococcus aureus and Staphylococcus epidermidis), commonly present on the skin. All MOF materials exhibit good stability and higher solubility than azelaic acid. In addition, BioMOF 1 has shown good antibacterial activity both at pH 5 and 6.5. Thus, 1 has shown to be a promising candidate to further develop new topical formulations of H2AZE.
1. Introduction
Metal–organic frameworks (MOFs), defined as hybrid self-assemblies of metal ions or clusters and organic polycomplexant fragments(1,2), represent a versatile family of crystalline hybrid compounds with a wide range of applications in the chemical and material sciences, including catalysis (3,4), gas storage (5,6), and separation processes (7,8), among others. More recently, MOFs with biomedical and pharmaceutical properties have been reported as carriers for the controlled delivery of different active species like drugs (9,10), biologically active gases (11), cosmetics (12), and contrast agents (13). Although MOFs’ bioapplication is quite promising (14−17), a biosafe character must be ensured by a judicious selection of their biofriendly framework composition (i.e., organic linker and metal cation) (2,18,19).
Basically, two different approaches have been employed to prepare MOFs for pharmaceutical purposes: (i) incorporation of the active species as a guest into the biocompatible MOFs’ porosity (20−24); and (ii) design and synthesis of new intrinsically bioactive MOF structures, in which the organic linker and/or the cation provide the biological
effect (10,25,26). This latter approach gives rise to the term metal biomolecule frameworks (BioMOFs), being clearly advantageous since the release of the active pharmaceutical ingredient (API) is achieved through the degradation of the solid, ruling out the potential toxicity of the framework and not requiring porosity. Further advantages of such approach are (i) from the synthetic point of view, it avoids multistep procedures to prepare the loaded material, as the API is part of the matrix (27); (ii) the careful selection of complementary bioactive metals and ligands can promote additive or, even, synergistic effects; and (iii) the use of porous BioMOFs presents enhanced applications, as it can lead to the codelivery of extra APIs hosted in the pores (2,18,28). Remarkably, the intrinsically bioactive MOFs have the advantage to incorporate functionality in a straightforward way, which might drastically increase their chance for clinical use (29,30). Azelaic acid (H2AZE), a well-known API exhibiting relevant antibacterial (31) and anti-inflammatory activities (32), is used as a routine treatment against acne vulgaris (33) and rosacea (34). Furthermore, its use decreases the production of keratin, a natural substance that promotes the growth of acne bacteria (35), and it has shown a great potential for the treatment of other skin
Cryst. Growth Des. 20, 370-382, 2020
pathologies, such as malignant melanoma, hyperpigmentation (36), and melasma (37). Nevertheless, its therapeutic application is hindered by its poor absorption through the skin, requiring several applications to maintain active levels for extended periods of time (38). This is mainly due to the poor aqueous solubility of azelaic acid, which represents one of the major difficulties in the final formulation of this drug for topical application (39).
A search in Cambridge Structural Database (CSD) has retrieved 42 coordination azelate-based compounds. For the design of H2AZE based BioMOFs, the selection of nontoxic metallic cations, such as Mg2+, Ca2+, Fe3+, Fe2+, K+, Na+, or Zn2+ (oral lethal dose 50 in rats (LD50 in mg·kg–1): MgSO4 = 5000, CaCl2 = 1940, FeCl3 = 450, FeCl2 = 984, K2SO4 = 6600, Na2SO4 > 10 000 and Zn(OAc)2 = 100–600) (18), is required [LD50 = amount of compound that kills half the members of a given population after a specific duration. Considering their lethal dose upon oral administration].
However, most of the previously reported materials are built up from toxic metals or exhibit a secondary toxic pyridinic linker, precluding their use in the pharmaceutical field (40). We should mention the bioactivity evidenced by the biocompatible zinc-azelate BioMIL-5, allowing a “time-maintained” antibacterial effect, due to the progressive release of both active constituents (Zn2+ and H2AZE) (26). On the other hand, with the exception of a Ba-based derivative, with unknown biological activity (41), no other coordination polymers composed of alkaline or alkaline-earth elements and azelaic acid were found. The endogenous character of K+, Na+, and Mg2+, and also their important concentration within the body and dietary levels (recommended daily intake 3500, 2400, and 350 mg, respectively) (42) are important features that make them excellent biocompatible candidates for the synthesis of BioMOFs.
Magnesium, one of the most common metals involved in biological systems, plays an essential role in several physiological processes such as nerve impulse transmission, muscle contraction, and enzyme activation (43). It has an essential role in human diet (44) and in cellular functions, being involved in more than 300 enzymatic reactions in the body. This element participates in the metabolism of carbohydrates, lipids, proteins, and nucleic acids, as well as in reactions for the formation and use of adenosine triphosphate (45). Potassium impacts multiple physiological processes including glucose and insulin metabolism, resting cellular-membrane potential and gastrointestinal motility, among others (46). Finally, sodium is an important electrolyte that helps keep the fluids balanced in the human body. Moreover, it regulates the blood pressure, and it is important for the normal functioning of nerves and muscles (47).
Herein, we report the use of a green mechanochemical methodology (27), with an expanding field of
applications (48), to synthesize five new BioMOFs from the self-assembly of H2AZE with the endogenous metals K+, Na+, and Mg2+ (i.e., [K2(H2AZE)(AZE)] (1), [Na4(HAZE)4] (2), [Na2(AZE)(H2O)] (3), and two polymorphic forms of [Mg(AZE)(H2O)3] (4) and (5)). Their structural elucidation was carried out by powder and single crystal X-ray diffraction (PXRD and SCXRD), and their full characterization, as well as their thermal, ambient and moisture stabilities, was assessed by standard solid-state techniques [e.g., thermogravimetric analysis and differential scanning calorimetry (TG/DSC), variable-temperature powder X-ray diffraction (VTPXRD), and Fourier-transform infrared spectroscopy (FTIR)]. Solubility studies were performed using solution nuclear magnetic resonance (NMR). Finally, their antibacterial activity was evaluated against two Gram-positive bacteria, Staphylococcus aureus and Staphylococcus epidermidis, commonly present in the skin.
2. Experimental section
2.1. Reagents and solvents
All reagents and solvents were purchased from commercial sources and used without further purification: azelaic acid (C9H16O4, 98%, Sigma-Aldrich); magnesium hydroxide (Mg(OH)2, 95%, Sigma-Aldrich); potassium hydroxide (KOH, 98.4%, VWR chemicals); sodium hydroxide (NaOH, 99%, Merck); dioxane (C4H8O2, 99.5%, Fluka); deuterium oxide (D2O, 99.9%, Eurisotop); glycerol (C3H8O3, 98,5%, Panreac); components of nutrient broth, soft agar, and buffers were obtained from Pronadisa-Conda Lab.
2.2. Synthesis of BioMOFs 1–5
The new BioMOFs, [K2(H2AZE)(AZE)] (1), [Na4(HAZE)4] (2), [Na2(AZE)(H2O)] (3), and the two polymorphic forms of [Mg(AZE)(H2O)3]) (4) and (5) (where H2AZE - neutral azelaic acid; HAZE - mono-deprotonated azelaic acid; AZE - di-deprotonated azelaic acid) were synthesized via liquid assisted grinding (LAG), using H2AZE and different metal hydroxides (i.e., KOH, NaOH, and Mg(OH)2), in the presence of catalytic amounts of water, for different periods of time (Table 1). A Retsh MM400 ball mill, at 28 Hz, with two 7 mm stainless steel balls, was used for the grinding process. With the exception of BioMOF 2, all the other ones were isolated in quantitative yields (Figures S1–S5, Supporting Information).
Elemental CH analysis (%). Calc. for 1 (C18H30O8K2): C 47.8: H 6.7. Found: C 46.7; H 6.6. Calc. for 3 (C9H14O4Na2·H2O): C 43.2; H 6.5. Found: C 42.7; H 6.5. Calc. for 4 and 5 (C9H14O4Mg·3H2O): C 40.9; H 7.6. Found: C 39.5; H 7.5 for 4 and C 39.9; H 7.6 for 5.
Selected FTIR peaks (in cm–1). 1: νasym(C–O) = 1550; νsym(C–O) = 1400; ν(C=O) = 1700. 3: νasym(C–O) = 1560; νsym(C–O) = 1458; ν(O–H) = 3200. 4 and 5:
Cryst. Growth Des. 20, 370-382, 2020
νasym(C–O) = 1557; νsym(C–O) = 1453; ν(O–H) = 3400.
Table 1. LAG Experimental Conditions for Compounds 1–5
BioMOF Metal source
H2AZE (g)
molar ratio
Time
1 KOH
0.0465 g 0.1553 1:1 10 min
2 NaOH 0.363 g
0.1640 1:1 10 min
3 NaOH 0.061 g
0.1412 1:2 10 min
4 Mg(OH)2
0.0353 g 0.1652 1:1 15 min
5 Mg(OH)2
0.0357 g 0.1655 1:1 35 min
2.3. General characterization
Combined thermogravimetric analysis - differential scanning calorimetric (TGA-DSC) were carried out using a SDT Q-600 thermobalance from TA Instruments under air flow with a heating rate of 5 °C·min–1. The samples weights were in the 10–20 mg range.
Fourier transform infrared spectroscopy (FTIR) measurements were performed at room temperature (RT) on a Thermo Nicolet 6700 spectrometer with attenuated total reflectance (ATR) mode by averaging 32 scans at a maximum resolution of 4 cm–1, registering the spectra at a wavelength interval of 4500–650 cm–1. FTIR spectra were recorded by using the as-synthesized solids and after thermal treatment at 160 and 330 °C for 4 h.
Powder X-ray diffraction (PXRD) was used to ascertain bulk material purity of BioMOFs 1–5, by comparing the calculated (from SCXRD data) and experimental PXRD patterns (Figures S1–S5); to perform the reversibility studies of BioMOFs 3–5; and for the stability studies at different relative humidity conditions (ambient ∼50%, 75%, and 95% RH) of BioMOFs 1 and 3–5. The latter experiments were performed in desiccators, and the different humidity conditions were obtained using different salts (e.g., NaCl and K2SO4)(49) and were controlled with hygrometers.
A D8 Advance Bruker AXS θ-2θ diffractometer, equipped with a LYNXEYE-XE detector, copper radiation source (Cu Kα, λ = 1.5406 Å), operated at 40 kV and 40 mA, was used for the initial characterization (3–60° 2θ range, step size of 0.02° and 0.6 s per step) as well as for stability and reversibility studies (3–37° 2θ range, step size of 0.02° and 0.5 s per step). An Empyrean PANALYTICAL diffractometer, equipped with a PIXcel3D detector, copper radiation source (Cu Kα, λ = 1.5406 Å), operated at 45 kV and 40 mA, was used for the thermal stability studies (20–80° 2θ range, step size of 0.02° and 2.5 s per step). Variable-temperature powder X-ray diffraction (VTPXRD) was
performed using a D8 Advance Bruker AXS θ-2θ diffractometer equipped with a LYNXEYE-XE detector with a copper radiation source (Cu Kα, λ = 1.5406 Å), operated at 40 kV and 40 mA and an Anton Paar XRK 900 high-temperature chamber. Data were collected under a continuous compressed air flow (10 mL·min–1) in the 4–25° 2θ range from 30 to 600 °C at 10 °C intervals, using a step size of 0.03° and 1 s per step.
2.4. Single crystal X-ray studies
Suitable single crystals of compounds 1–5 were obtained by slow evaporation from aqueous solutions of the as-synthesized products. Crystals grew at ambient conditions in 1 week. Crystal structures of BioMOFs 1–5 were determined by single crystal X-ray diffraction (SCXRD) studies. Crystals were mounted on a loop with Fomblin protective oil. Data were collected on either a Bruker AXS-KAPPA APEX II or a Bruker AXS-KAPPA D8 QUEST, with graphite-monochromated radiation (Mo Kα, λ = 0.71073 Å) at 293 K. X-ray generator was operated at 50 kV and 30 mA and APEX2 and APEX3 program monitored data collection. Data were corrected for Lorentzian polarization and absorption effects using SAINT(50) and SADABS(51) programs. SHELXT 2014/4 (Sheldrick, 2014)(52) was used for structure solution and SHELXL 2014/7 (Sheldrick, 2014)(53) was used for full matrix least-squares refinement on F2. These two programs are included in the WINGX-Version 2014.1(54) program package. A full-matrix least-squares refinement was used for the non-hydrogen atoms with anisotropic thermal parameters. The HCH2 were inserted in idealized positions and allowed to refine in the parent carbon atom. The hydrogens of carboxylic groups and water molecules were located from the electron density map and allowed to refine freely. MERCURY 4.1.0(55) was used for packing diagrams and for polyhedral representation. PLATON(56) was used for determination of hydrogen bond interactions. Table2 summarizes data collection and refinement details.
2.5. Solubility studies by quantitative 1H NMR analysis
Saturated solutions of BioMOFs 1, 3, 4, and 5 in distilled water (600 μL), D2O (66 μL), and dioxane (5 μL; internal standard) were set by preparing suspensions and leaving them stirring at room temperature for 24 h. A solution of pure H2AZE was also prepared in exactly the same conditions as the previous ones. Measurements were carried out without adding buffer solutions to the medium. The pH of the solutions (upon saturation) ranged from 4.5 for BioMOF 1 and H2AZE to 8.5 for BioMOFs 3–5. Upon centrifugation (14100g for 25 min), 400 μL of each supernatant was transferred into a 5 mm-diameter NMR tube. All solubility experiments were performed in triplicate. 1H NMR spectra were recorded on a Bruker
Cryst. Growth Des. 20, 370-382, 2020
Table 2. Crystallographic Data for BioMOFs 1–5
1 2 3 4 5 Chemical formula
C18H30O4K2 C36H60O16Na4 C9H14O4Na2.H2O C9H14O4Mg.3(H2O) C9H14O4Mg.3(H2O)
Formula weight 905.24 840.80 250.20 264.56 264.56 Temperature
(K) 293 293 293 293 293
Wavelength (Å) 0.71073 0.71073 0.71073 0.71073 0.71073 Crystal form,
color Block, colorless Block, colorless Plate, colorless Block, colorless needle, colorless
Crystal size (mm)
0.20 x 0.06 x 0.04
0.18 x 0.12 x 0.05
0.24 x 0.10 x 0.08 0.16 x 0.06 x 0.04 0.12 x 0.04 x 0.03
Crystal system Orthorhombic orthorhombic Monoclinic Monoclinic Monoclinic
Space group Cmc21 Pca21 P21/c P21/c C2/c
a (Å) 28.6502(19) 20.055(2) 15.3808(12) 16.7783(12) 32.838(14)
b (Å) 12.3775(7) 7.1501(8) 7.9429(5) 8.2283(6) 8.200(3)
c (Å) 12.0530(6) 28.498(3) 9.3140(6) 9.0810(7) 9.095(4)
() 90 90 93.869(3) 95.083(4) 99.660(17)
V (Å3) 4274.2(4) 4086.4(7) 1135.28(14) 1249.59(16) 2414.4(18)
Z 4 4 4 4 8
d (mg.m-3) 1.407 1.367 1.464 1.406 1.456
µ (mm-1) 0.484 0.141 0.179 0.163 0.168
F(000) 1920 1792 528 568 1136
range () 2.694 – 26.849 2.153 – 26.437 3.374 – 26.404 2.437 – 26.421 2.517 – 25.424 Reflections
collected/unique 52153/4659 52734/8306 8633/2306 25277/2572 8572/2216
Rint 0.0465 0.2167 0.0452 0.0588 0.0794
GOF 1.027 0.928 0.960 1.042 0.940 Final R indices
[I > 2(I)] R1 = 0.0309, wR2 = 0.0762
R1 = 0.0609, wR2 = 0.0874
R1 = 0.0468, wR2 = 0.1175
R1 = 0.0346, wR2 = 0.0824
R1 = 0.0471, wR2 = 0.0783
Indices all data R1 = 0.0392, wR2 = 0.0794
R1 = 0.1679, wR2 = 0.1051
R1 = 0.0704, wR2 = 0.1272
R1 = 0.0497, wR2 = 0.0867
R1 = 0.1063, wR2 = 0.0886
Avance III 500 spectrometer (Bruker BioSpin GmbH, Rheinstetten, Germany) operating at 500 MHz and at 37 °C, to quantify the amount of each compound dissolved. The excitation-sculping pulse program (zgesgp, from Bruker library) was used for selective water suppression. A squa100.100 shaped pulse was used for selective water suppression (with 2000 μs duration and 1.85 mW). Spectra were recorded using 16 transients, collected into 32 k data points over a spectral width of 3623.19 Hz (7.24 ppm), and centered at 2313.72 Hz. The total acquisition time of each experiment was 1 min and 52 s. NMR processing was performed using MestreNova software, using phase and baseline manual correction. Integration regions were judiciously chosen for each compound. The median value of the normalized areas of the two downfield resonances of H2AZE was used for quantification purposes.
2.6. Antibacterial Activity
The Gram-positive S. aureus (ATCC 6538P) and S. epidermidis (NCIMB 8853) bacteria were used as reference strains for the antibacterial activity tests. The microorganisms were preserved at −80 °C in glycerol
(20% v/v) until their use. Reactivation was performed in nutrient broth (NB, 10 g·L–1 peptone, 5 g·L–1 sodium chloride, 5 g·L–1 meat extract and, for solid media, 15 g·L–1 powder agar) at 36 °C under stirring (150 rpm) and routinely tracked by measuring optical density (OD) at 600 nm.
The antimicrobial effect of the tested materials was evaluated using the agar diffusion method with agar plates prepared at pH 5.0 and 6.5, chosen as representative of the healthy skin (pH ranging from 4 to 7). For the diffusion tests, 6 mm-diameter pellets of the BioMOFs (∼30 mg compacted at 1 TON in a uniaxial press for 5 min) and the corresponding organic ligand and metal hydroxide (pelletized in the same way as the BioMOFs) were placed on the surface of soft agar plates. These were previously inoculated with 0.6 mL of 106 colony forming units (CFU) mL–1 of bacterial suspension pre-dried for 20 min at room temperature. Plates were incubated at 37 °C for 14 days. After predetermined time intervals, the plates were digitally photographed, and the areas of the inhibition zones were calculated. All experiments were repeated at least three times.
Cryst. Growth Des. 20, 370-382, 2020
3. Results and Discussion
3.1. Preparation of the Novel BioMOFs 1–5
Five novel BioMOF frameworks, [K2(H2AZE)(AZE)] (1), [Na4(HAZE)4] (2), [Na2(AZE)(H2O)] (3), and two polymorphic forms of [Mg(AZE)(H2O)3] (4) and (5), were successfully prepared by mechanosynthesis. Pure-phases were obtained for BioMOFs 1 and 3–5, but 2 was always obtained with a small amount of 3 (Figures S1–S5). Here, we present a complete structural characterization and studies regarding the stability, solubility, and antibacterial activity of the novel products.
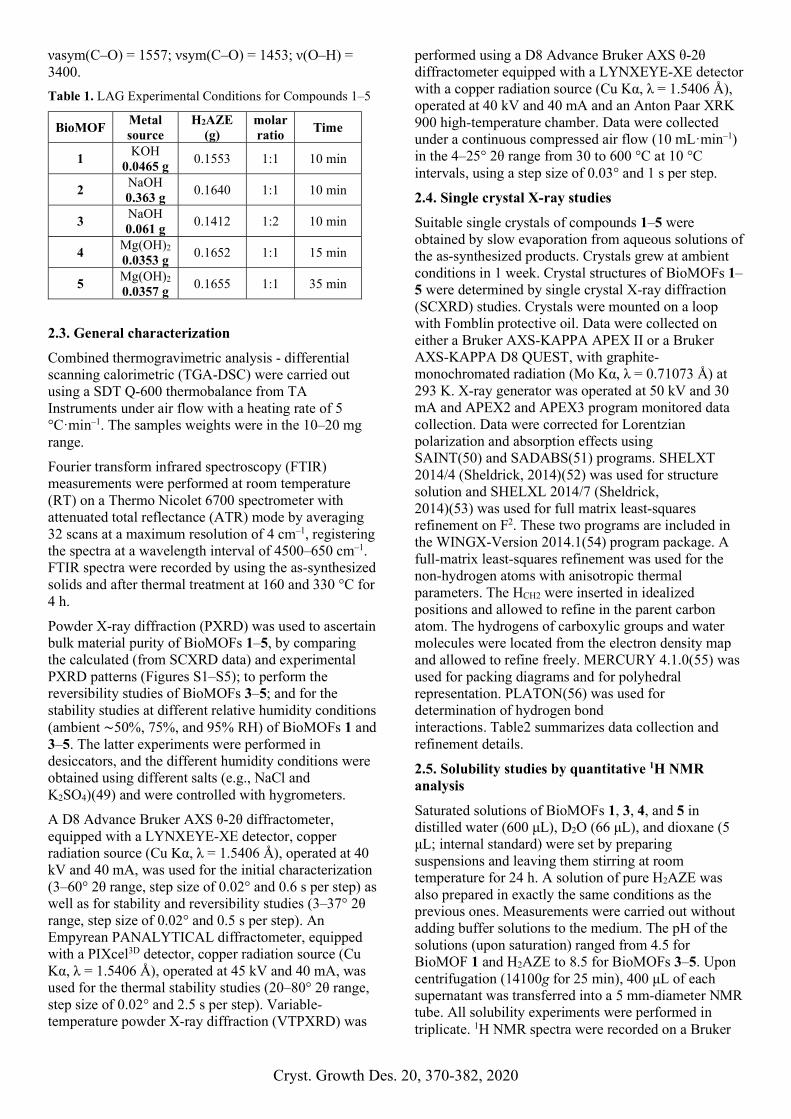
[K2(H2AZE)(AZE)] (1)
The asymmetric unit of 1 presents two independent K metal ions (K1 and K2), two half H2AZE, and two half AZE residues, residing on a mirror plane (Figure 1a). The presence of the neutral and dianionic moieties are confirmed by the carboxylic and carboxylate C–O distances in the range of 1.292(4)–1.296(4) and 1.208(5)–1.233(5) Å, respectively (Table S1), ensuring the charge balance. This is also corroborated by FTIR results with the presence of the typical asymmetric and symmetric ν(C–O) stretching bands of −COO– at ∼1550 and 1400 cm–1, as well as the vibrational mode ν(C=O) belonging to −COOH at ca. 1700 cm–1 (Figure S6).
Figure 1. (a) Polyhedral representation of K1 and K2 coordination sphere; (b) details on the coordination modes to K1 and K2; (c) crystal packing of 1 in a view along the c axis. H atoms were omitted for clarity. Color code: K+, purple; C atoms of AZE, blue; C atoms of H2AZE, green; OCOOH, OCOO
– red and square antiprismatic polyhedral representation, pale green.
Both independent K metal centers are coordinated to four H2AZE and four AZE, involving all the carboxylic/carboxylate oxygen atoms (OCOOH, OCOO
–) and generating similar square antiprismatic coordination spheres (CN = 8; Figure 1a). A detailed description of the coordination to each K atom is presented in Figure 1b, and Table S1 lists all the K–O bonding distances. The coordination around K1 is more distorted, with the planes defining the polyhedra making an angle of 9.61(2)° compared to 0.19(2)° for
K2. The metal clusters assemble in layers, parallel to the bc plane. These planes are separated by alternated layers of both H2AZE or AZE, running along a, generating an alternating ABACA packing along the same axis and giving rise to a 3D supramolecular arrangement (Figure 1c). An extended O–HCOOH···OCOO- hydrogen bond (HB) network among carboxylic and carboxylate moieties of neighboring azelaic acid reinforces the metal cluster layer (Table S6).
[Na4(HAZE)4] (2) and [Na2(AZE)(H2O)] (3)
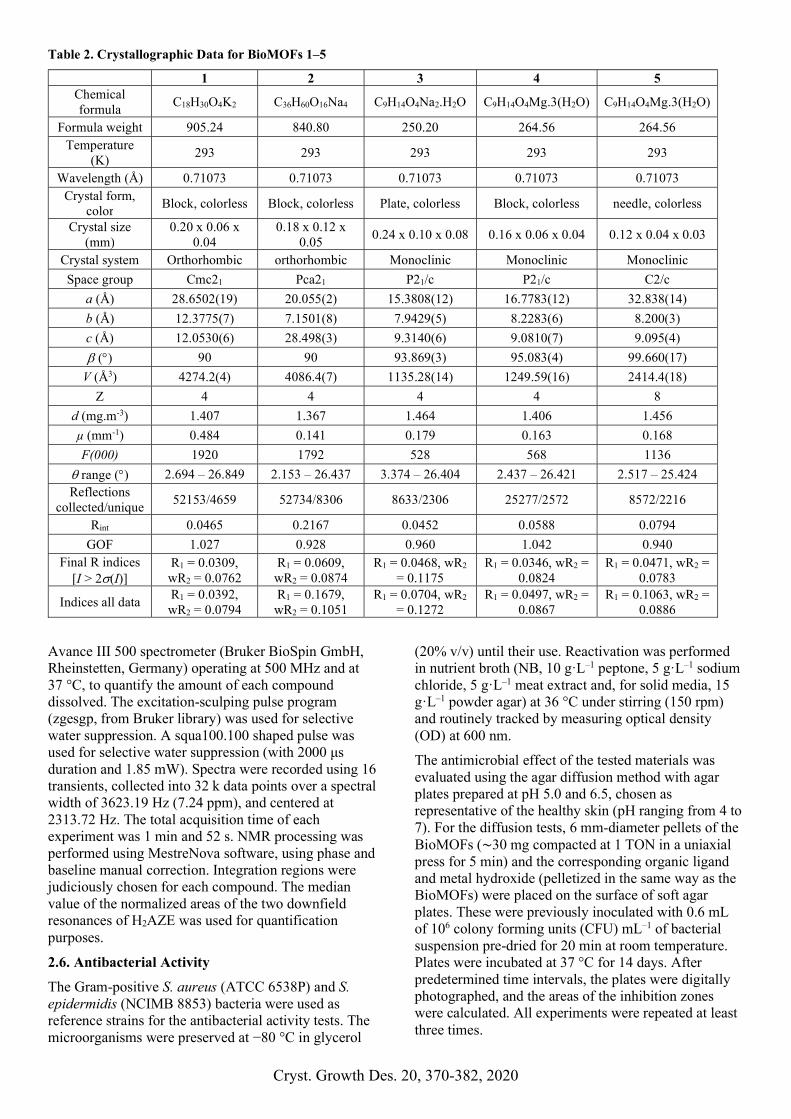
The asymmetric unit of 2 is composed of four independent Na metal centers (Na1, Na2, Na3, and Na4) and four independent HAZE moieties, as confirmed by the C–O distances in the carboxylate/carboxylic acid moieties (Table S2 and Figure 2a). Na2 and Na3, coordinated to six oxygen atoms, four OCOO
– (distances ranging from 2.323(5) to 2.402(5) Å), and two OCOOH (distances ranging from 2.622(5) to 2.994(5) Å), exhibit an octahedral geometry (CN = 6). In both metal centers, the axial positions are occupied by OCOO
–, with OCOO––
Na–OCOO– angles of 175.9(2) and 175.4(2)°,
respectively. Na1 and Na4 are coordinated to five OCOO
– (CN = 5), with square-pyramidal geometries. The Na1 coordination sphere is distorted, with the atoms of the basal plane deviating from their mean square plane ±0.365(2) to 0.439(2) Å compared to ±0.019(2) to 0.038(3) Å in the Na4 metal center. A detailed representation of the coordination modes of each Na atom is presented in Figure 2b. Metal clusters grow along the ab plane and alternate along the c axis with HAZE. A 3D framework is obtained, where O–HCOOH···OCOO- HB reinforce the metal cluster assemblies (Figure 3c and Table S6). As previously stated, BioMOF 2 is obtained mixed with 3, precluding further characterization for this BioMOF.
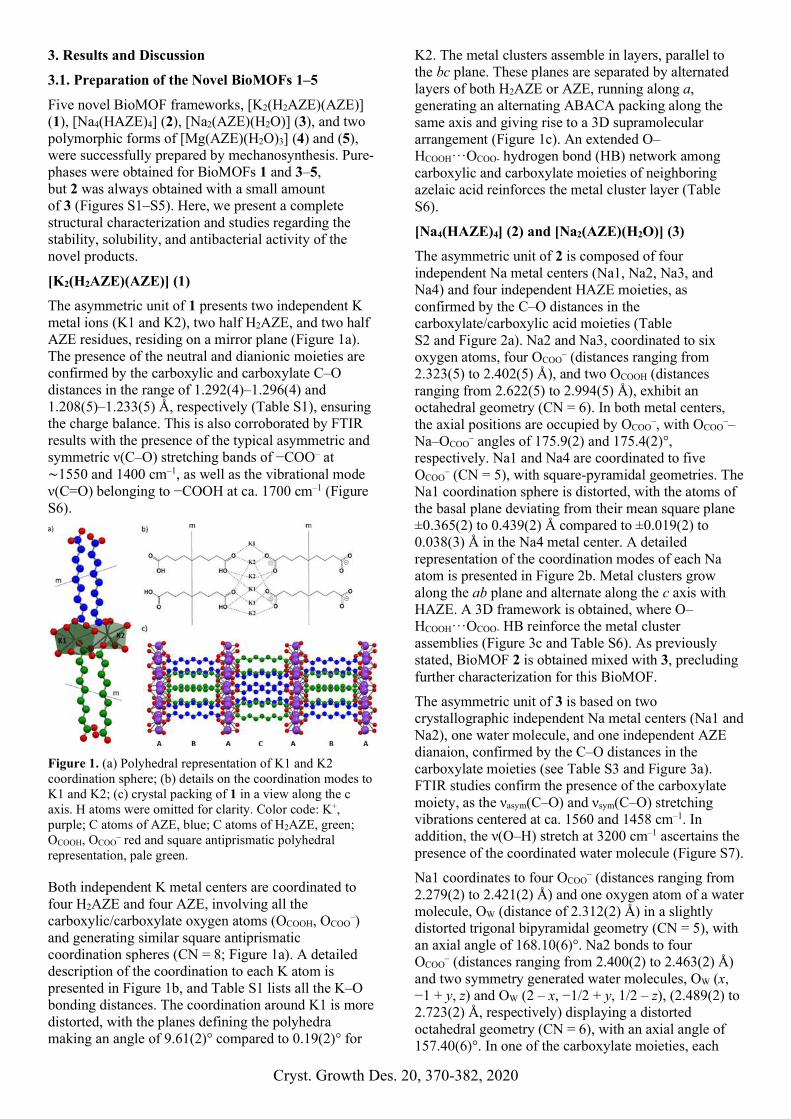
The asymmetric unit of 3 is based on two crystallographic independent Na metal centers (Na1 and Na2), one water molecule, and one independent AZE dianaion, confirmed by the C–O distances in the carboxylate moieties (see Table S3 and Figure 3a). FTIR studies confirm the presence of the carboxylate moiety, as the νasym(C–O) and νsym(C–O) stretching vibrations centered at ca. 1560 and 1458 cm–1. In addition, the ν(O–H) stretch at 3200 cm–1 ascertains the presence of the coordinated water molecule (Figure S7).
Na1 coordinates to four OCOO– (distances ranging from
2.279(2) to 2.421(2) Å) and one oxygen atom of a water molecule, OW (distance of 2.312(2) Å) in a slightly distorted trigonal bipyramidal geometry (CN = 5), with an axial angle of 168.10(6)°. Na2 bonds to four OCOO
– (distances ranging from 2.400(2) to 2.463(2) Å) and two symmetry generated water molecules, OW (x, −1 + y, z) and OW (2 – x, −1/2 + y, 1/2 – z), (2.489(2) to 2.723(2) Å, respectively) displaying a distorted octahedral geometry (CN = 6), with an axial angle of 157.40(6)°. In one of the carboxylate moieties, each
Cryst. Growth Des. 20, 370-382, 2020
OCOO– coordinates to two Na metal centers, while in the
other one coordinates to Na1 and the other coordinates to two Na2 and one Na1 (Figure 3b). Sodium clusters assemble in layers within the bc plane, alternating with AZE extending along a, generating a 3D network (Figure 3c). AZE dianions pack in columns extending along b, and AZE molecules display an angle of 15.70(2)° (Figure 3d). An HB network, where the OW acts as donor, Ow–H···OCOO
–, reinforces the metal layers (Figure 3c and Table S6).
Figure 2. (a) Polyhedral representation of the four crystallographic independent Na centers; (b) details on the HAZE coordination modes; (c) 3D supramolecular arrangement of 2 in a view along b. H atoms were omitted for clarity. Color code: Na+, purple; C atoms of HAZE, yellow: OCOOH, OCOO-, red; octahedral polyhedral representation, pale yellow, and square-pyramidal polyhedral representation, pale blue.
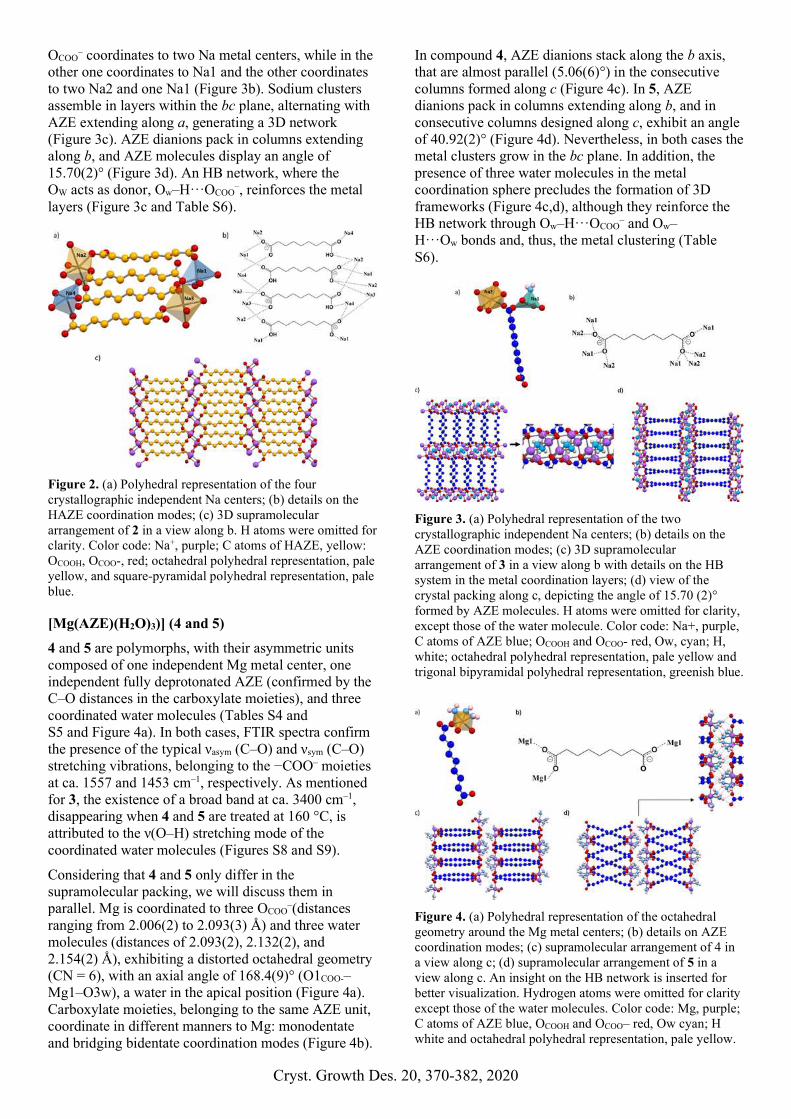
[Mg(AZE)(H2O)3)] (4 and 5)
4 and 5 are polymorphs, with their asymmetric units composed of one independent Mg metal center, one independent fully deprotonated AZE (confirmed by the C–O distances in the carboxylate moieties), and three coordinated water molecules (Tables S4 and S5 and Figure 4a). In both cases, FTIR spectra confirm the presence of the typical νasym (C–O) and νsym (C–O) stretching vibrations, belonging to the −COO– moieties at ca. 1557 and 1453 cm–1, respectively. As mentioned for 3, the existence of a broad band at ca. 3400 cm–1, disappearing when 4 and 5 are treated at 160 °C, is attributed to the ν(O–H) stretching mode of the coordinated water molecules (Figures S8 and S9).
Considering that 4 and 5 only differ in the supramolecular packing, we will discuss them in parallel. Mg is coordinated to three OCOO
–(distances ranging from 2.006(2) to 2.093(3) Å) and three water molecules (distances of 2.093(2), 2.132(2), and 2.154(2) Å), exhibiting a distorted octahedral geometry (CN = 6), with an axial angle of 168.4(9)° (O1COO-–Mg1–O3w), a water in the apical position (Figure 4a). Carboxylate moieties, belonging to the same AZE unit, coordinate in different manners to Mg: monodentate and bridging bidentate coordination modes (Figure 4b).
In compound 4, AZE dianions stack along the b axis, that are almost parallel (5.06(6)°) in the consecutive columns formed along c (Figure 4c). In 5, AZE dianions pack in columns extending along b, and in consecutive columns designed along c, exhibit an angle of 40.92(2)° (Figure 4d). Nevertheless, in both cases the metal clusters grow in the bc plane. In addition, the presence of three water molecules in the metal coordination sphere precludes the formation of 3D frameworks (Figure 4c,d), although they reinforce the HB network through Ow–H···OCOO
– and Ow–H···Ow bonds and, thus, the metal clustering (Table S6).
Figure 3. (a) Polyhedral representation of the two crystallographic independent Na centers; (b) details on the AZE coordination modes; (c) 3D supramolecular arrangement of 3 in a view along b with details on the HB system in the metal coordination layers; (d) view of the crystal packing along c, depicting the angle of 15.70 (2)° formed by AZE molecules. H atoms were omitted for clarity, except those of the water molecule. Color code: Na+, purple, C atoms of AZE blue; OCOOH and OCOO- red, Ow, cyan; H, white; octahedral polyhedral representation, pale yellow and trigonal bipyramidal polyhedral representation, greenish blue.
Figure 4. (a) Polyhedral representation of the octahedral geometry around the Mg metal centers; (b) details on AZE coordination modes; (c) supramolecular arrangement of 4 in a view along c; (d) supramolecular arrangement of 5 in a view along c. An insight on the HB network is inserted for better visualization. Hydrogen atoms were omitted for clarity except those of the water molecules. Color code: Mg, purple; C atoms of AZE blue, OCOOH and OCOO– red, Ow cyan; H white and octahedral polyhedral representation, pale yellow.
Cryst. Growth Des. 20, 370-382, 2020
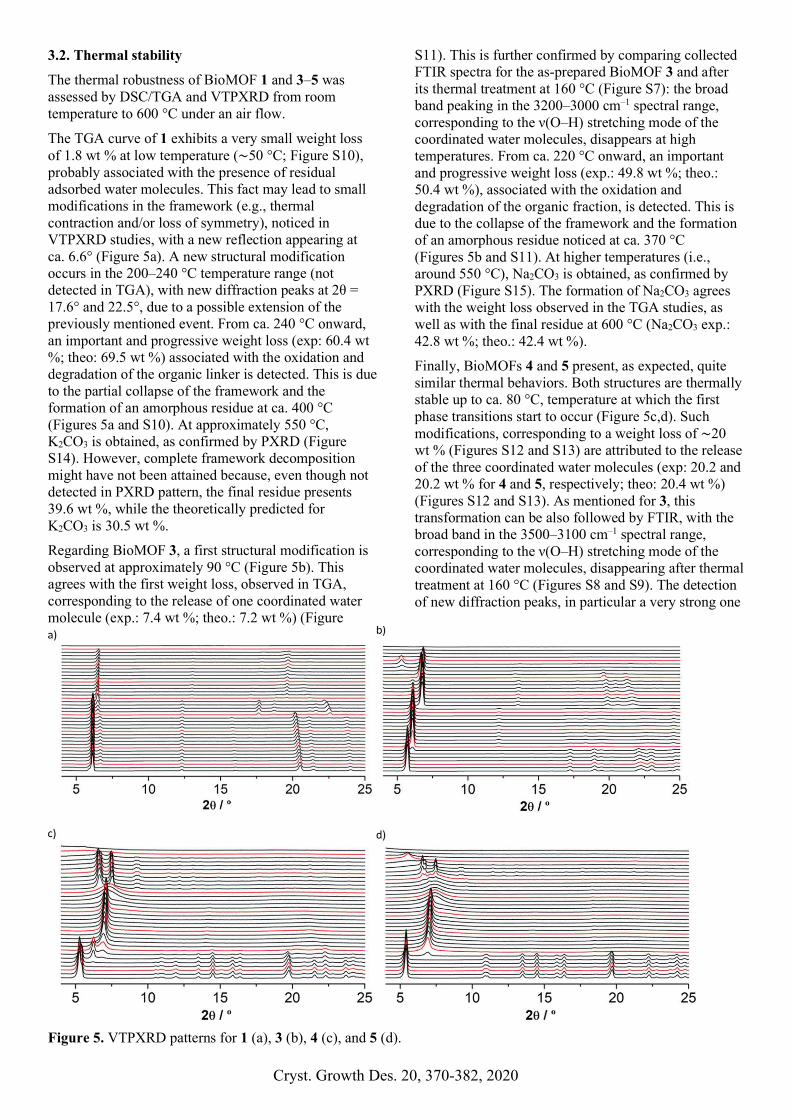
3.2. Thermal stability
The thermal robustness of BioMOF 1 and 3–5 was assessed by DSC/TGA and VTPXRD from room temperature to 600 °C under an air flow.
The TGA curve of 1 exhibits a very small weight loss of 1.8 wt % at low temperature (∼50 °C; Figure S10), probably associated with the presence of residual adsorbed water molecules. This fact may lead to small modifications in the framework (e.g., thermal contraction and/or loss of symmetry), noticed in VTPXRD studies, with a new reflection appearing at ca. 6.6° (Figure 5a). A new structural modification occurs in the 200–240 °C temperature range (not detected in TGA), with new diffraction peaks at 2θ = 17.6° and 22.5°, due to a possible extension of the previously mentioned event. From ca. 240 °C onward, an important and progressive weight loss (exp: 60.4 wt %; theo: 69.5 wt %) associated with the oxidation and degradation of the organic linker is detected. This is due to the partial collapse of the framework and the formation of an amorphous residue at ca. 400 °C (Figures 5a and S10). At approximately 550 °C, K2CO3 is obtained, as confirmed by PXRD (Figure S14). However, complete framework decomposition might have not been attained because, even though not detected in PXRD pattern, the final residue presents 39.6 wt %, while the theoretically predicted for K2CO3 is 30.5 wt %.
Regarding BioMOF 3, a first structural modification is observed at approximately 90 °C (Figure 5b). This agrees with the first weight loss, observed in TGA, corresponding to the release of one coordinated water molecule (exp.: 7.4 wt %; theo.: 7.2 wt %) (Figure
S11). This is further confirmed by comparing collected FTIR spectra for the as-prepared BioMOF 3 and after its thermal treatment at 160 °C (Figure S7): the broad band peaking in the 3200–3000 cm–1 spectral range, corresponding to the ν(O–H) stretching mode of the coordinated water molecules, disappears at high temperatures. From ca. 220 °C onward, an important and progressive weight loss (exp.: 49.8 wt %; theo.: 50.4 wt %), associated with the oxidation and degradation of the organic fraction, is detected. This is due to the collapse of the framework and the formation of an amorphous residue noticed at ca. 370 °C (Figures 5b and S11). At higher temperatures (i.e., around 550 °C), Na2CO3 is obtained, as confirmed by PXRD (Figure S15). The formation of Na2CO3 agrees with the weight loss observed in the TGA studies, as well as with the final residue at 600 °C (Na2CO3 exp.: 42.8 wt %; theo.: 42.4 wt %).
Finally, BioMOFs 4 and 5 present, as expected, quite similar thermal behaviors. Both structures are thermally stable up to ca. 80 °C, temperature at which the first phase transitions start to occur (Figure 5c,d). Such modifications, corresponding to a weight loss of ∼20 wt % (Figures S12 and S13) are attributed to the release of the three coordinated water molecules (exp: 20.2 and 20.2 wt % for 4 and 5, respectively; theo: 20.4 wt %) (Figures S12 and S13). As mentioned for 3, this transformation can be also followed by FTIR, with the broad band in the 3500–3100 cm–1 spectral range, corresponding to the ν(O–H) stretching mode of the coordinated water molecules, disappearing after thermal treatment at 160 °C (Figures S8 and S9). The detection of new diffraction peaks, in particular a very strong one
Figure 5. VTPXRD patterns for 1 (a), 3 (b), 4 (c), and 5 (d).
Cryst. Growth Des. 20, 370-382, 2020
at 2θ = 7°, confirms a new structural arrangement until ∼220 °C. Loss of crystallinity is observed from 220 to 270 °C, the temperature at which an important and progressive weight loss starts (exp: 64.1 and 63.8 wt % for 4 and 5; theo: 64.4 wt %), associated with the oxidation and degradation of the organic fraction, leading to the collapse of the framework and the formation of an amorphous residue noticed at ca. 370 °C (Figure 5c,d and Figures S12 and S13). At approximately 550 °C, MgO is obtained as confirmed by PXRD (Figures S16 and S17). The formation of MgO is in agreement with the weight loss observed in the TGA studies, as well as with the final residue at 600 °C (MgO exp: 15.7 wt % for 4 and 16 wt % for 5; theo: 15.2 wt %).
Because of the presence of coordinated water molecules in 3, 4, and 5, we decided to further study the stability of these compounds. BioMOF 3 presents a zeolitic behavior. In other words, when this compound releases its coordinated water molecules upon dehydration at ca. 160 °C for 24 h, it recovers its initial crystalline hydrated form with the simple addition of few drops of water (Figure S18).
The same procedure was carried out by using BioMOFs 4 and 5. Surprisingly, when few drops of water are added to their dehydrated forms, both return to the as-prepared compound 4 (Figures S19 and S20). Additionally, it was also observed that 4 can be easily converted into 5 by grinding it for 15 min in the presence of a small amount of water (30 μL; Scheme 1 and Figure S21).
Scheme 1. Schematic Representation of the Reversibility and/or Conversion Study Performed for 4 and 5
3.3. Solubility and moisture stability
Azelaic acid formulations are available as a gel (15%) or cream (20%), in which the API is present as a suspended solid, due to its poor water solubility. Solubilization is indeed the rate-limiting step in its percutaneous absorption (57). A completely solubilized water-based topical formulation is desirable to overcome the absorption problems of this API, while avoiding the use of additional formulation components (e.g., alcohols) often associated with undesirable side effects. Taking this into consideration, solubility studies were carried out for the BioMOFs reported herein.
The solubility of BioMOFs 1 and 3–5 was determined by quantitative 1H NMR (58). Interestingly, bulk materials present a significantly higher solubility when compared with free azelaic acid. In particular, BioMOF 3 possesses the highest solubility, up to 150-
fold higher than the one determined for the H2AZE precursor [613 (±27) g·L–1 vs 3.07 (±0.09) g·L–1]. Compound 1 registered a solubility of 131 (±8) g·L–1, followed by 4 and 5 with solubility values of 63 (±6) and 62 (±5) g·L–1, respectively (Figure S22 and Table S7). API solubility is strongly related to their bioavailability (59). In this case, the higher water solubility of H2AZE precursor in the BioMOFs might be beneficial for their future applications in topical formulations.
Envisaging this application, stability tests were carried out under different relative humidity (RH) conditions (RH = ambient ∼50, 75, and 95%) for 3 months. From PXRD analysis, no structural modifications were observed for 1 and 5 under all tested conditions (Figures S23 and S26). 3 is stable at ∼50 and 75% RH for 3 months, but at 95% RH, it rapidly deliquesces within 1 day (Figure S24), which might be associated with its extremely high solubility (see above). Concerning 4, its structural integrity strongly depends on the RH conditions: under ambient conditions 4 is maintained for 3 months (Figure S25); at 75% RH it tends to a mixture of 4 and 5 after 1 week, and the mixture was kept for 3 months; after 1 week under 95% RH, 4 completely transformed into 5, with 5 being stable until the end of the 3 months (Figure S25).
In summary, obtained data suggest that (i) all solids present a higher solubility than the free azelaic acid, which could increase their bioavailability and (ii) BioMOF 5 is the most stable polymorph, which might be correlated with the packing efficiency of the solids, 70.8 and 73.6% for 4 and 5, respectively.
3.4. Antibacterial activity
Considering the probed antibacterial activity of the H2AZE organic ligand, as well as their wide use in the treatment of skin disorders, we further evaluated the biological activity of the new BioMOFs 1 and 3–5 against S. aureus, a Gram-positive bacterium usually found in the skin. This microorganism is considered one of the most important human pathogenic bacteria causing a wide variety of infections and syndromes in skin and soft tissues (60,61). It is widely known that S. aureus treatment is marked by the development of resistance to each new class of antistaphylococcal antimicrobial drugs, including penicillins, sulfonamides, tetracyclines, glycopeptides, and others, hampering the development of successful therapies and promoting the search for more suitable bactericidal treatments (62).
Pelletized BioMOFs, as well as H2AZE and the metal precursors (used as controls), were placed in contact with agar plates at pH 5.0 and 6.5 inoculated with S. aureus (Figures 6 and 7). These pH values were selected considering the normal facial skin pH (4.5–5.5) as well as the acne skin pH (6.5) (63). The antibacterial activity was evaluated by monitoring the inhibition halo (see Figures 8, S27 and S28).
Cryst. Growth Des. 20, 370-382, 2020
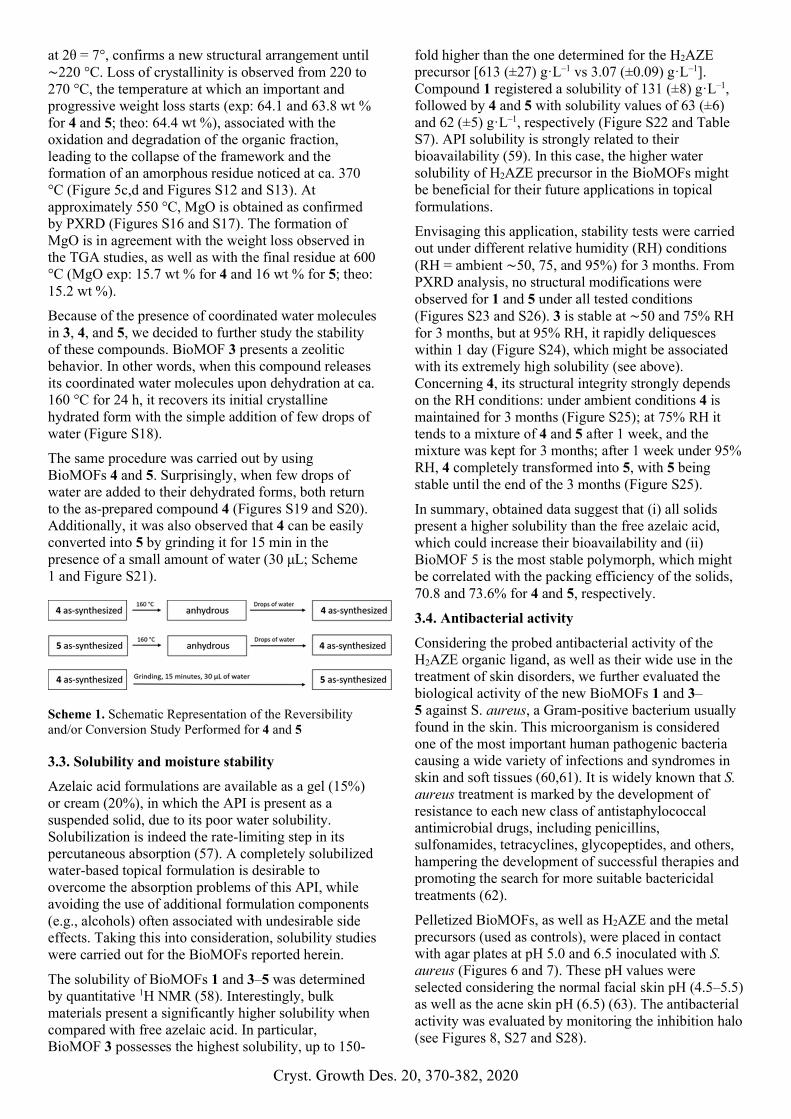
Figure 6. Halo inhibition zone expressed in mm2 for (a) 1, azelaic acid (AZE ∼) and KOH; (b) 3, azelaic acid and NaOH; (c) 4, azelaic acid and Mg(OH)2; and (d) 5, azelaic acid and Mg(OH)2. Experiments were carried out for 14 days with cultures of S. aureus in agar plates (pH 5.0) at 37 °C. The area of pellets was 28.8 ± 1.1 mm2. Error bars represent standard deviation.
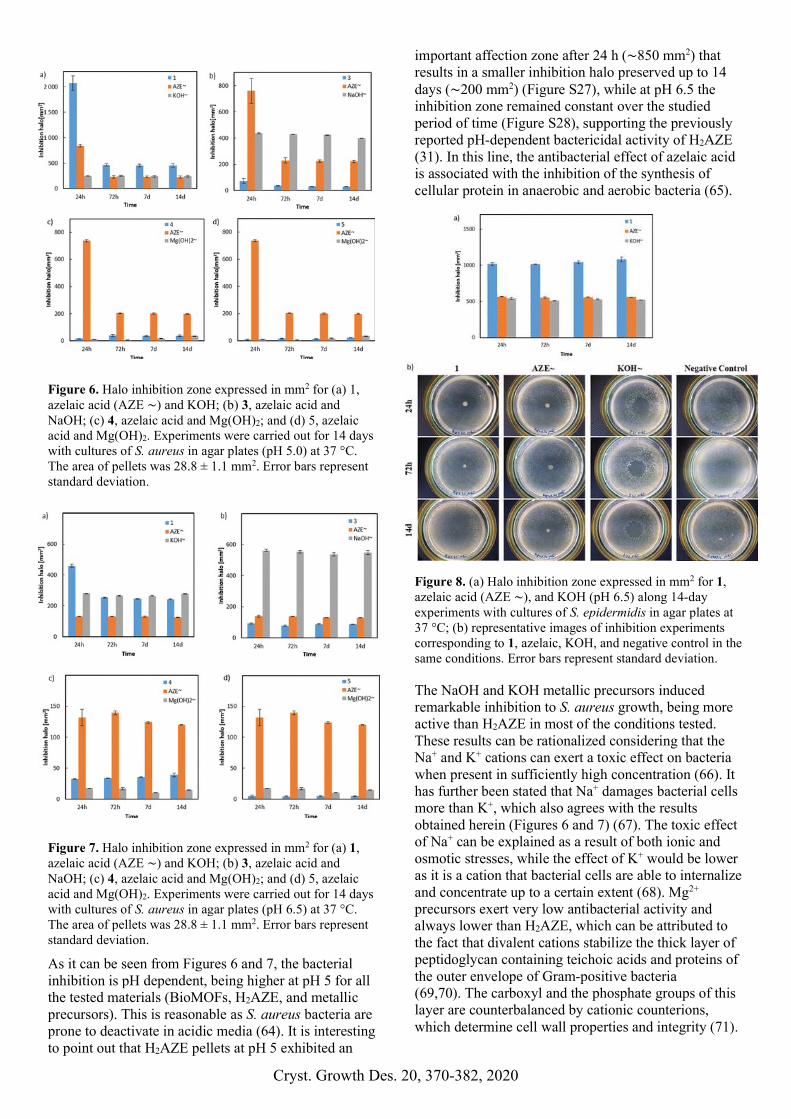
Figure 7. Halo inhibition zone expressed in mm2 for (a) 1, azelaic acid (AZE ∼) and KOH; (b) 3, azelaic acid and NaOH; (c) 4, azelaic acid and Mg(OH)2; and (d) 5, azelaic acid and Mg(OH)2. Experiments were carried out for 14 days with cultures of S. aureus in agar plates (pH 6.5) at 37 °C. The area of pellets was 28.8 ± 1.1 mm2. Error bars represent standard deviation.
As it can be seen from Figures 6 and 7, the bacterial inhibition is pH dependent, being higher at pH 5 for all the tested materials (BioMOFs, H2AZE, and metallic precursors). This is reasonable as S. aureus bacteria are prone to deactivate in acidic media (64). It is interesting to point out that H2AZE pellets at pH 5 exhibited an
important affection zone after 24 h (∼850 mm2) that results in a smaller inhibition halo preserved up to 14 days (∼200 mm2) (Figure S27), while at pH 6.5 the inhibition zone remained constant over the studied period of time (Figure S28), supporting the previously reported pH-dependent bactericidal activity of H2AZE (31). In this line, the antibacterial effect of azelaic acid is associated with the inhibition of the synthesis of cellular protein in anaerobic and aerobic bacteria (65).
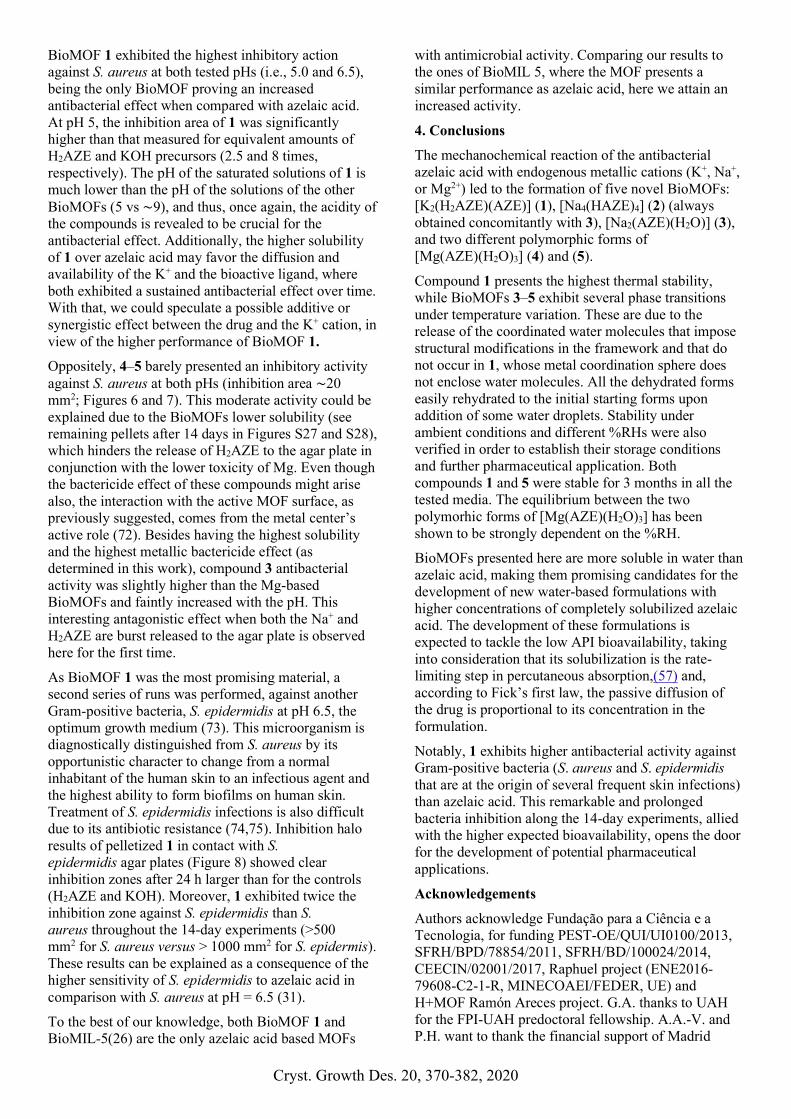
Figure 8. (a) Halo inhibition zone expressed in mm2 for 1, azelaic acid (AZE ∼), and KOH (pH 6.5) along 14-day experiments with cultures of S. epidermidis in agar plates at 37 °C; (b) representative images of inhibition experiments corresponding to 1, azelaic, KOH, and negative control in the same conditions. Error bars represent standard deviation.
The NaOH and KOH metallic precursors induced remarkable inhibition to S. aureus growth, being more active than H2AZE in most of the conditions tested. These results can be rationalized considering that the Na+ and K+ cations can exert a toxic effect on bacteria when present in sufficiently high concentration (66). It has further been stated that Na+ damages bacterial cells more than K+, which also agrees with the results obtained herein (Figures 6 and 7) (67). The toxic effect of Na+ can be explained as a result of both ionic and osmotic stresses, while the effect of K+ would be lower as it is a cation that bacterial cells are able to internalize and concentrate up to a certain extent (68). Mg2+
precursors exert very low antibacterial activity and always lower than H2AZE, which can be attributed to the fact that divalent cations stabilize the thick layer of peptidoglycan containing teichoic acids and proteins of the outer envelope of Gram-positive bacteria (69,70). The carboxyl and the phosphate groups of this layer are counterbalanced by cationic counterions, which determine cell wall properties and integrity (71).
Cryst. Growth Des. 20, 370-382, 2020
BioMOF 1 exhibited the highest inhibitory action against S. aureus at both tested pHs (i.e., 5.0 and 6.5), being the only BioMOF proving an increased antibacterial effect when compared with azelaic acid. At pH 5, the inhibition area of 1 was significantly higher than that measured for equivalent amounts of H2AZE and KOH precursors (2.5 and 8 times, respectively). The pH of the saturated solutions of 1 is much lower than the pH of the solutions of the other BioMOFs (5 vs ∼9), and thus, once again, the acidity of the compounds is revealed to be crucial for the antibacterial effect. Additionally, the higher solubility of 1 over azelaic acid may favor the diffusion and availability of the K+ and the bioactive ligand, where both exhibited a sustained antibacterial effect over time. With that, we could speculate a possible additive or synergistic effect between the drug and the K+ cation, in view of the higher performance of BioMOF 1.
Oppositely, 4–5 barely presented an inhibitory activity against S. aureus at both pHs (inhibition area ∼20 mm2; Figures 6 and 7). This moderate activity could be explained due to the BioMOFs lower solubility (see remaining pellets after 14 days in Figures S27 and S28), which hinders the release of H2AZE to the agar plate in conjunction with the lower toxicity of Mg. Even though the bactericide effect of these compounds might arise also, the interaction with the active MOF surface, as previously suggested, comes from the metal center’s active role (72). Besides having the highest solubility and the highest metallic bactericide effect (as determined in this work), compound 3 antibacterial activity was slightly higher than the Mg-based BioMOFs and faintly increased with the pH. This interesting antagonistic effect when both the Na+ and H2AZE are burst released to the agar plate is observed here for the first time.
As BioMOF 1 was the most promising material, a second series of runs was performed, against another Gram-positive bacteria, S. epidermidis at pH 6.5, the optimum growth medium (73). This microorganism is diagnostically distinguished from S. aureus by its opportunistic character to change from a normal inhabitant of the human skin to an infectious agent and the highest ability to form biofilms on human skin. Treatment of S. epidermidis infections is also difficult due to its antibiotic resistance (74,75). Inhibition halo results of pelletized 1 in contact with S. epidermidis agar plates (Figure 8) showed clear inhibition zones after 24 h larger than for the controls (H2AZE and KOH). Moreover, 1 exhibited twice the inhibition zone against S. epidermidis than S. aureus throughout the 14-day experiments (>500 mm2 for S. aureus versus > 1000 mm2 for S. epidermis). These results can be explained as a consequence of the higher sensitivity of S. epidermidis to azelaic acid in comparison with S. aureus at pH = 6.5 (31).
To the best of our knowledge, both BioMOF 1 and BioMIL-5(26) are the only azelaic acid based MOFs
with antimicrobial activity. Comparing our results to the ones of BioMIL 5, where the MOF presents a similar performance as azelaic acid, here we attain an increased activity.
4. Conclusions
The mechanochemical reaction of the antibacterial azelaic acid with endogenous metallic cations (K+, Na+, or Mg2+) led to the formation of five novel BioMOFs: [K2(H2AZE)(AZE)] (1), [Na4(HAZE)4] (2) (always obtained concomitantly with 3), [Na2(AZE)(H2O)] (3), and two different polymorphic forms of [Mg(AZE)(H2O)3] (4) and (5).
Compound 1 presents the highest thermal stability, while BioMOFs 3–5 exhibit several phase transitions under temperature variation. These are due to the release of the coordinated water molecules that impose structural modifications in the framework and that do not occur in 1, whose metal coordination sphere does not enclose water molecules. All the dehydrated forms easily rehydrated to the initial starting forms upon addition of some water droplets. Stability under ambient conditions and different %RHs were also verified in order to establish their storage conditions and further pharmaceutical application. Both compounds 1 and 5 were stable for 3 months in all the tested media. The equilibrium between the two polymorhic forms of [Mg(AZE)(H2O)3] has been shown to be strongly dependent on the %RH.
BioMOFs presented here are more soluble in water than azelaic acid, making them promising candidates for the development of new water-based formulations with higher concentrations of completely solubilized azelaic acid. The development of these formulations is expected to tackle the low API bioavailability, taking into consideration that its solubilization is the rate-limiting step in percutaneous absorption,(57) and, according to Fick’s first law, the passive diffusion of the drug is proportional to its concentration in the formulation.
Notably, 1 exhibits higher antibacterial activity against Gram-positive bacteria (S. aureus and S. epidermidis that are at the origin of several frequent skin infections) than azelaic acid. This remarkable and prolonged bacteria inhibition along the 14-day experiments, allied with the higher expected bioavailability, opens the door for the development of potential pharmaceutical applications.
Acknowledgements
Authors acknowledge Fundação para a Ciência e a Tecnologia, for funding PEST-OE/QUI/UI0100/2013, SFRH/BPD/78854/2011, SFRH/BD/100024/2014, CEECIN/02001/2017, Raphuel project (ENE2016-79608-C2-1-R, MINECOAEI/FEDER, UE) and H+MOF Ramón Areces project. G.A. thanks to UAH for the FPI-UAH predoctoral fellowship. A.A.-V. and P.H. want to thank the financial support of Madrid
Cryst. Growth Des. 20, 370-382, 2020
Community (CAM PEJD-2016/IND-2828). P.H. acknowledges the Spanish Ramón y Cajal Programme (Grant Agreement No. 2014-16823).
References
1 Keskin, S.; Kizilel, S. Biomedical Applications of Metal Organic Frameworks. Ind. Eng. Chem. Res. 2011, 50, 1799– 1812, DOI: 10.1021/ie101312k
2 Rojas, S.; Devic, T.; Horcajada, P. Metal organic frameworks based on bioactive components. J. Mater. Chem. B 2017, 5, 2560– 2573, DOI: 10.1039/C6TB03217F
3 Liu, J. W.; Chen, L. F.; Cui, H.; Zhang, J. Y.; Zhang, L.; Su, C. Y. Applications of metal-organic frameworks in heterogeneous supramolecular catalysis. Chem. Soc. Rev. 2014, 43, 6011– 6061, DOI: 10.1039/C4CS00094C
4 Corma, A.; Garcia, H.; Xamena, F. Engineering Metal Organic Frameworks for Heterogeneous Catalysis. Chem. Rev. 2010, 110, 4606– 4655, DOI: 10.1021/cr9003924
5 Li, H.; Wang, K. C.; Sun, Y. J.; Lollar, C. T.; Li, J. L.; Zhou, H. C. Recent advances in gas storage and separation using metal-organic frameworks. Mater. Today 2018, 21, 108– 121, DOI: 10.1016/j.mattod.2017.07.006
6 Wang, B.; Xie, L.-H.; Wang, X.; Liu, X.-M.; Li, J.; Li, J.-R. Applications of metal organic frameworks for green energy and environment: New advances in adsorptive gas separation, storage and removal. Green Energy & Environment 2018, 3, 191– 228, DOI: 10.1016/j.gee.2018.03.001
7 Li, B.; Wen, H. M.; Zhou, W.; Chen, B. L. Porous Metal-Organic Frameworks for Gas Storage and Separation: What, How, and Why?. J. Phys. Chem. Lett. 2014, 5, 3468– 3479, DOI: 10.1021/jz501586e
8 Adil, K.; Belmabkhout, Y.; Pillai, R. S.; Cadiau, A.; Bhatt, P. M.; Assen, A. H.; Maurin, G.; Eddaoudi, M. Gas/vapour separation using ultra-microporous metal-organic frameworks: insights into the structure/separation relationship. Chem. Soc. Rev. 2017, 46, 3402– 3430, DOI: 10.1039/C7CS00153C
9 Horcajada, P.; Serre, C.; Vallet-Regi, M.; Sebban, M.; Taulelle, F.; Ferey, G. Metal-organic frameworks as efficient materials for drug delivery. Angew. Chem., Int. Ed. 2006, 45, 5974– 5978, DOI: 10.1002/anie.200601878
10 Levine, D. J.; Runcevski, T.; Kapelewski, M. T.; Keitz, B. K.; Oktawiec, J.; Reed, D. A.; Mason, J. A.; Jiang, H. Z. H.; Colwell, K. A.; Legendre, C. M.; FitzGerald, S. A.; Long, J. R. Olsalaiine-Based Metal-Organic Frameworks as Biocompatible Platforms for H2 Adsorption and Drug Delivery. J. Am. Chem. Soc. 2016, 138, 10143– 10150, DOI: 10.1021/jacs.6b03523
11 Hinks, N. J.; McKinlay, A. C.; Xiao, B.; Wheatley, P. S.; Morris, R. E. Metal organic frameworks as NO delivery materials for biological applications. Microporous Mesoporous Mater. 2010, 129, 330– 334, DOI: 10.1016/j.micromeso.2009.04.031
12 Cunha, D.; Ben Yahia, M.; Hall, S.; Miller, S. R.; Chevreau, H.; Elkaim, E.; Maurin, G.; Horcajada, P.; Serre, C. Rationale of Drug Encapsulation and Release from Biocompatible Porous Metal-Organic Frameworks. Chem. Mater. 2013, 25, 2767– 2776, DOI: 10.1021/cm400798p
13 Della Rocca, J.; Liu, D.; Lin, W. Nanoscale Metal-Organic Frameworks for Biomedical Imaging and Drug Delivery. Acc. Chem. Res. 2011, 44, 957– 968, DOI: 10.1021/ar200028a
14 Wang, X. G.; Dong, Z. Y.; Cheng, H.; Wan, S. S.; Chen, W. H.; Zou, M. Z.; Huo, J. W.; Deng, H. X.; Zhang, X. Z. A multifunctional metal-organic framework based tumor targeting drug delivery system for cancer therapy. Nanoscale 2015, 7, 16061– 16070, DOI: 10.1039/C5NR04045K
15 Sun, C.-Y.; Qin, C.; Wang, X.-L.; Su, Z.-M. Metal-organic frameworks as potential drug delivery systems. Expert Opin. Drug Delivery 2013, 10, 89– 101, DOI: 10.1517/17425247.2013.741583
16 Miller, S. R.; Heurtaux, D.; Baati, T.; Horcajada, P.; Greneche, J. M.; Serre, C. Biodegradable therapeutic MOFs for the delivery of bioactive molecules. Chem. Commun. 2010, 46, 4526– 4528, DOI: 10.1039/c001181a
17 Simon-Yarza, T.; Rojas, S.; Horcajada, P.; Serre, C. 4.38 The situation of Metal-Organic Frameworks in Biomedicine. In Compr. Biomater. II; Elsevier, 2017; Vol. 4, pp 719– 749
18 Rojas, S.; Arenas-Vivo, A.; Horcajada, P. Metal-organic frameworks: A novel platform for combined advanced therapies. Coord. Chem. Rev. 2019, 388, 202– 226, DOI: 10.1016/j.ccr.2019.02.032
19 Horcajada, P.; Gref, R.; Baati, T.; Allan, P. K.; Maurin, G.; Couvreur, P.; Ferey, G.; Morris, R. E.; Serre, C. Metal-Organic Frameworks in Biomedicine. Chem. Rev. 2012, 112, 1232– 1268, DOI: 10.1021/cr200256v
20 An, J. Y.; Geib, S. J.; Rosi, N. L. Cation-Triggered Drug Release from a Porous Zinc-Adeninate Metal-Organic Framework. J. Am. Chem. Soc. 2009, 131 (24), 8376– 8377, DOI: 10.1021/ja902972w
21 Horcajada, P.; Serre, C.; Maurin, G.; Ramsahye, N. A.; Balas, F.; Vallet-Regi, M.; Sebban, M.; Taulelle, F.; Ferey, G. Flexible porous metal-organic frameworks for a controlled drug delivery. J. Am. Chem. Soc. 2008, 130, 6774– 6780, DOI: 10.1021/ja710973k
22 Rojas, S.; Carmona, F. J.; Maldonado, C. R.; Horcajada, P.; Hidalgo, T.; Serre, C.; Navarro, J.
Cryst. Growth Des. 20, 370-382, 2020
A. R.; Barea, E. Nanoscaled Zinc Pyrazolate Metal-Organic Frameworks as Drug-Delivery Systems. Inorg. Chem. 2016, 55, 2650– 2663, DOI: 10.1021/acs.inorgchem.6b00045
23 Rojas, S.; Carmona, F. J.; Maldonado, C. R.; Barea, E.; Navarro, J. A. R. RAPTA-C incorporation and controlled delivery from MIL-100(Fe) nanoparticles. New J. Chem. 2016, 40, 5690– 5694, DOI: 10.1039/C5NJ02741A
24 Hu, Q.; Yu, J. C.; Liu, M.; Liu, A. P.; Dou, Z. S.; Yang, Y. A Low Cytotoxic Cationic Metal-Organic Framework Carrier for Controllable Drug Release. J. Med. Chem. 2014, 57, 5679– 5685, DOI: 10.1021/jm5004107
25 Su, H.; Sun, F.; Jia, J.; He, H.; Wang, A.; Zhu, G. A highly porous medical metal-organic framework constructed from bioactive curcumin. Chem. Commun. 2015, 51, 5774– 5777, DOI: 10.1039/C4CC10159F
26 Tamames-Tabar, C.; Imbuluzqueta, E.; Guillou, N.; Serre, C.; Miller, S. R.; Elkaim, E.; Horcajada, P.; Blanco-Prieto, M. J. A Zn azelate MOF: combining antibacterial effect. CrystEngComm 2015, 17, 456– 462, DOI: 10.1039/C4CE00885E
27 Andre, V.; Quaresma, S.; da Silva, J. L. F.; Duarte, M. T. Exploring mechanochemistry to turn organic bio-relevant molecules into metal-organic frameworks: A short review. Beilstein J. Org. Chem. 2017, 13, 2416, DOI: 10.3762/bjoc.13.239
28 McKinlay, A. C.; Morris, R. E.; Horcajada, P.; Ferey, G.; Gref, R.; Couvreur, P.; Serre, C. BioMOFs: Metal-Organic Frameworks for Biological and Medical Applications. Angew. Chem., Int. Ed. 2010, 49, 6260– 6266, DOI: 10.1002/anie.201000048
29 Freund, R.; Lachelt, U.; Gruber, T.; Ruhle, B.; Wuttke, S. Multifunctional Efficiency: Extending the Concept of Atom Economy to Functional Nanomaterials. ACS Nano 2018, 12, 2094– 2105, DOI: 10.1021/acsnano.8b00932
30 Lammers, T.; Kiessling, F.; Hennink, W. E.; Storm, G. Drug targeting to tumors: Principles, pitfalls and (pre-) clinical progress. J. Controlled Release 2012, 161, 175– 187, DOI: 10.1016/j.jconrel.2011.09.063
31 Charnock, C.; Brudeli, B.; Klaveness, J. Evaluation of the antibacterial efficacy of diesters of azelaic acid. Eur. J. Pharm. Sci. 2004, 21, 589– 596, DOI: 10.1016/j.ejps.2003.12.006
32 Grimes, P.; Kelly, A. P.; Torok, H.; Willis, I. Community-based trial of a triple-combination agent for the treatment of facial melasma. Cutis 2006, 77, 177– 184
33 Katsambas, A.; Dessinioti, C New and emerging treatments in dermatology: acne. Dermatol. Ther. 2008, 21, 86– 95, DOI: 10.1111/j.1529-8019.2008.00175.x
34 Thiboutot, D. M.; Fleischer, A. B.; Del Rosso, J. Q.; Graupe, K. Azelaic acid 15% gel once daily versus twice daily in papulopustular rosacea. J. Drugs Dermatol. 2008, 7, 541– 546
35 Liu, R. H.; Smith, M. K.; Basta, S. A.; Farmer, E. R. Azelaic acid in the treatment of papulopustular rosacea - A systematic review of randomized controlled trials. Arch. Dermatol. 2006, 142, 1047– 1052, DOI: 10.1001/archderm.142.8.1047
36 Lowe, N. J.; Rizk, D.; Grimes, P.; Billips, M.; Pincus, S. Azelaic acid 20% cream in the treatment of facial hyperpigmentation in darker-skinned patients. Clin. Ther. 1998, 20, 945– 959, DOI: 10.1016/S0149-2918(98)80076-3
37 Farshi, S. Comparative study of therapeutic effects of 20% azelaic acid and hydroquinone 4% cream in the treatment of melasma. J. Cosmet. Dermatol. 2011, 10, 282– 287, DOI: 10.1111/j.1473-2165.2011.00580.x
38 Bojar, R. A.; Cutcliffe, A. G.; Graupe, K.; Cunliffe, W. J.; Holland, K. T. Follicular concentration of Azelaic acid after a single topical application. Br. J. Dermatol. 1993, 129, 399– 402, DOI: 10.1111/j.1365-2133.1993.tb03165.x
39 Manosroi, J.; Apriyani, M. G.; Foe, K.; Manosroi, A. Enhancement of the release of azelaic acid through the synthetic membranes by inclusion complex formation with hydroxypropyl-beta-cyclodextrin. Int. J. Pharm. 2005, 293, 235– 240, DOI: 10.1016/j.ijpharm.2005.01.009
40 Allen, F. H. The Cambridge Structural Database: a quarter of a million crystal structures and rising. Acta Crystallogr., Sect. B: Struct. Sci. 2002, 58, 380– 388, DOI: 10.1107/S0108768102003890
41 Grzesiak, M.; Nitek, W.; Rafalska-Lasocha, A.; Lasocha, W. Investigations of new barium dicarboxylates. Z. Kristallogr. - Cryst. Mater. 2012, 227, 629– 634, DOI: 10.1524/zkri.2012.1535
42 https://www.lenntech.com/recommended-daily-intake.htm, 2019
43 Fromm, K. M. Coordination polymer networks with s-block metal ions. Coord. Chem. Rev. 2008, 252, 856– 885, DOI: 10.1016/j.ccr.2007.10.032
44 Vormann, J. Magnesium: nutrition and metabolism. Mol. Aspects Med. 2003, 24, 27– 37, DOI: 10.1016/S0098-2997(02)00089-4
45 Laires, M. J.; Monteiro, C. P.; Bicho, M. Role of cellular magnesium in health and human disease. Front. Biosci., Landmark Ed. 2004, 9, 262– 276, DOI: 10.2741/1223
46 Lockless, S. W.; Zhou, M.; MacKinnon, R. Structural and thermodynamic properties of selective ion binding in a K+ channel. PLoS Biol.
Cryst. Growth Des. 20, 370-382, 2020
2007, 5, e121, DOI: 10.1371/journal.pbio.0050121
47 Strazzullo, P.; Leclercq, C. Sodium. Adv. Nutr. 2014, 5, 188– 190, DOI: 10.3945/an.113.005215
48 James, S. L.; Adams, C. J.; Bolm, C.; Braga, D.; Collier, P.; Friscic, T.; Grepioni, F.; Harris, K. D. M.; Hyett, G.; Jones, W.; Krebs, A.; Mack, J.; Maini, L.; Orpen, A. G.; Parkin, I. P.; Shearouse, W. C.; Steed, J. W.; Waddell, D. C. Mechanochemistry: opportunities for new and cleaner synthesis. Chem. Soc. Rev. 2012, 41, 413– 447, DOI: 10.1039/C1CS15171A
49 Young, J. F. Humidity control in the laboratory using salt solutions—a review. J. Appl. Chem. 1967, 17, 241– 245, DOI: 10.1002/jctb.5010170901
50 Bruker AXS: SAINT+, release 6.22; Bruker Analytical Systems: Madison, WI, 2005
51 Bruker AXS:SADABS; Bruker Analytical Systems: Madison, WI, 2005
52 Sheldrick, G. M. SHELXT - Integrated space-group and crystal-structure determination. Acta Crystallogr., Sect. A: Found. Adv. 2015, 71, 3– 8, DOI: 10.1107/S2053273314026370
53 Sheldrick, G. M. Crystal structure refinement with SHELXL. Acta Crystallogr., Sect. C: Struct. Chem. 2015, 71, 3– 8, DOI: 10.1107/S2053229614024218
54 Farrugia, L. J. J. Appl. Crystallogr. 1999, 32, 837– 838, DOI: 10.1107/S0021889899006020
55 Macrae, C. F.; Bruno, I. J.; Chisholm, J. A.; Edgington, P. R.; McCabe, P.; Pidcock, E.; Rodriguez-Monge, L.; Taylor, R.; van de Streek, J.; Wood, P. A. Mercury CSD 2.0 - new features for the visualization and investigation of crystal structures. J. Appl. Crystallogr. 2008, 41, 466– 470, DOI: 10.1107/S0021889807067908
56 Spek, A. L. Single-crystal structure validation with the program PLATON. J. Appl. Crystallogr. 2003, 36, 7– 13, DOI: 10.1107/S0021889802022112
57 Li, N.; Wu, X. H.; Jia, W. B.; Zhang, M. C.; Tan, F. P.; Zhang, J. Effect of ionization and vehicle on skin absorption and penetration of azelaic acid. Drug Dev. Ind. Pharm. 2012, 38, 985– 994, DOI: 10.3109/03639045.2011.635376
58 Bharti, S. K.; Roy, R. Quantitative H-1 NMR spectroscopy. TrAC, Trends Anal. Chem. 2012, 35, 5– 26, DOI: 10.1016/j.trac.2012.02.007
59 Khadka, P.; Ro, J.; Kim, H.; Kim, I.; Kim, J. T.; Kim, H.; Cho, J. M.; Yun, G.; Lee, J. Pharmaceutical particle technologies: An approach to improve drug solubility, dissolution and bioavailability. Asian J. Pharm. Sci. 2014, 9, 304– 316, DOI: 10.1016/j.ajps.2014.05.005
60 Kobayashi, S. D.; Malachowa, N.; DeLeo, F. R. Pathogenesis of Staphylococcus aureus Abscesses. Am. J. Pathol. 2015, 185, 1518– 1527, DOI: 10.1016/j.ajpath.2014.11.030
61 Tong, S. Y. C.; Davis, J. S.; Eichenberger, E.; Holland, T. L.; Fowler, V. G. Staphylococcus aureus Infections: Epidemiology, Pathophysiology, Clinical Manifestations, and Management. Clin. Microbiol. Rev. 2015, 28, 603– 661, DOI: 10.1128/CMR.00134-14
62 David, M. Z.; Daum, R. S. Treatment of Staphylococcus aureus Infections. Curr. Top. Microbiol. Immunol. 2017, 409, 325– 383, DOI: 10.1007/82_2017_42
63 Prakash, C.; Bhargava, P.; Tiwari, S.; Majumdar, B.; Bhargava, R. K. Skin Surface pH in Acne Vulgaris: Insights from an Observational Study and Review of the Literature. J. Clin. Aesthet. Dermatol. 2017, 10, 33– 39
64 Minor, T. E.; Marth, E. H. Loss of viability by Staphylococcus aureus in acidified media 1. Inactivation by several acids, mixtures of acids, and salts of acids. J. Milk Food Technol. 1972, 35, 191– 196, DOI: 10.4315/0022-2747-35.4.191
65 https://www.drugbank.ca/drugs/DB00548, 2019 66 Yasuyuki, M.; Kunihiro, K.; Kurissery, S.;
Kanavillil, N.; Sato, Y.; Kikuchi, Y. Antibacterial properties of nine pure metals: a laboratory study using Staphylococcus aureus and Escherichia coli. Biofouling 2010, 26, 851– 858, DOI: 10.1080/08927014.2010.527000
67 McMahon, D. J.; Oberg, C. J.; Drake, M. A.; Farkye, N.; Moyes, L. V.; Arnold, M. R.; Ganesan, B.; Steele, J.; Broadbent, J. R. Effect of sodium, potassium, magnesium, and calcium salt cations on pH, proteolysis, organic acids, and microbial populations during storage of full-fat Cheddar cheese. J. Dairy Sci. 2014, 97, 4780– 98, DOI: 10.3168/jds.2014-8071
68 Stewart, C. M.; Cole, M. B.; Legan, J. D.; Slade, L.; Vandeven, M. H.; Schaffner, D. W. Staphylococcus aureus growth boundaries: moving towards mechanistic predictive models based on solute-specific effects. Appl. Environ. Microbiol. 2002, 68, 1864– 1871, DOI: 10.1128/AEM.68.4.1864-1871.2002
69 Santiago-Morales, J.; Amariei, G.; Leton, P.; Rosal, R. Antimicrobial activity of poly(vinyl alcohol)-poly(acrylic acid) electrospun nanofibers. Colloids Surf., B 2016, 146, 144– 151, DOI: 10.1016/j.colsurfb.2016.04.052
70 Clifton, L. A.; Skoda, M. W. A.; Le Brun, A. P.; Ciesielski, F.; Kuzmenko, I.; Holt, S. A.; Lakey, J. H. Effect of Divalent Cation Removal on the Structure of Gram-Negative Bacterial Outer Membrane Models. Langmuir 2015, 31, 404– 412, DOI: 10.1021/la504407v
71 Thomas, K. J.; Rice, C. V. Revised model of calcium and magnesium binding to the bacterial cell wall. BioMetals 2014, 27, 1361– 70, DOI: 10.1007/s10534-014-9797-5
72 Wyszogrodzka, G.; Marszalek, B.; Gil, B.; Dorozynski, P. Metal-organic frameworks: mechanisms of antibacterial action and potential
Cryst. Growth Des. 20, 370-382, 2020
applications. Drug Discovery Today 2016, 21, 1009– 1018, DOI: 10.1016/j.drudis.2016.04.009
73 Macdonald, W. A.; Watts, J.; Bowmer, M. I. Factors afecting Staphylococcus-Epidermidis growth in peritoneal- dialysis solutions. J. Clin. Microbiol. 1986, 24, 104– 107
74 Le, K. Y.; Park, M. D.; Otto, M. Immune Evasion Mechanisms of Staphylococcus epidermidis Biofilm Infection. Front. Microbiol. 2018, 9, 9, DOI: 10.3389/fmicb.2018.00359
75 Vuong, C.; Otto, M. Staphylococcus epidermidis infections. Microbes Infect. 2002, 4, 481– 489, DOI: 10.1016/S1286-4579(02)01563-0
Cryst. Growth Des. 20, 370-382, 2020
SUPPLEMENTARY MATERIAL
Novel antibacterial azelaic acid BioMOFs
Silvia Quaresma1, Vânia André1,2, Alexandra M. M. Antunes1, Sérgio M. F. Vilela3, Georgiana Amariei4, Ana Arenas-Vivo3, Roberto Rosal4, Patricia Horcajada3, M. Teresa Duarte1 1 Centro de Química Estrutural, Instituto Superior Técnico, Universidade de Lisboa, Av. Rovisco Pais, 1,
1049-001 Lisboa, Portugal 2 Associação do Instituto Superior Técnico para a Investigação e Desenvolvimento, Av. Rovisco Pais,1,
1049-003 Lisboa, Portugal 3 Advanced Porous Materials Unit (APMU), IMDEA Energy Institute, Av. Ramón de la Sagra 3, E-28935
Móstoles, Madrid, Spain 4 Department of Chemical Engineering, University of Alcalá, E-28871 Alcalá de Henares, Madrid, Spain Contents Figure S1. PXRD patterns of the experimental (top) and simulated (bottom) compound 1.
Figure S2. PXRD patterns of the experimental compound 2 (top), and simulated compound 2 (middle) and 3 (bottom)
Figure S3. PXRD patterns of the experimental (top) and simulated (bottom) compound 3.
Figure S4. PXRD patterns of the experimental (top) and simulated (bottom) compound 4.
Figure S5. PXRD patterns of the experimental (top) and simulated (bottom) compound 5.
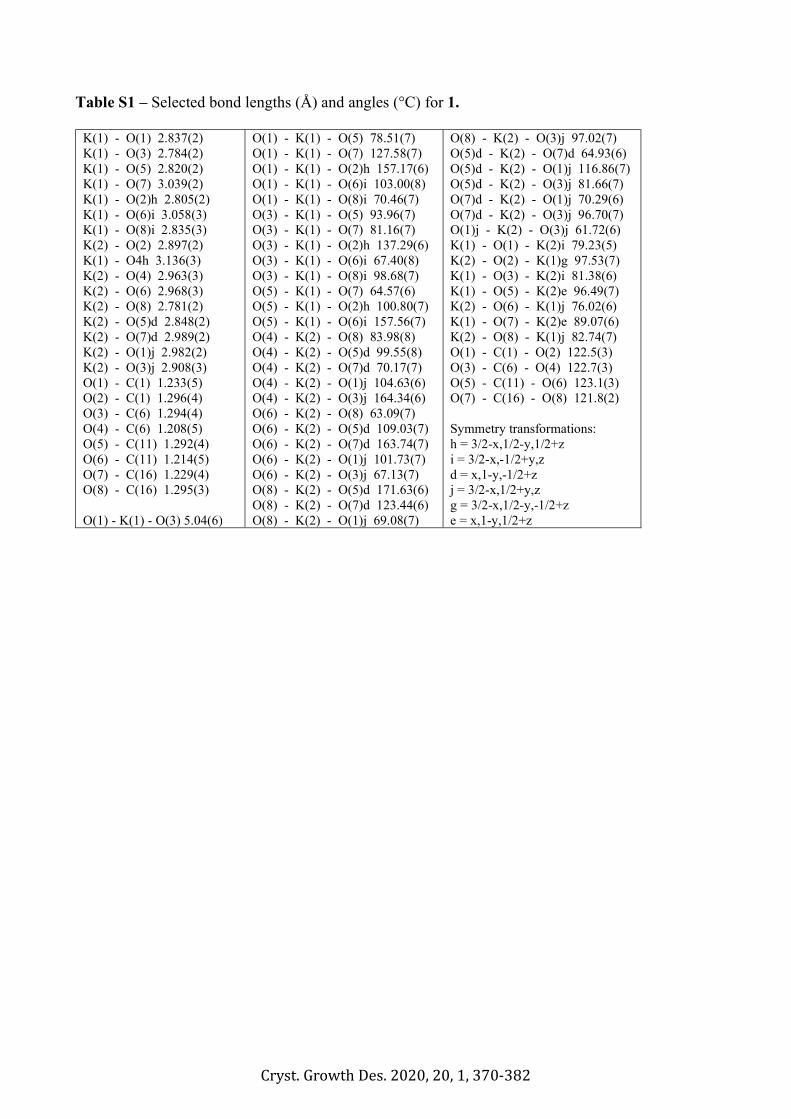
Table S1 – Selected bond lengths (Å) and angles (°C) for 1.
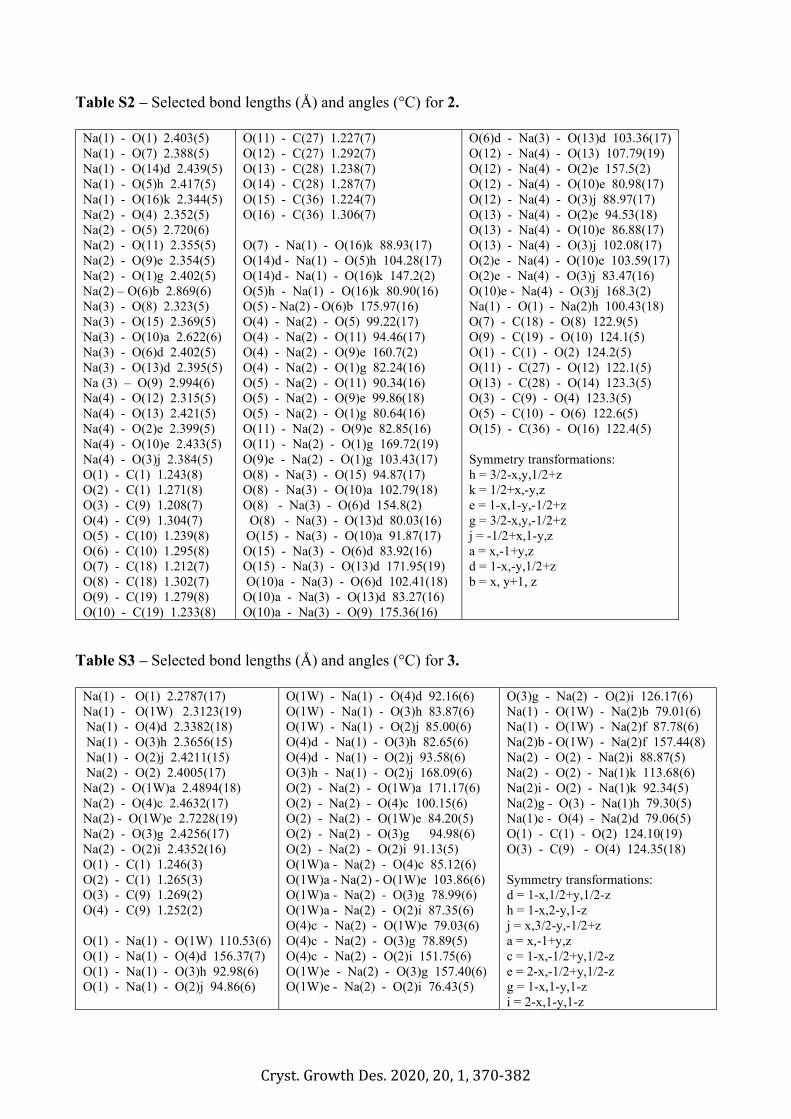
Table S2 – Selected bond lengths (Å) and angles (°C) for 2. Table S3 – Selected bond lengths (Å) and angles (°C) for 3.
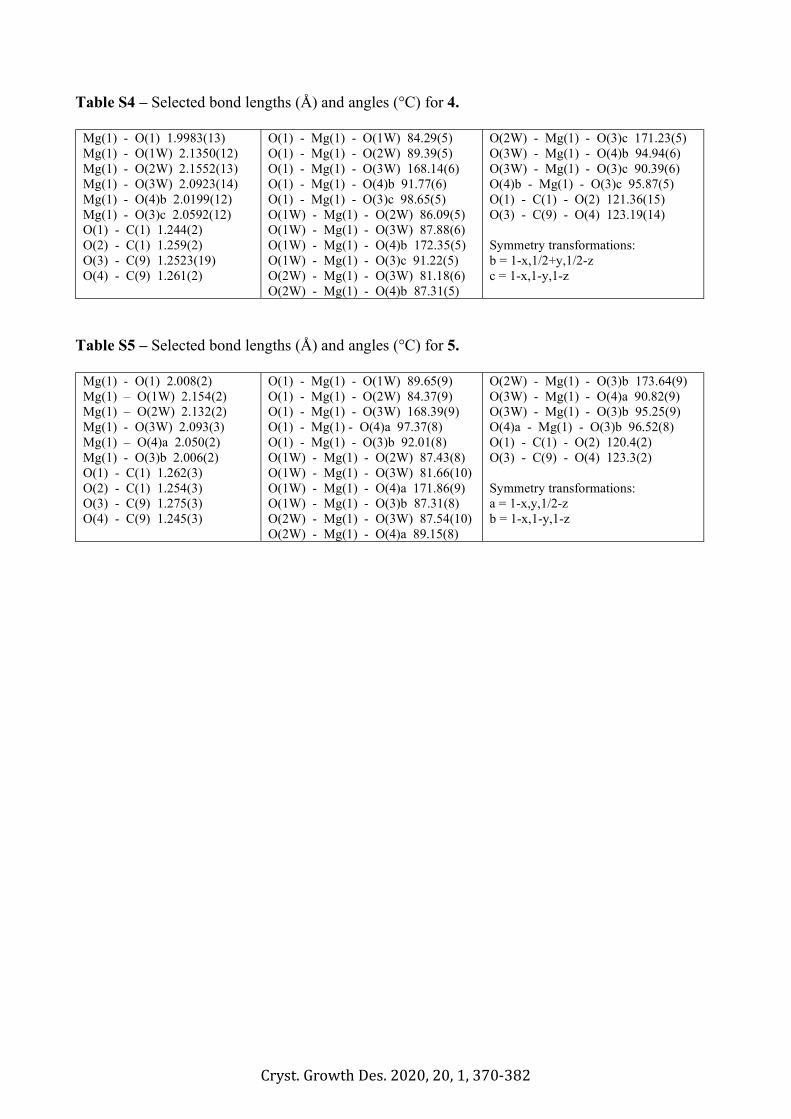
Table S4 – Selected bond lengths (Å) and angles (°C) for 4. Table S5 – Selected bond lengths (Å) and angles (°C) for 5.
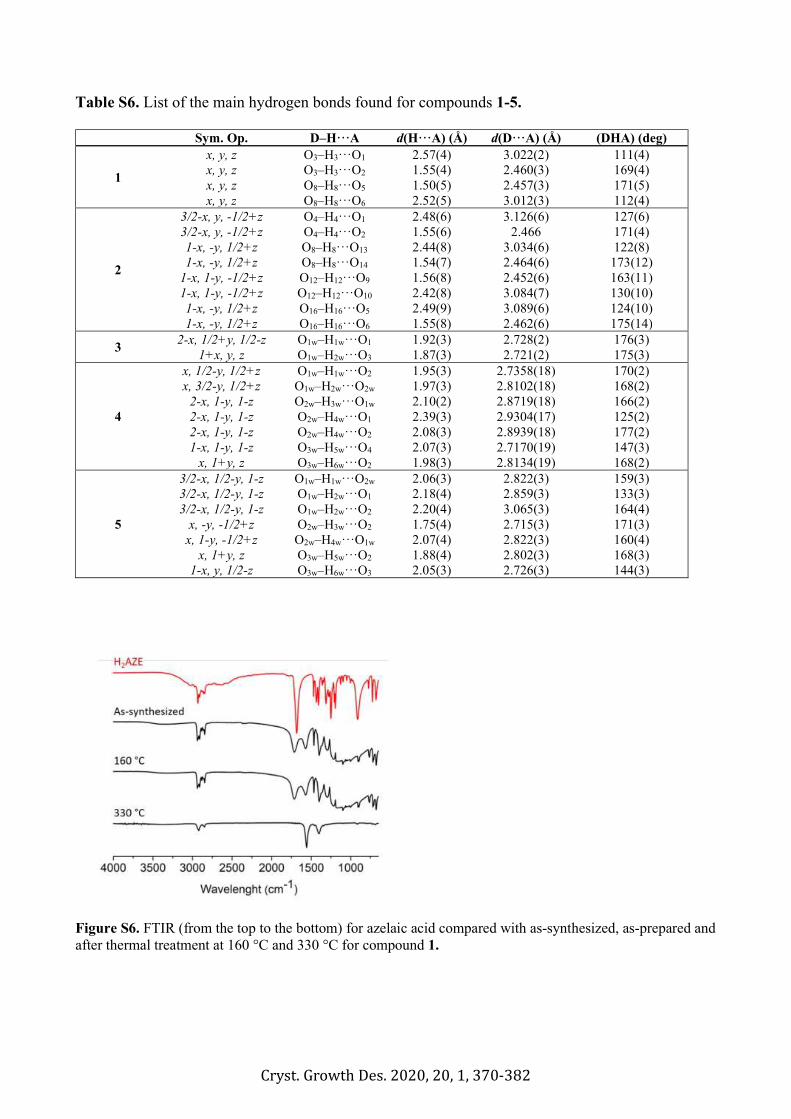
Table S6. List of the main hydrogen bonds found for compounds 1-5.
Figure S6. FTIR (from the top to the bottom) for azelaic acid compared with as-synthesized, as-prepared and after thermal treatment at 160 °C and 330 °C for compound 1.
Figure S7. FTIR (from the top to the bottom) for azelaic acid compared with as-synthesized, as-prepared and after thermal treatment at 160 °C and 330 °C for compound 3.
Figure S8. FTIR (from the top to the bottom) for azelaic acid compared with as-synthesized, as-prepared and after thermal treatment at 160 °C and 330 °C for compound 4.
Figure S9. FTIR (from the top to the bottom) for azelaic acid compared with as-synthesized, as-prepared and after thermal treatment at 160 °C and 330 °C for compound 5.
Figure S10. DSC (black) and TGA (blue) of compound 1.
Figure S11. DSC (black) and TGA (blue) of compound 3.
Figure S12. DSC (black) and TGA (blue) of compound 4.
Figure S13. DSC (black) and TGA (blue) of compound 5.
Figure S14. Comparison between the experimental PXRD pattern of 1 obtained after TGA studies (top) and the powder pattern of K2CO3 (bottom) available at Crystallography Open Database with the code COD 9009645.
Figure S15. Comparison between the experimental PXRD pattern of 3 obtained after TGA studies (top) and the powder pattern of K2CO3 (bottom) available at Crystallography Open Database with the code COD 9009418.
Figure S16. Comparison between the experimental PXRD pattern of 4 obtained after TGA studies (top) and the
Cryst. Growth Des. 20, 370-382, 2020
powder pattern of K2CO3 (bottom) available at Crystallography Open Database with the code COD 5000225.
Figure S17. Comparison between the experimental PXRD pattern of 5 obtained after TGA studies (top) and the powder pattern of K2CO3 (bottom) available at Crystallography Open Database with the code COD 5000225.
Figure S18. PXRD patterns of the as-synthesized 3 (top), after treatment at 160 °C for 24h (middle) and after rehydration (bottom).
Figure S19. PXRD patterns of the as-synthesized 4 (top), after treatment at 160 °C for 24h (middle) and after rehydration (bottom).
Figure S20. PXRD patterns (from top to bottom) of the as-synthesized 5 and 4, after treatment of 5 at 160 °C for 24h after rehydration.
Figure S21. PXRD patterns of the as-synthesized 4 (top), after grinding for 10 min with 30 µL of water (middle) and the as-synthesized 5 (bottom).
Figure S22. 1NMR spectra of (from the bottom to top) Azelaic acid (H2AZE), compound 5, 4, 1 and 3.
Table S7. BioMOFs 1, 3-5 solubility in mol(H2AZE) L-1 and in g(MOF) L-1.
Figure S23. PXRD patterns (from the top to the bottom) of the as-synthesized 1 and after shelf and moisture treatment for 3 months at ambient (~ 50%), 75 % and 95 % RH conditions.
Figure S24. PXRD patterns (from the top to the bottom) of the as-synthesized 3, after shelf and moisture treatment for 3 months at ambient (~ 50%) and 75 % RH conditions and after 1 day at 95 % RH conditions, as it liquifies.
Figure S25. PXRD patterns (from the top to the bottom) of the as-synthesized 4 and 5 after shelf and moisture treatment of 4 for 3 months at ambient (~ 50%) and 75 % RH conditions.
Figure S26. PXRD patterns (from the top to the bottom) of the as-synthesized 5 and after shelf and moisture treatment for 3 months at ambient (~ 50%), 75 % and 95 % RH conditions.
Figure S27. Halo inhibition zone experiments for the pelletized compounds 1 and 3-5 prepared in this work in contact with S. aureus cultures in agar plates (pH 5) at 37 °C for 14 days.
Figure S28. Halo inhibition zone experiments for pelletized compounds 1 and 3-5 prepared in this work in contact with S. aureus cultures in agar plates (pH 6.5) at 37 °C for 14 days.
Cryst. Growth Des. 20, 370-382, 2020
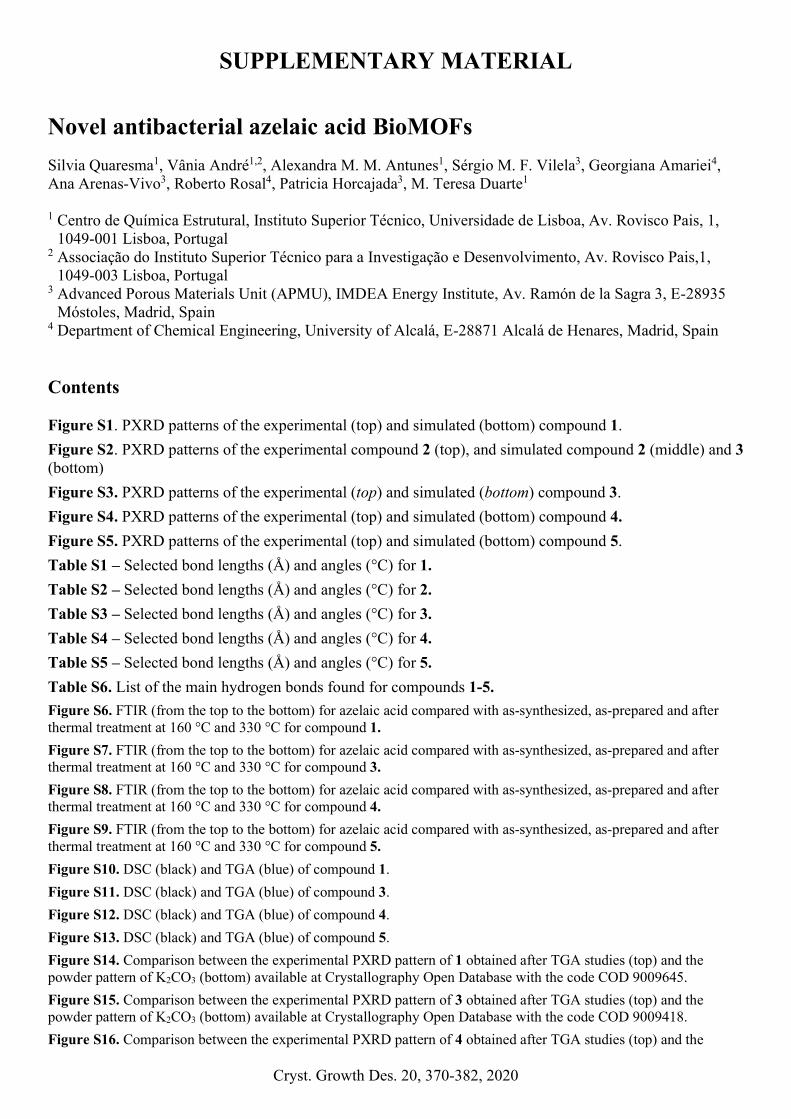
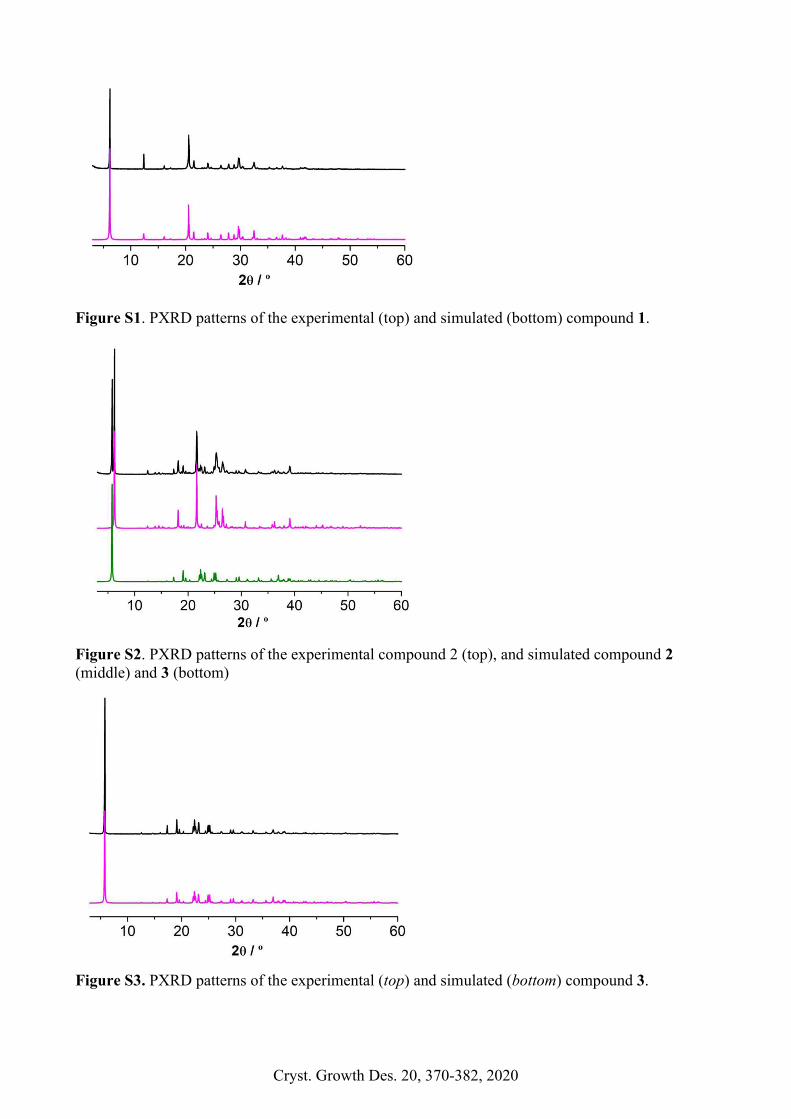
Figure S1. PXRD patterns of the experimental (top) and simulated (bottom) compound 1.
Figure S2. PXRD patterns of the experimental compound 2 (top), and simulated compound 2 (middle) and 3 (bottom)
Figure S3. PXRD patterns of the experimental (top) and simulated (bottom) compound 3.
Cryst. Growth Des. 2020, 20, 1, 370-382
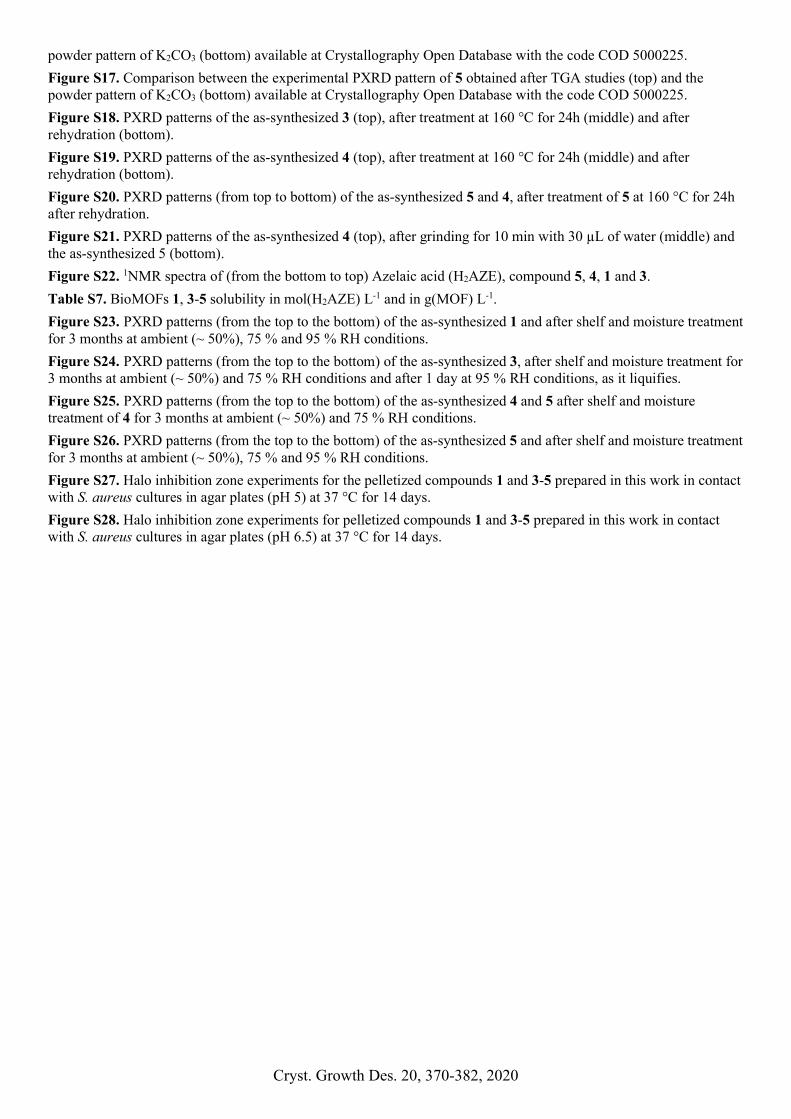
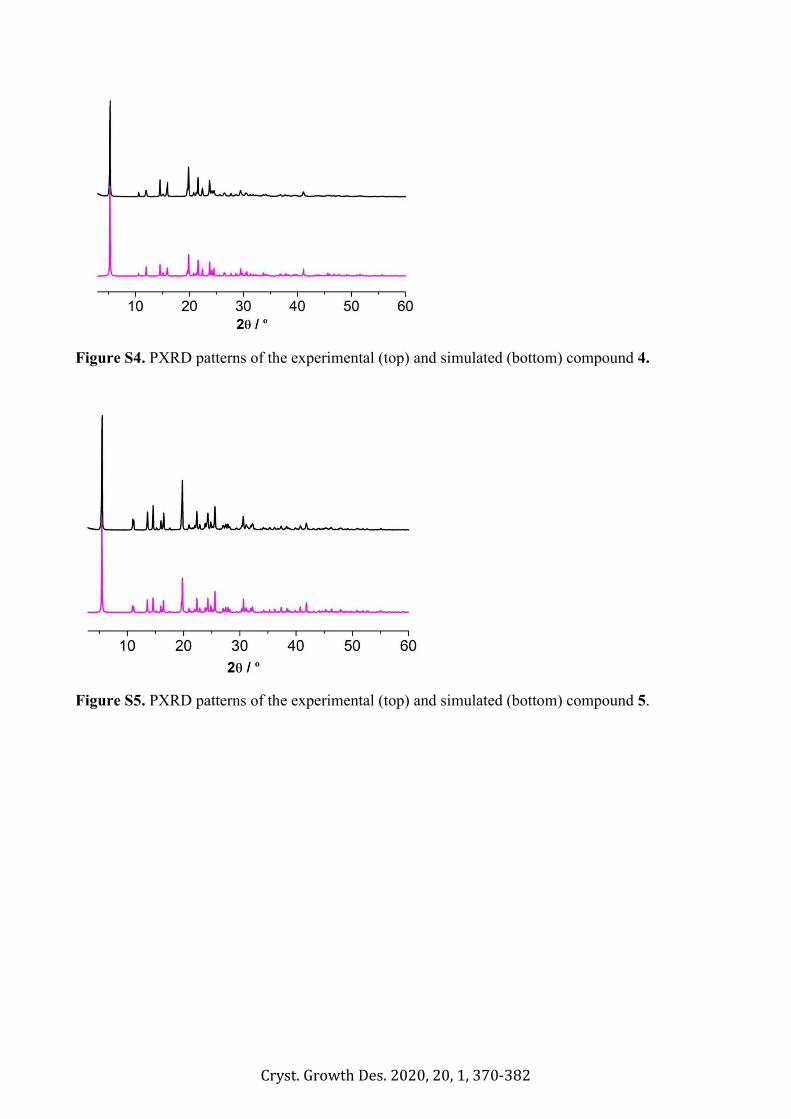
Figure S4. PXRD patterns of the experimental (top) and simulated (bottom) compound 4.
Figure S5. PXRD patterns of the experimental (top) and simulated (bottom) compound 5.
Cryst. Growth Des. 2020, 20, 1, 370-382
Table S1 – Selected bond lengths (Å) and angles (°C) for 1.
K(1) - O(1) 2.837(2) K(1) - O(3) 2.784(2) K(1) - O(5) 2.820(2) K(1) - O(7) 3.039(2) K(1) - O(2)h 2.805(2) K(1) - O(6)i 3.058(3) K(1) - O(8)i 2.835(3) K(2) - O(2) 2.897(2) K(1) - O4h 3.136(3) K(2) - O(4) 2.963(3) K(2) - O(6) 2.968(3) K(2) - O(8) 2.781(2) K(2) - O(5)d 2.848(2) K(2) - O(7)d 2.989(2) K(2) - O(1)j 2.982(2) K(2) - O(3)j 2.908(3) O(1) - C(1) 1.233(5) O(2) - C(1) 1.296(4) O(3) - C(6) 1.294(4) O(4) - C(6) 1.208(5) O(5) - C(11) 1.292(4) O(6) - C(11) 1.214(5) O(7) - C(16) 1.229(4) O(8) - C(16) 1.295(3) O(1) - K(1) - O(3) 5.04(6)
O(1) - K(1) - O(5) 78.51(7) O(1) - K(1) - O(7) 127.58(7) O(1) - K(1) - O(2)h 157.17(6) O(1) - K(1) - O(6)i 103.00(8) O(1) - K(1) - O(8)i 70.46(7) O(3) - K(1) - O(5) 93.96(7) O(3) - K(1) - O(7) 81.16(7) O(3) - K(1) - O(2)h 137.29(6) O(3) - K(1) - O(6)i 67.40(8) O(3) - K(1) - O(8)i 98.68(7) O(5) - K(1) - O(7) 64.57(6) O(5) - K(1) - O(2)h 100.80(7) O(5) - K(1) - O(6)i 157.56(7) O(4) - K(2) - O(8) 83.98(8) O(4) - K(2) - O(5)d 99.55(8) O(4) - K(2) - O(7)d 70.17(7) O(4) - K(2) - O(1)j 104.63(6) O(4) - K(2) - O(3)j 164.34(6) O(6) - K(2) - O(8) 63.09(7) O(6) - K(2) - O(5)d 109.03(7) O(6) - K(2) - O(7)d 163.74(7) O(6) - K(2) - O(1)j 101.73(7) O(6) - K(2) - O(3)j 67.13(7) O(8) - K(2) - O(5)d 171.63(6) O(8) - K(2) - O(7)d 123.44(6) O(8) - K(2) - O(1)j 69.08(7)
O(8) - K(2) - O(3)j 97.02(7) O(5)d - K(2) - O(7)d 64.93(6) O(5)d - K(2) - O(1)j 116.86(7) O(5)d - K(2) - O(3)j 81.66(7) O(7)d - K(2) - O(1)j 70.29(6) O(7)d - K(2) - O(3)j 96.70(7) O(1)j - K(2) - O(3)j 61.72(6) K(1) - O(1) - K(2)i 79.23(5) K(2) - O(2) - K(1)g 97.53(7) K(1) - O(3) - K(2)i 81.38(6) K(1) - O(5) - K(2)e 96.49(7) K(2) - O(6) - K(1)j 76.02(6) K(1) - O(7) - K(2)e 89.07(6) K(2) - O(8) - K(1)j 82.74(7) O(1) - C(1) - O(2) 122.5(3) O(3) - C(6) - O(4) 122.7(3) O(5) - C(11) - O(6) 123.1(3) O(7) - C(16) - O(8) 121.8(2) Symmetry transformations: h = 3/2-x,1/2-y,1/2+z i = 3/2-x,-1/2+y,z d = x,1-y,-1/2+z j = 3/2-x,1/2+y,z g = 3/2-x,1/2-y,-1/2+z e = x,1-y,1/2+z
Cryst. Growth Des. 2020, 20, 1, 370-382
Table S2 – Selected bond lengths (Å) and angles (°C) for 2.
Na(1) - O(1) 2.403(5) Na(1) - O(7) 2.388(5) Na(1) - O(14)d 2.439(5) Na(1) - O(5)h 2.417(5) Na(1) - O(16)k 2.344(5) Na(2) - O(4) 2.352(5) Na(2) - O(5) 2.720(6) Na(2) - O(11) 2.355(5) Na(2) - O(9)e 2.354(5) Na(2) - O(1)g 2.402(5) Na(2) – O(6)b 2.869(6) Na(3) - O(8) 2.323(5) Na(3) - O(15) 2.369(5) Na(3) - O(10)a 2.622(6) Na(3) - O(6)d 2.402(5) Na(3) - O(13)d 2.395(5) Na (3) – O(9) 2.994(6) Na(4) - O(12) 2.315(5) Na(4) - O(13) 2.421(5) Na(4) - O(2)e 2.399(5) Na(4) - O(10)e 2.433(5) Na(4) - O(3)j 2.384(5) O(1) - C(1) 1.243(8) O(2) - C(1) 1.271(8) O(3) - C(9) 1.208(7) O(4) - C(9) 1.304(7) O(5) - C(10) 1.239(8) O(6) - C(10) 1.295(8) O(7) - C(18) 1.212(7) O(8) - C(18) 1.302(7) O(9) - C(19) 1.279(8) O(10) - C(19) 1.233(8)
O(11) - C(27) 1.227(7) O(12) - C(27) 1.292(7) O(13) - C(28) 1.238(7) O(14) - C(28) 1.287(7) O(15) - C(36) 1.224(7) O(16) - C(36) 1.306(7) O(7) - Na(1) - O(16)k 88.93(17) O(14)d - Na(1) - O(5)h 104.28(17) O(14)d - Na(1) - O(16)k 147.2(2) O(5)h - Na(1) - O(16)k 80.90(16) O(5) - Na(2) - O(6)b 175.97(16) O(4) - Na(2) - O(5) 99.22(17) O(4) - Na(2) - O(11) 94.46(17) O(4) - Na(2) - O(9)e 160.7(2) O(4) - Na(2) - O(1)g 82.24(16) O(5) - Na(2) - O(11) 90.34(16) O(5) - Na(2) - O(9)e 99.86(18) O(5) - Na(2) - O(1)g 80.64(16) O(11) - Na(2) - O(9)e 82.85(16) O(11) - Na(2) - O(1)g 169.72(19) O(9)e - Na(2) - O(1)g 103.43(17) O(8) - Na(3) - O(15) 94.87(17) O(8) - Na(3) - O(10)a 102.79(18) O(8) - Na(3) - O(6)d 154.8(2) O(8) - Na(3) - O(13)d 80.03(16) O(15) - Na(3) - O(10)a 91.87(17) O(15) - Na(3) - O(6)d 83.92(16) O(15) - Na(3) - O(13)d 171.95(19) O(10)a - Na(3) - O(6)d 102.41(18) O(10)a - Na(3) - O(13)d 83.27(16) O(10)a - Na(3) - O(9) 175.36(16)
O(6)d - Na(3) - O(13)d 103.36(17) O(12) - Na(4) - O(13) 107.79(19) O(12) - Na(4) - O(2)e 157.5(2) O(12) - Na(4) - O(10)e 80.98(17) O(12) - Na(4) - O(3)j 88.97(17) O(13) - Na(4) - O(2)e 94.53(18) O(13) - Na(4) - O(10)e 86.88(17) O(13) - Na(4) - O(3)j 102.08(17) O(2)e - Na(4) - O(10)e 103.59(17) O(2)e - Na(4) - O(3)j 83.47(16) O(10)e - Na(4) - O(3)j 168.3(2) Na(1) - O(1) - Na(2)h 100.43(18) O(7) - C(18) - O(8) 122.9(5) O(9) - C(19) - O(10) 124.1(5) O(1) - C(1) - O(2) 124.2(5) O(11) - C(27) - O(12) 122.1(5) O(13) - C(28) - O(14) 123.3(5) O(3) - C(9) - O(4) 123.3(5) O(5) - C(10) - O(6) 122.6(5) O(15) - C(36) - O(16) 122.4(5) Symmetry transformations: h = 3/2-x,y,1/2+z k = 1/2+x,-y,z e = 1-x,1-y,-1/2+z g = 3/2-x,y,-1/2+z j = -1/2+x,1-y,z a = x,-1+y,z d = 1-x,-y,1/2+z b = x, y+1, z
Table S3 – Selected bond lengths (Å) and angles (°C) for 3.
Na(1) - O(1) 2.2787(17) Na(1) - O(1W) 2.3123(19) Na(1) - O(4)d 2.3382(18) Na(1) - O(3)h 2.3656(15) Na(1) - O(2)j 2.4211(15) Na(2) - O(2) 2.4005(17) Na(2) - O(1W)a 2.4894(18) Na(2) - O(4)c 2.4632(17) Na(2) - O(1W)e 2.7228(19) Na(2) - O(3)g 2.4256(17) Na(2) - O(2)i 2.4352(16) O(1) - C(1) 1.246(3) O(2) - C(1) 1.265(3) O(3) - C(9) 1.269(2) O(4) - C(9) 1.252(2) O(1) - Na(1) - O(1W) 110.53(6) O(1) - Na(1) - O(4)d 156.37(7) O(1) - Na(1) - O(3)h 92.98(6) O(1) - Na(1) - O(2)j 94.86(6)
O(1W) - Na(1) - O(4)d 92.16(6) O(1W) - Na(1) - O(3)h 83.87(6) O(1W) - Na(1) - O(2)j 85.00(6) O(4)d - Na(1) - O(3)h 82.65(6) O(4)d - Na(1) - O(2)j 93.58(6) O(3)h - Na(1) - O(2)j 168.09(6) O(2) - Na(2) - O(1W)a 171.17(6) O(2) - Na(2) - O(4)c 100.15(6) O(2) - Na(2) - O(1W)e 84.20(5) O(2) - Na(2) - O(3)g 94.98(6) O(2) - Na(2) - O(2)i 91.13(5) O(1W)a - Na(2) - O(4)c 85.12(6) O(1W)a - Na(2) - O(1W)e 103.86(6) O(1W)a - Na(2) - O(3)g 78.99(6) O(1W)a - Na(2) - O(2)i 87.35(6) O(4)c - Na(2) - O(1W)e 79.03(6) O(4)c - Na(2) - O(3)g 78.89(5) O(4)c - Na(2) - O(2)i 151.75(6) O(1W)e - Na(2) - O(3)g 157.40(6) O(1W)e - Na(2) - O(2)i 76.43(5)
O(3)g - Na(2) - O(2)i 126.17(6) Na(1) - O(1W) - Na(2)b 79.01(6) Na(1) - O(1W) - Na(2)f 87.78(6) Na(2)b - O(1W) - Na(2)f 157.44(8) Na(2) - O(2) - Na(2)i 88.87(5) Na(2) - O(2) - Na(1)k 113.68(6) Na(2)i - O(2) - Na(1)k 92.34(5) Na(2)g - O(3) - Na(1)h 79.30(5) Na(1)c - O(4) - Na(2)d 79.06(5) O(1) - C(1) - O(2) 124.10(19) O(3) - C(9) - O(4) 124.35(18) Symmetry transformations: d = 1-x,1/2+y,1/2-z h = 1-x,2-y,1-z j = x,3/2-y,-1/2+z a = x,-1+y,z c = 1-x,-1/2+y,1/2-z e = 2-x,-1/2+y,1/2-z g = 1-x,1-y,1-z i = 2-x,1-y,1-z
Cryst. Growth Des. 2020, 20, 1, 370-382
Table S4 – Selected bond lengths (Å) and angles (°C) for 4.
Mg(1) - O(1) 1.9983(13) Mg(1) - O(1W) 2.1350(12) Mg(1) - O(2W) 2.1552(13) Mg(1) - O(3W) 2.0923(14) Mg(1) - O(4)b 2.0199(12) Mg(1) - O(3)c 2.0592(12) O(1) - C(1) 1.244(2) O(2) - C(1) 1.259(2) O(3) - C(9) 1.2523(19) O(4) - C(9) 1.261(2)
O(1) - Mg(1) - O(1W) 84.29(5) O(1) - Mg(1) - O(2W) 89.39(5) O(1) - Mg(1) - O(3W) 168.14(6) O(1) - Mg(1) - O(4)b 91.77(6) O(1) - Mg(1) - O(3)c 98.65(5) O(1W) - Mg(1) - O(2W) 86.09(5) O(1W) - Mg(1) - O(3W) 87.88(6) O(1W) - Mg(1) - O(4)b 172.35(5) O(1W) - Mg(1) - O(3)c 91.22(5) O(2W) - Mg(1) - O(3W) 81.18(6) O(2W) - Mg(1) - O(4)b 87.31(5)
O(2W) - Mg(1) - O(3)c 171.23(5) O(3W) - Mg(1) - O(4)b 94.94(6) O(3W) - Mg(1) - O(3)c 90.39(6) O(4)b - Mg(1) - O(3)c 95.87(5) O(1) - C(1) - O(2) 121.36(15) O(3) - C(9) - O(4) 123.19(14)
Symmetry transformations: b = 1-x,1/2+y,1/2-z c = 1-x,1-y,1-z
Table S5 – Selected bond lengths (Å) and angles (°C) for 5.
Mg(1) - O(1) 2.008(2) Mg(1) – O(1W) 2.154(2) Mg(1) – O(2W) 2.132(2) Mg(1) - O(3W) 2.093(3) Mg(1) – O(4)a 2.050(2) Mg(1) - O(3)b 2.006(2) O(1) - C(1) 1.262(3) O(2) - C(1) 1.254(3) O(3) - C(9) 1.275(3) O(4) - C(9) 1.245(3)
O(1) - Mg(1) - O(1W) 89.65(9) O(1) - Mg(1) - O(2W) 84.37(9) O(1) - Mg(1) - O(3W) 168.39(9) O(1) - Mg(1) - O(4)a 97.37(8) O(1) - Mg(1) - O(3)b 92.01(8) O(1W) - Mg(1) - O(2W) 87.43(8) O(1W) - Mg(1) - O(3W) 81.66(10) O(1W) - Mg(1) - O(4)a 171.86(9) O(1W) - Mg(1) - O(3)b 87.31(8) O(2W) - Mg(1) - O(3W) 87.54(10) O(2W) - Mg(1) - O(4)a 89.15(8)
O(2W) - Mg(1) - O(3)b 173.64(9) O(3W) - Mg(1) - O(4)a 90.82(9) O(3W) - Mg(1) - O(3)b 95.25(9) O(4)a - Mg(1) - O(3)b 96.52(8) O(1) - C(1) - O(2) 120.4(2) O(3) - C(9) - O(4) 123.3(2) Symmetry transformations: a = 1-x,y,1/2-z b = 1-x,1-y,1-z
Cryst. Growth Des. 2020, 20, 1, 370-382
Table S6. List of the main hydrogen bonds found for compounds 1-5.
Sym. Op. D–H···A d(H···A) (Å) d(D···A) (Å) (DHA) (deg)
1
x, y, z x, y, z x, y, z x, y, z
O3–H3···O1 O3–H3···O2 O8–H8···O5
O8–H8···O6
2.57(4) 1.55(4) 1.50(5) 2.52(5)
3.022(2) 2.460(3) 2.457(3) 3.012(3)
111(4) 169(4) 171(5) 112(4)
2
3/2-x, y, -1/2+z 3/2-x, y, -1/2+z 1-x, -y, 1/2+z 1-x, -y, 1/2+z
1-x, 1-y, -1/2+z 1-x, 1-y, -1/2+z 1-x, -y, 1/2+z 1-x, -y, 1/2+z
O4–H4···O1
O4–H4···O2
O8–H8···O13
O8–H8···O14
O12–H12···O9
O12–H12···O10
O16–H16···O5
O16–H16···O6
2.48(6) 1.55(6) 2.44(8) 1.54(7) 1.56(8) 2.42(8) 2.49(9) 1.55(8)
3.126(6) 2.466
3.034(6) 2.464(6) 2.452(6) 3.084(7) 3.089(6) 2.462(6)
127(6) 171(4) 122(8)
173(12) 163(11) 130(10) 124(10) 175(14)
3 2-x, 1/2+y, 1/2-z
1+x, y, z O1w–H1w···O1
O1w–H2w···O3 1.92(3) 1.87(3)
2.728(2) 2.721(2)
176(3) 175(3)
4
x, 1/2-y, 1/2+z x, 3/2-y, 1/2+z
2-x, 1-y, 1-z 2-x, 1-y, 1-z 2-x, 1-y, 1-z 1-x, 1-y, 1-z
x, 1+y, z
O1w–H1w···O2
O1w–H2w···O2w
O2w–H3w···O1w
O2w–H4w···O1
O2w–H4w···O2
O3w–H5w···O4
O3w–H6w···O2
1.95(3) 1.97(3) 2.10(2) 2.39(3) 2.08(3) 2.07(3) 1.98(3)
2.7358(18) 2.8102(18) 2.8719(18) 2.9304(17) 2.8939(18) 2.7170(19) 2.8134(19)
170(2) 168(2) 166(2) 125(2) 177(2) 147(3) 168(2)
5
3/2-x, 1/2-y, 1-z 3/2-x, 1/2-y, 1-z 3/2-x, 1/2-y, 1-z
x, -y, -1/2+z x, 1-y, -1/2+z
x, 1+y, z 1-x, y, 1/2-z
O1w–H1w···O2w
O1w–H2w···O1
O1w–H2w···O2
O2w–H3w···O2
O2w–H4w···O1w
O3w–H5w···O2
O3w–H6w···O3
2.06(3) 2.18(4) 2.20(4) 1.75(4) 2.07(4) 1.88(4) 2.05(3)
2.822(3) 2.859(3) 3.065(3) 2.715(3) 2.822(3) 2.802(3) 2.726(3)
159(3) 133(3) 164(4) 171(3) 160(4) 168(3) 144(3)
Figure S6. FTIR (from the top to the bottom) for azelaic acid compared with as-synthesized, as-prepared and after thermal treatment at 160 °C and 330 °C for compound 1.
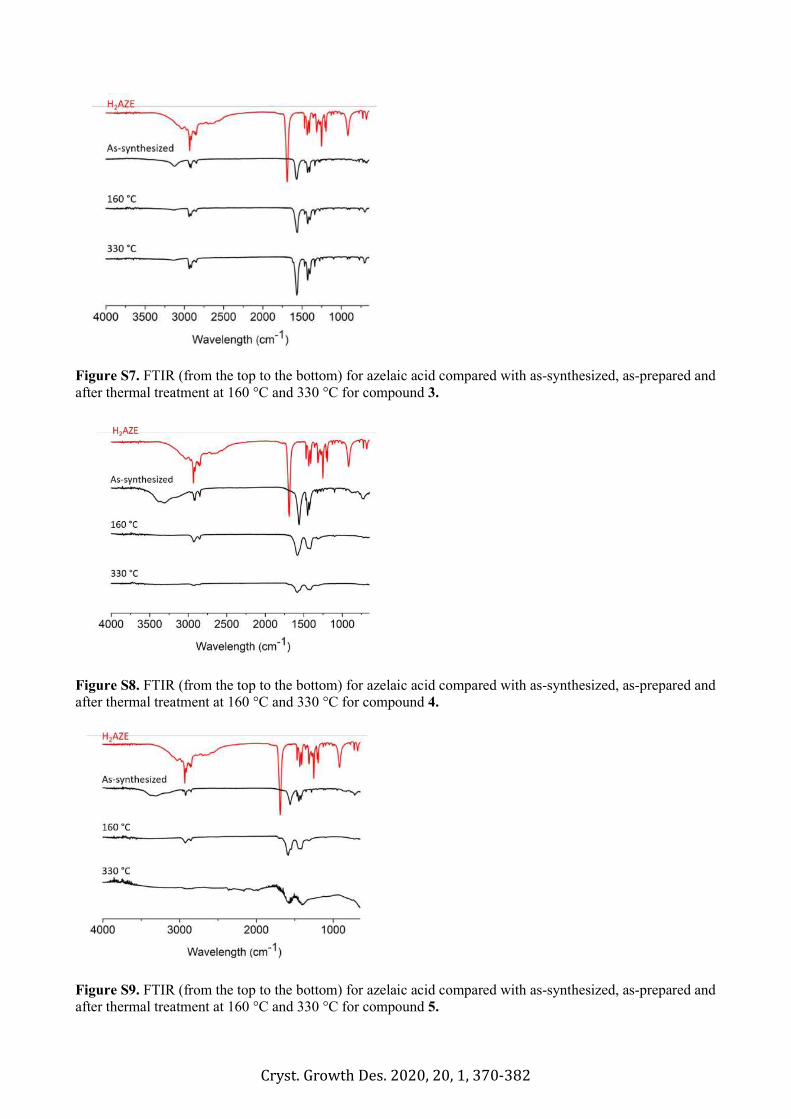
Cryst. Growth Des. 2020, 20, 1, 370-382
Figure S7. FTIR (from the top to the bottom) for azelaic acid compared with as-synthesized, as-prepared and after thermal treatment at 160 °C and 330 °C for compound 3.
Figure S8. FTIR (from the top to the bottom) for azelaic acid compared with as-synthesized, as-prepared and after thermal treatment at 160 °C and 330 °C for compound 4.
Figure S9. FTIR (from the top to the bottom) for azelaic acid compared with as-synthesized, as-prepared and after thermal treatment at 160 °C and 330 °C for compound 5.
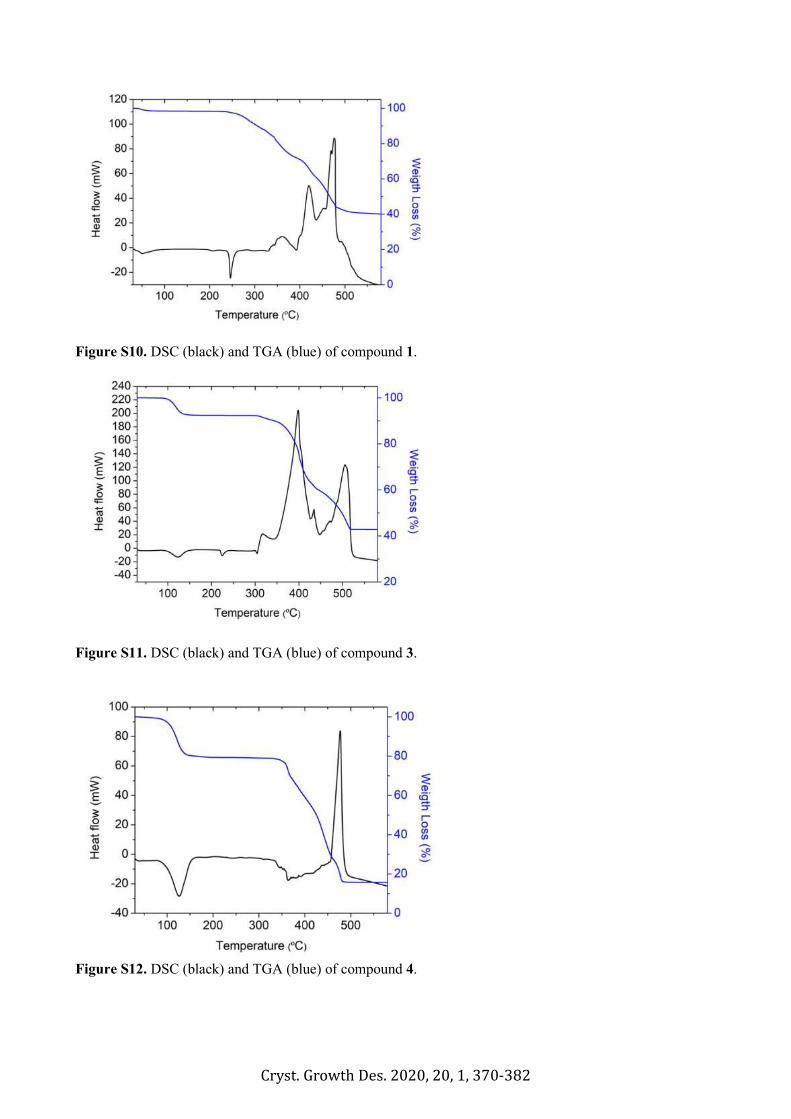
Cryst. Growth Des. 2020, 20, 1, 370-382
Figure S10. DSC (black) and TGA (blue) of compound 1.
Figure S11. DSC (black) and TGA (blue) of compound 3.
Figure S12. DSC (black) and TGA (blue) of compound 4.
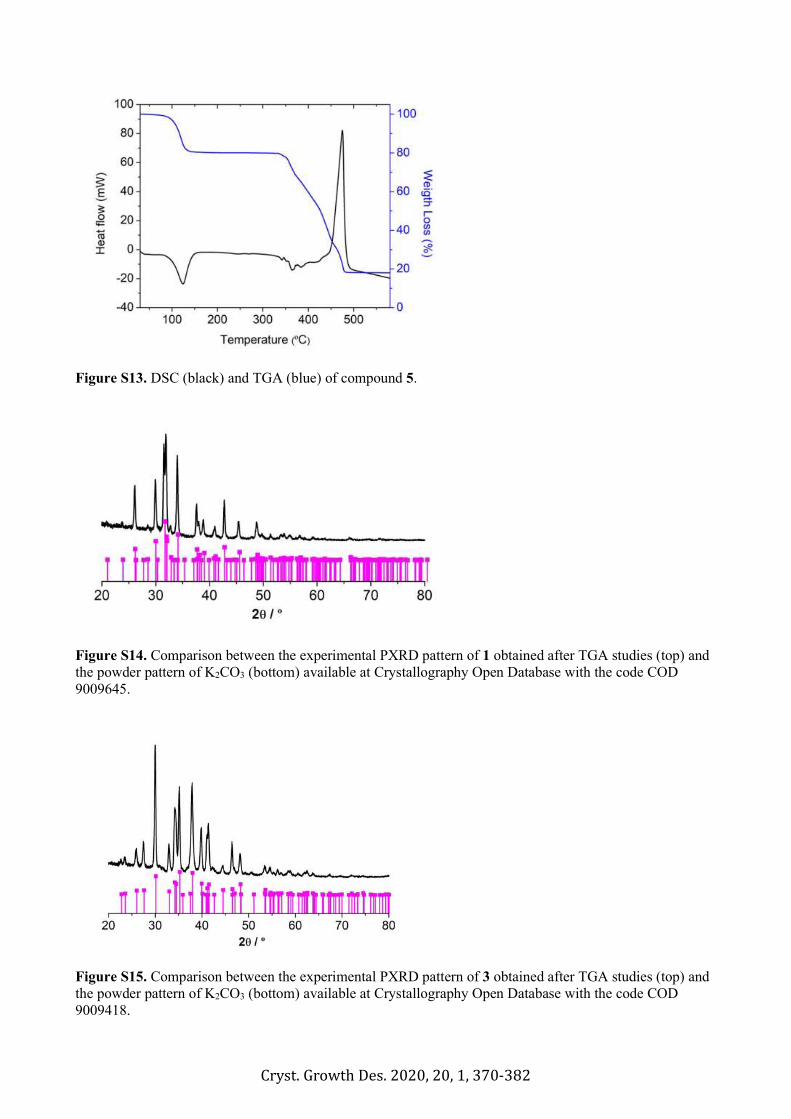
Cryst. Growth Des. 2020, 20, 1, 370-382
Figure S13. DSC (black) and TGA (blue) of compound 5.
Figure S14. Comparison between the experimental PXRD pattern of 1 obtained after TGA studies (top) and the powder pattern of K2CO3 (bottom) available at Crystallography Open Database with the code COD 9009645.
Figure S15. Comparison between the experimental PXRD pattern of 3 obtained after TGA studies (top) and the powder pattern of K2CO3 (bottom) available at Crystallography Open Database with the code COD 9009418.
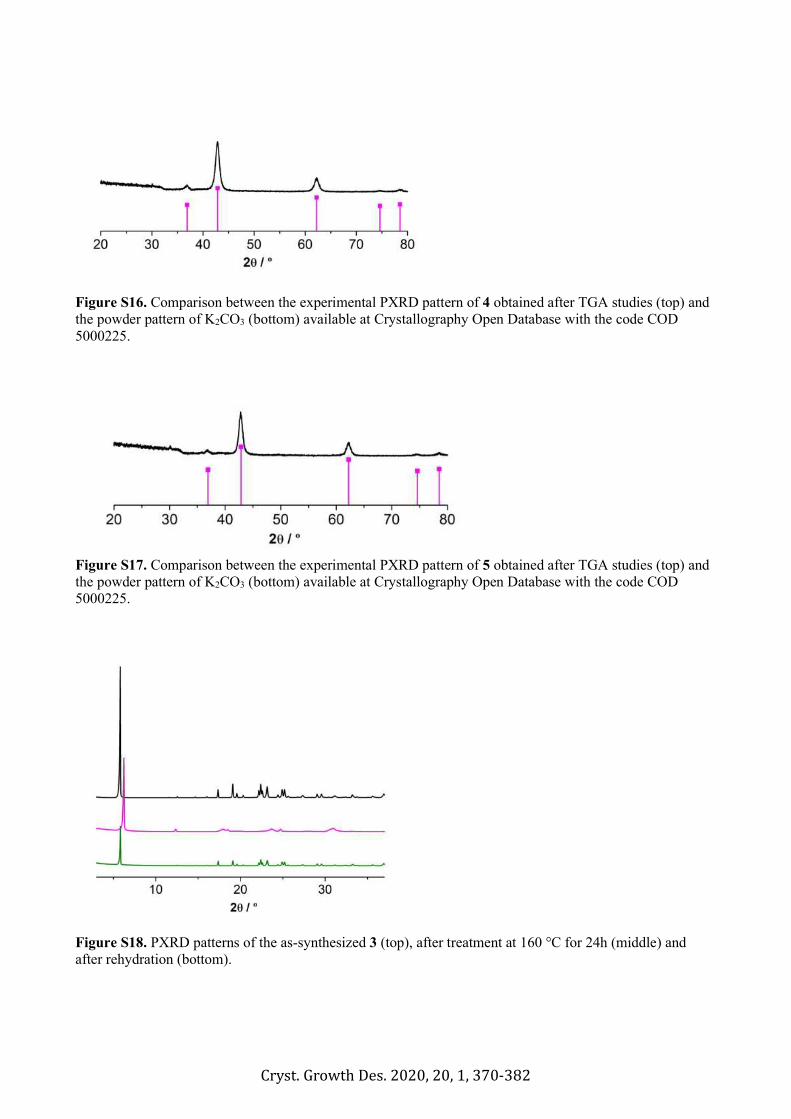
Cryst. Growth Des. 2020, 20, 1, 370-382
Figure S16. Comparison between the experimental PXRD pattern of 4 obtained after TGA studies (top) and the powder pattern of K2CO3 (bottom) available at Crystallography Open Database with the code COD 5000225.
Figure S17. Comparison between the experimental PXRD pattern of 5 obtained after TGA studies (top) and the powder pattern of K2CO3 (bottom) available at Crystallography Open Database with the code COD 5000225.
Figure S18. PXRD patterns of the as-synthesized 3 (top), after treatment at 160 °C for 24h (middle) and after rehydration (bottom).
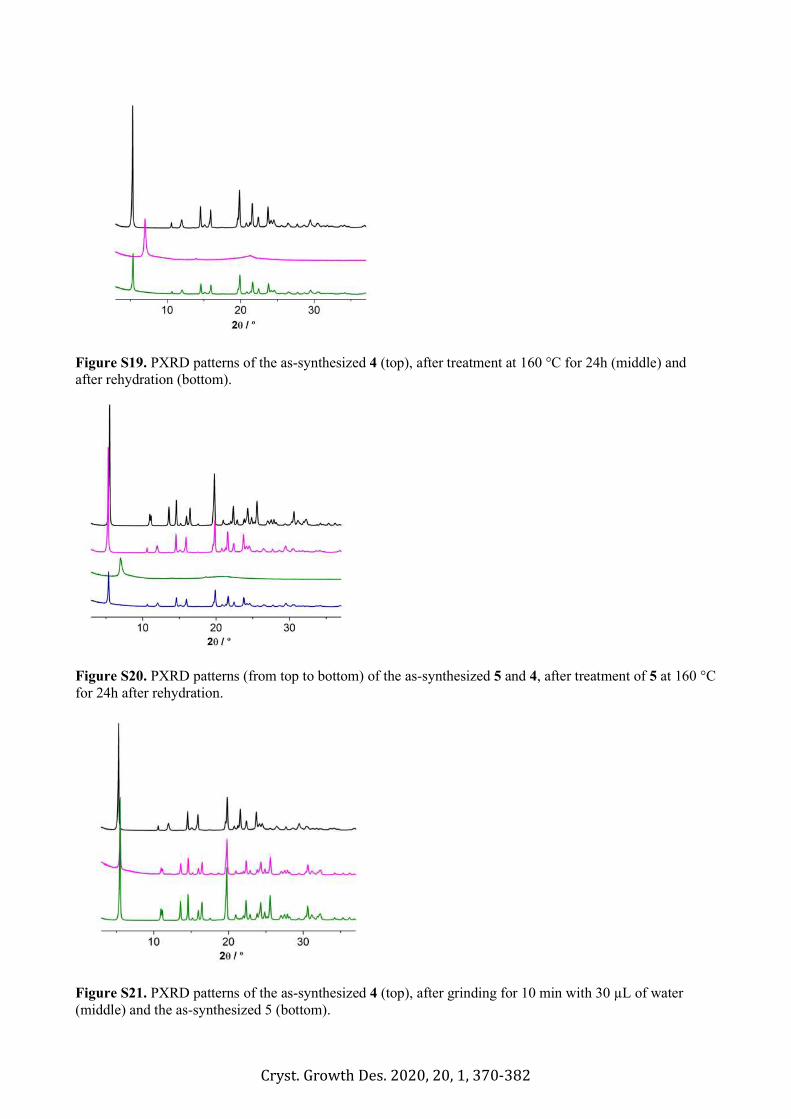
Cryst. Growth Des. 2020, 20, 1, 370-382
Figure S19. PXRD patterns of the as-synthesized 4 (top), after treatment at 160 °C for 24h (middle) and after rehydration (bottom).
Figure S20. PXRD patterns (from top to bottom) of the as-synthesized 5 and 4, after treatment of 5 at 160 °C for 24h after rehydration.
Figure S21. PXRD patterns of the as-synthesized 4 (top), after grinding for 10 min with 30 µL of water (middle) and the as-synthesized 5 (bottom).
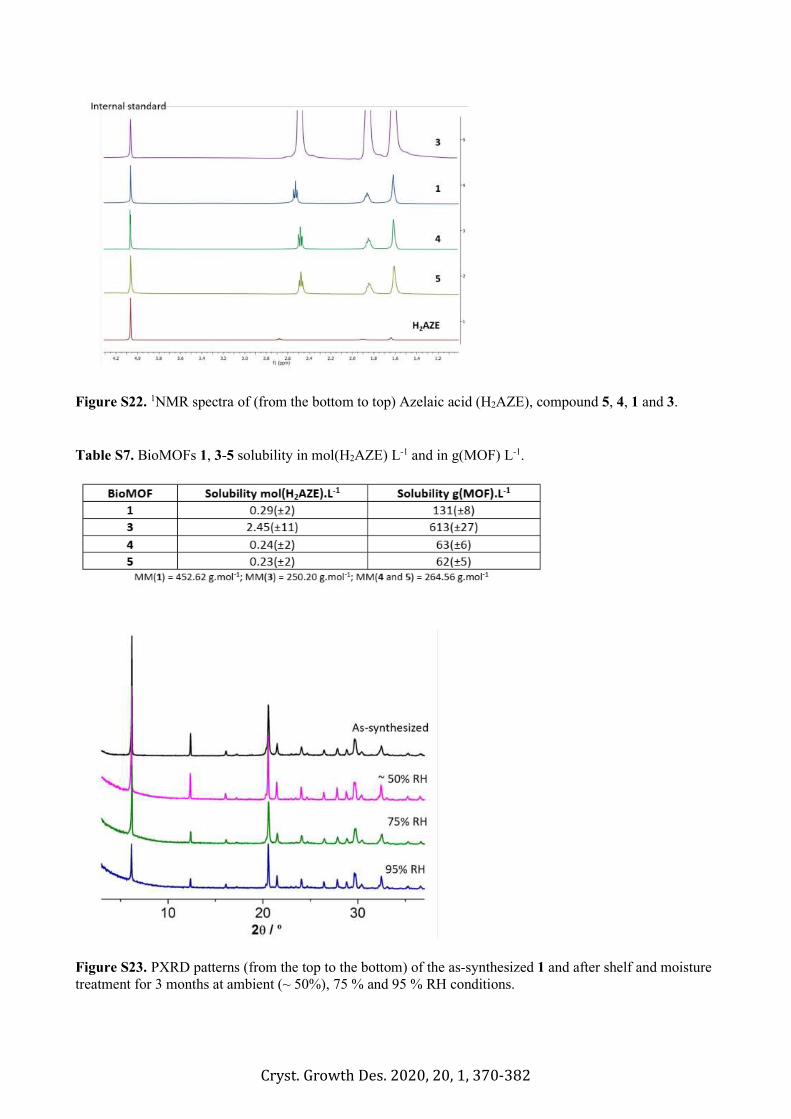
Cryst. Growth Des. 2020, 20, 1, 370-382
Figure S22. 1NMR spectra of (from the bottom to top) Azelaic acid (H2AZE), compound 5, 4, 1 and 3. Table S7. BioMOFs 1, 3-5 solubility in mol(H2AZE) L-1 and in g(MOF) L-1.
Figure S23. PXRD patterns (from the top to the bottom) of the as-synthesized 1 and after shelf and moisture treatment for 3 months at ambient (~ 50%), 75 % and 95 % RH conditions.
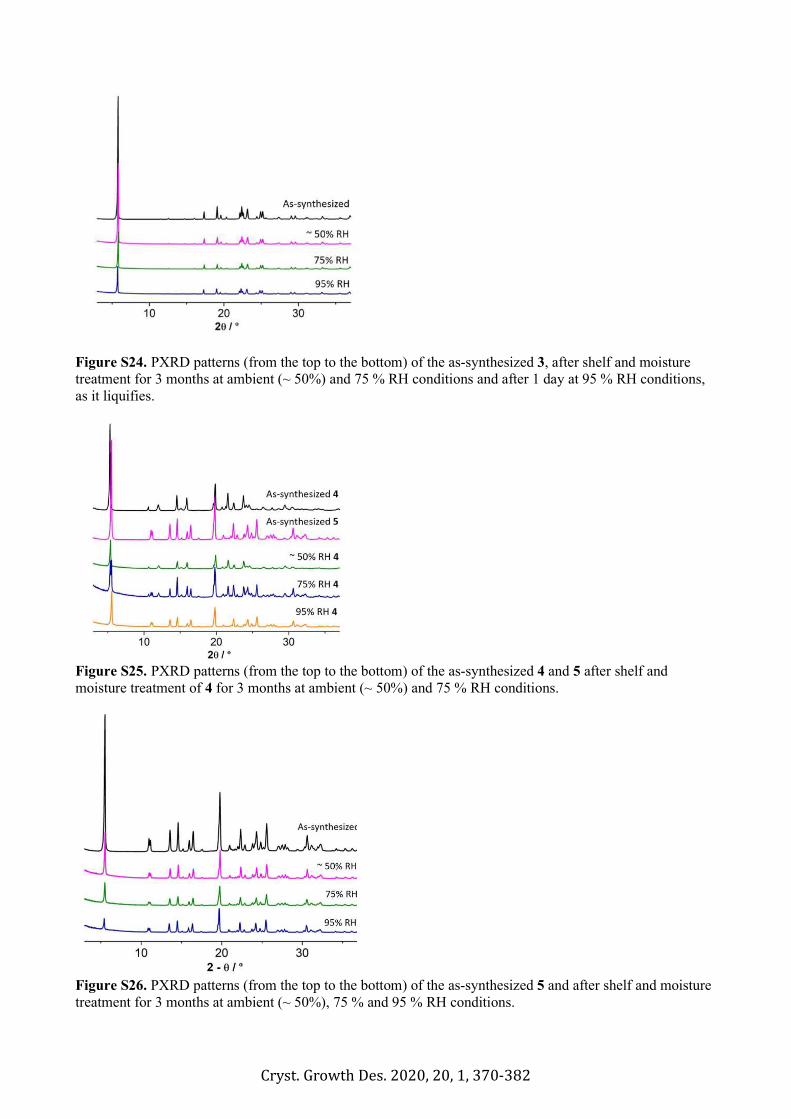
Cryst. Growth Des. 2020, 20, 1, 370-382
Figure S24. PXRD patterns (from the top to the bottom) of the as-synthesized 3, after shelf and moisture treatment for 3 months at ambient (~ 50%) and 75 % RH conditions and after 1 day at 95 % RH conditions, as it liquifies.
Figure S25. PXRD patterns (from the top to the bottom) of the as-synthesized 4 and 5 after shelf and moisture treatment of 4 for 3 months at ambient (~ 50%) and 75 % RH conditions.
Figure S26. PXRD patterns (from the top to the bottom) of the as-synthesized 5 and after shelf and moisture treatment for 3 months at ambient (~ 50%), 75 % and 95 % RH conditions.
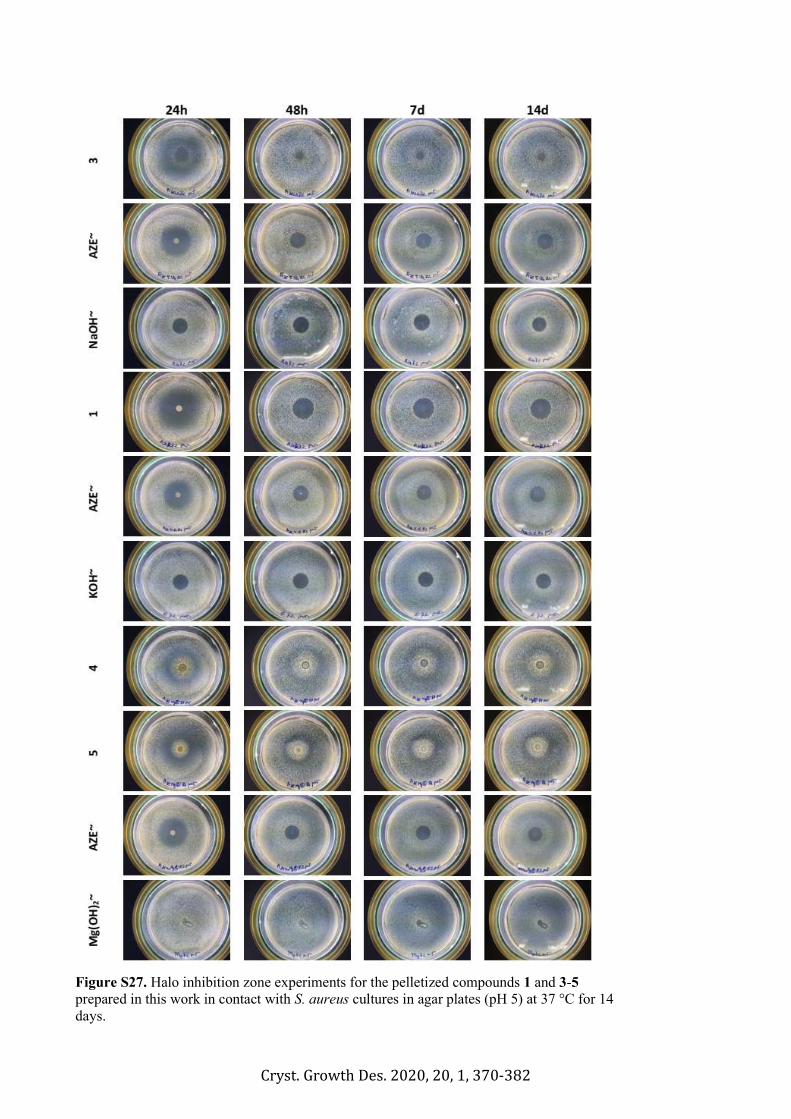
Cryst. Growth Des. 2020, 20, 1, 370-382
Figure S27. Halo inhibition zone experiments for the pelletized compounds 1 and 3-5 prepared in this work in contact with S. aureus cultures in agar plates (pH 5) at 37 °C for 14 days.
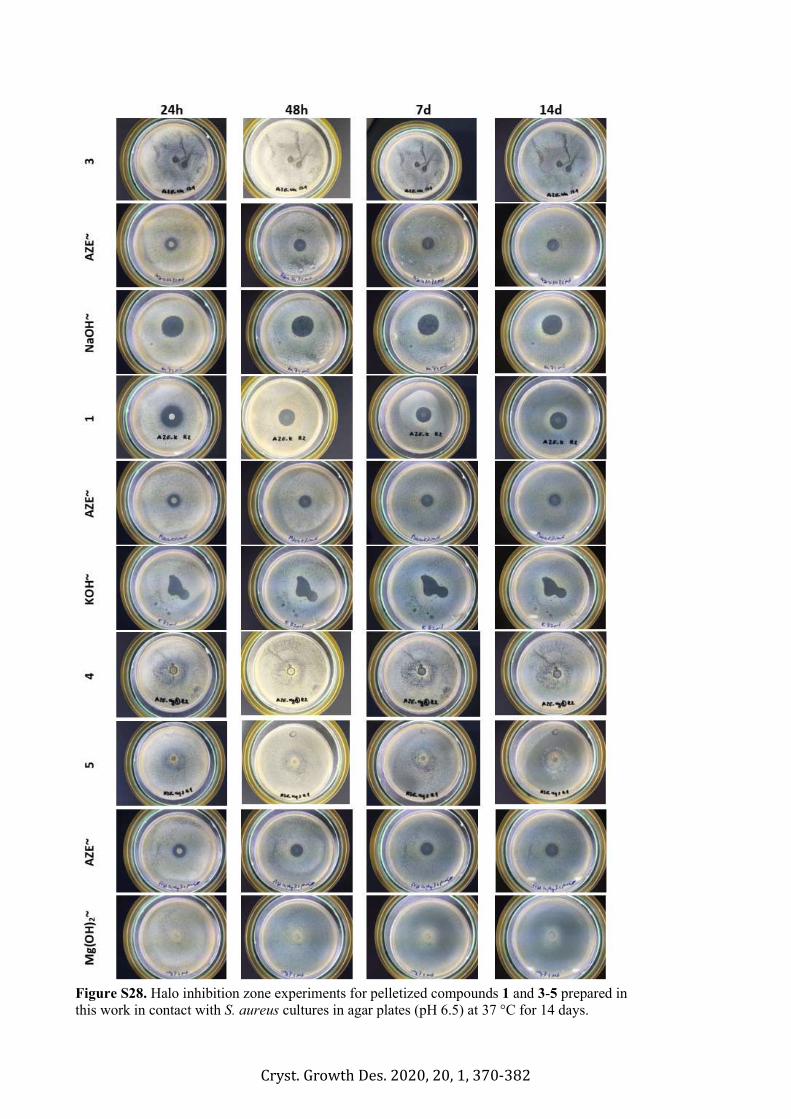
Cryst. Growth Des. 2020, 20, 1, 370-382
Figure S28. Halo inhibition zone experiments for pelletized compounds 1 and 3-5 prepared in this work in contact with S. aureus cultures in agar plates (pH 6.5) at 37 °C for 14 days.


![Preparation and Characterization of Antibacterial 2/Poly ......Preparation and Characterization of Antibacterial TiO2/Poly[acrylamide-co-(acrylic acid)] Composite Hydrogel K. Boonpavanitchakul,](https://img.pdfslide.us/doc/110x75/60a5ae8a5fc9c707ab060fb6/preparation-and-characterization-of-antibacterial-2poly-preparation-and.jpg)