Embed Size (px)
Citation preview
CENTRE FOR THE LAW AND ECONOMICS OF THE SEA
< The infl uence of fi scal regulations on investment in marine fi sheries: a French case study >
Le Floc’h Pascal*, Daurès Fabienne**,
Nourry Myriam*, Thébaud Olivier***,
Travers Muriel****, Van Iseghem Sylvie**
* Université de Brest, Umr Amure, France
** Ifremer, Umr Amure, France
*** CSIRO, Australia
**** Université d’Angers, France
A M U R E P U B L I C AT I O N S
¨
WORKING PAPERS SERIES
N ° D - 2 8 - 2 0 1 1
WO
RK
IN
G
PA
PE
RS
S
RI
ES

ISSN 1951-641X
Amure Publ icat ions . Work ing Papers ser ies .
Onl ine publ icat ion : www.umr-amure. f r
1
The influence of fiscal regulations on investment in marine fisheries: a
French case study.
Le Floc’h Pascal1*, Daurès Fabienne2, Nourry Myriam1, Thébaud Olivier3, Travers Muriel4, Van Iseghem Sylvie2
1 Université de Brest, Umr Amure, France
2 Ifremer, Umr Amure, France
3 CSIRO, Australia
4 Université d’Angers, France
*Correspondant
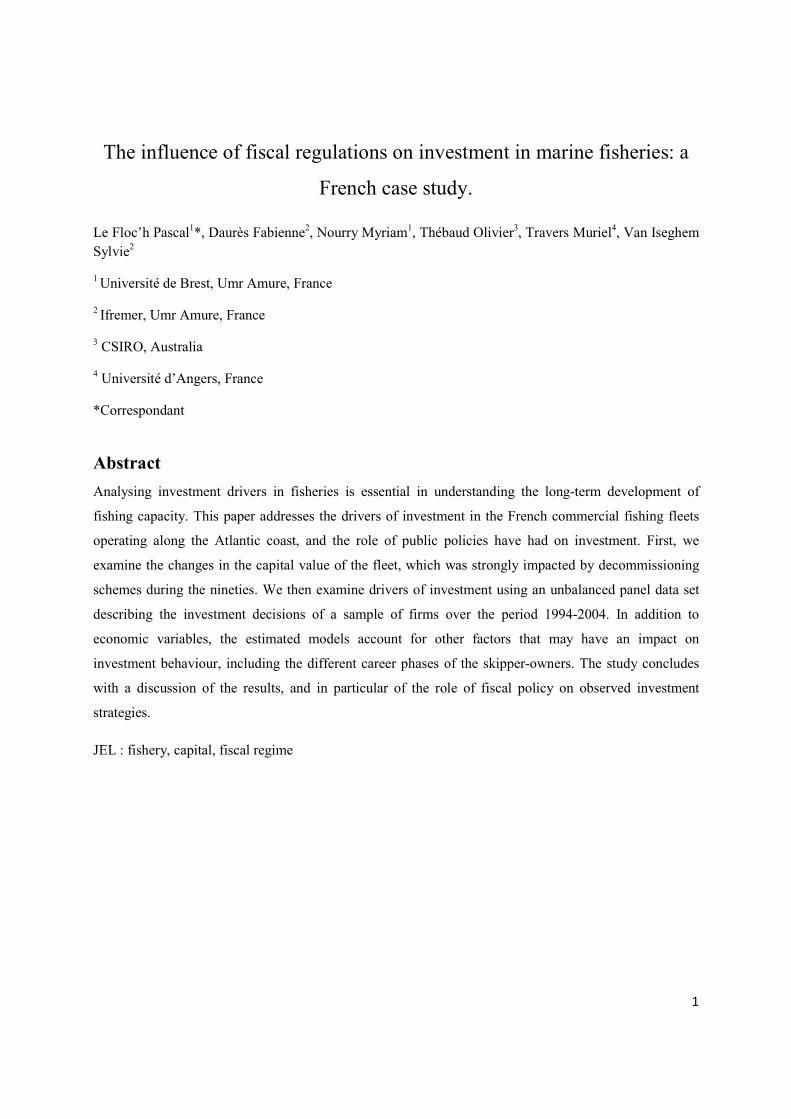
Abstract
Analysing investment drivers in fisheries is essential in understanding the long-term development of
fishing capacity. This paper addresses the drivers of investment in the French commercial fishing fleets
operating along the Atlantic coast, and the role of public policies have had on investment. First, we
examine the changes in the capital value of the fleet, which was strongly impacted by decommissioning
schemes during the nineties. We then examine drivers of investment using an unbalanced panel data set
describing the investment decisions of a sample of firms over the period 1994-2004. In addition to
economic variables, the estimated models account for other factors that may have an impact on
investment behaviour, including the different career phases of the skipper-owners. The study concludes
with a discussion of the results, and in particular of the role of fiscal policy on observed investment
strategies.
JEL : fishery, capital, fiscal regime

2
1. Introduction
Despite its central importance in determining the long-term evolution of fishing capacity, investment in
marine fisheries has been the object of relatively few empirical explorations to date (Munro 2010). The
standard model of investment behaviour in fisheries assumes a sole owner exists, which represents the
societal perspective on whether investment is warranted in a fishery and at what levels (see Charles 2007
for a review). The analysis focuses on expectations this sole owner may have regarding the future
economic performance of the fishery, and how these affect the trade-offs between investment costs
(including the opportunity costs of capital) and the net present value of future expected benefits derived
from fishing, taking into account potential irreversibility effects (Clark et al. 1979). The analysis allows
identification of the optimal investment paths, assuming a profit-maximizing decision model. In practice,
however, decisions to invest in a fishery are made at the level of fishing firms, by entrepreneurs. In
certain circumstances, entrepreneur motivations can be influenced not only by pure economic profit
results, but also by financial considerations which are determined by regulations that pertain to fiscal
regimes and tax policies. The nature of these as they relate to the fishing industry will vary across
countries and in time, and can be influenced by both short-term and long-term policy considerations.
Short-term considerations will for example relate to the adoption of emergency measures aimed at easing
the tension that may develop when the fishing sector encounters difficult economic conditions to avoid an
uncontrolled situation (Mesnil 2008). For example, (positive and negative) tax policies can become an
adjustment variable for governments to assist the fishing sector in times of strong increases in input costs.
In particular, the level of fuel subsidies in fisheries has been estimated for 86 countries (Sumaila et al.
2008), and concluded to the potentially strong impact of these on the sustainability of fisheries. Long-
term considerations will usually relate to fiscal concerns and objectives in terms of structural adaptations
of the fishing sector. Where it has been studied, this has been shown to play a key role in the capital
dynamics of certain fisheries (Jensen 1998). In the French context, the fiscal regime applied to fishing
fleets was shown to entail strong incentives to maintain capital investment in the sector (Le Floc’h et al.
2008a). In both cases, incentives created by the fiscal and tax regimes may well supersede those that
would result from economic variables in driving investment behaviour. In particular, direct subsidies
provided to fishermen in order to offset increasing fuel prices, may cause resistance either to
disinvestment in contexts where excess capacity exists, thus subverting other policies aimed at fleet
rationalization and strengthening of the sustainability of a fishery.

3
Assessing the role of these various incentives in determining investment behaviour in fisheries requires
that empirical models be developed, linking measures of investment to the influence of public policies
that directly or indirectly affect the economic and/or financial position of fishing firms. However, while
the need to solve problems of overcapitalization and excess investment in fisheries is now broadly
recognized, there is often very little information on the level of capitalization and the structure of capital
invested in the fishing sector, let alone changes in these over time. For example, for many years in
Europe, the number of vessels and the total engine power (in kW) of fishing fleets have been the unique
references for assessing the level of capitalization in fisheries (European Commission 2010). As a
consequence, the different policies implemented to reduce overcapacity have generally been formulated
in terms of these physical units. In principle, however, estimation of changes in the long term productivity
and attractiveness, or otherwise, of the fishing sector should also be based on economic information,
including the value of capital stock. In addition, understanding the dynamics of investment in fisheries
would require at minimum that some time-series data of changes in the capital stock of fishing firms be
available, if not regular estimates of the flows of investment that occur in different fisheries, and how
these relate to changes in the conditions under which these fisheries operate.
The need for measures of capital stock and its changes in fisheries also leads to the question of how these
should be measured. At the European level, a concerted effort has been undertaken since the early 90s, to
produce annual reports on the economic performance of major European fishing fleets, including
indicators of capital stock and fixed costs (Anonymous 2006). Recognizing the need for economic data in
order to develop integrated bio-economic assessments in support of the Common Fisheries Policy, the EC
regulation for data collection in fisheries has also included the need to document indicators of capital.
Implementation to date has shown that there is currently no agreement as to the definition and
measurement of capital stock and capital annual costs in the European fishing sector. One of the
difficulties of the definition of the capital stock in fisheries results from its heterogeneous composition.
Multiple capital goods are employed in the harvest process besides the vessel hull. Kirkley and Squires
(1998) propose a large list of additional items, including e.g. main and/or auxiliary engines, winches,
booms, holds, chilling or cooling or freezing equipment, and many types of vessel electronics.
Investments referring to tangible assets are defined as being composed of the value of (i) new vessels
which entered the fleet in the current year, (ii) replacement of engines, (iii) electronics and (iv), others
equipments (storage equipment and gear). This multi-dimensionality of fishing capital creates practical
difficulties when it comes to assessing the overall capital value of a vessel which has gone through
multiple modernisation stages, a case often observed in fisheries. For example, an old fishing vessel can
be equipped with a new engine, requiring lower maintenance costs. These have been used as a proxy for

4
additional investment in different components of the fishing vessel, including hull, engine, electronics,
and gear (Jorgenson 1971). Other authors have considered levels of debt and the associated financial costs
as proxies for the level of investment in a fishery, higher recourse to debt being an indication that fishing
firms were investing in a fishery (Ward and Sutinen 1994; Foltz 2004; Jorgensen and Kort 1997). In other
studies, the level of debt has been considered as an indication of weakened economic and financial
performance, so that higher financial costs were associated with greater chances that some disinvestment
would occur. This assumption was verified in the French context, where the more vulnerable fishing
companies, which eventually closed during the fish crisis in 1993 and 1994, were those with the higher
ratio of debt level to full equity profit (Boncoeur et al. 2000).
In this study, we examine the changes in capital value that have occurred in the French fleets located
along the Atlantic coast over the 1990-2005 period. A model is estimated based on a panel data set
relating to the individual investment strategies of a sample of individual vessel owners. Results from the
econometric model are discussed, focusing on the impact of the French fiscal regime as a possible
explanation of the investment strategies observed.
2. The case study : the French commercial fleet based on the Atlantic coast
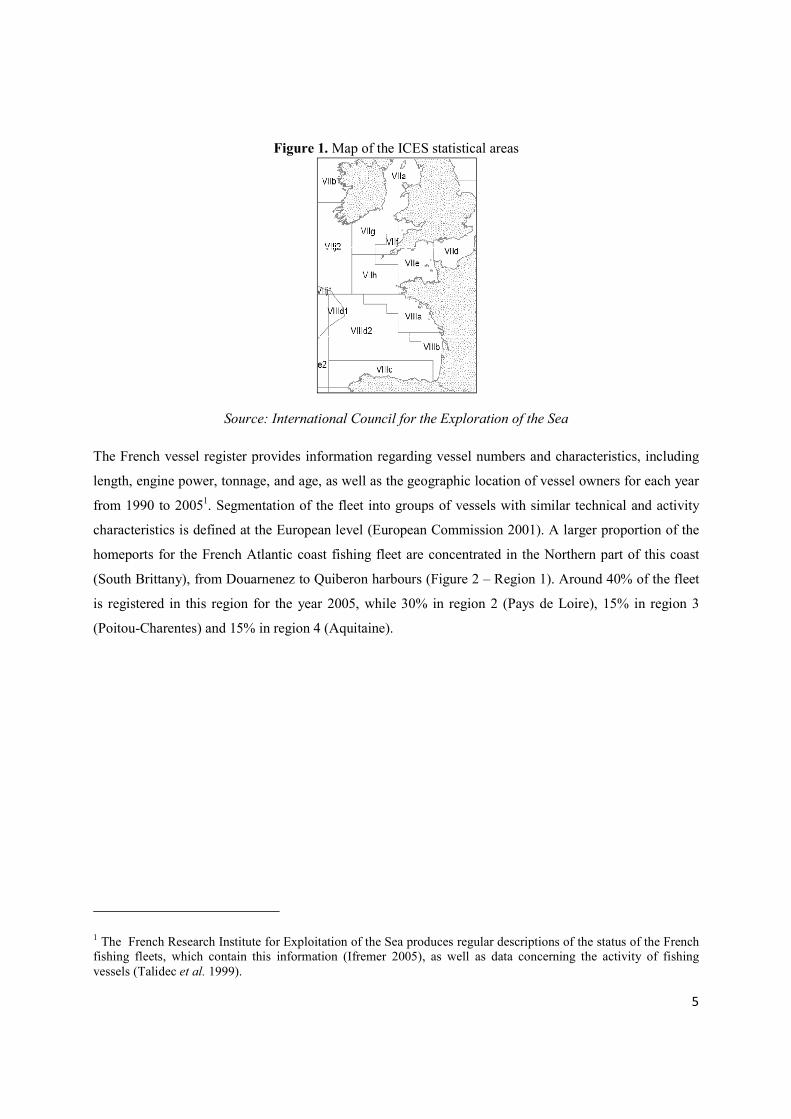
This research focuses on changes observed in the fleets registered in homeports located on the Atlantic
coast of France, during the 1990-2005 period. The North Atlantic fisheries prosecuted by these fleets
include mainly two fishing areas: the Bay of Biscay (ICES statistical areas VIIIa and VIIIb) and the Celtic
Sea (ICES statistical areas VIIh and VIIj) (Fig.1). These two regions are the leading fishing areas for the
French metropolitan fishing fleet. The coastal zone, defined as extending 12 nautical miles from the
shoreline, is fished mainly by smaller vessels with a length of under 12 meters. Larger vessels, move
between the Bay of Biscay fisheries and off-shore fisheries, according to seasonal variations in the
abundance and distribution of their main target. Major commercial species are cod (Gadus morhua), hake
(Merluccius merluccius), monkfish (Lophius piscatorius and L. Budegassa), nephrops (Nephrops
norvegica), pollock (Pollachius pollachius), seabass (Dicentrarchus labrax) and sole (Solea solea).
5
Figure 1. Map of the ICES statistical areas
Source: International Council for the Exploration of the Sea
The French vessel register provides information regarding vessel numbers and characteristics, including
length, engine power, tonnage, and age, as well as the geographic location of vessel owners for each year
from 1990 to 20051. Segmentation of the fleet into groups of vessels with similar technical and activity
characteristics is defined at the European level (European Commission 2001). A larger proportion of the
homeports for the French Atlantic coast fishing fleet are concentrated in the Northern part of this coast
(South Brittany), from Douarnenez to Quiberon harbours (Figure 2 – Region 1). Around 40% of the fleet
is registered in this region for the year 2005, while 30% in region 2 (Pays de Loire), 15% in region 3
(Poitou-Charentes) and 15% in region 4 (Aquitaine).
1 The French Research Institute for Exploitation of the Sea produces regular descriptions of the status of the French fishing fleets, which contain this information (Ifremer 2005), as well as data concerning the activity of fishing vessels (Talidec et al. 1999).

6
Figure 2. Location of the fishing ports in the Atlantic Coast
The structure of the French Atlantic coast fishing fleet changed significantly over the study period. One of
the main access regulation measures that was set up in the French context at the end of the 1980’s was the
adoption of the “Permis de Mise en Exploitation” or Operation Permit system, leading to a de facto
limited entry regime in French fisheries.
Following the enforcement of limited entry, several decommissioning schemes were carried out in France
during the 1990s, as part of the European Multi-Annual Guidance Programmes for capacity reduction (for
a review on buyback schemes see Holland and Gudmundsson 1999; Weninger and McConnell 2000).
Buyback policies contributed to a strong reduction in the number of vessels registered in ports located in
South Brittany (region 1 in fig. 2) by 44% between 1990 and 2005. The highest reduction over the period
was observed for the 16-20 meters units, with a decrease by 55% (against a 9% only reduction in the
number of boats over 20 meters long). Analysis of the characteristics of the vessels that were
decommissioned showed that these were the least performing, such that the reduction in vessel numbers
led to an increase in the average productivity of the fleet that remained active, which was re-investment in
the fleet, following the scrapping of older, less efficient vessels (Thébaud et al. 2006).
During this period, the monetary value of the net capital stock invested in the fleets was estimated to
decrease (Daurès et al. 2006) from 571 million constant € in 1990 to 291 million constant € in 2005 (fig.
Saint-Jean de LuzArcachon
RoyanOléron
La Rochelle
Saint-Gilles Croix de VieLes Sables d’Olonne
Ile d’YeuNoirmoutier
Le CroisicLa Turballe
Concarneau
DouarnenezAudierne
Saint-GuénoléLe Guilvinec
LesconilLoctudy
LorientQuiberon
SpainSpainSpainSpain
FranceFranceFranceFrance
1111
2222
3333
4444

3). These estimations were derived from
of transactions on the French second
to establish estimates of the capital value of
engine, electronics and storage equipment
depreciation function for the vessel hull
of its age (Guyader 2006). The
was constant over the study period (OECD 2001).
depreciation, the net value of the capital stock
depreciated price of the various components of fishing capital,
Figure 3. Evolution of net capital stock (in million eurolocated on the Atlantic coast.
The net value of this capital stock decreased by 49%
16-20 meters fleet segment suffered most, with its share in the
1% every year, from 22% in 1990 to 14% in 2005. Meanwhile, the share
maintained (at around 20% of the total net capital stock for the units under 12 meters
16 meters units), while that of the larger vessels
In summary, the years 1990-2005 were characterized by dis
fishing fleet, leading to a strong reduction in the estimated capital value of the vessels that remained
active. The purpose of the analysis presented in the paper is to determine some of the drivers of this dis
investment, and in particular, to assess the role of fiscal policy in this respect.
derived from data collected via a field survey operated by Ifremer
French second-hand market for fishing vessels. Hedonic price functions were used
to establish estimates of the capital value of vessels and their main components
engine, electronics and storage equipment, and differentiating between new and second hand vessels. A
depreciation function for the vessel hull was also estimated, considering the price of a vessel as a function
of its age (Guyader 2006). The model specification finally assumed that the rate of
period (OECD 2001). Taking into account initial capital value
depreciation, the net value of the capital stock was then calculated. This value corresponds to the
components of fishing capital, given the increasing age of the vessel.
Evolution of net capital stock (in million euros) for all fleet segments of the
the Atlantic coast. Values have been inflated to the year 2005 values
Source: IFREMER
capital stock decreased by 49% in constant terms, in 16 years.
fleet segment suffered most, with its share in the net capital stock
1% every year, from 22% in 1990 to 14% in 2005. Meanwhile, the shares of other
maintained (at around 20% of the total net capital stock for the units under 12 meters
while that of the larger vessels increased from 32% to 40%.
2005 were characterized by dis-investment in the French Atlantic coast
fishing fleet, leading to a strong reduction in the estimated capital value of the vessels that remained
active. The purpose of the analysis presented in the paper is to determine some of the drivers of this dis
t, and in particular, to assess the role of fiscal policy in this respect.
7
a field survey operated by Ifremer, and records
. Hedonic price functions were used
main components, including vessel hull,
new and second hand vessels. A
considering the price of a vessel as a function
that the rate of capital depreciation
Taking into account initial capital value and cumulated
calculated. This value corresponds to the
given the increasing age of the vessel.
of the French fishing fleet Values have been inflated to the year 2005 values.
in 16 years. In relative terms, the
net capital stock decreasing regularly, by
of other segments were roughly
maintained (at around 20% of the total net capital stock for the units under 12 meters, and 26% for the 12-
tment in the French Atlantic coast
fishing fleet, leading to a strong reduction in the estimated capital value of the vessels that remained
active. The purpose of the analysis presented in the paper is to determine some of the drivers of this dis-
8
3. Data and methodology
31. Data and descriptive statistics
In previous research devoted to the French fleets, capital was considered exclusively as a stock (Le Floc’h
et al. 2008a; Irepa 2006). To assess whether fiscal policies have had an impact on the observed changes in
the capital value of the fleet, we develop an analysis of the underlying capital flows and analyze how
these relate to a set of explanatory variables characterising the skipper-owner, as well as the levels of
inputs and outputs use by the fleets. The analysis of investment drivers is focused on the 16-20 meters
units, owing to the particularly strong reduction in the capital stock of this fleet.
Data was available for a sample of 39 owner-operators of single fishing vessels belonging to the 16-20
meters class, over the period 1994-2004. Economic information for these fishing companies was provided
by the Regional Observatory of Fisheries in Brittany, from bookkeeping databases that include landings
value, and operating and financial costs. A recurrent problem when analysing investment flows is limited
data availability. In the case considered, no direct information was available on investment per se.
However, information was available regarding two categories of operational costs which we used as
proxies the levels of investment: these were equipment expenses (new equipment in fishing gears) and
maintenance and repair costs, defined as operating costs in bookkeeping. These costs are linked to capital
in two ways. Firstly, these payments over the year contribute to maintain or increase the value of capital
and associated fishing capacity. Secondly, there may be cases where actual investment costs are registered
as operating costs in bookkeeping for fiscal reasons, as this will tend to lower the net profit and associated
tax payments2.
The dataset contains 225 observations over an 11 year period, with varying number of observations from
year to year due to the exit and entry of vessels in the fleet (table 1). Table 1 provides descriptive statistics
regarding changes in the proxy variable for investment, defined as the total operating costs per firm.
Average operating expenses display an increasing trend over the study period, with oscillatory annual
fluctuations over the time period (table 2).
2 Contrary to most of business sectors in France, including agriculture, there is no common accounting standard for fishing companies in France so that the actual content of certain accounting items may not always be explicitly defined.

9
Table 1. Operational costs (current value) per firm over the 1994-2004 period (mean, standard
deviation and coefficient of variation)
Year Number of observations
Mean in euro
Standard Deviation
Coefficient of variation (%)
1994 23 54 249 22 701 42 1995 25 53 295 22 089 41 1996 22 67 865 37 415 55 1997 24 60 015 17 056 28 1998 20 69 320 30 617 44 1999 23 71 462 28 949 41 2000 21 62 989 28 232 45 2001 19 70 785 38 107 54 2002 17 76 625 24 353 32 2003 18 63 807 28 050 44 2004 13 73 112 35 369 48
Source : Observatoire Economique Régional des Pêches de Bretagne
Variations in levels of investment across individual firms and in time is expected to depend on the
characteristics of the firms, their economic performance, which is related to the status of the fish stocks
they harvest, the value of their landings and their fishing and financial costs, as well as the opportunity
cost of investing in the fleet. Data was available on the characteristics of the vessel and the vessel owner,
annual landings in volume and value, and annual fishing and financial costs. Explanatory variables
relating to these different dimensions were selected after systematic testing for correlations between
variables. The set of explanatory variables that retained in the analysis is presented in table 2.
Table 2. Set of selected explaining variables
Owner Age of owner Vessel Age of the vessel Gear Trawler = 1, Passive gear = 0 Benthic Quantity : %Benthic landings /Total landings Pelagic Quantity : %Pelagic landings /Total landings Landings Landings value / Vessel length (euro per meter) Fuel Fuel cost / Vessel length (euro per meter) Finance Financial Costs / Vessel length (euro per meter) Interest Interest Rates (long term) in %
The age of the owner was used to capture the different career phases at which skipper-owners may be.
Vessel characteristics were described in terms of the age of the vessels, and the main gear used. The age
of the vessels was used to describe changes in the average service life of vessels for this fleet. In the
French fishing industry, the stern trawling technique (trawlers pulling a large net behind the boat) is one
of the major techniques used. Alternatives are the use of passive fishing gears (such as nets, lines, or
pots). The main fishing gear used by the firm was represented through a binary variable (1 if the vessel
uses the trawling technique, 0 in other cases).

10
The categories of exploited fish species were grouped according to the following three main marine
communities: benthic species (species living on the ocean floor, such as monkfish, nephrops and sole),
pelagic species (species living at or near the surface of marine waters, such as sardine and anchovy), and
demersal species (species living at least for an important part of their life cycle near the oceans floor, like
cuttlefish, seabass, pollock and hake). The composition of catches for two of these groups were included
in the analysis to capture the dependence of firms towards different parts of the ecosystem. This was
expressed as the ratios of benthic landings and pelagic landings over total landings expressed in tonnage.
We could expect with negative impact of benthic landings on investment due to ICES recommendations
(ICES 2004)3. The main economic variables used to capture variation in the economic performance of
vessels were annual landings value, fuel costs and financial costs, weighted by the size (length) of the
vessels. The long-term interest rate was also included, as a measure of the opportunity cost of investing in
the fleet for boat owners.
Table 3 presents the average values observed for these variables over the study period, and their
dispersion. The age of skipper-owners remained relatively constant over the first half of the study period,
and then increased somewhat, from an average 39 years to an average 42 years old after 2000. Over
eleven years, the mean service life of vessels in the fleet increased by one year every year, from 12 years
in 1994 to 22 years old in 2004. This constant ageing of the fleet reflects a lack of renewal of the vessels,
which indicates a lack of attractiveness for entrepreneurs.
The value of weighted landings tended to increase over the time period, indicating a growing apparent
productivity of the vessels that remained active in the fleet. Benthic species make up a relatively constant
two thirds of total production over the period, whereas more variability is observed between the two other
groups, with pelagic species (sardine, anchovy, tuna) varying between very low (2-10%) contributions in
the early years, to much larger shares of total landings (17-20%) in the later years. Average fuel costs also
tended to increase throughout the period, at a relatively faster rate than landings value. Financial costs
tended to strongly decrease over the period, until the later years when they increased back to their initial
levels.
3 ICES classified the Monkfish stock (L. piscatorius) “as having full reproductive capacity and being at risk ob being harvested unsustainably”. Scientific advice for nephrops (Nephrops norvegica) stock in concerned areas indicated that spawning biomass had declined slightly over the period.

11
Table 3. Mean value of explicative variables over years
Year Benthic
(%) Pelagic
(%) Owner (years)
Vessel (years)
Finance (€/meter)
Landings (€/meter)
Fuel (€/meter)
1994 65 9 39 12 979 20 012 2 086
1995 64 5 40 13 874 21 712 2 201
1996 64 2 38 15 639 22 736 2 644
1997 60 2 38 15 700 23 081 2 783
1998 60 8 38 17 698 23 140 2 019
1999 56 13 39 18 592 23 871 2 309
2000 60 12 40 20 587 23 739 3 710
2001 62 12 40 21 464 25 344 3 612
2002 65 9 44 22 365 26 324 3 567
2003 62 20 42 21 524 24 044 3 001
2004 59 17 45 22 993 27 141 3 509
Figure 4 depicts trends of the explained variable and three explanatory variables. Financial costs
decreased at a comparable rate as the average service life of vessels increased, until 2002, which would be
expected. However, from 2003, financial costs increased, which probably reflects the need vessel owners
had to invest in new physical assets to maintain their vessels in activity, as these vessels had become
relatively old (average age of around 22 years). Expenses in maintenance and repairs, considered as a
proxy for investment in this study, generally seemed to increase simultaneously with landed value, but
with a regular cycling pattern, which probably reflects the fact that major investment flows occur on a bi
to tri-annual, rather than annual, scale.
Figure 4. Evolution of investment, landings value, age of vessel and financial cost
0
10 000
20 000
30 000
40 000
50 000
60 000
70 000
80 000
90 000
0,20
0,40
0,60
0,80
1,00
1,20
1,40
1,60
1,80
2,00
19
…
19
…
19
…
19
…
19
…
19
…
20
…
20
…
20
…
20
…
20
…
Inv
est
me
nt,
€/
me
ter
Ind
ex
, ba
se 1
in
19
94
Landings value per meter
Age of vessel
Financial cost per meter

12
3.2. Modelling approach
The data set consisted of an unbalanced panel data set, as information at the level of individual fishing
vessels did not systematically cover the entire study period. We assumed that this was the consequence of
randomly missing observations4. This enabled us to use panel data techniques controlling for individual
heterogeneity by integrating individual effects.
Traditionally, individual effects can be specified as fixed or random: in the fixed case, the individual
effects are captured by estimating fixed parameters, whereas in the random case, the individual effects are
a component of the disturbances that cannot be estimated. Mathematically, the estimated equations for our
panel data set are:
- With Fixed Effects5:
ititiit Xy µβαα +′++= i=1, ..., 34 ; t=1994, ..., 2004
where i denotes the vessel and t denotes time, α is a scalar, β is 9x1 and Xit is the itth observation of the 9
explanatory variables (listed in table 2), itµ are independent and identically distributed IID(0, 2µσ ).
Temporal effects were also included by integrating dummy variables for each year.
- With Random Effects :
itiitit Xy µυβα ++′+= i=1, ..., 34 ; t=1994, ..., 2004
where iν are independent and identically distributed IID (0, 2νσ ). Note also that the iν
are independent
of the itµ \. Both models can be estimated. However, results ofthe random effects model are robust only if
the individual disturbances, iν , are independent of the explanatory variables, Xit. The choice of the model
will depend on the result of the Hausman test (Hausman, 1978), which is based on the difference between
the fixed and random effects estimators.If the condition on the independence between iν and Xit is not
satisfied, the estimates of the random effects are biased and inconsistent whereas the fixed estimates
remain unbiased and consistent (Baltagi, 2005). Therefore, the two models were estimated: a model with
individual and temporal fixed effects and a mixed model with random individual effects and fixed effects,
4 This assumption is quite important as standard econometric methods to deal with panel data may result in inconsistent estimations if missing data results from self-selection (Baltagi, 2005). 5 Note the total database covers 39 vessels. Unfortunately, for four boats, some data on the age of the owner were missing for all the period so that these vessels could not be included in the analysis, leaving 34 vessels in the sample.

13
and the presentation of the results in the next section begin by the Hausman test, enabling us to identify
the most efficient model.
4. Results
A Hausman test led to the conclusion that the two-way fixed effects model should be preferred. However,
we choose to present the one-way fixed effect model as some dummy temporal variables are collinear and
degrees of freedom are lost by the incorporation of the temporal proxies. Nevertheless, the significant
variables and the signs of their coefficient are the same in both specifications.
Table 4 gives the result of the Hausman test. Looking at the value of the probability, the null hypothesis
of an absence of correlation between the individual disturbances and the explanatory variables can be
rejected. Therefore, an individual fixed effects model should be preferred to a random effects model6.
Table 4: Haussman test Hausman Test Statistic Prob.
27.75 0.0001
The following specification was retained :
itiititit
itititititit
GearFuelLandingsFinance
InterestVesselOwnerPelagicBenthicInvestment
µαβββββββββα
++++++
+++++=
9876
54321
A White’s (1984) robust variance–covariance matrix has been used to correct for heteroscedastik error
term. Results from the fixed effects model are described in Table 5. Numbers in parentheses are robust t-
statistic and the number of asteriks reveals the level of confidence : 1 % (***), 5 % (**) and 10 % (*).
Note that the estimates are robust to heteroskedastic disturbances since a White’s (1984) robust variance–
covariance matrix has been used. Moreover, the value of the Durbin Watson Statistic indicates there is no
residual autocorrelation. This indicates that the model is able to explain the data well, and this is
confirmed by the relatively high value of the adjusted R-squared (0.54). Over the nine explanatory
variables included, five are significant (Benthic, Owner, Vessel, Finance and Gear), but at different
confidence levels. Three of them are significant at the 1 % level (Benthic, Owner, Vessel). It thus appears
that vessels with a higher dependence on benthic species, mainly monkfish and nephrops, invest more
6 Moreover, an F-test on the joint significance of individual effects was implemented and the null hypothesis of joint non-significance rejected. Consequently, it is better to apply a model with individual fixed effects.

14
money in renewing their equipment and fishing gears, and in maintenance and repair costs. Results
regarding the age of the owner and the vessel are quite surprising as their coefficients are respectively
positive and negative: investment in the fleet increased with the age of the owner, and decreased with the
age of the vessel, over the period. An explanation of such impacts is proposed in the next section, which
takes into account the potential role of the fiscal policy that affected this fishing fleet over the study
period. The choice of the fishing technique (Gear) is also significant but at the 5% level: the flow of
investment appears to have been lower for vessels adopting the active trawling techniques, as compared to
vessels using passive techniques. The last significant variable, at the 10 % level, is the financial cost per
meter which had a positive impact on investment in the fleet. Other variables (Pelagic, Interest, Landings,
Fuel) did not significantly influence the flow of investment in the fleet, according to the sample
examined.
Table 5 - Econometric Results
Robust Fixed Effects Model
Benthic 1 105.761 ***
(3.52)
Pelagic -264.6886
(-0.80)
Owner 12 331.5 ***
(3.47)
Vessel -12 089.78 ***
(-3.89)
Interest -3 587.354
(-1.34)
Finance 8.6837 *
(1.67)
Landings -1.0695 (-1.50)
Fuel 1.3606 (0.34)
Gear -88 333.56 **
(-2.27) Adjusted R-Squared 0.5392 Durbin Watson Stat 2.5459
Sample 184 data
34 vessels studied
15
5. Discussion
The econometric results point to some of the key drivers of investment in the fleet under consideration,
over the study period. Investment levels are affected positively by fishing units exploiting mainly benthic
species (monkfish, nephrops) and managed by the oldest entrepreneurs with the highest financial cost. At
the opposite, investments are negatively impacted for the oldest vessels and equipped with trawling gear.
The main result relates to the counter-intuitive sign of the variable describing the age of the owner. To
explain this, one must consider the possible influence of the broader context in which vessel owners made
their decisions regarding investment during the study period, and in particular the impact which the fiscal
regime may have had on these decisions.
French fiscal regulations place fishermen under a dispensation regime (Anonym. 2003). Companies can
fully depreciate their vessel in less than ten years (and a minimum of six years), whereas the estimated
economic lifetime of a vessel is usually over 20 years (Irepa 2006). The main effect of this is to generate a
high capital gain for sellers of fishing boats, which under French fiscal regulations, is considered as short-
term gain and liable to income tax at a high rate (nearly 60%). Since fishing vessels are usually sold once
the capital is fully depreciated, the sale price can often be considered to be mainly composed of highly
taxed short-term capital gain. Following the economic crisis which impacted the French fishing industry
in 1993-1994 (Mesnil 2008), the French authorities decided on an extension of a tax avoidance regime,
implemented through the Fisheries Guidance Act adopted in 1997 (Anonym. 1997). Under this Act,
vessel owners can benefit from a partial tax exemption on capital gain only in case of reinvestment in the
fishing sector. Consequently, the oldest skipper-owners were the population directly concerned with this
special regime.
End-career fishermen would then have to choose between staying and exiting. The former option was
encouraged by tax exemption on capital gains under the condition to reinvest in the marine catch sector.
From our econometric results, it can be argued that end-career fishermen under positive economic
conditions (Gale 2003), managing an old single vessel using the trawling technique, had additional fiscal
arguments to push their annual expenses in capital ahead, decreasing net profit and future tax on capital
gain. Once their physical assets were fully depreciated, older owners could undertake higher investment
levels in equipment (investment expenses being registered as a running cost) to obtain lower levels of net
profit, hence pay less taxes when they decided to sell their vessels when retiring. This would explain why
the explanatory variable “Owner” in the econometric model, which represents the age of the owner, had a
positive sign in the estimation. Hence, the fiscal regime may thus have directly affected the investment
16
dynamics, particularly in the later career phases of boat owners, mainly under good economic
performance.
Conversely, fishermen should have preferred to exit the fishery under bad economic performance. Many
ship owners were then put heavily into debt in the mid nineties (Hénaff et al. 1995), explaining lower
investment in materials and maintenance. In this case, the fiscal rule would not give enough incentives to
older fishermen compared to buyback programmes implemented in the beginning of 2000. It has been
proved that the buyback plans implemented from 1991 has not had the expected results (Mesnil 2008)
because the potential fishing capacity has not dramatically reduced, but was concentrated more on
trawlers over 20 meters in terms of engine power (Ikiara and Odink, 2000). As a consequence, capacity
reduction programmes have strongly impacted the segment of the 16-20 meters vessels (Guyader et al.
2007). The contribution of this fleet to total capacity in monetary value was reduced from 22% to 14%
over the study period. Amongst vessels making up the sample from which estimations have been found, it
can be argued that the oldest were intended to be scrapped through buyback schemes. Six buyback
schemes were implemented by the French government over the study period, the first in 1994, and one
every year from 2000. These schemes were financed through the Financial Instrument for Fisheries
Guidance (46% of the total allowance) and the State (54%). Logically, investments costs registered as
running expenses (maintenance and repairs) should not have been very high if the vessel was scrapped the
year after, explaining a negative impact of the age of the vessel on investments. Buyback schemes would
act as a stronger incentive to decrease running costs for the older vessels designed to scrapping (Clark et
al. 2005). Furthermore, selection adverse and moral hazard problem are often expected results when a
buyback program is implemented (Squires et al. 2010; Curtis and Squires 2007). Owners know perfectly
the technical state of their fishing vessels and can be strongly motivated to decommission their physical
capital if the residual value is low. Oldest vessels’ owners behave rationally when they limit investment in
maintenance and repairs, expecting a new buyback program as it was the case in 2003 and 2004
(Ministère de l’Agriculture et de la Pêche 2006). They make the most of an opportunity coming from the
State. On the one hand, fishermen with mediocre economic results had more interests from buyback
programs than from the fiscal regime, given that decommissioning premiums were paid independently of
the effective fishing capacity of vessels, as they were based on nominal measures of physical capacity. On
the other hand, we can say that buyback programs have failed especially due to the fiscal regime in the
French fisheries, giving more incentives to oldest owners with positive economic results to reinvest in
new vessels.

17
Secondly, the age of the vessel is not an adequate variable to define the average service life of capital.
Investments in fisheries referring to tangible assets are composed of the value of new items such as
engines (with a replacement every ten years), electronics and other equipment (Irepa 2006). As
replacement of each component is required according to the mean service life, the age of the vessel does
not precisely reflect the technical state of the total physical assets. For instance, an old vessel can be
equipped with a new engine, explaining lower expenses in maintenance and negative correlation with the
explained variable in the model.
The last point we have to raise is the positive sign of the variable “Benthic” which is highly significant. In
the beginning of the nineties and the opening of the European market, monetary policies of neighbouring
countries (UK as a competitor, Spain and Italy as main outlets) and the development of salmon
aquaculture profoundly changed competition on an international level. French fishermen did not expect
these changes, causing a strong drop in prices (Steinmetz et al. 2006). French benthic products were less
competitive in the European markets, producing poor economic results for the fleets which are more
vulnerable to international competition (particularly benthic production, such as monkfish, cod, sole and
nephrops). Moreover, buyback schemes in 2003 and 2004 were particularly designed for vessels
exploiting benthic production (Ministère de l’Agriculture et de la Pêche 2006). The level of premium for
scrapping reached 95% (and 110% if the vessel was concerned with the recovery plan for cod) whereas
the usual level was limited to 75% of the maximum threshold for other vessels more concentrated on
pelagic and demersal species. One can explain that end-career fishermen exploiting benthic species had to
balance the pros and the cons between the impact of the fiscal regime (capital gain with the sale on the
second-hand market) and the premium received from the State and the European Union if the vessel was
scrapped. In the former case, fishermen had motivations to increase running costs in maintenance and
repairs whereas with the former case there is no real interest.
The paper focused on the influence of fiscal regulations on investment. One difficulty consists in the
identification of capital as a flow because information is seldom available at a detailed scale. We have
estimated the levels of investment through proxies (equipment expenses and maintenance and repair
costs), showing a significant relationship with the age of the owner, the age of the vessel and the benthic
production. The counter-intuitive results are explained both from the impact of the fiscal regime and the
buyback programs. One of the major challenges for fisheries economists is to study the investment
dynamics under the real assumption of non-malleability of capital and labour (Munro 2010). In this paper,
we have suggested one way to progress in a better understanding of the changes in the marine catch
sector.
18
References
Anonym, 2006. Economic Performance of Selected European fishing fleets, Annual report 2005, EC Contract "Economic Assessment of European Fisheries", 306 p.
Anonym, 2003. Mémento pratique Francis Lefebvre. Fiscal. Editions Francis Lefebvre, 1630p.
Anonym, 1997. Loi n°97-1051 du 18 novembre 1997 d'orientation sur la pêche maritime et les cultures marines, Journal Officiel de la République française, 33 p.
Baltagi B., 2005. Econometric analysis of panel data, 4th edition, Wiley, 366 p.
Boncoeur J., Coglan L., Le Gallic B., Pascoe S., 2000. On the (ir)relevance of rates of return measures of economic performance to small boats. Fisheries Research, 49:105–15.
Charles A.T., 2007. Linking natural capital and physical capital: A review of renewable resource investment models. In T. Bjørndal, D.V. Gordon, R. Arnason, and U.R. Sumaila, eds., Essays in fisheries economics and management: A festschrift in honour of Gordon Munro, ch. 8. Blackwell, Oxford.
Clark, C.W., F.H. Clarke, and G.R. Munro. 1979. The optimal exploitation of renewable resource stocks: Problems of irreversible investment. Econometrica 47: 25–47.
Clark C. W., Munro G.R., Sumaila U.R., 2005. Subsidies, buybacks, and sustainable fisheries. Journal of Environmental Economics and Management 50:47–58.
Curtis R., Squires D., 2007. Fisheries Buybacks, Blackwell Publishing, 288p.
Daurès F, Bihel J, Guyader O, Le Floc’h P, Roudaut N, Brigaudeau C, Thébaud O, Jézéquel M., 2006. Estimating capital value and depreciation of fishing fleets: Application to French fisheries. IIFET 2006 Portsmouth (UK) Proceedings.
European Commission, 2010. Ex-post evaluation of the Financial Instrument for Fisheries Guidance (FIFG) 2000-2006, Final report, Tome 1, 194 p,
European Commission, 2001. (EC) No 1639/2001 of 25 July 2001 establishing the minimum and extended Community programmes for the collection of data in the fisheries sector and laying
down detailed rules for the application of Council Regulation. (EC), No 1543/2000, Brussels, 63p
Foltz J. D., 2004. Entry, exit, and farm size: Assessing an experiment in dairy price policy. American Journal of Agricultural Economics, 86:594–604.
Gale H. F., 2003. Age-specific patterns of exit and entry in U.S. farming, 1978–1997. Review of Agricultural Economics, 25:168–186.
Guyader, O., Berthou P., Daurès F., 2007. Decommissioning Schemes and Capacity Adjustment: A Preliminary Analysis of the French Experience, in Fisheries Buybacks, ed. By Curtis R., Squires D., Blackwell Publishing, 288p.
Hausman J.A., 1978. Specification tests in econometrics. Econometrica 46:1251-1271.
Hénaff O., Mettling B., Mingasson A., Menanteau J.P., 1995. Rapport d’audit sur la situation financière des navires de pêche artisanale et des organismes d’intervention. Ministère de l’Agriculture et de la Pêche, Paris, Février 1995, 31 p. + annexes.
Holland D., Gudmundsson E. Gates J. 1999. Do fishing vessel buyback programs work: A survey of the evidence. Marine Policy, 23: 47–69.
19
ICES, 2004. Anglerfish in Divisions VIIb k and VIIIa,b (L. piscatorius and L. budegassa) and Nephrops in Divisions VIIIa,b (Management Area N), ICES advice report series, 21p.
Ifremer, 2005. Synthèse des flottilles de pêche 2004 – Flotte de Mer du Nord – Manche – Atlantique. Système d’Informations Halieutiques, Plouzané, 54p.
Ikiara M.M., Odink J.G., 2000. Fishermen to resistance to exit fisheries. Marine Resource Economics 14:199–213.
Irepa, 2006. Evaluation of the capital value, investments and capital costs in the fisheries sector, n° Fish/2005/03, final report, 203p
Jensen C.L., 1998. Investment behavior and tax policy. Marine Resource Economics, 13:185–196.
Jørgensen S., Kort P.M., 1997. Optimal investment and finance in renewable resource harvesting. Journal of Economic Dynamics and Control, 21:603–630.
Jorgenson D.W., 1971. Econometric studies of investment behavior: A survey. Journal of Economic Literature, 9:1111–1147.
Kirkley J. E., Squires D., 1998. Measuring Capacity and Capacity Utilization in Fisheries, Report, April.
Le Floc’h P., Daurès F., Brigaudeau C., Bihel J, 2008a. A comparison of economic performance in the fisheries sector: A short and long term perspective. Marine Policy, Vol. 32, 421-431.
Le Floc’h P., Poulard J.C , Thébaud O., Blanchard F., Bihel J., Steinmetz F., 2008b. Analyzing the market position of fish species subject to the impacts of long-term changes in marine fish communities : an application to the French fisheries of the Bay of Biscay. Aquatic Living Resources, 21, pp307-316.
London Economics, 2004. A synthesis of the Mid-Term Evaluations of the FIFG 2000-2006, report to European Commission-Directorate General for Fisheries, 38p.
Mesnil B. 2008. Public-aided crises in the French fishing sector. Ocean and Coastal Management (51):689-700.
Ministère de l’Agriculture et de la pêche, 2006. L’analyse détaillée des soutiens de l’État et de l’Union européenne à la pêche - Données 2004, (http://agriculture.gouv.fr/IMG/pdf/ensemble_31.pdf)
Munro G.R., 2010. The Way Forward: Getting the Economic Theory Right, The First Steps. IIFET 2010 Montpellier (France) Proceedings.
OECD, 2001. Measuring Capital OECD Manual – Measurement of capital stocks, consumption of fixed capital and capital services, Paris, 134p.
Squires D., Groves T., Grafton Q., Curtis R., Joseph J., Allen R., 2010. Fisheries buybacks. Chapter 37. In: Handbook of Marine Fisheries Conservation and Management (eds R.Q.Grafton, R.Hilborn, D.Squires, M.Tait and M.Williams). Oxford University Press, Oxford, UK.
Steinmetz F., Thébaud O., Blanchard F., Le Floc’h P., Bihel J., 2008. A bio-economic analysis of long term changes in the fisheries production of the Bay of Biscay. Aquatic Living Resources, 21, pp317-327.
Sumaila U.R., Tel L., Watson R., Tyedmers P., Pauly D., 2008. Fuel price increase, subsidies, overcapacity, and resource sustainability. ICES Journal of Marine Science, 65, pp832-840.
Talidec C., Berthou P., Jézéquel M., Lespagnol P., 1999. La flotte de pêche commerciale bretonne – Description des métiers. Rapport, IFREMER, Plouzané, France, 128p.

20
Thébaud O., Daurès F., Guyader O., Travers M., Van Iseghem S., 2006. ‘Modelling the adjustment of fishing fleets to regulatory controls: the case of South-Brittany trawlers (France), 1990-2003’ AMURE Working Paper D13-2006 (Available online at: http://www.univ-brest.fr/gdr-amure/documents/gdr-amure-D-13-2006.pdf).
Ward J.M., Sutinen J.G., 1994. Vessel entry-exit behaviour in the Gulf of Mexico shrimp fishery. American journal of Agricultural Economics, 76:916–923.
Weninger, Q., McConnell K.E., 2000. Buyback programs in commercial fisheries: efficiency versus transfers. Canadian Journal of Economics, 33: 394–412.
White H., 1980. A heteroskedasticity-consistent covariance matrix estimator and a direct test for heteroskedasticity, Econometrica, 48 : 817–838.

ISSN 1951-641X
Amure Publ icat ions . Work ing Papers ser ies .
Onl ine publ icat ion : www.umr-amure. f r