Embed Size (px)
Citation preview
Collection des rapports de Recherche de l’ENST Bretagne
RR-2007002-RSM
2007
Streaming of H.264 Video over HSDPA: Impact of MAC-Layer Schedulers on User-Perceived Quality Diffusion de la vidéo codée H.264 sur HSDPA : impact de l’ordonnancement au niveau MAC sur la qualité perçue Rapport Interne GET / ENST Bretagne
Kamal Deep SINGH Julio OROZCO David ROS Gerardo RUBINO
Streaming of H.264 Video over HSDPA: Impact of
MAC-Layer Schedulers on User-Perceived Quality
Diffusion de la video codee H.264 sur HSDPA : impact de
l’ordonnancement au niveau MAC sur la qualite percue
Rapport Interne GET / ENST Bretagne
Kamal Deep SinghIRISA/INRIA RennesCampus de Beaulieu
35042 Rennes Cedex, Francee-mail: [email protected]
Julio OrozcoFrance Telecom R & D2 avenue Pierre Marzin
22307 Lannion Cedex, Francee-mail: [email protected]
David RosEcole Nationale Superieure des Telecommunications de Bretagne
Rue de la Chataigneraie, CS1760735576 Cesson Sevigne Cedex, France
e-mail: [email protected]
Gerardo RubinoIRISA/INRIA RennesCampus de Beaulieu
35042 Rennes Cedex, Francee-mail: [email protected]
1
Abstract
High Speed Downlink Packet Access (HSDPA) is an enhancement of UMTS networks thatsupports data rates of several Mbit/s, making it suitable for data applications ranging fromfile transfer to multimedia streaming. In spite of the fairly high data rates that HSDPAoffers, the shared downlink radio channel used in HSDPA is a challenging environment fordelay- and loss-sensitive applications like video.
This paper focuses on the problem of streaming H.264-coded video over HSDPA. Ourgoal is to evaluate the impact of several MAC-level scheduling approaches on video quality.The video quality is evaluated using a tool that yields a good estimate of the user-perceived,subjective quality. We consider both a best-effort streaming scenario, that is, without anyQoS support at the IP level, and a QoS-aware streaming scenario, in which some videopackets, marked by the video server as being the most important for the decoding process,are protected from loss. Our results show the gains achieved by a QoS scheduler in terms ofincreased cell coverage and increased number of users that can be admitted in the system,for the same subjective quality experienced by the video users. Moreover, with the use ofa QoS scheduler, the remaining capacity is fairly divided among the best-effort users.
Keywords
H.264, Video Streaming, Subjective Quality, QoS, 3G/UMTS Networks, HSDPA, RandomNeural Networks.
2
Resume
Le High Speed Downlink Packet Access (HSDPA) est une evolution des reseaux UMTSpermettant de supporter des applications tres diverses, telles des applications de donneeset multimedias, car il offre des debits pouvant atteindre plusieurs Mbit/s. Malgre cesdebits relativement eleves, la liaison radio sur la voie descendante (de la station de basevers les terminaaux) pose tout de meme des problemes de performance aux applicationssensibles aux delais et aux pertes, comme la video, a cause du caractere partage de cetteliaison.
Ce rapport se concentre sur le probleme de la diffusion (streaming) de la video codeeH.264 sur HSDPA. L’objectif de ces travaux est d’evaluer l’impact que diverses methodesd’ordonnancement au niveau MAC peuvent avoir sur la qualite de la video. Cette qualiteest mesuree grace a un outil offrant une bonne estimation de la qualite subjective, percuepar un utilisateur. Nous considerons aussi bien un scenario best-effort, sans aucun sup-port pour la QoS au niveau IP, qu’un scenario de diffusion “consciente de la QoS”, danslequel on protege des pertes certains paquets IP ayant ete marques par le serveur commeetant les plus importants pour le decodage du flux video. Les resultats presentes icimontrent l’avantage d’utiliser un mecanisme d’ordonnancement au niveau MAC tenantcompte des contraintes de QoS des flux, car il offre une plus grande couverture dans lacellule et il permet de maximiser le nombre d’utilisateurs admis dans celle-ci, tout enconservant une bonne qualite subjective pour la video. En outre, avec un tel mecanismed’ordonnancement, la bande passante residuelle est repartie de maniere equitable entre lesutilisateurs ne demandant pas de garantie de QoS.
Mots-cles
H.264, diffusion de la video, qualite subjective, qualite de service, reseaux 3G/UMTS,HSDPA, Reseaux de neurones aleatoires.
3
Contents
1 Introduction 51.1 Related work . . . . . . . . . . . . . . . . . . . . . . . . . . . . . . . . . . . 6
2 H.264 Video Streaming over IP Networks 72.1 H.264 Video Coding . . . . . . . . . . . . . . . . . . . . . . . . . . . . . . . 72.2 QoS-Aware Video Streaming . . . . . . . . . . . . . . . . . . . . . . . . . . 8
2.2.1 DiffServ Architecture . . . . . . . . . . . . . . . . . . . . . . . . . . . 82.2.2 DiffServ-Aware Streaming of H.264 video . . . . . . . . . . . . . . . 10
3 High Speed Downlink Packet Access (HSDPA) 103.1 Scheduling in HSDPA . . . . . . . . . . . . . . . . . . . . . . . . . . . . . . 12
3.1.1 Round-Robin Scheduling . . . . . . . . . . . . . . . . . . . . . . . . 123.1.2 Maximum C/I Scheduling . . . . . . . . . . . . . . . . . . . . . . . . 123.1.3 Proportionally Fair Scheduling . . . . . . . . . . . . . . . . . . . . . 133.1.4 Rate-Guarantee Scheduling . . . . . . . . . . . . . . . . . . . . . . . 13
3.2 QoS-aware IP Queue Management in the UTRAN . . . . . . . . . . . . . . 14
4 Estimation of Subjective Video Quality 15
5 Performance Evaluation 165.1 Simulation Platform and Models . . . . . . . . . . . . . . . . . . . . . . . . 175.2 Methodology . . . . . . . . . . . . . . . . . . . . . . . . . . . . . . . . . . . 175.3 Simulation Scenarios . . . . . . . . . . . . . . . . . . . . . . . . . . . . . . . 18
6 Results 186.1 Long-Lived Flows as Background Traffic . . . . . . . . . . . . . . . . . . . . 20
6.1.1 Case I . . . . . . . . . . . . . . . . . . . . . . . . . . . . . . . . . . . 206.1.2 Case II . . . . . . . . . . . . . . . . . . . . . . . . . . . . . . . . . . 216.1.3 Case III . . . . . . . . . . . . . . . . . . . . . . . . . . . . . . . . . . 23
6.2 Mix of TCP Long-Lived and WWW Flows as Background Traffic . . . . . . 236.3 Drop-Tail vs. RIO Queue Management . . . . . . . . . . . . . . . . . . . . . 26
7 Conclusions and Future Work 26
A Physical layer model in EURANE 31
4
1 Introduction
Universal Mobile Telecommunications System (UMTS) [1] is a third-generation, wirelesscellular network that uses Wideband Code Division Multiple Access (WCDMA) as itsradio interface technology. UMTS offers higher data rates with respect to older 2G and2.5G networks and, with the Release 5 version, is evolving into an all-IP, wireless packetnetwork. The increased bandwidth provided by UMTS allows for the deployment of awide range of services, like voice, data and multimedia streaming services.
INTERNET
GGSN SGSNVideo Server
UMTS CORE NETWORK
UTRAN
RNCBS
UEs
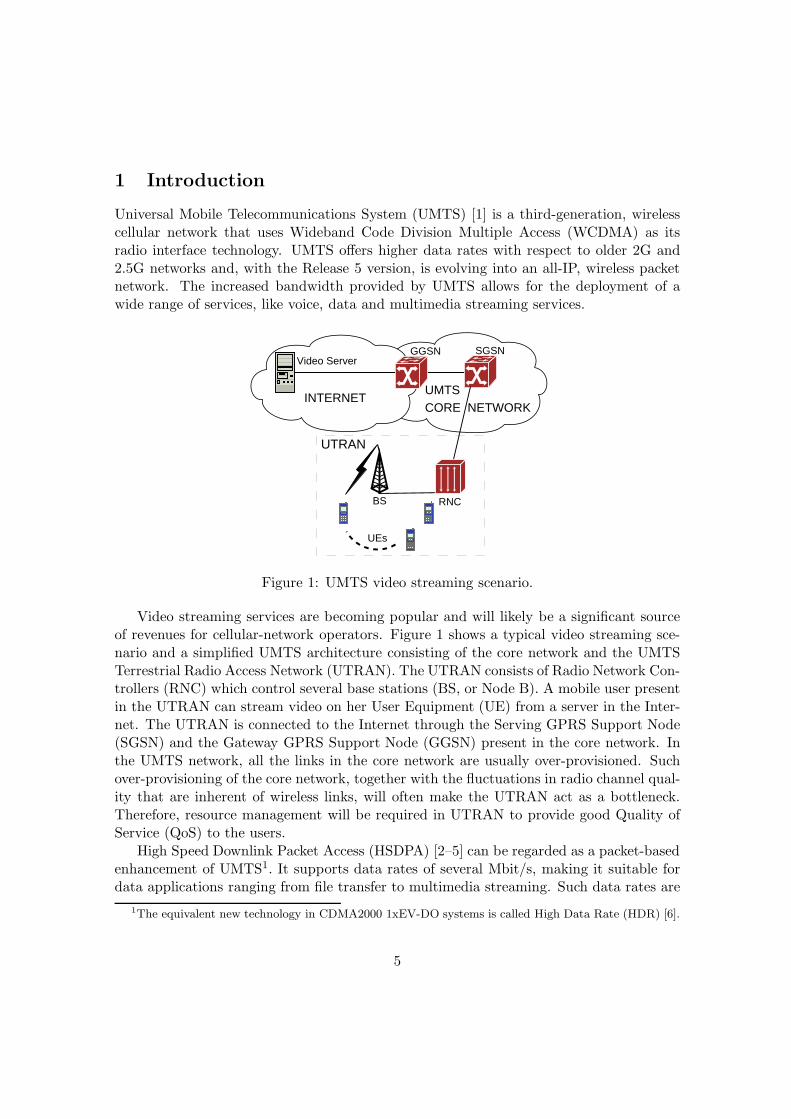
Figure 1: UMTS video streaming scenario.
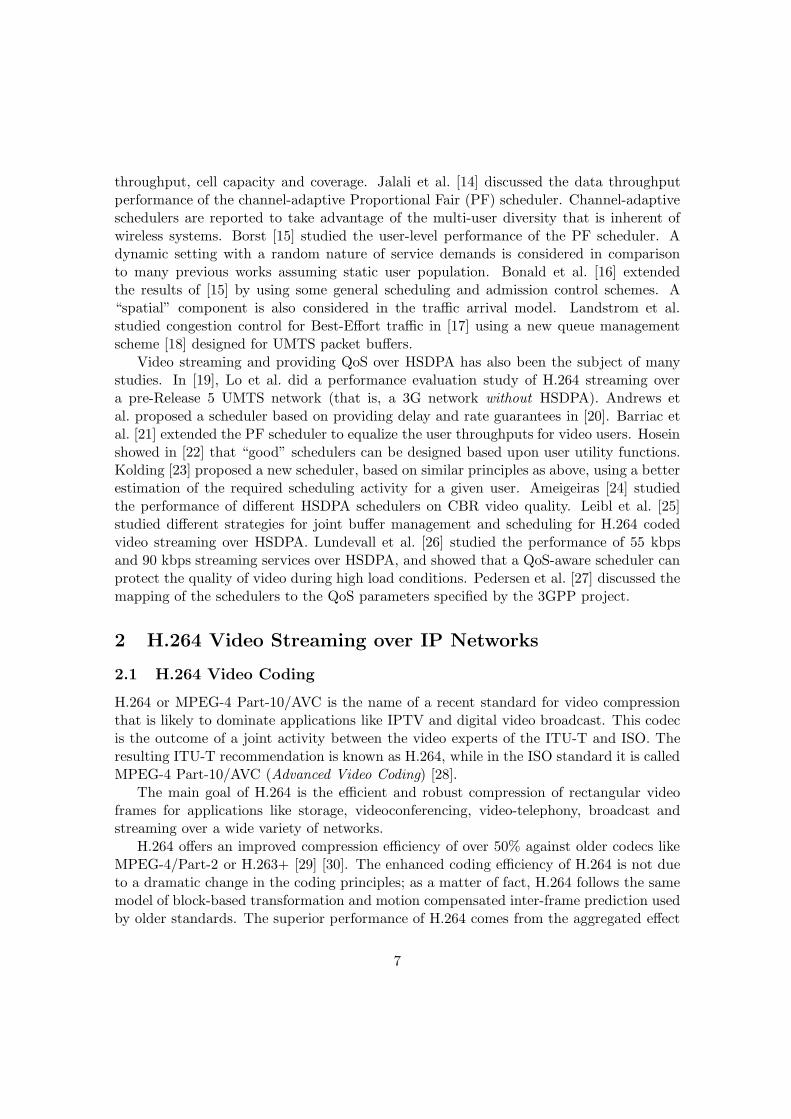
Video streaming services are becoming popular and will likely be a significant sourceof revenues for cellular-network operators. Figure 1 shows a typical video streaming sce-nario and a simplified UMTS architecture consisting of the core network and the UMTSTerrestrial Radio Access Network (UTRAN). The UTRAN consists of Radio Network Con-trollers (RNC) which control several base stations (BS, or Node B). A mobile user presentin the UTRAN can stream video on her User Equipment (UE) from a server in the Inter-net. The UTRAN is connected to the Internet through the Serving GPRS Support Node(SGSN) and the Gateway GPRS Support Node (GGSN) present in the core network. Inthe UMTS network, all the links in the core network are usually over-provisioned. Suchover-provisioning of the core network, together with the fluctuations in radio channel qual-ity that are inherent of wireless links, will often make the UTRAN act as a bottleneck.Therefore, resource management will be required in UTRAN to provide good Quality ofService (QoS) to the users.
High Speed Downlink Packet Access (HSDPA) [2–5] can be regarded as a packet-basedenhancement of UMTS1. It supports data rates of several Mbit/s, making it suitable fordata applications ranging from file transfer to multimedia streaming. Such data rates are
1The equivalent new technology in CDMA2000 1xEV-DO systems is called High Data Rate (HDR) [6].
5
(in principle) high enough for supporting the streaming of multimedia flows to several usersat a time in a single cell. Nonetheless, due to its shared nature, the radio channel usedto transfer data from the base station to mobile terminals remains a challenging environ-ment for delay- and loss-sensitive applications like video. One of the main characteristicsof HSDPA is the use of MAC-layer scheduling to perform resource management (i.e., band-width allocation between terminals), taking into account the radio channel conditions ofall users. Such channel-adaptive scheduling may result in strong bandwidth fluctuations,causing packet loss and degradation in the quality of the received video. Additional factorslike fairness between users, cell throughput or quality-of-service (QoS) parameters are alsoconsidered in some scheduling mechanisms proposed in the literature.
This paper focuses on the problem of streaming H.264-coded video over HSDPA, andparticularly on the choice of a MAC-level scheduler suitable for video streaming. We areinterested in assessing the impact of several schedulers on the subjective quality of thereceived video. Some studies have already been done (see 1.1) that use objective qualityparameters like PSNR (Peak Signal to Noise Ratio), packet delay or loss and playout bufferunderflow to study video streaming over HSDPA. However, it is well known that objectivemetrics like those above do not necessarily correlate well with user-perceived quality whena network is involved (see for instance [7]). In order to obtain a quality metric as correlatedas possible with human visual perception, we employ a recently proposed technique, PSQA(Pseudo-Subjective Quality Assessment) [8–10] that yields an estimate of the subjectivequality. PSQA is based on a specific type of queuing network used as a learning tool calledRandom Neural Network.
We consider two types of streaming scenarios, differing in the level of QoS supportoffered at the IP layer: (1) A best-effort streaming scenario, that is, without any QoSsupport at the IP level. (2) A QoS-aware streaming scenario, in which the networkprotects from loss the video packets that are the most important for the decoding process.This protection is achieved through both a packet-marking scheme at the H.264 streamingserver, and a QoS-aware queue management in the UTRAN.
The paper is structured as follows. Section 2 provides some background on the H.264video codec, and on H.264 video streaming over IP networks offering QoS support. Sec-tion 3 gives an overview of HSDPA and several MAC layer schedulers, and it also presentsthe QoS-aware IP queue management in the UTRAN considered in this study. Section 4focuses on the problem of evaluating the subjective video quality and presents the qualityestimation tool that we employed. Sections 5 and 6 present and discuss a performanceevaluation study done with the well-known ns-2 network simulator [11]. Finally, Section 7concludes the paper.
1.1 Related work
Many recent studies have focused on evaluating the performance of HSDPA-enhancedUMTS systems in the context of best-effort traffic [12, 13]. Parkvall et al. [5] providedan overview of key HSDPA technologies and showed the improvements in terms of user
6
throughput, cell capacity and coverage. Jalali et al. [14] discussed the data throughputperformance of the channel-adaptive Proportional Fair (PF) scheduler. Channel-adaptiveschedulers are reported to take advantage of the multi-user diversity that is inherent ofwireless systems. Borst [15] studied the user-level performance of the PF scheduler. Adynamic setting with a random nature of service demands is considered in comparisonto many previous works assuming static user population. Bonald et al. [16] extendedthe results of [15] by using some general scheduling and admission control schemes. A“spatial” component is also considered in the traffic arrival model. Landstrom et al.studied congestion control for Best-Effort traffic in [17] using a new queue managementscheme [18] designed for UMTS packet buffers.
Video streaming and providing QoS over HSDPA has also been the subject of manystudies. In [19], Lo et al. did a performance evaluation study of H.264 streaming overa pre-Release 5 UMTS network (that is, a 3G network without HSDPA). Andrews etal. proposed a scheduler based on providing delay and rate guarantees in [20]. Barriac etal. [21] extended the PF scheduler to equalize the user throughputs for video users. Hoseinshowed in [22] that “good” schedulers can be designed based upon user utility functions.Kolding [23] proposed a new scheduler, based on similar principles as above, using a betterestimation of the required scheduling activity for a given user. Ameigeiras [24] studiedthe performance of different HSDPA schedulers on CBR video quality. Leibl et al. [25]studied different strategies for joint buffer management and scheduling for H.264 codedvideo streaming over HSDPA. Lundevall et al. [26] studied the performance of 55 kbpsand 90 kbps streaming services over HSDPA, and showed that a QoS-aware scheduler canprotect the quality of video during high load conditions. Pedersen et al. [27] discussed themapping of the schedulers to the QoS parameters specified by the 3GPP project.
2 H.264 Video Streaming over IP Networks
2.1 H.264 Video Coding
H.264 or MPEG-4 Part-10/AVC is the name of a recent standard for video compressionthat is likely to dominate applications like IPTV and digital video broadcast. This codecis the outcome of a joint activity between the video experts of the ITU-T and ISO. Theresulting ITU-T recommendation is known as H.264, while in the ISO standard it is calledMPEG-4 Part-10/AVC (Advanced Video Coding) [28].
The main goal of H.264 is the efficient and robust compression of rectangular videoframes for applications like storage, videoconferencing, video-telephony, broadcast andstreaming over a wide variety of networks.
H.264 offers an improved compression efficiency of over 50% against older codecs likeMPEG-4/Part-2 or H.263+ [29] [30]. The enhanced coding efficiency of H.264 is not dueto a dramatic change in the coding principles; as a matter of fact, H.264 follows the samemodel of block-based transformation and motion compensated inter-frame prediction usedby older standards. The superior performance of H.264 comes from the aggregated effect
7
of a series of algorithmic innovations, each one accounting for an incremental gain. Formotion prediction, these enhancements include the use of small and variable block-sizes,quarter-pixel accuracy, motion vectors over picture boundaries and the use of multiplereference pictures [31]. Other enhancements include small block-size transformation andthe use of advanced entropy coding methods (CABAC and CVLC) [32].
In addition to an improved coding efficiency, a very important feature of H.264 is that itis specifically designed for the transport of coded video over a variety of existing and futurenetwork transport technologies. The design of H.264 addresses this need for flexibility andcustomizability by means of separating the coded information in two layers: the VideoCoding Layer (VCL) and the Network Adaptation Layer (NAL) [32]. VCL represents thecoded video information in the most efficient manner possible. NAL formats the VCLdata and organizes it in elements with the appropriate headers for transport or storage ona wide variety of technologies.
Regarding error robustness, H.264 includes several advanced features that are closelyrelated to the concept of NAL [31]. The key syntax elements of the H.264 structure areflexible-sized slices. Each slice is conveyed in a single logical data packet (called NALUnit or NALU). This flexibility allows for the efficient adaptation of the coded streamto the particular transport technology. Other features include the concepts of FlexibleMacroblock Ordering (FMO) and Data Partitioning (DP) [33].
2.2 QoS-Aware Video Streaming
The term QoS-aware video streaming refers in general to any streaming architecture inwhich video data packets receive a differential treatment from the network, according tothe relative importance of the coded-video information carried by those packets. The ideais that the underlying IP QoS mechanisms can be leveraged to offer a “better” treatment(for instance, in terms of packet loss rate) to packets that have been “marked” by the sourceapplication as containing data which are the most important for decoding purposes. Inwhat follows we will present a QoS-aware H.264 streaming technique based on a particularQoS architecture, the DiffServ architecture.
2.2.1 DiffServ Architecture
The IETF (Internet Engineering Task Force) has developed some standards and technolo-gies in order to enable Quality of Service (QoS) support in IP networks. The most widelyaccepted among them is the Differentiated Services architecture (DiffServ) [34]. In Diff-Serv, user traffic is separated into different Classes of Service based on their individualrequirements. At the edge of the network, each packet is marked according to the treat-ment that it would like to receive inside the network. Packet marking may be done byedge routers, based on rate-metering or flow identification mechanisms, and also by thesource application in order to request a differentiated (enhanced) treatment for some ofits data [35]. The mark or tag is a coded value in the DiffServ Code Point (DSCP) field
8
Drop Probability
maxP
maxP
maxP
Red
Green
Yellow
1
maxth
minth
maxth
minth
maxthminthRedRed Yellow
Yellow Green
GreenAverage Queue
Size
1
1
0
0
0avg
avg
avg
Red + Yellow + Green
Yellow + Green
Green
Figure 2: RIO with “staggered” discard probability functions.
of the IP header. Packets with the same DSCP value belong to the same class and willreceive the same treatment by core routers inside the network. The different treatmentsa particular router can implement are called Per-Hop Behaviors (PHB).
One of the standardized PHB is Assured Forwarding (AF) [36]. The AF PHB allowsa network provider supporting DiffServ to offer different levels of forwarding assurances,for IP packets accomplishing a target throughput for each network aggregate. It providesfour AF forwarding classes with three dropping priorities each that define the relativeimportance inside an AF class. These drop priorities are usually identified with colors:green for the lowest drop precedence (i.e., the highest forwarding priority), yellow for themiddle drop precedence and red for the highest one.
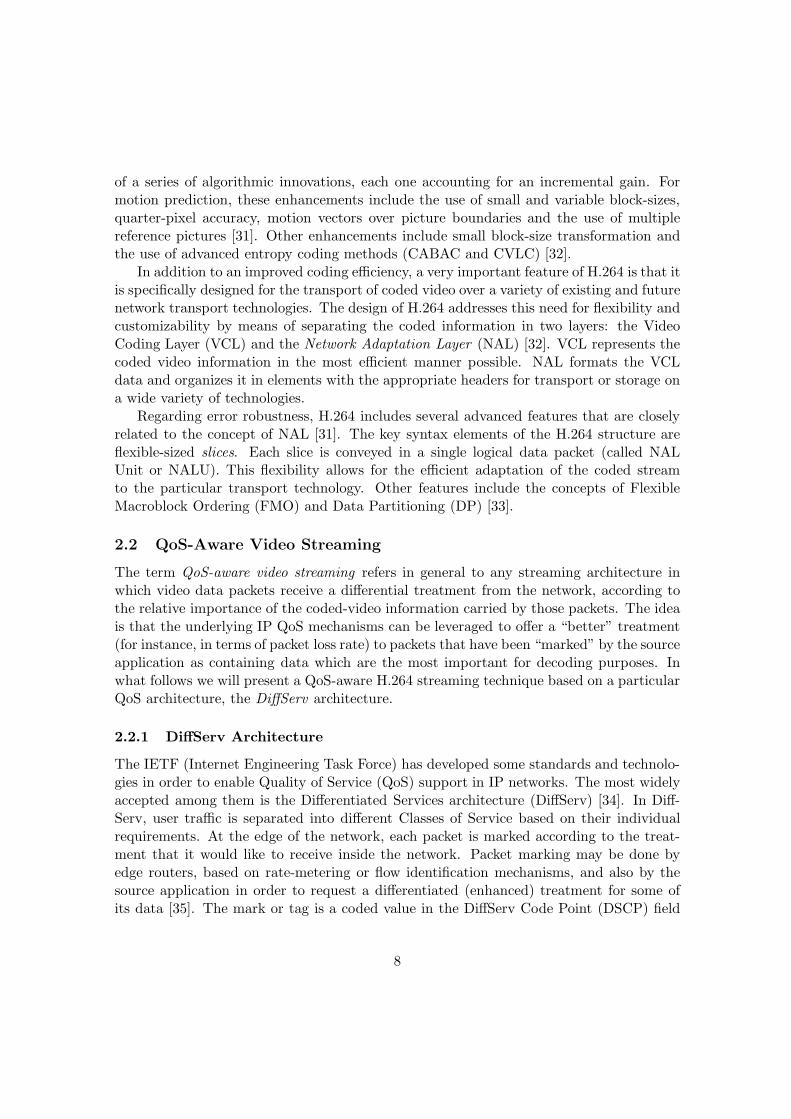
The basic mechanism used in setting up the AF PHB in routers is an active queuemanagement (AQM) algorithm that implements differential packet dropping, taking intoaccount the forwarding priorities of packets. RIO (RED with In and Out) [37] is themost common queue management mechanism suitable for AF. RIO is derived from thewell-known RED algorithm [38], which aims at avoiding congestion by controlling theaverage queue size and comparing it against two thresholds, minth and maxth; insidethis “congestion-avoidance” interval, packets are discarded with a probability that growslinearly with the average queue size. RIO can be regarded as a set of RED mechanismsrunning in parallel, where each instance of RED is associated to a given drop precedence.For a given precedence i, the corresponding RED instance monitors the average size of a“virtual queue” holding only packets with drop precedence ≥ i. Several variants of RIOexist, of which Fig. 2 shows the “staggered thresholds” model [39]. It can be seen thatpackets of lower priority are more likely to be discarded as compared to higher prioritypackets. Moreover, incoming higher priority packets are only dropped after discarding allthe lower priority packets when queue length starts to increase, i.e., during congestion.
9
2.2.2 DiffServ-Aware Streaming of H.264 video
Video codecs perform compression by removing redundant information from the originalsignal both spatially (within a single frame) and temporally (between consecutive frames).This way, some frames are coded very much like still images and taken as reference forsubsequent or previous frames. If a reference frame is lost, the effect on visual quality islarge, because a whole group of derived frames can not be decoded correctly without thereference information. Thus, a way of realizing QoS-aware streaming consists of mappingthe relative loss relevance (or semantics) of the video elements to the different loss prioritiesin a DiffServ AF network. For example, legacy codecs like MPEG-2 or MPEG-4 definea hierarchy with three types of frames, ordered by their loss effect on visual quality: I(reference), P and B. If the packets that transport I frames are marked with the highestAF priority, they will be the last to be discarded under congestion. Thus, for an equivalentloss rate, this approach should offer a better visual quality than Best Effort.
This type of DiffServ-aware mapping was proposed and evaluated for H.264 streamingin [40]. The authors describe different AF-aware coding and marking strategies basedon the network adaptation and error resilience features of H.264. The simplest strategyconsists of adapting the video slice size to the network packet size and mark packets con-taining I, P and B slices as high, middle and low priority, respectively, within a single AFclass. A tool for objective video quality assessment was used for performance evaluation,and the results show that DiffServ-aware streaming yields better quality than Best-Effortunder congestion (improvements of up to 30% were reported in [40]).
3 High Speed Downlink Packet Access (HSDPA)
HSDPA is an enhancement of UMTS that has been designed to meet the increasing de-mands of data and multimedia services. It provides many improvements as compared tothe Release’99 version of UMTS. Higher data rates and lower delays are achieved usingfast and channel-adaptive schemes like Adaptive Modulation and Coding (AMC), fastHybrid-ARQ (HARQ) and fast scheduling based upon a very short time interval of 2 ms.This section presents a brief overview of the main features of HSDPA; for a more thoroughpresentation, see for instance [2–5].
A new transport channel called High Speed Downlink Shared Channel (HS-DSCH)has been introduced for HSDPA. HS-DSCH is supported by an auxiliary channel calledHigh Speed Shared Control Channel (HS-SCCH). The goal of the latter is to allow for fastmonitoring of the radio channel conditions of all users: every 2 ms, a UE can send to thebase station a Channel Quality Indicator (CQI) over this control channel. This feedbackmakes it possible to optimize the transmission by means of channel-adaptive schemes.Thus, the CQI is used by AMC to adapt the coding rate, modulation scheme and numberof codes employed, so that users having good channel conditions may be provided withvery high data rates. Previously, in UMTS Release’99 systems, a power control mechanismwas used in the dedicated channels to counter channel fading; however, power control finds
10
-20-15-10
-5 0 5
10
0 10 20 30 40 50 60 70
Rec
eive
d P
ower
(dB
)
Time (s)
(a) 50m
-20-15-10
-5 0 5
10
0 10 20 30 40 50 60 70
Rec
eive
d P
ower
(dB
)
Time (s)
(b) 200m
-20-15-10
-5 0 5
10
0 10 20 30 40 50 60 70
Rec
eive
d P
ower
(dB
)
Time (s)
(c) 350m
-20-15-10
-5 0 5
10
0 10 20 30 40 50 60 70
Rec
eive
d P
ower
(dB
)
Time (s)
(d) 500m
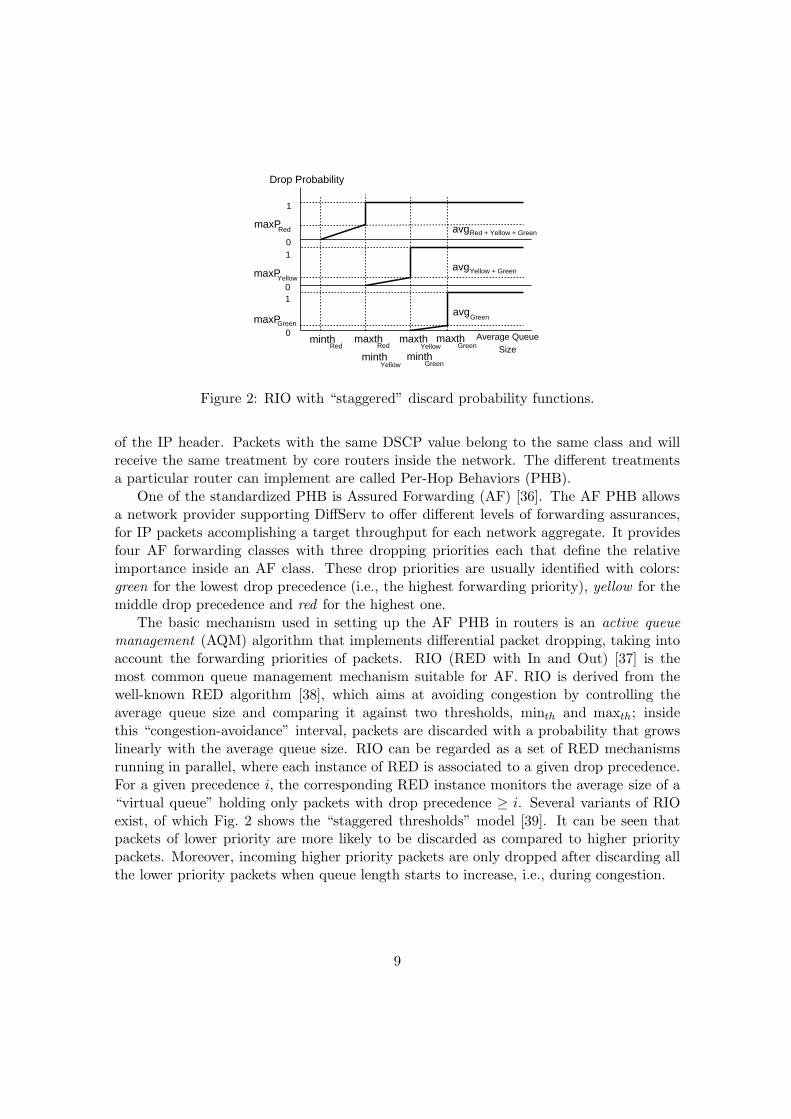
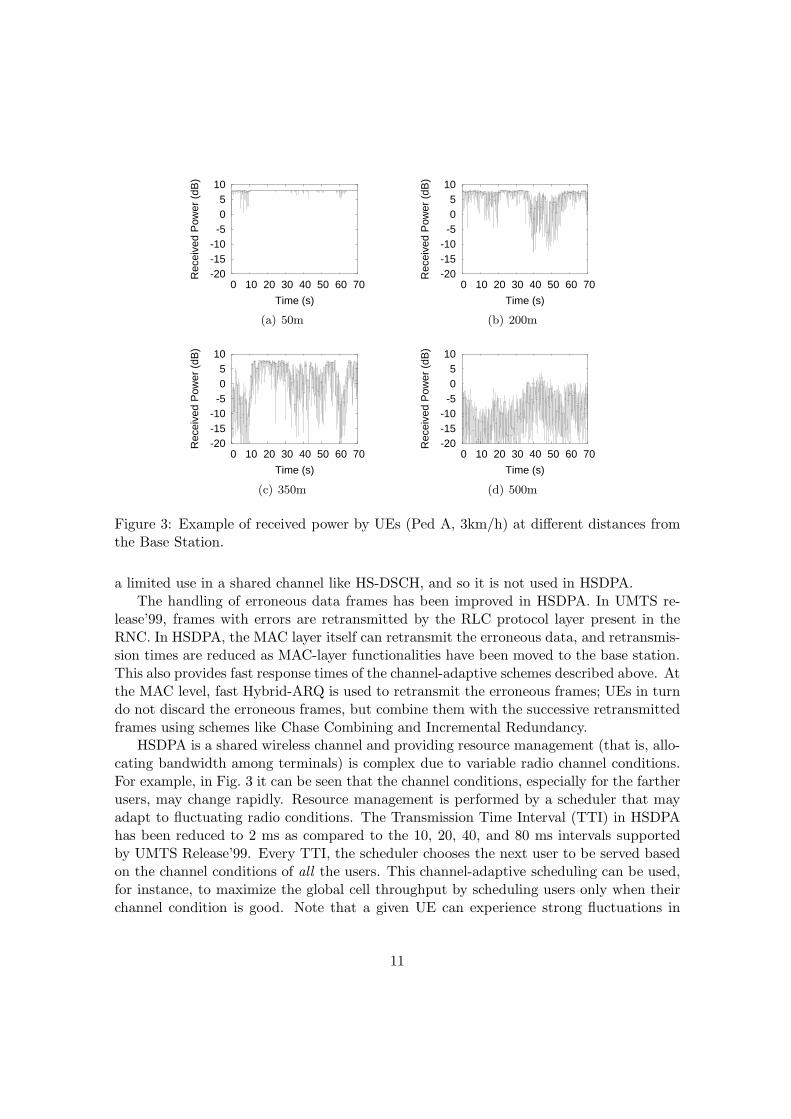
Figure 3: Example of received power by UEs (Ped A, 3km/h) at different distances fromthe Base Station.
a limited use in a shared channel like HS-DSCH, and so it is not used in HSDPA.The handling of erroneous data frames has been improved in HSDPA. In UMTS re-
lease’99, frames with errors are retransmitted by the RLC protocol layer present in theRNC. In HSDPA, the MAC layer itself can retransmit the erroneous data, and retransmis-sion times are reduced as MAC-layer functionalities have been moved to the base station.This also provides fast response times of the channel-adaptive schemes described above. Atthe MAC level, fast Hybrid-ARQ is used to retransmit the erroneous frames; UEs in turndo not discard the erroneous frames, but combine them with the successive retransmittedframes using schemes like Chase Combining and Incremental Redundancy.
HSDPA is a shared wireless channel and providing resource management (that is, allo-cating bandwidth among terminals) is complex due to variable radio channel conditions.For example, in Fig. 3 it can be seen that the channel conditions, especially for the fartherusers, may change rapidly. Resource management is performed by a scheduler that mayadapt to fluctuating radio conditions. The Transmission Time Interval (TTI) in HSDPAhas been reduced to 2 ms as compared to the 10, 20, 40, and 80 ms intervals supportedby UMTS Release’99. Every TTI, the scheduler chooses the next user to be served basedon the channel conditions of all the users. This channel-adaptive scheduling can be used,for instance, to maximize the global cell throughput by scheduling users only when theirchannel condition is good. Note that a given UE can experience strong fluctuations in
11
bandwidth over time, due to such channel-dependent scheduling policies.
3.1 Scheduling in HSDPA
The HSDPA scheduler is the key to resource management in the UTRAN downlink, be-cause it decides which user is to be scheduled at each time slot. In general, the schedulingdecision does not only take into account the channel conditions: additional factors likefairness between users, cell throughput or quality-of-service (QoS) parameters are consid-ered in the scheduling mechanism as well. The choice of a scheduler usually involves sometrade-offs between these factors.
Numerous MAC-layer schedulers have been proposed and studied in the literature.In the remainder of this paper we are going to focus only on the following four types ofschedulers:
• Round-robin (RR) scheduling.
• Maximum C/I (CI) scheduling.
• Proportionally fair (PF) scheduling.
• Rate-Guarantee (RG) scheduling.
We do not claim that this list is exhaustive, however, we believe that it covers rea-sonably well the different families of schedulers that have been proposed for HSDPA, andthat they are representative of different design trade-offs and constraints.
3.1.1 Round-Robin Scheduling
The RR scheduler, which is probably the simplest one in terms of implementation, givesthe time slot to users in a round-robin manner. Note that RR is fair with respect tosystem resources (i.e., time slots), but in general the capacity is not shared equally amongthe UEs, as each one may have different channel conditions. Moreover, this policy is notoptimal with respect to maximizing the global throughput.
3.1.2 Maximum C/I Scheduling
Maximum C/I (CI) scheduling2 gives the channel to the user having the best channelconditions at each given time slot. If Ri(t) is the instantaneous data rate experienced byuser i at time t, then the CI scheduler assigns the slot at time t to the user j having themaximum value of the index:
pj = Rj(t) (1)
2C/I denotes the signal-to-interference ratio that is used to estimate the optimal value of Ri(t), with agiven Block Error Rate target (BLERtarget).
12
i.e., it gives the channel to the user able to achieve the highest instantaneous rate.The CI scheduler provides the highest cell throughput as it always serves the users that
can support the highest data rates. On the other hand, this scheme has the disadvantageof distributing the resources in a very unfair way. In a typical scenario, the users closest tothe base station will get all the bandwidth, whereas the users farther away will be starved.
3.1.3 Proportionally Fair Scheduling
The Proportionally Fair (PF) scheduling algorithm [12, 14] assigns the slot at time t tothe user i having the maximum relative index:
pi =Ri(t)λi(t)
(2)
where Ri(t) is the instantaneous data rate experienced by user i and λi(t) is the averagethroughput of user i, which is calculated as follows:
λi(t) =(
1 − 1τ
)· λi(t − ∆t) +
1τ· Ri(t) (3)
with τ > 1 and ∆t equal to the length of the TTI.The PF scheduler offers a good trade-off between cell throughput and fairness, as it
both gives the channel to the user having “relatively good” channel conditions and resultsin a fair distribution of resources.
This scheduler provides the so-called proportional fairness criterion defined in [41].This criterion says that a set of user throughputs {λi} is proportionally fair if it is feasibleand, if for any other feasible vector of throughputs {λ∗
i } the aggregate of proportionalchanges is zero or negative: ∑
i
λ∗i − λi
λi≤ 0 (4)
3.1.4 Rate-Guarantee Scheduling
QoS guarantees will be required by users of services like video streaming that have re-quirements in terms of minimum bit rate and maximum packet delay. User satisfaction isthe main factor that should be considered. Satisfaction criteria are different for differentservices, each having their own QoS requirements. Thus, resource management should beaimed at fulfilling these QoS requirements instead of only providing fairness.
QoS classes and parameters have already been defined by 3GPP standards. Thesestandards do not define the scheduler implementation details, and they provide flexibilityto the system implementors to choose their own scheduler in order to map these QoSclasses and parameters.
13
Several schedulers that can offer QoS assurances in HSDPA have been proposed inthe literature. Pedersen et al. [27] discuss different options for providing QoS using QoS-aware schedulers like those presented in [20, 22]. Most of these schedulers take the slotassignment decision based on an index of the form:
pi =Ri(t)λi(t)
Bi(t) (5)
where Bi
(t), called a barrier function, is used to increase or decrease the priority of user
i.In [22] it was shown that, given a user utility U(λ), it is possible to design a scheduler
that will pick the user j such that:
j = arg maxi
{Ri(t) · U ′i (λi(t))} (6)
Note that, in the above formulation, the corresponding utility functions for RR, CIand PF scheduling are U(λ) = 1, U(λ) = λ and U(λ) = log λ, respectively.
Hosein [22] proposed a utility function resulting in a scheduler with a barrier functionBi(t):
Bi(t) = 1 + α exp {−β · (λi(t) − λ(i)min)} (7)
with α, β, which corresponds to the case where a minimum throughput λ(i)min is required
by a user i. Equation (3) is used to estimate λi(t). Remark that for best-effort users (i.e.,users not requiring any guarantees) the barrier function becomes Bi(t) = 1 + α, insteadof taking λ
(i)min = 0 [23].
In this paper, we will refer to the scheduler described by (5)-(7) as a Rate-Guarantee(GR) scheduler.
3.2 QoS-aware IP Queue Management in the UTRAN
The use of a QoS-aware video streaming technique, as the one discussed in Section 2.2.2,needs support from the underlying IP network. In particular, it is necessary that thenetwork support some DiffServ-like functionality, in the form of a QoS-aware active queuemanagement mechanism like the one used in the AF per-hop behavior (section 2.2.1):QoS-aware marking by the video server can then be combined with an AQM algorithmin network nodes, in order to prioritize the important data and drop the least importantdata during congestion.
In the UTRAN, IP packets are queued at the Radio Network Controller (RNC) beforebeing fragmented and sent to the MAC layer. The RNC keeps per-user packet queues,in order to optimize the channel adaptation as each user has different channel conditions.The use of a flow control mechanism, between the MAC layer (at the base station) andthe RNC, ensures that no loss occurs in the MAC queues due to congestion or bandwidthdrops. This makes the (IP) queues at the RNC the bottleneck in our configuration, since
14
IP packets are dropped if the RNC queue limit is reached. Therefore, for the purposesof the QoS-aware video streaming architecture we assume that RNC buffers implementa QoS-aware AQM scheme; in particular, the RIO algorithm is employed for differentialpacket dropping.
4 Estimation of Subjective Video Quality
To evaluate the perceived quality we use the PSQA tool proposed in [8, 9] for video andaudio flows respectively. The technique consists of the following procedure. We take ashort video sequence σ and we send it through a network where we can control the valuesof a vector of J parameters p = (p1, · · · , pJ) that we have selected as having the maximalimpact on the quality, as perceived by a panel of human observers. We randomly chooseM + N different combinations of the values of the J parameters that we put into twodifferent sets denoted by M and N . Each of them is called a configuration. With thekth configuration we associate the value given to sequence σk by the panel of humans,following a controlled subjective testing experiment according to some well establishednorm such as [42]. Then, we build a function Q() of the J parameters, such that for anyconfiguration p ∈ M the number Q(p) is close to the quality of σk given by the humanpanel. This is done using a specific statistical learning method described below. Afterobtaining this Q() function, we validate it by comparing its value on the configurations inthe second set N and the quality number coming from the subjective testing experiment.If these values are close enough, the tool is validated.
To build the quality function Q() we use a feed-forward Random Neural Network(RNN), that is, an open Markovian queuing network composed of J + H + 1 queues.Nodes 1 to J are input ones receiving customers from outside according to independentPoisson processes with rates ν1 to νJ . They send their customers to nodes J +1 to J +H.Customers leaving a node J + h, 1 ≤ h ≤ H, are sent to node J + H + 1 and from it allcustomers leave the network. Nodes are independent ·/M/1 queues. The service rate atnode i is µi. When leaving input node j, 1 ≤ j ≤ J , a customer can be transformed intoa “negative” one. In that case, when it arrives at a node J + h, 1 ≤ h ≤ H, it “kills”itself and it “kills” one of the customers present at the node at that point in time. Therouting is independent of everything in the network, and the probability that a customerthat leaves node j goes to node J + h as a normal (or positive) customer (respectivelyas a negative one) is fixed, and denoted here as r+
j,J+h (respectively r−j,J+h). We have∑Hh=1(r
+j,J+h + r−j,J+h) = 1. Things go the same for transfers between node J + h and the
only output node J + H + 1; here, we simply have r+J+h,J+H+1 + r−J+h,J+H+1 = 1.
The number of customers at a node behaves as the potential of a neuron, and thoseflows of negative customers as inhibiting signals since they decrease the potential of theneuron. This is what makes this tool behave as a neural network, and [8,9] and the morerecent [10] show that, for this application, it behaves better than classical tools such asstandard Neural Networks. When used as a learning tool, we must see the RNN as a
15
black-box implementing a parametric function with J input variables (the rates of theexternal arriving flows) and one output one (the load of the only output node, assumingthe network in equilibrium). In symbols, we see the load �J+H+1 of the output nodeas �J+H+1 = �J+H+1(ν1, · · · , νJ). The routing probabilities are the parameters of thefunction. Learning means finding an appropriate set of parameters, such that when theinput of the function is the configuration p, the output �J+H+1(p) is close to the quality ofa sequence having encountered a network where those selected quality-affecting parametershave the values in p. Finally, remark that the mapping p �→ Q(p) implemented in such ablack-box is a rational function, having nice mathematical properties (this is worth noting,even if we don’t exploit this in the paper). More details about the tool and the PSQAprocedure can be found in the references given above.
In the QoS-aware video streaming case, we used the following four parameters as theinputs of the quality metric tool: the loss rate of green packets, the loss rate of yellowpackets, the loss rate of red packets and the mean loss burst size of green packets. Thefirst three parameters have a clear meaning. The fourth is there because of the particularimpact on quality of the distribution of losses among green packets: it can be expected thatloss bursts of green packets (containing the most important information) should have astrong impact on perceived quality. Note that we don’t explicitly take delays into accountbecause a late packet is considered as a lost one in our framework.
After the whole PSQA process, the result is a quality function of these 4 variables:after measuring the values of these loss ratios and the average size of the burst of greenlost packets at some time t, the function provides an approximation of the instantaneousperceived quality of the video at t.
In this study the quality metric is used in the following way: the PSQA functionis called every second and the 4 parameters are computed on a time window of length5 s. After evaluating the quality at every second, the average for the whole sequence iscomputed.
5 Performance Evaluation
In what follows, we will describe a performance evaluation study done with the well-knownns-2 network simulator [11]. For the sake of clarity, presentation and discussion of resultswill be deferred to Section 6; in this section we will only explain the methodology andtools we used for this study, as well as the different simulation scenarios and parameters.
The goal of the study is to compare the performance of the four HSDPA schedulersdiscussed in Section 3.1, in terms of the subjective video quality perceived by end-users.The video is encoded by a H.264 codec whose output is a constant-rate bitstream. Weconsider two video streaming scenarios: a best-effort scenario (i.e., no QoS support at theIP layer), and a DiffServ-aware scenario implemented according to the principles describedin Sections 2.2.2 and 3.2. The resulting subjective quality is estimated thanks to the PSQAtool presented in the previous section.
16
5.1 Simulation Platform and Models
In order to simulate the UTRAN, we used the EURANE extensions [43] to ns-2. EURANEmodels the UTRAN in detail, whereas the nodes SGSN and GGSN are just used to routeIP packets from the Internet to the UTRAN and introduce some delays. In particular, inEURANE all the functions of the RLC (Radio Link Control Protocol) and MAC-hs (MACin HSDPA) layers are implemented.
The RLC layer consists of two modes of operation, Unacknowledged Mode (UM) andAcknowledged Mode (AM). There are per-user queues in the RNC and a credit-basedalgorithm, specified in [44], is used for flow control between MAC and RNC. The MAClayer implements the chosen HSDPA scheduler and other functionalities like HARQ. Theunderlying physical layer is modeled in detail, as described in [45], and this model is usedto compute a Channel Quality Indicator (CQI) which is fed back from UEs to the basestation3.
In order to be able to simulate both the four chosen schedulers and a DiffServ-awarestreaming architecture, we implemented in EURANE a DiffServ queuing behavior as de-scribed in Section 3.2, as well as the PF and RG schedulers. Remark that each IP queuein the RNC (running RIO) holds packets from a single flow.
5.2 Methodology
The evaluation study was performed as follows. A raw (YUV) video sequence is coded bya H.264 software encoder, whose output (a bitstream) is fed to a parser and packetizermodule. In order to be able to perform DiffServ-aware streaming, this parser first detectssyntax elements (NALUs) in the bitstream, then sets the appropriate DSCP values in theheader of the resulting IP packets, depending on the type of NALU carried by the packet.It is this pre-defined mapping function which implements the particular QoS markingstrategy chosen. The output of the parser is a trace file in a format readable by thesimulator.
Next, the video packet trace file is fed to the ns-2 simulator (compiled with the EU-RANE extensions). This trace file serves as a traffic generator during the simulation.A simulation script allows to define the particular scenario under consideration (networktopology, simulation parameters, and so on). When the simulation is run, an output tracefile is produced which contains delay- and loss-related information for every video packetsent by the (simulated) video server.
Finally, from the simulation output trace, relevant parameters are computed then fedto the PSQA tool which gives a quality score.
3For the benefit of the reader, a short summary of the physical layer model used in EURANE is givenin Appendix A.
17
SGSN
INTERNET
GGSN
Video and WebServers
UMTS CORE NETWORK UTRAN
RNC
BS
Video Users
TCP Users
IuPS UuIubGnGi
RTT
RTT
video
web
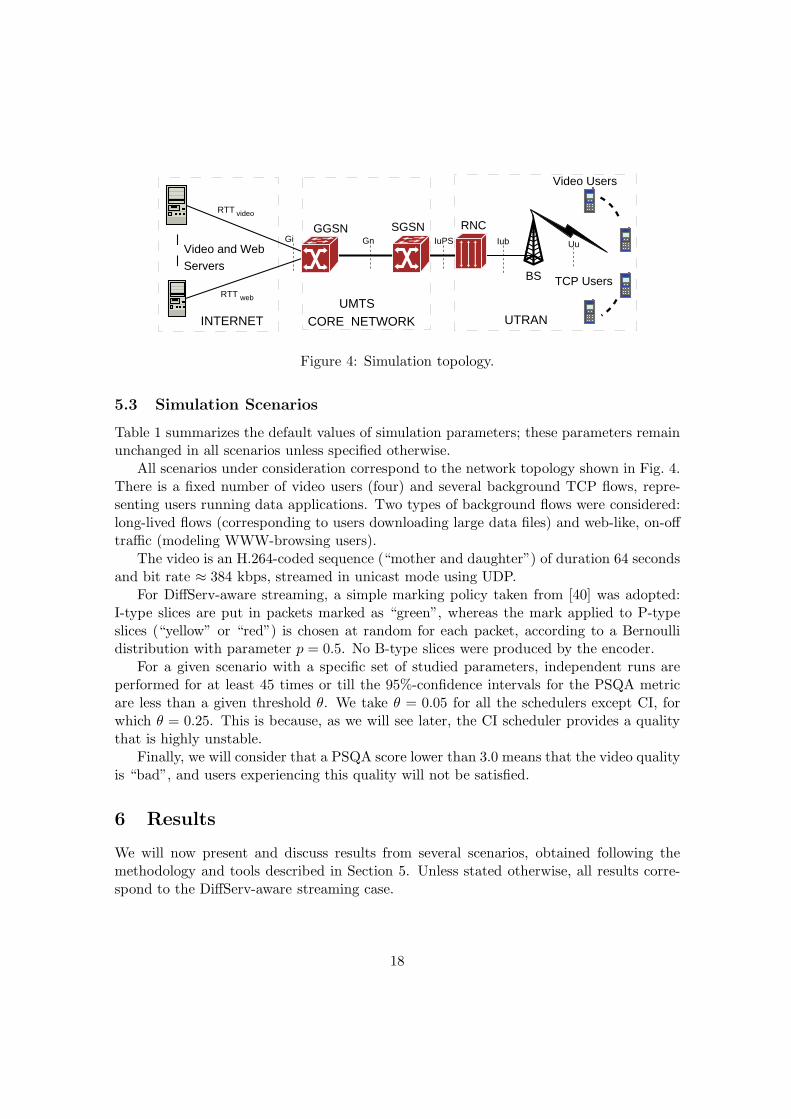
Figure 4: Simulation topology.
5.3 Simulation Scenarios
Table 1 summarizes the default values of simulation parameters; these parameters remainunchanged in all scenarios unless specified otherwise.
All scenarios under consideration correspond to the network topology shown in Fig. 4.There is a fixed number of video users (four) and several background TCP flows, repre-senting users running data applications. Two types of background flows were considered:long-lived flows (corresponding to users downloading large data files) and web-like, on-offtraffic (modeling WWW-browsing users).
The video is an H.264-coded sequence (“mother and daughter”) of duration 64 secondsand bit rate ≈ 384 kbps, streamed in unicast mode using UDP.
For DiffServ-aware streaming, a simple marking policy taken from [40] was adopted:I-type slices are put in packets marked as “green”, whereas the mark applied to P-typeslices (“yellow” or “red”) is chosen at random for each packet, according to a Bernoullidistribution with parameter p = 0.5. No B-type slices were produced by the encoder.
For a given scenario with a specific set of studied parameters, independent runs areperformed for at least 45 times or till the 95%-confidence intervals for the PSQA metricare less than a given threshold θ. We take θ = 0.05 for all the schedulers except CI, forwhich θ = 0.25. This is because, as we will see later, the CI scheduler provides a qualitythat is highly unstable.
Finally, we will consider that a PSQA score lower than 3.0 means that the video qualityis “bad”, and users experiencing this quality will not be satisfied.
6 Results
We will now present and discuss results from several scenarios, obtained following themethodology and tools described in Section 5. Unless stated otherwise, all results corre-spond to the DiffServ-aware streaming case.
18
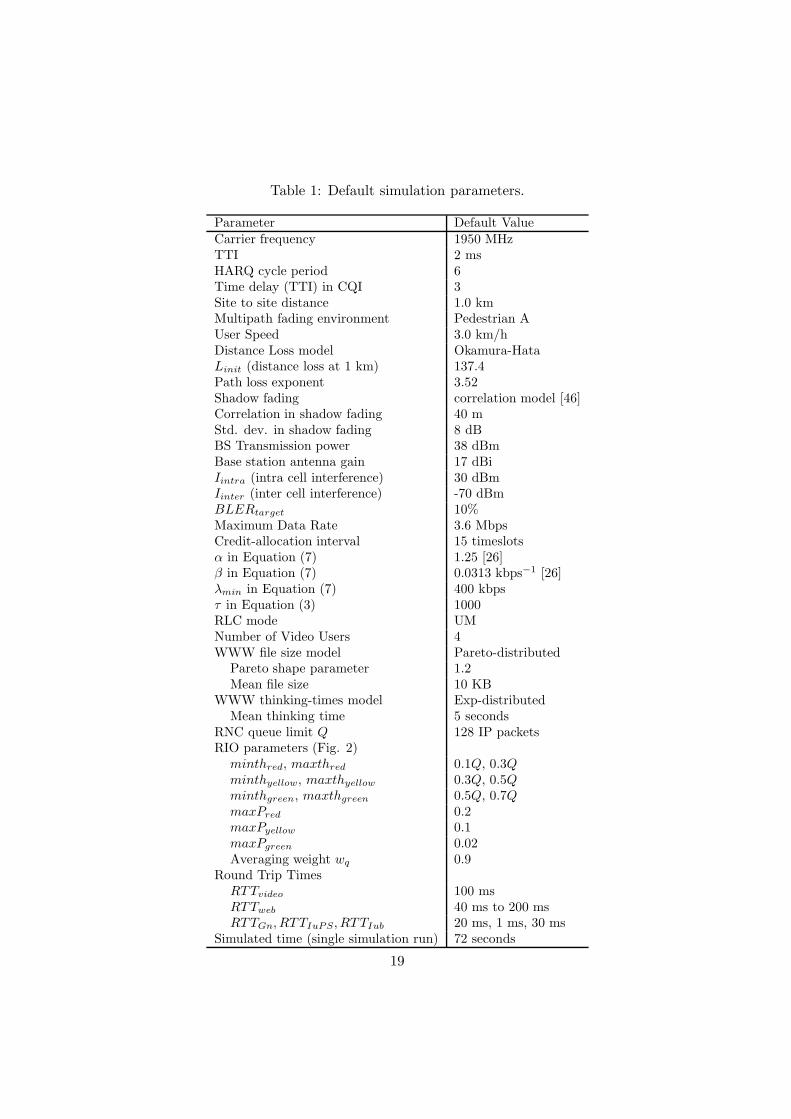
Table 1: Default simulation parameters.
Parameter Default ValueCarrier frequency 1950 MHzTTI 2 msHARQ cycle period 6Time delay (TTI) in CQI 3Site to site distance 1.0 kmMultipath fading environment Pedestrian AUser Speed 3.0 km/hDistance Loss model Okamura-HataLinit (distance loss at 1 km) 137.4Path loss exponent 3.52Shadow fading correlation model [46]Correlation in shadow fading 40 mStd. dev. in shadow fading 8 dBBS Transmission power 38 dBmBase station antenna gain 17 dBiIintra (intra cell interference) 30 dBmIinter (inter cell interference) -70 dBmBLERtarget 10%Maximum Data Rate 3.6 MbpsCredit-allocation interval 15 timeslotsα in Equation (7) 1.25 [26]β in Equation (7) 0.0313 kbps−1 [26]λmin in Equation (7) 400 kbpsτ in Equation (3) 1000RLC mode UMNumber of Video Users 4WWW file size model Pareto-distributed
Pareto shape parameter 1.2Mean file size 10 KB
WWW thinking-times model Exp-distributedMean thinking time 5 seconds
RNC queue limit Q 128 IP packetsRIO parameters (Fig. 2)
minthred, maxthred 0.1Q, 0.3Qminthyellow, maxthyellow 0.3Q, 0.5Qminthgreen, maxthgreen 0.5Q, 0.7QmaxPred 0.2maxPyellow 0.1maxPgreen 0.02Averaging weight wq 0.9
Round Trip TimesRTTvideo 100 msRTTweb 40 ms to 200 msRTTGn, RTTIuPS, RTTIub 20 ms, 1 ms, 30 ms
Simulated time (single simulation run) 72 seconds
19
0
0.2
0.4
0.6
0.8
1
0 0.5 1 1.5 2 2.5 3 3.5 4 4.5 5
Pro
babi
lity(
Sco
re >
x)
x (PSQA Score)
Rate GuaranteeCIPFRR
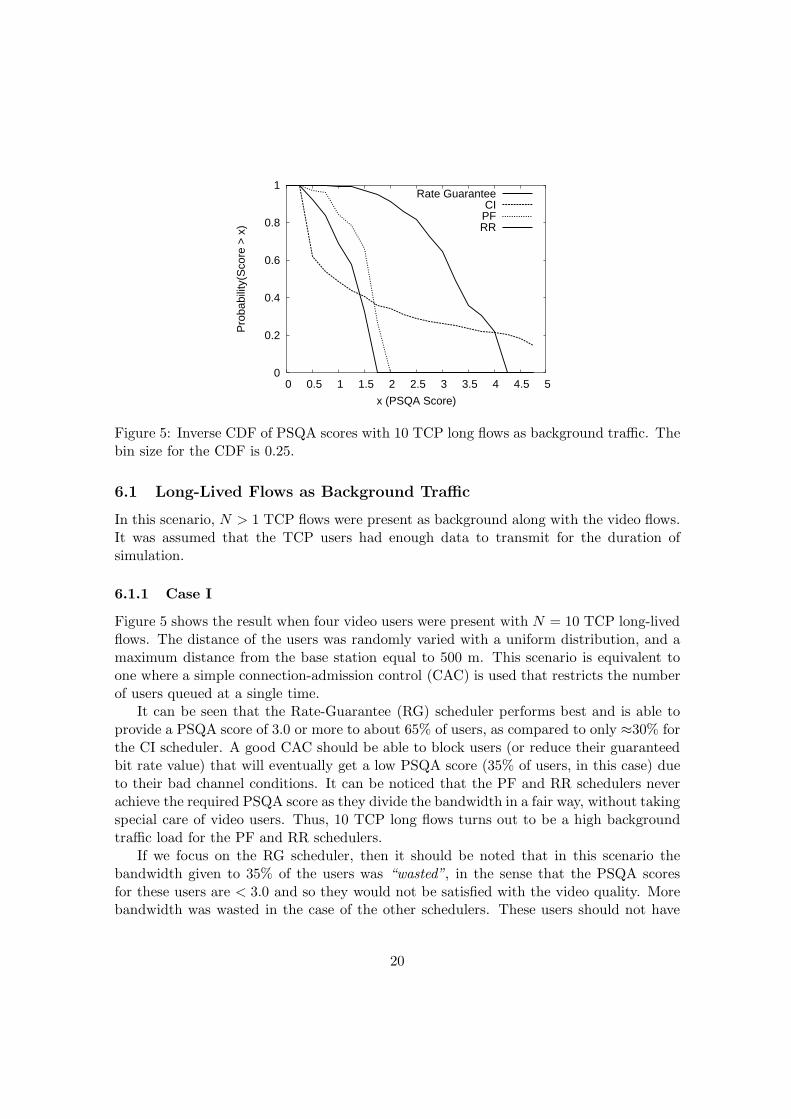
Figure 5: Inverse CDF of PSQA scores with 10 TCP long flows as background traffic. Thebin size for the CDF is 0.25.
6.1 Long-Lived Flows as Background Traffic
In this scenario, N > 1 TCP flows were present as background along with the video flows.It was assumed that the TCP users had enough data to transmit for the duration ofsimulation.
6.1.1 Case I
Figure 5 shows the result when four video users were present with N = 10 TCP long-livedflows. The distance of the users was randomly varied with a uniform distribution, and amaximum distance from the base station equal to 500 m. This scenario is equivalent toone where a simple connection-admission control (CAC) is used that restricts the numberof users queued at a single time.
It can be seen that the Rate-Guarantee (RG) scheduler performs best and is able toprovide a PSQA score of 3.0 or more to about 65% of users, as compared to only ≈30% forthe CI scheduler. A good CAC should be able to block users (or reduce their guaranteedbit rate value) that will eventually get a low PSQA score (35% of users, in this case) dueto their bad channel conditions. It can be noticed that the PF and RR schedulers neverachieve the required PSQA score as they divide the bandwidth in a fair way, without takingspecial care of video users. Thus, 10 TCP long flows turns out to be a high backgroundtraffic load for the PF and RR schedulers.
If we focus on the RG scheduler, then it should be noted that in this scenario thebandwidth given to 35% of the users was “wasted”, in the sense that the PSQA scoresfor these users are < 3.0 and so they would not be satisfied with the video quality. Morebandwidth was wasted in the case of the other schedulers. These users should not have
20
0
1
2
3
4
5
100 200 300 400 500
Ave
rage
PS
QA
Sco
re
Maximum Distance from Base station (m)
Rate GuaranteeCIPFRR
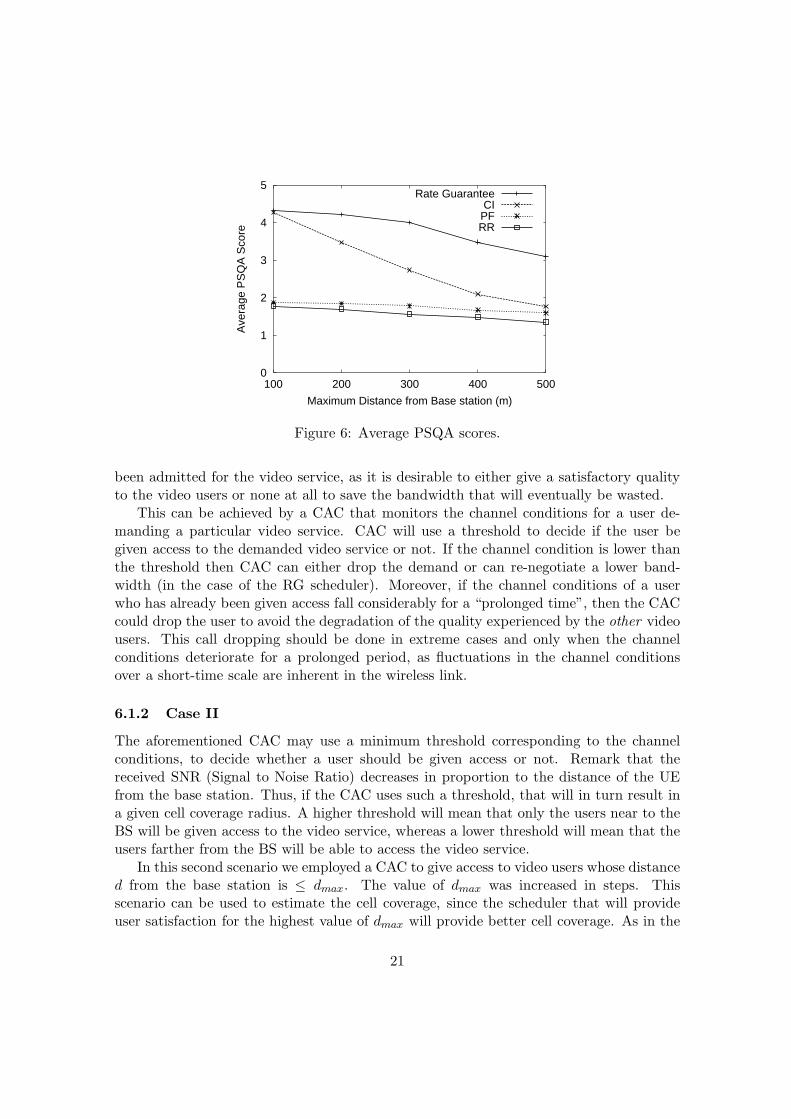
Figure 6: Average PSQA scores.
been admitted for the video service, as it is desirable to either give a satisfactory qualityto the video users or none at all to save the bandwidth that will eventually be wasted.
This can be achieved by a CAC that monitors the channel conditions for a user de-manding a particular video service. CAC will use a threshold to decide if the user begiven access to the demanded video service or not. If the channel condition is lower thanthe threshold then CAC can either drop the demand or can re-negotiate a lower band-width (in the case of the RG scheduler). Moreover, if the channel conditions of a userwho has already been given access fall considerably for a “prolonged time”, then the CACcould drop the user to avoid the degradation of the quality experienced by the other videousers. This call dropping should be done in extreme cases and only when the channelconditions deteriorate for a prolonged period, as fluctuations in the channel conditionsover a short-time scale are inherent in the wireless link.
6.1.2 Case II
The aforementioned CAC may use a minimum threshold corresponding to the channelconditions, to decide whether a user should be given access or not. Remark that thereceived SNR (Signal to Noise Ratio) decreases in proportion to the distance of the UEfrom the base station. Thus, if the CAC uses such a threshold, that will in turn result ina given cell coverage radius. A higher threshold will mean that only the users near to theBS will be given access to the video service, whereas a lower threshold will mean that theusers farther from the BS will be able to access the video service.
In this second scenario we employed a CAC to give access to video users whose distanced from the base station is ≤ dmax. The value of dmax was increased in steps. Thisscenario can be used to estimate the cell coverage, since the scheduler that will provideuser satisfaction for the highest value of dmax will provide better cell coverage. As in the
21
0
1
2
3
4
5
100 200 300 400 500
Qm
in (
PS
QA
Sco
re)
Maximum Distance from Base station (m)
Rate GuaranteeCIPFRR
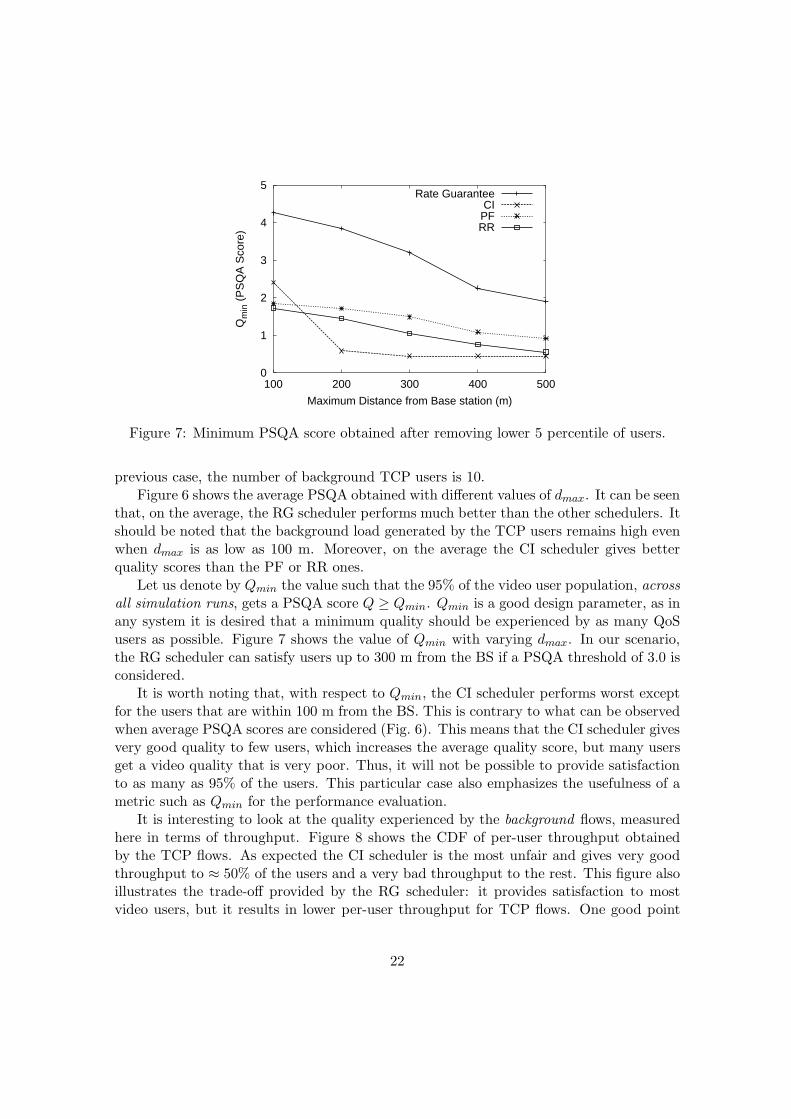
Figure 7: Minimum PSQA score obtained after removing lower 5 percentile of users.
previous case, the number of background TCP users is 10.Figure 6 shows the average PSQA obtained with different values of dmax. It can be seen
that, on the average, the RG scheduler performs much better than the other schedulers. Itshould be noted that the background load generated by the TCP users remains high evenwhen dmax is as low as 100 m. Moreover, on the average the CI scheduler gives betterquality scores than the PF or RR ones.
Let us denote by Qmin the value such that the 95% of the video user population, acrossall simulation runs, gets a PSQA score Q ≥ Qmin. Qmin is a good design parameter, as inany system it is desired that a minimum quality should be experienced by as many QoSusers as possible. Figure 7 shows the value of Qmin with varying dmax. In our scenario,the RG scheduler can satisfy users up to 300 m from the BS if a PSQA threshold of 3.0 isconsidered.
It is worth noting that, with respect to Qmin, the CI scheduler performs worst exceptfor the users that are within 100 m from the BS. This is contrary to what can be observedwhen average PSQA scores are considered (Fig. 6). This means that the CI scheduler givesvery good quality to few users, which increases the average quality score, but many usersget a video quality that is very poor. Thus, it will not be possible to provide satisfactionto as many as 95% of the users. This particular case also emphasizes the usefulness of ametric such as Qmin for the performance evaluation.
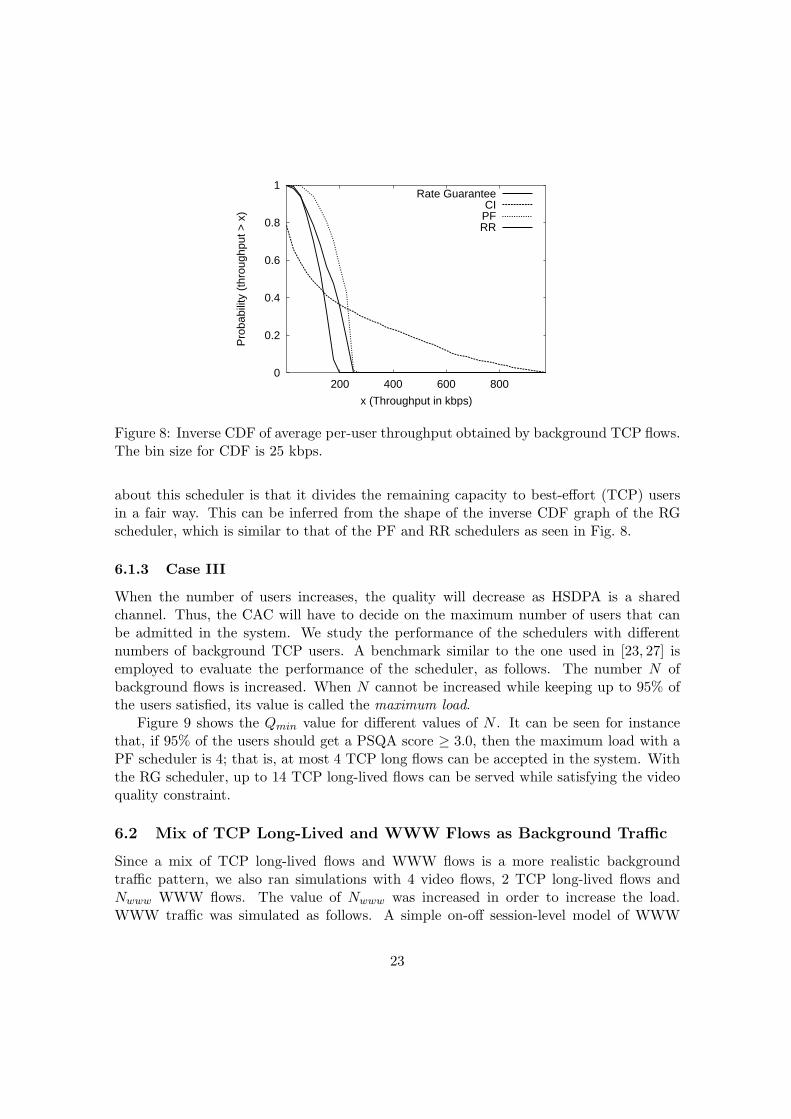
It is interesting to look at the quality experienced by the background flows, measuredhere in terms of throughput. Figure 8 shows the CDF of per-user throughput obtainedby the TCP flows. As expected the CI scheduler is the most unfair and gives very goodthroughput to ≈ 50% of the users and a very bad throughput to the rest. This figure alsoillustrates the trade-off provided by the RG scheduler: it provides satisfaction to mostvideo users, but it results in lower per-user throughput for TCP flows. One good point
22
0
0.2
0.4
0.6
0.8
1
200 400 600 800
Pro
babi
lity
(thr
ough
put >
x)
x (Throughput in kbps)
Rate GuaranteeCIPFRR
Figure 8: Inverse CDF of average per-user throughput obtained by background TCP flows.The bin size for CDF is 25 kbps.
about this scheduler is that it divides the remaining capacity to best-effort (TCP) usersin a fair way. This can be inferred from the shape of the inverse CDF graph of the RGscheduler, which is similar to that of the PF and RR schedulers as seen in Fig. 8.
6.1.3 Case III
When the number of users increases, the quality will decrease as HSDPA is a sharedchannel. Thus, the CAC will have to decide on the maximum number of users that canbe admitted in the system. We study the performance of the schedulers with differentnumbers of background TCP users. A benchmark similar to the one used in [23, 27] isemployed to evaluate the performance of the scheduler, as follows. The number N ofbackground flows is increased. When N cannot be increased while keeping up to 95% ofthe users satisfied, its value is called the maximum load.
Figure 9 shows the Qmin value for different values of N . It can be seen for instancethat, if 95% of the users should get a PSQA score ≥ 3.0, then the maximum load with aPF scheduler is 4; that is, at most 4 TCP long flows can be accepted in the system. Withthe RG scheduler, up to 14 TCP long-lived flows can be served while satisfying the videoquality constraint.
6.2 Mix of TCP Long-Lived and WWW Flows as Background Traffic
Since a mix of TCP long-lived flows and WWW flows is a more realistic backgroundtraffic pattern, we also ran simulations with 4 video flows, 2 TCP long-lived flows andNwww WWW flows. The value of Nwww was increased in order to increase the load.WWW traffic was simulated as follows. A simple on-off session-level model of WWW
23
0
0.5
1
1.5
2
2.5
3
3.5
4
0 5 10 15 20 25
Qm
in (
PS
QA
sco
re)
Number of TCP flows
Rate GuaranteeCIPFRR
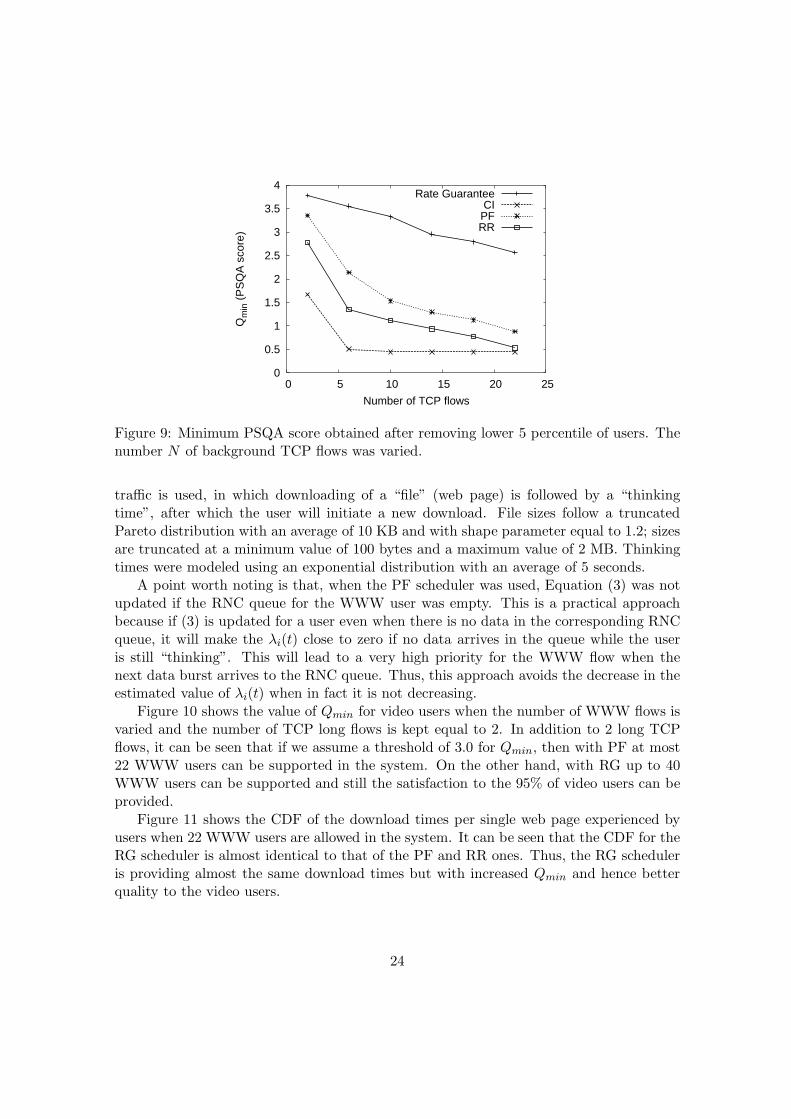
Figure 9: Minimum PSQA score obtained after removing lower 5 percentile of users. Thenumber N of background TCP flows was varied.
traffic is used, in which downloading of a “file” (web page) is followed by a “thinkingtime”, after which the user will initiate a new download. File sizes follow a truncatedPareto distribution with an average of 10 KB and with shape parameter equal to 1.2; sizesare truncated at a minimum value of 100 bytes and a maximum value of 2 MB. Thinkingtimes were modeled using an exponential distribution with an average of 5 seconds.
A point worth noting is that, when the PF scheduler was used, Equation (3) was notupdated if the RNC queue for the WWW user was empty. This is a practical approachbecause if (3) is updated for a user even when there is no data in the corresponding RNCqueue, it will make the λi(t) close to zero if no data arrives in the queue while the useris still “thinking”. This will lead to a very high priority for the WWW flow when thenext data burst arrives to the RNC queue. Thus, this approach avoids the decrease in theestimated value of λi(t) when in fact it is not decreasing.
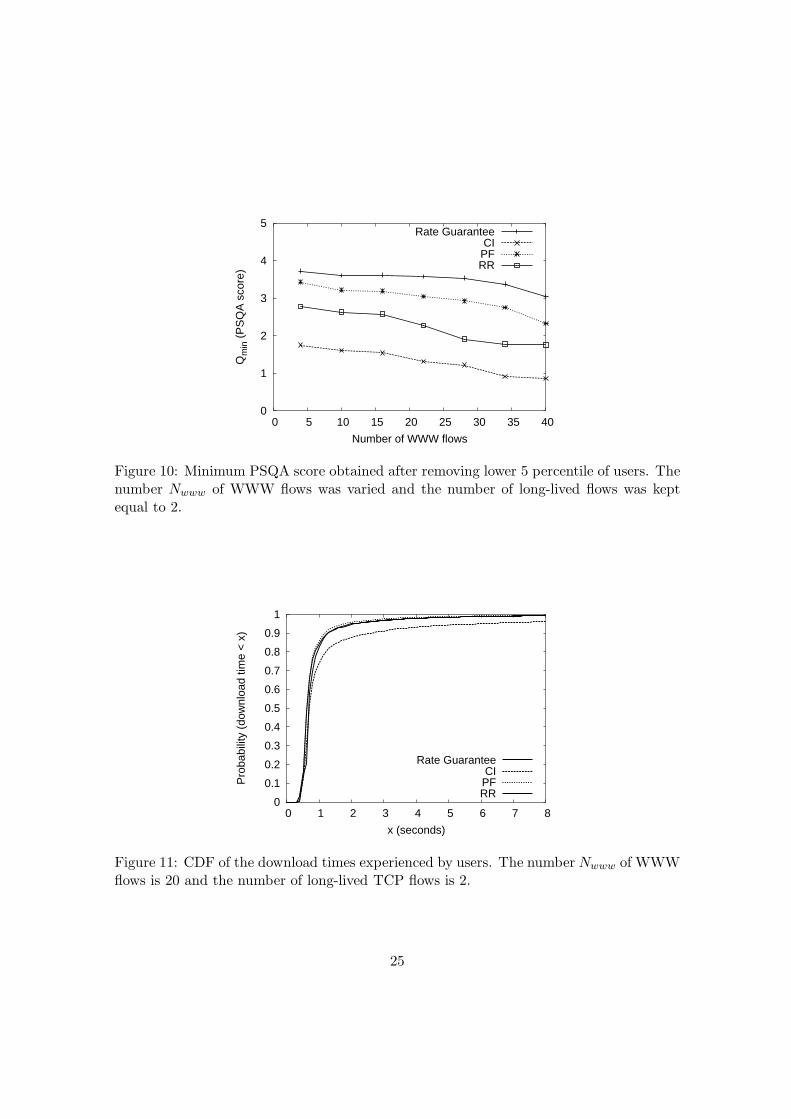
Figure 10 shows the value of Qmin for video users when the number of WWW flows isvaried and the number of TCP long flows is kept equal to 2. In addition to 2 long TCPflows, it can be seen that if we assume a threshold of 3.0 for Qmin, then with PF at most22 WWW users can be supported in the system. On the other hand, with RG up to 40WWW users can be supported and still the satisfaction to the 95% of video users can beprovided.
Figure 11 shows the CDF of the download times per single web page experienced byusers when 22 WWW users are allowed in the system. It can be seen that the CDF for theRG scheduler is almost identical to that of the PF and RR ones. Thus, the RG scheduleris providing almost the same download times but with increased Qmin and hence betterquality to the video users.
24
0
1
2
3
4
5
0 5 10 15 20 25 30 35 40
Qm
in (
PS
QA
sco
re)
Number of WWW flows
Rate GuaranteeCIPFRR
Figure 10: Minimum PSQA score obtained after removing lower 5 percentile of users. Thenumber Nwww of WWW flows was varied and the number of long-lived flows was keptequal to 2.
0
0.1
0.2
0.3
0.4
0.5
0.6
0.7
0.8
0.9
1
0 1 2 3 4 5 6 7 8
Pro
babi
lity
(dow
nloa
d tim
e <
x)
x (seconds)
Rate GuaranteeCIPFRR
Figure 11: CDF of the download times experienced by users. The number Nwww of WWWflows is 20 and the number of long-lived TCP flows is 2.
25
1
1.5
2
2.5
3
3.5
4
0 10 20 30 40 50 60 70 80
Qm
in (
PS
QA
sco
re)
Queue Limit (Packets)
RIO + Rate GuaranteeDT + Rate Guarantee
RIO + PFDT + PF
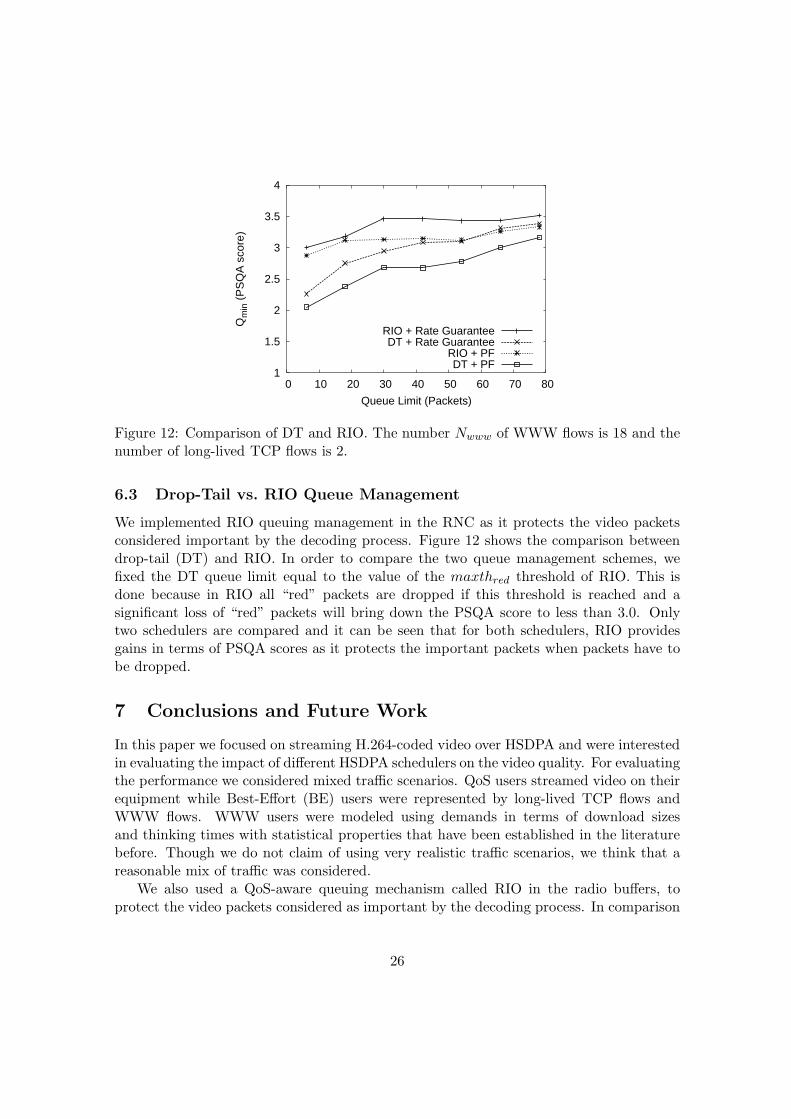
Figure 12: Comparison of DT and RIO. The number Nwww of WWW flows is 18 and thenumber of long-lived TCP flows is 2.
6.3 Drop-Tail vs. RIO Queue Management
We implemented RIO queuing management in the RNC as it protects the video packetsconsidered important by the decoding process. Figure 12 shows the comparison betweendrop-tail (DT) and RIO. In order to compare the two queue management schemes, wefixed the DT queue limit equal to the value of the maxthred threshold of RIO. This isdone because in RIO all “red” packets are dropped if this threshold is reached and asignificant loss of “red” packets will bring down the PSQA score to less than 3.0. Onlytwo schedulers are compared and it can be seen that for both schedulers, RIO providesgains in terms of PSQA scores as it protects the important packets when packets have tobe dropped.
7 Conclusions and Future Work
In this paper we focused on streaming H.264-coded video over HSDPA and were interestedin evaluating the impact of different HSDPA schedulers on the video quality. For evaluatingthe performance we considered mixed traffic scenarios. QoS users streamed video on theirequipment while Best-Effort (BE) users were represented by long-lived TCP flows andWWW flows. WWW users were modeled using demands in terms of download sizesand thinking times with statistical properties that have been established in the literaturebefore. Though we do not claim of using very realistic traffic scenarios, we think that areasonable mix of traffic was considered.
We also used a QoS-aware queuing mechanism called RIO in the radio buffers, toprotect the video packets considered as important by the decoding process. In comparison
26
to RIO, results showed that indeed DropTail (DT) queuing was degrading the qualityby dropping the important packets when the situation of ultimately having to discard apacket arrived.
Different HSDPA schedulers were compared in terms of their impact on the videoquality. Quality experienced by users was evaluated using a tool that yields good estimatesof the user-perceived quality. Our focus was on achieving a video quality higher than aminimum threshold to at least 95% of the video users. While testing the 384-kbps videostreaming service it was clear that, for our cell configuration, the full cell could not becovered and bandwidth would be wasted by users getting an unacceptable video quality.Thus, some approaches to limit access to the service were considered. First, the cellcoverage limit of video users (in terms of maximum distance between the UE and the BS)was studied. After that the maximum video user distance was fixed and the limit in termsof number of users that can be admitted in the system was studied.
Further, it should be noted that no handovers are considered as a single cell4 is analyzedin our study; taking handovers into account is left for future work. Moreover, an admissioncontrol algorithm that limits the access to the channel, based on the user’s distance fromBS, remains theoretical. A real implementation of CAC would have to monitor the channelquality for some time before taking the decision regarding the admission of the user.Another desired, but not implemented, property would be the automatic re-negotiation ofe.g. the video bit rate, if the channel conditions become bad during the connection.
In terms of the maximum number of users that can be served at one time and thecell coverage in terms of maximum distance for the video users we found that QoS awarescheduler performed better. For the low load conditions all the fair schedulers like RR andPF gave good performance but as the load was increased it was only QoS scheduler thatwas able to guarantee a minimum quality to the 95% of the video users. The tradeoff wasthe lower per-user throughput that the BE users were getting in comparison. Nevertheless,the QoS-aware scheduler was still dividing the remaining capacity among the BE users ina fair manner and was significantly better than the Max C/I scheduler. Moreover, thoughthe use of QoS-aware resulted in lower per-user throughput for long TCP flows it did notdegrade the download times of the WWW users.
References
[1] H. Holma and A. Toskala, Eds., WCDMA for UMTS: Radio Access for Third Gen-eration Mobile Communications, 3rd ed. John Wiley & Sons Ltd., 2004.
[2] ——, HSDPA/HSUPA for UMTS: High Speed Radio Access for Mobile Communica-tions. John Wiley & Sons Ltd., 2006.
[3] “3GPP TS 25.848, Physical layer aspects of UTRA High Speed Downlink PacketAccess: Iub/Iur protocol aspects, release 4,” 2001.
4Nevertheless, inter-cell interference is accounted for in the physical layer model of the simulator.
27
[4] “3GPP TS 25.308, High Speed Downlink Packet Access: Overall description, release5,” Mar. 2002.
[5] S. Parkvall, E. Englund, M. Lundvell, and J. Torsner, “Evolving 3G Mobile Systems:Broadband and Broadcast Services in WCDMA,” IEEE Communications Magazine,pp. 68–74, Feb. 2006.
[6] P. Bender, P. Black, M. Grob, R. Padovani, N. Sindhushayana, and A. Viterbi,“CDMA/HDR: A Bandwidth-Efficient High-Speed Wireless Data Service for NomadicUsers,” IEEE Communications Magazine, pp. 70–77, July 2000.
[7] R. Wu, T. Ferguson, and B. Qiu, “Digital video quality using quantitative qualitymetrics,” in 4th International Conference on Signal Processing, Beijing, China, 1998,pp. 1013–1016.
[8] S. Mohamed and G. Rubino, “A Study of Real–time Packet Video Quality UsingRandom Neural Networks,” IEEE Transactions On Circuits and Systems for VideoTechnology, vol. 12, no. 12, pp. 1071 –1083, dec 2002.
[9] G. Rubino, M. Varela, and S. Mohamed, “Performance Evaluation of Real-timeSpeech through a Packet Network: a Random Neural Networks-based Approach,”Performance Evaluation, vol. 57, no. 2, pp. 141–162, may 2004.
[10] G. Rubino, P. Tirilly, and M. Varela, “Evaluating Users’ Satisfaction in Packet Net-works Using Random Neural Networks.” in Proceedings of ICANN’06, Athens, Greece,September 2006.
[11] S. McCanne and S. Floyd, “ns Network Simulator,” http://www.isi.edu/nsnam/ns/.
[12] T. E. Kolding, “Link and system performance aspects of proportional fair schedulingin WCDMA/HSDPA,” in Proceedings of IEEE VTC 2003-Fall, vol. 3, Oct. 2003, pp.1717–1722.
[13] M. C. Chan and R. Ramjee, “TCP/IP performance over 3G wireless links with rateand delay variation,” in Proceedings of MobiCom ’02. New York, NY, USA: ACMPress, September 2002, pp. 71–82.
[14] A. Jalali, R. Padovani, and R. Pankaj, “Data throughput of CDMA-HDR a highefficiency-high data rate personal communication wireless system,” in Proceedings ofIEEE VTC 2000 Spring, vol. 3, 2000, pp. 1663–1667.
[15] S. Borst, “User-level performance of channel-aware scheduling algorithms in wirelessdata networks,” IEEE/ACM Transactions on Networking, vol. 13, no. 3, pp. 636–647,2005.
[16] T. Bonald and A. Proutiere, “Wireless Downlink Data Channels: User Performanceand Cell Dimensioning,” in Proceedings of Mobicom’03, Sept. 2003.
28
[17] S. Landstrom, L.-A. Larzon, and U. Bodin, “Congestion control in a high speed radioenvironment,” in Proceedings of the International Conference on Wireless Networks,Las Vegas, Nevada, USA, June 2004, pp. 617–623.
[18] M. Sagfors, R. Ludwig, M. Meyer, and J. Peisa, “Queue Management for TCP Trafficover 3G links,” in IEEE WCNC, Mar. 2003, pp. 1663–1668.
[19] A. Lo, G. Heijenk, and I. Niemegeers, “Evaluation of MPEG-4 Video Streaming overUMTS/WCDMA Dedicated Channels,” in Proceedings of WICON’05, July 2005.
[20] M. Andrews, K. Kumaran, K. Ramanan, A. Stolyar, P. Whiting, and R. Vijayakumar,“Providing quality of service over a shared wireless link,” IEEE CommunicationsMagazine, vol. 39, no. 2, pp. 150–154, Feb. 2001.
[21] G. Barriac and J. Holtzman, “Introducing delay sensitivity into the proportional fairalgorithm for CDMA downlink scheduling,” in IEEE Seventh International Sympo-sium on Spread Spectrum Techniques and Applications, 2002, Sept. 2002.
[22] P. Hosein, “Qos Control for WCDMA High Speed Packet Data,” in IEEE Proc In-ternational Workshop on Mobile and Wireless Network Communications, Sept. 2002,pp. 169–173.
[23] T. E. Kolding, “QoS-Aware Proportional Fair Packet Scheduling with Required Ac-tivity Detection,” in Proceedings of IEEE VTC 2006-Fall, Sept. 2006.
[24] P. Ameigeiras, “Packet Scheduling and Quality of Service in HSDPA,” Ph.D. disser-tation, Institute of Electronic Systems, Aalborg University, Denmark, Oct. 2003.
[25] G. Liebl, H. Jenkac, T. Stockhammer, C. Buchner, and A. Klien, “Radio Link BufferManagement and Scheduling for Video Streaming over Wireless Shared Channels,”in Proceedings of the 14th International Packet Video Workshop, July 2004.
[26] M. Lundevall, B. Olin, J. Olsson, N. Wiberg, S. Wanstedt, J. Eriksson, and F. Eng,“Streaming Applications over HSDPA in Mixed Service Scebarios,” in Proceedings ofIEEE VTC 2004-Fall, vol. 2, Sept. 2004, pp. 841–845.
[27] K. I. Pedersen, P. E. Mogensen, and T. E. Kolding, “QoS Considerations for HSDPAand Performance Results for Different Services,” in Proceedings of IEEE VTC 2006-Fall, Sept. 2006.
[28] “ISO/IEC 14496-10 and ITU-T Recommendation H.264, Advanced Video Coding,”2003.
[29] N. Kamaci and Y. Altunbasak, “Performance comparison of the emerging H.264 videocoding standard with the existing standards,” in Proceedings of IEEE ICME’03, July2003.
29
[30] A. Joch, F. Kossentini, and P. Nasiopoulos, “A performance analysis of the ITU-Tdraft H.26L video coding standard,” in Proceedings of the 12th International PacketVideo Workshop, Apr. 2002.
[31] I. Richardson, H.264 and MPEG-4 Video Compression: Video Coding for Next-generation Multimedia. Wiley, 2003.
[32] T. Wiegand, G. Sullivan, G. Bjontegaard, and A. Luthra, “Overview of theH.264/AVC video coding standard,” IEEE Transactions on Circuits and Systemsfor Video Technology, July 2003.
[33] S. Wenger, “H.264/AVC over IP,” IEEE Transactions on Circuits and Systems forVideo Technology, vol. 13, no. 7, pp. 645–656, July 2003.
[34] S. Blake, D. Black, M. Carlson, E. Davies, Z. Wang, and W. Weiss, “An architecturefor differentiated services,” Internet Standards Track RFC 2475, IETF, Dec. 1998.
[35] A. Ziviani, J. de Rezende, O. Duarte, and S. Fdida, “Im- proving the deliveryquality of MPEG video streams by using differentiated services,” in Procedings ofECUMN’2002, 2002, pp. 107–115.
[36] J. Heinanen, F. Baker, W. Weiss, and J. Wroclawski, “Assured Forwarding PHBGroup,” Internet Standards Track RFC 2597, IETF, June 1999.
[37] D. D. Clark and W. Fang, “Explicit allocation of best-effort packet delivery service,”IEEE/ACM Transactions on Networking, vol. 6, no. 4, pp. 362–373, 1998.
[38] S. Floyd and V. Jacobson, “Random early detection gateways for congestion avoid-ance,” IEEE/ACM Transactions on Networking, vol. 1, no. 4, pp. 397–413, Aug.1993.
[39] R. Makkar, I. Lambadaris, J. Salim, N. Seddigh, B. Nandy, and J. Babiarz, “Empir-ical study of buffer management scheme for DiffServ Assured Forwarding PHB,” inProceedings of IEEE ICCCN, 2000.
[40] J. Orozco and D. Ros, “Diffserv-Aware Streaming of H.264 video,” in Proceedings ofthe 14th International Packet Video Workshop, December 2004.
[41] F. Kelly, “Charging and rate control for elastic traffic,” European Transactions onTelecommunications, vol. 8, pp. 33–37, 1997.
[42] ITU-R Recommendation BT.500-10, “Methodology for the Subjective Assessment ofthe Quality of Television Pictures,” International Telecommunications Union (ITU),March 2000. [Online]. Available: http://www.itu.int/
[43] “EURANE,” http://www.ti-wmc.nl/eurane/.
30
[44] “3GPP TS 25.877, Technical Specification Group Radio Access Network: High SpeedDownlink Packet Access: Iub/Iur protocol aspects, release 5,” June 2002.
[45] N. Whillans, I. de Bruin, S. Oosthoek, F. Brouwer, A. Jehangir, and G. Heijenk, “Sea-corn project, deliverable D3.2v2, End-to-end network model for Enhanced UMTS,”Oct. 2003.
[46] M. Gudmundson, “Correlation model for shadow fading in mobile radio systems,”Electronics Letters, vol. 27, no. 23, pp. 2145–2146, 1991.
A Physical layer model in EURANE
The transmitted signal Tx has a constant power to which the effects of the physical layerare added. First the intra-cell interference Iintra, assumed to be a constant value, isadded. After that, the signal strength is reduced by a variable amount due to channelpropagation loss that is modeled as follows. The propagation loss L consists of threeelements: L = P + S + M , where P is the path loss, S is the shadow fading and M is theshort-term fading. The path loss is described by the Okamura-Hata model for suburbanareas: P (x) = Linit + 10 · n · log10(x), where x is the distance between UE and BS in km,Linit is the loss at 1km and n is the path loss exponent.
The shadow fading is caused by the obstacles in the propagation path between UEand BS. EURANE uses the correlation model for shadow fading from [46]. The loss dueto shadow fading is constructed as follows [45]: S(x+ δx) = aS(x)+ bσN , where δx is thedistance between two subsequent time samples and N is a random variable that satisfies thestandard normal distribution. The parameter b is taken such that the vector containingall realisations equals σ. The parameter a is determined such that the autocorrelationfunction of S satisfies: E[S(x)S(x + δx)] = aσ2.
The fast fading M model that is caused by multi-path is taken from the standard 3GPPmodels such as Pedestrian A, Vehicular A, etc. At the end, the inter-cell interference Iinter
is also added to the signal and is also assumed to be a constant value. A value of SNRis estimated from the resulting signal that is equal to: SNR = Tx − 10 · log10(10
Iintra10 +
10Iinter+L
10 ), where Tx is the transmitted code power in dBm, L in dB and interference indBm. Proper delays in the reception are also accounted.
The resulting signal is also used by the receiver to do the HARQ Chase Combining.Chase Combining is a type of soft combining that is used to combine the successive re-transmissions of the frame in case of erroneous frames. Moreover, depending on theresulting signal Rx, an ACK or NACK is generated corresponding to whether the framewas received correctly or not. In order to determine whether a frame was received correctlyor not, a random number from a uniform distribution is drawn and is mapped, using aBLER to SNR table, to a minimum value of SNR required for correct reception. Thistable corresponds to a AWGN channel. This minimum value of the SNR and the estimatedvalue of the SNR from Tx is used for all HARQ transmissions to determine if the block was
31
received correctly or not and an ACK or NACK is generated. After a maximum numberof HARQ re-transmissions, the block is discarded and, depending on the RLC mode (UMor AM), is left to the RLC to handle it.
The resulting SNR is also used by the receiver to estimate the channel quality. TheCQI value is generated, using estimated SNR value, for feedback. This CQI value isgenerated for a target Block Error Rate, BLERtarget.
32
© ENST Bretagne. 2007 Imprimé à l’Ecole nationale supérieure des Télécommunications de Bretagne – Brest
Dépôt légal : Avril 2007 ISSN : 1255-2275