Embed Size (px)
Citation preview
County of Santa ClaraFinance AgencyController-Treasurer Department
F02 022812 .
Prepared by:. Jacqueline FlippinInvestment Officer
Submitted by:. Irene LuiController-Treasurer
DATE: February 28, 2012
TO: Board of Supervisors
FROM:
Vinod K. SharmaDirector, Finance Agency
SUBJECT: County of Santa Clara Quarterly Investment Review as of December 31, 2011
RECOMMENDED ACTIONAccept and authorize filing of Detailed Investment Portfolio Listing for period endingDecember, 31, 2011.
REASONS FOR RECOMMENDATIONThe Santa Clara County Treasury Investment Portfolio Report as of December 31, 2011, issubmitted for your review and acceptance in compliance with State of California GovernmentCodes 783 and 784, Statutes of 1995 and in compliance with County policy.
CHILD IMPACTThe recommended action will have no/neutral impact on children and youth.
1
����������� ��������������������
�����������������������!��"�����#���$�������%���!�&��������'�� �����(��)�������*�+�(���'�� ��6;�<� �����=�������>?��#� %
SENIOR IMPACTThe recommended action will have no/neutral impact on seniors.
SUSTAINABILITY IMPLICATIONSThe recommended action will have no/neutral sustainability implications.
BACKGROUNDEach quarter, an investment report is submitted to the Board of Supervisors that provides amanagement summary with a clear status of the current investment portfolio, quarterlytransactions, investment philosophy, and market actions and trends. Preparation of the reportis required by both the Board's Policy Manual and the County's investment policy. Allinvestment activities during the reporting period were conducted under the guidance of theinvestment policy. The Board reviewed and approved the most recent proposed changes to thepolicy at its January 11, 2011, meeting.
Securities Lending DisclosureOn December 5, 2006, the Board of Supervisors passed a resolution amending the County'sinvestment policy to include securities lending as a permitted investment. The primaryobjective was to enhance income for the Commingled Pool through a low-risk transaction.The County's Treasury retained its custody bank, the Bank of New York Mellon, to serve asagent and to manage its securities lending program. Treasury began lending securities inOctober of 2008.
Outstanding loaned securities as of December 31, 2011, amounted to a market value of$84,254,924.43.
Securities lending is a transaction in which the County Treasury lends securities it owns to acounter-party/borrower (a financial institution) in exchange for a pledge of cash collateral.The cash collateral is held by our custodial bank and invested in money market funds to earnincremental income to offset custody banking and investment research fees. The CountyTreasury retains all ownership rights to coupon interest earned by securities while out on loanto the counter-party/borrower. The borrower is obliged to return the securities, either ondemand from the County or at the end of any agreed upon term.
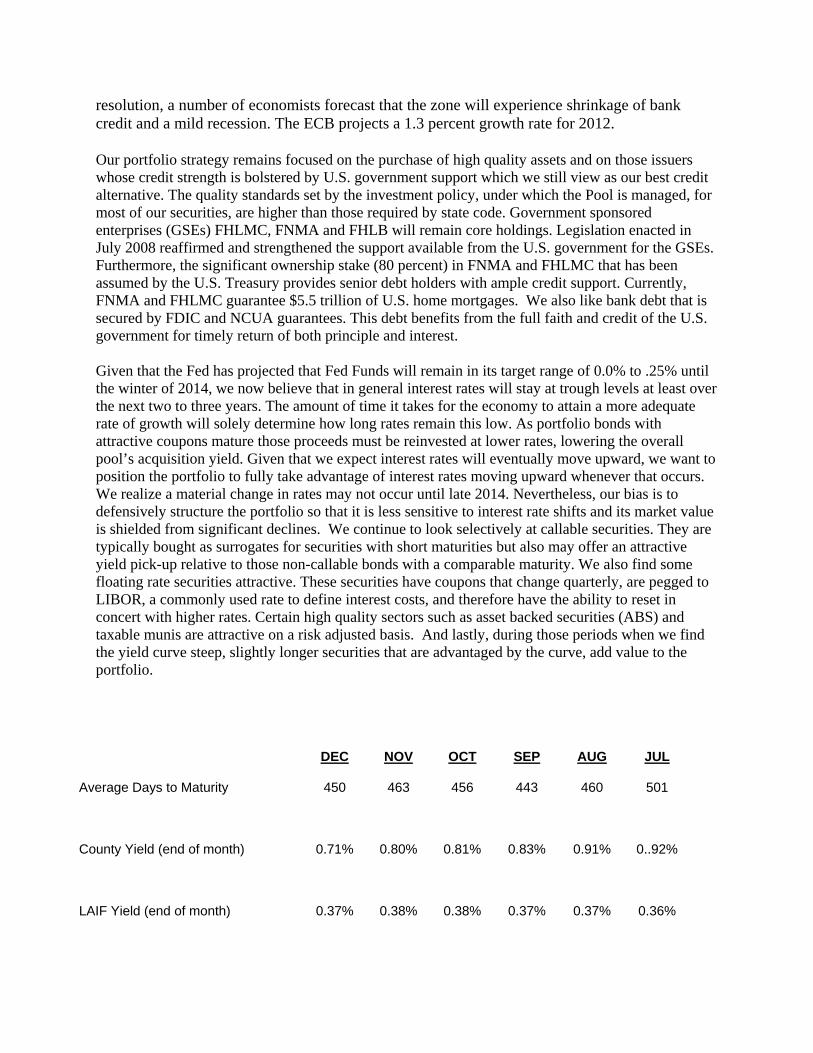
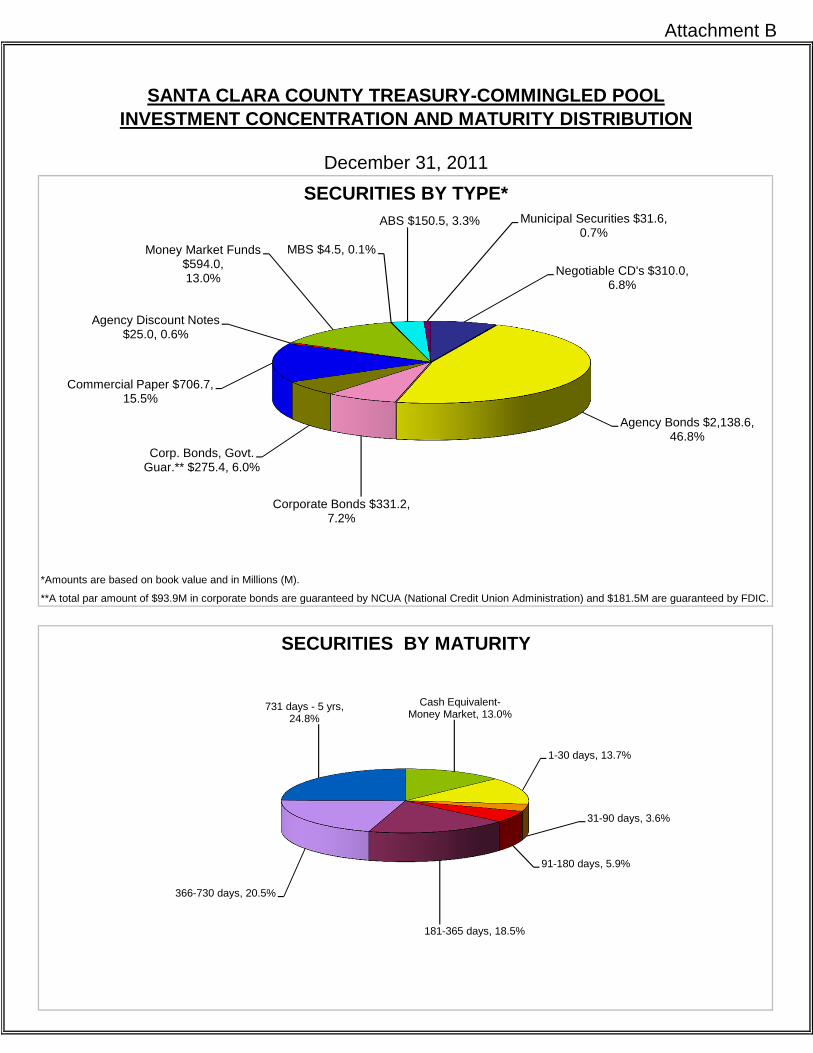
Attachment A provides a summary of market values versus costs for the Commingled Pooland segregated investments. Segregated investments were established for several purposes.
2
����������� ��������������������
�����������������������!��"�����#���$�������%���!�&��������'�� �����(��)�������*�+�(���'�� ��6;�<� �����=�������>?��#� %
One is to enhance yield where cash flow projections show the funds are not needed forimmediate use. This allows for the purchase of longer-term investments that generally providea higher yield. A second purpose of segregating funds is to establish accounts that match bondfunded construction programs by holding maturities that match draw down schedules.
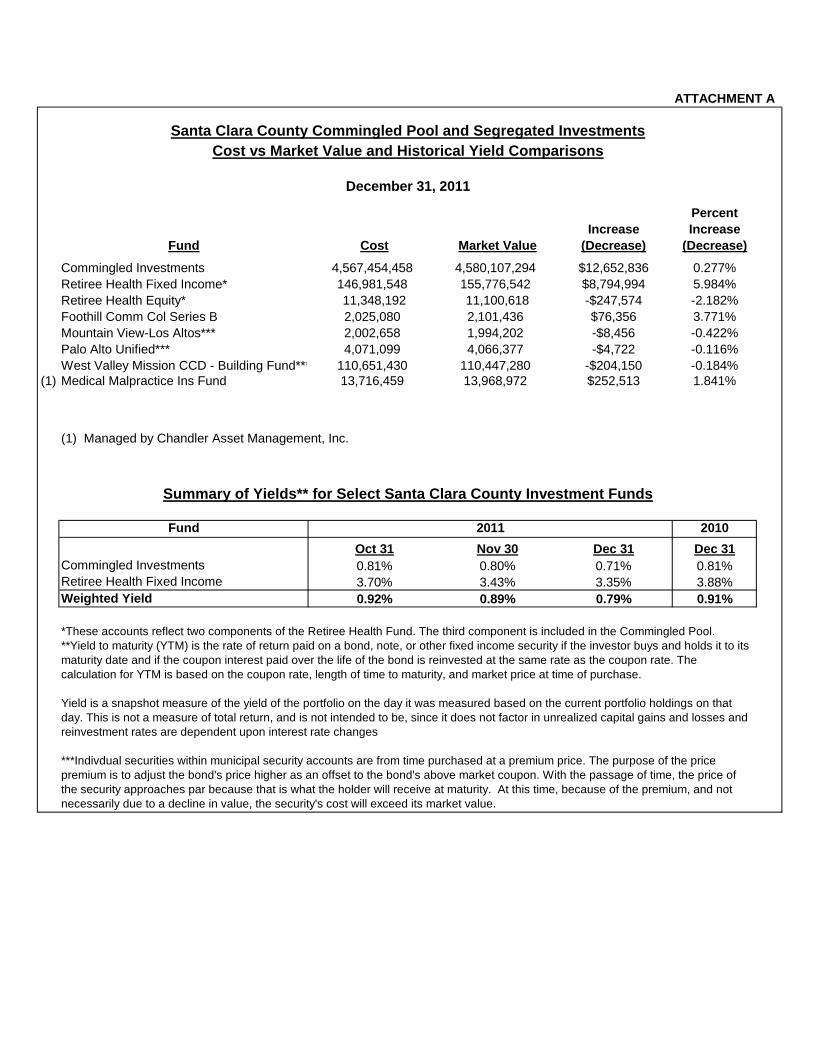
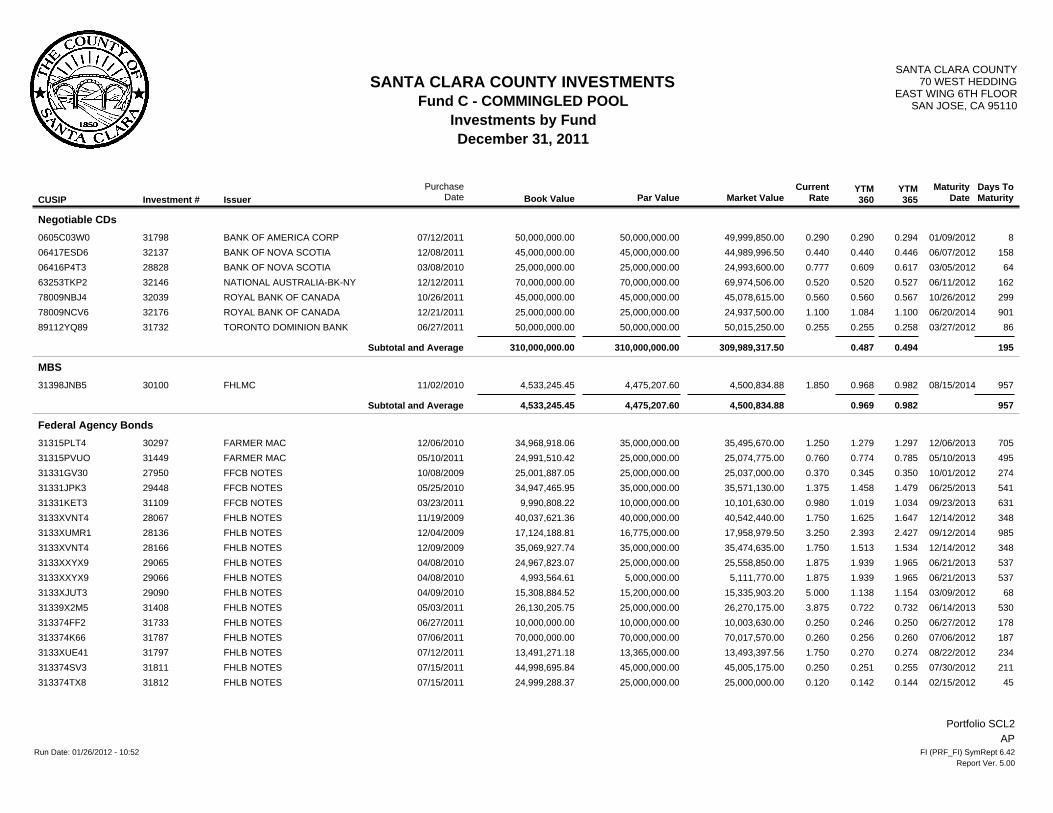
Attachment B gives a snapshot view of the types of investments and a maturity break downwithin the the Commingled Pool.
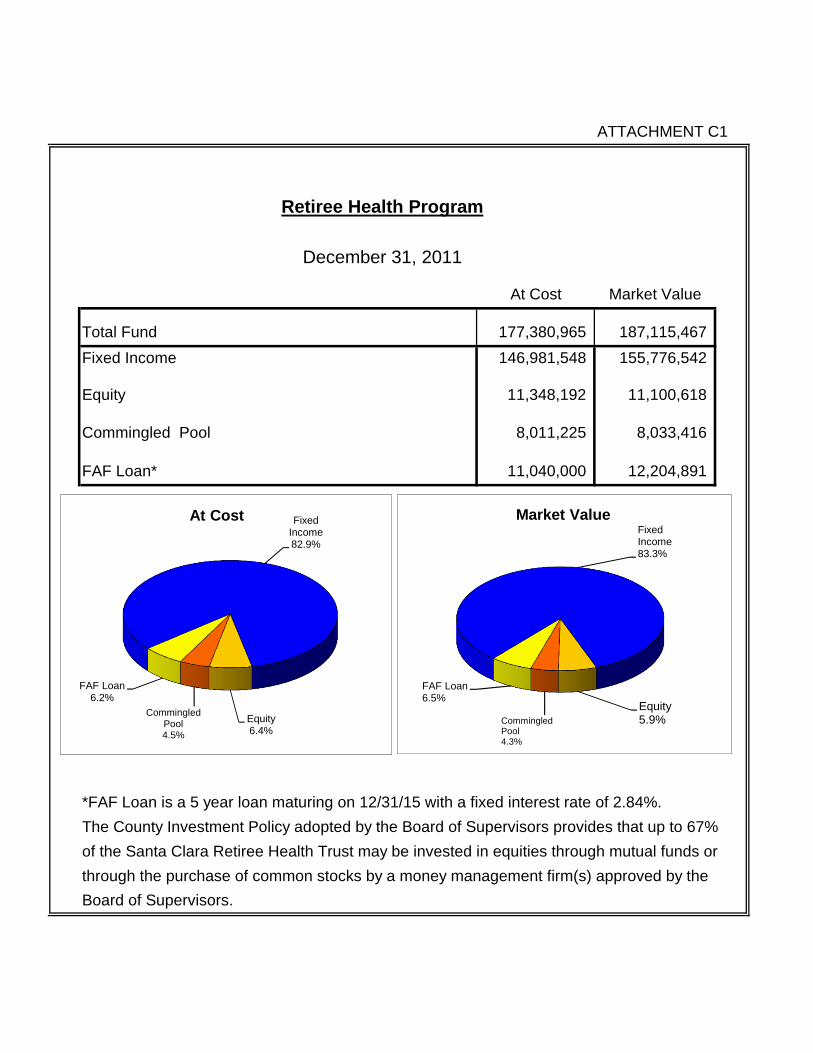
Attachments C 1 and C 2 provide asset allocation and performance data for the RetireeHealth Fund.
Attachment D is a chart that provides a one-year visual comparison of the yields of theCommingled Pool, the CA State Treasurer's investment pool (LAIF) and the two-year andsix-month Treasury notes.
The Investment Portfolio Holdings Report is a detailed investment report that lists eachinvestment managed by the County Treasury, including the respective purchase and maturitydate, par value, amortized and historical cost, present value and yield to maturity. The marketvalues of securities were taken from pricing services provided by the Bank of New YorkMellon, Bloomberg Analytics, dealer quotes and an independent pricing service.
Auditor's Review is contained in the last attachment. The investment portfolio is incompliance with the current investment policy.
A combination of securities maturing, new revenues and tax receipts will adequately cover theanticipated cash flow need for the next six months.
There were no reverse repurchase transactions in this quarter.
ATTACHMENTS
Investment Review and Strategy•
3
����������� ��������������������
�����������������������!��"�����#���$�������%���!�&��������'�� �����(��)�������*�+�(���'�� ��6;�<� �����=�������>?��#� %
Attachment A: Commingled Pool and Segregated Investments•
Attachment B: Asset Allocation and Maturity Distribution•
Attachment C1: Retiree Health Fund Detail•
Attachment C2: Retiree Health Fund Performance•
Attachment D: Performance Graph•
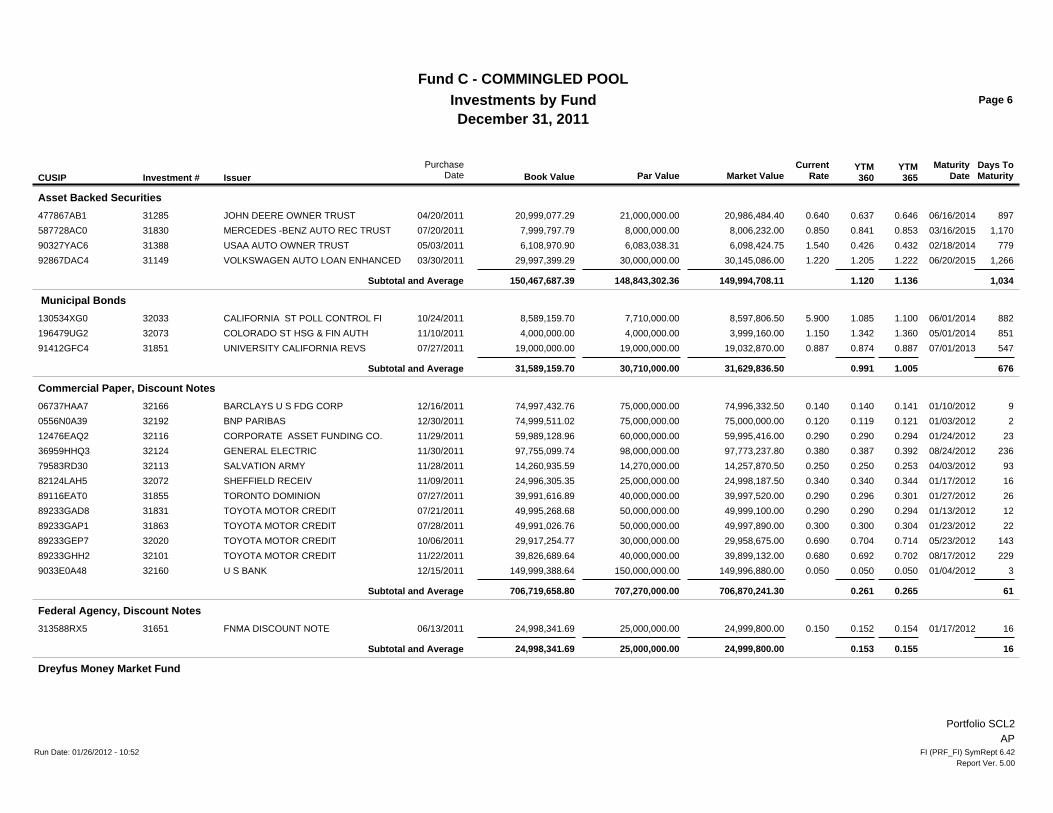
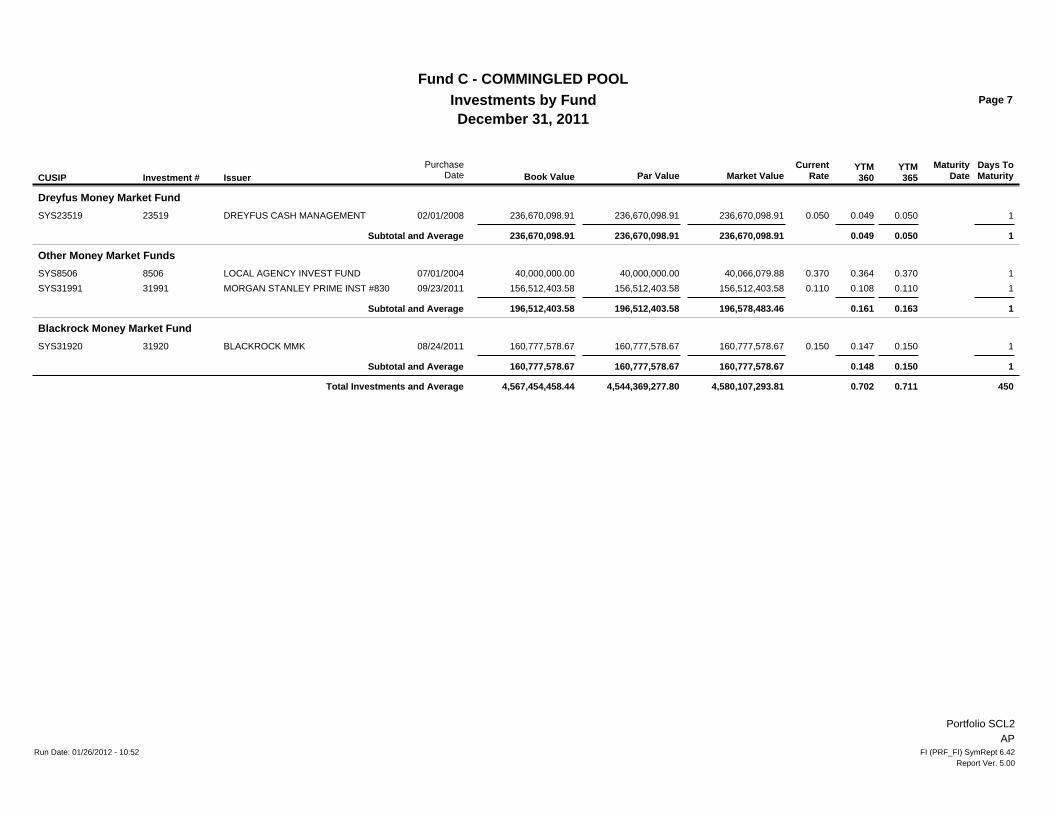
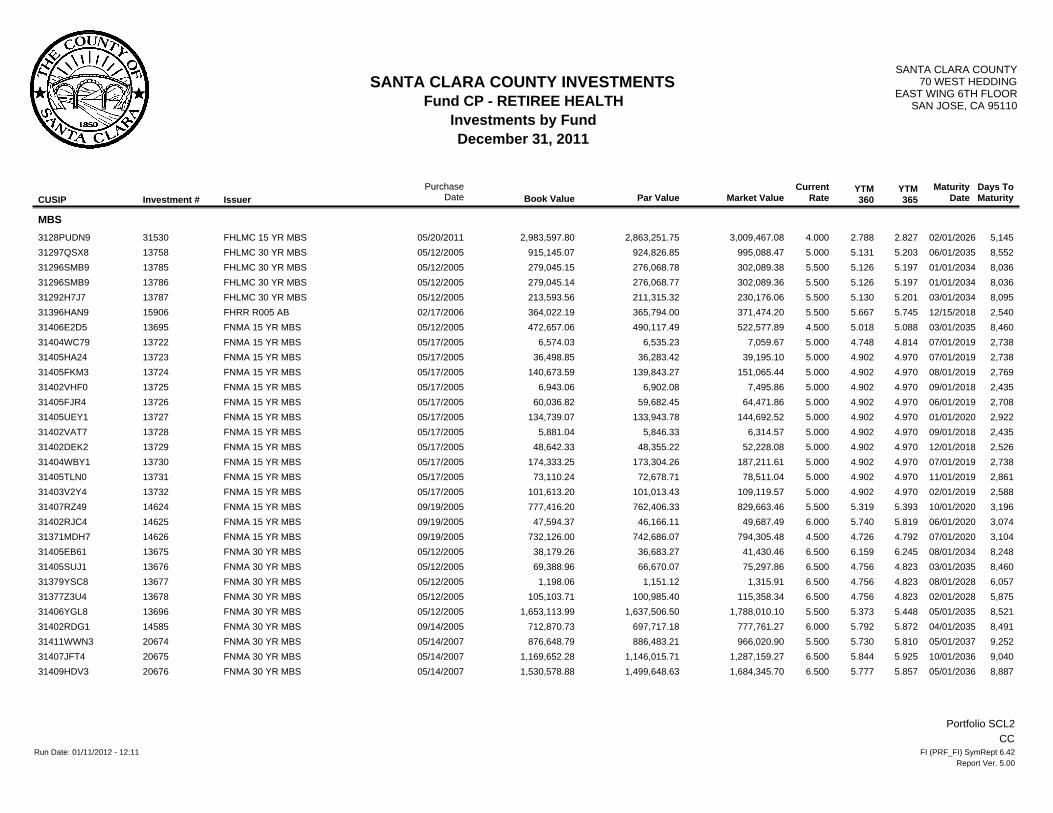
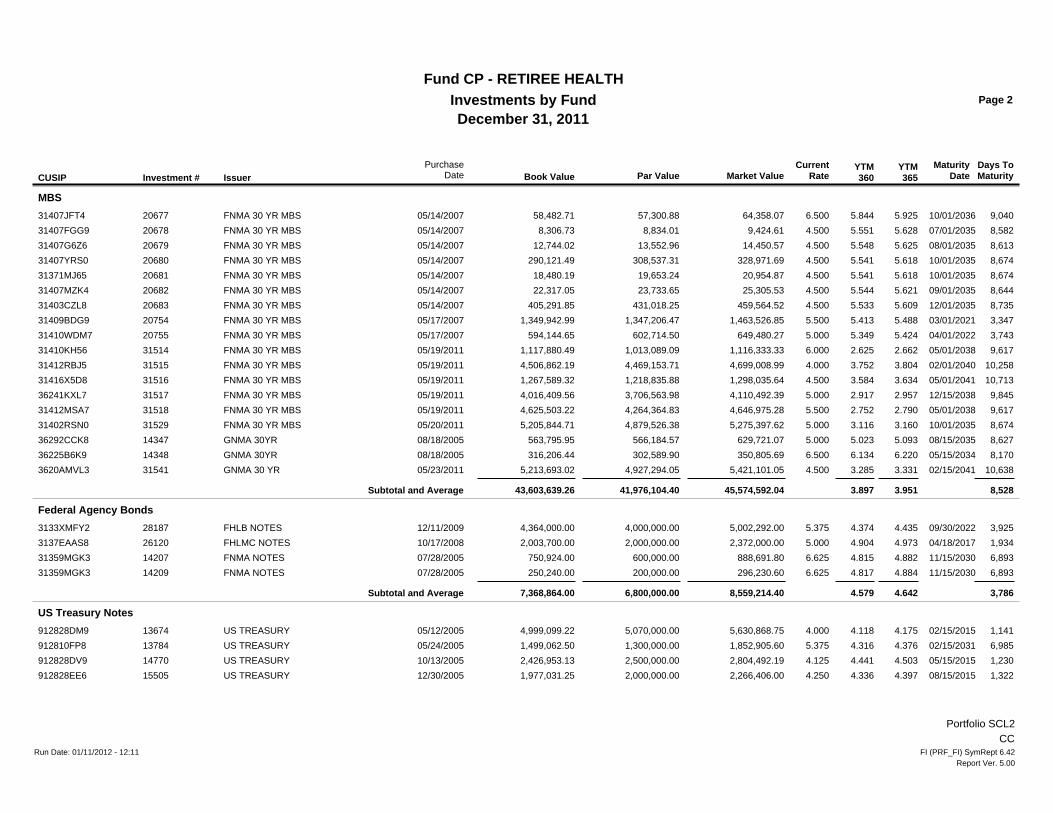
Investment Portfolio Holdings•
Investment Purchases Report•
Cash and Investments Audit Report December 2011•
4
����������� ��������������������
�����������������������!��"�����#���$�������%���!�&��������'�� �����(��)�������*�+�(���'�� ��6;�<� �����=�������>?��#� %
INVESTMENT REVIEW AND STRATEGY
December 31, 2011
Steady improvement across manufacturing, employment and corporate earnings; extremely low long term interest rates and incremental progress towards resolution of the European debt crisis created a supportive environment for equities within the second fiscal quarter ending December 31, 2011. The S&P index returned 11.8 percent during the period and has climbed 6.9 percent 2012 year to date. Long term interest rates as represented by the two and ten year treasury notes, however, barely moved. The U.S. economy grew at a 2.8 percent annual pace during the period, a rate slower than forecast by economists but a faster pace in more than year. Growth was hampered by slower than expected consumer spending. Even with the current sluggish economic recovery, economists project that the U.S. economy should out-perform Japan and Europe in 2012. Federal Reserve Officials continue to express serious concern over the economy’s slow pace of growth that is still occurring two years after the recession ended. The Fed renewed its pledge to maintain zero percent interest rates and has begun to provide time-lines further re-assuring market participants of the sincerity of their commitment. Federal Reserve Chairman Ben Bernanke announced the Fed’s intent to keep its benchmark interest rate at zero until late 2014 which is an extension beyond the previously disclosed 2013 target. Furthermore, the Fed has stated its willingness to embark upon another program to purchase outstanding government debt securities in order to reduce consumer and business loan rates. These decisions reflect the Fed’s pessimistic assessment of the economy as weak and of a recovery which needs more time. In a recent comment the FOMC (Federal Open Markets Committee) states, “We continue to see headwinds from Europe, coming from the slowing global economy and some other factors as well.” Currently, the Fed projects that the economy will grow at a 2.2 percent rate in 2012 and at 3.1 percent the following year. Both are lower revisions of prior forecasts. This recent Fed announcement mirror actions of other central banks who also have found it necessary to inject massive amounts of liquidity to keep credit flowing and promote growth. At the end of December, the European Central Bank (ECB) extended a record amount totaling $489 billion euro ($625 billion dollars) of loans to Euro zone banks to ensure adequate access to liquidity and funding to extend business and consumer loans. The unemployment rate trended lower during the quarter that ended 12/31/11 and in January 2012, the jobless rate fell to 8.3%, a three year low and a reduction from December’s 8.7% rate. For all of 2011, employers added 1.64 million jobs. The employment survey showed that the unemployment rate averaged 8.9 percent in 2011, down from 9.6 percent and 9.3 percent in the previous two years. Although a positive development, most agree significant weakness in the labor market still persists. Several concerns emerged after the release of January’s employment report. The percentage of unemployed who have been unemployed for 27 weeks or longer has not dropped and has been approximately 43% for several years. Also, it appears that fewer Americans are looking for work. When the Labor Department adjusted its count of the U.S. working age population by adding 1.51 million using 2010 census data, the vast majority of newly added workers or 83 percent had to be classified as “not looking for work” (discouraged workers) and
hence were excluded from the survey. Economists project that the economy still needs to create 300,000 jobs per month for seven years to recover the 8.75 million jobs lost as a result of the recession that ended in June 2009. Modest progress has occurred within housing, despite this, the condition of this sector remains depressed in most areas relative to the downturn. The Commerce Department reported that single family housing starts rose in December to a 470,000 annual pace from 450,000 the prior month and the highest since April 2010. Activities related to multi-family housing have accelerated due to the improvement in demand for rentals. Nevertheless, Fed Chairman, Ben Bernanke in recent comments has cited problems in the housing market as being a key impediment slowing the broader economic recovery. Approximately one out of every five mortgages is under-water. The Fed estimates that declines in house prices have reduced homeowner equity by more than 50 percent in the aggregate since the peak in the housing market. This translates into a loss of more than $7 trillion of household wealth. Without the wealth reduction, consumers could be spending between $200 billion and $375 billion per year more than current spending. Supply and potential supply of single family homes continue to exceed demand particularly in states in which over-building occurred such as California, Arizona and Nevada. Approximately two million homes entered the foreclosure process both in 2010 and 2011 and a high rate of foreclosures is expected in the upcoming year. Credit availability for buyers is still somewhat constrained and is lowering demand. Access to credit recently has been exacerbated by bank caution over underwriting mortgages with government guarantees which may carry the potential of future rejection by FNMA and FHLMC creating identical liabilities and lawsuits to those being currently faced by banks. Gross domestic product, the value of all goods and services, for the quarter ending 12/21/2011 posted a 2.8 percent gain on an annualized basis following a 1.8 percent gain the prior quarter. U.S. consumer spending rose 2 percent in the quarter, a slight increase from the prior quarter’s 1.7 percent gain. The savings rate which decreased to 3.7 percent from 3.9 percent the prior quarter lead analysts to conclude that consumers used savings rather than income to fund purchases made in the period. Government agencies cut spending at a 4.6 percent annual rate, the fifth straight decline. For all of 2011, government spending dropped 2.1 percent, the biggest decline since 1971. Corporate spending on equipment and software continued as a bright spot. Purchases of equipment and software increased by 5.2 percent during the period. While down from the prior period’s 16 percent gain, recent reports on durable goods orders indicate spending will rebound in the current quarter. As of this writing, the Greek government has passed legislation to create new and more stringent fiscal austerity measures. The International Monetary Fund, European Union and European Central Bank continue to refuse disbursement of Greece’s $130 billion Euro bailout until they receive further assurances that Greek political leaders will indeed implement these measures. With high levels of debt, massive youth unemployment and zero growth prospects, cutting government spending has been difficult in the past. Nevertheless, expectations remain strong that an orderly default and restructuring of Greek debt will occur and the impact of its economic woes on the rest of the Euro-zone economy will be diminished. Even with a reasonable
resolution, a number of economists forecast that the zone will experience shrinkage of bank credit and a mild recession. The ECB projects a 1.3 percent growth rate for 2012. Our portfolio strategy remains focused on the purchase of high quality assets and on those issuers whose credit strength is bolstered by U.S. government support which we still view as our best credit alternative. The quality standards set by the investment policy, under which the Pool is managed, for most of our securities, are higher than those required by state code. Government sponsored enterprises (GSEs) FHLMC, FNMA and FHLB will remain core holdings. Legislation enacted in July 2008 reaffirmed and strengthened the support available from the U.S. government for the GSEs. Furthermore, the significant ownership stake (80 percent) in FNMA and FHLMC that has been assumed by the U.S. Treasury provides senior debt holders with ample credit support. Currently, FNMA and FHLMC guarantee $5.5 trillion of U.S. home mortgages. We also like bank debt that is secured by FDIC and NCUA guarantees. This debt benefits from the full faith and credit of the U.S. government for timely return of both principle and interest. Given that the Fed has projected that Fed Funds will remain in its target range of 0.0% to .25% until the winter of 2014, we now believe that in general interest rates will stay at trough levels at least over the next two to three years. The amount of time it takes for the economy to attain a more adequate rate of growth will solely determine how long rates remain this low. As portfolio bonds with attractive coupons mature those proceeds must be reinvested at lower rates, lowering the overall pool’s acquisition yield. Given that we expect interest rates will eventually move upward, we want to position the portfolio to fully take advantage of interest rates moving upward whenever that occurs. We realize a material change in rates may not occur until late 2014. Nevertheless, our bias is to defensively structure the portfolio so that it is less sensitive to interest rate shifts and its market value is shielded from significant declines. We continue to look selectively at callable securities. They are typically bought as surrogates for securities with short maturities but also may offer an attractive yield pick-up relative to those non-callable bonds with a comparable maturity. We also find some floating rate securities attractive. These securities have coupons that change quarterly, are pegged to LIBOR, a commonly used rate to define interest costs, and therefore have the ability to reset in concert with higher rates. Certain high quality sectors such as asset backed securities (ABS) and taxable munis are attractive on a risk adjusted basis. And lastly, during those periods when we find the yield curve steep, slightly longer securities that are advantaged by the curve, add value to the portfolio.
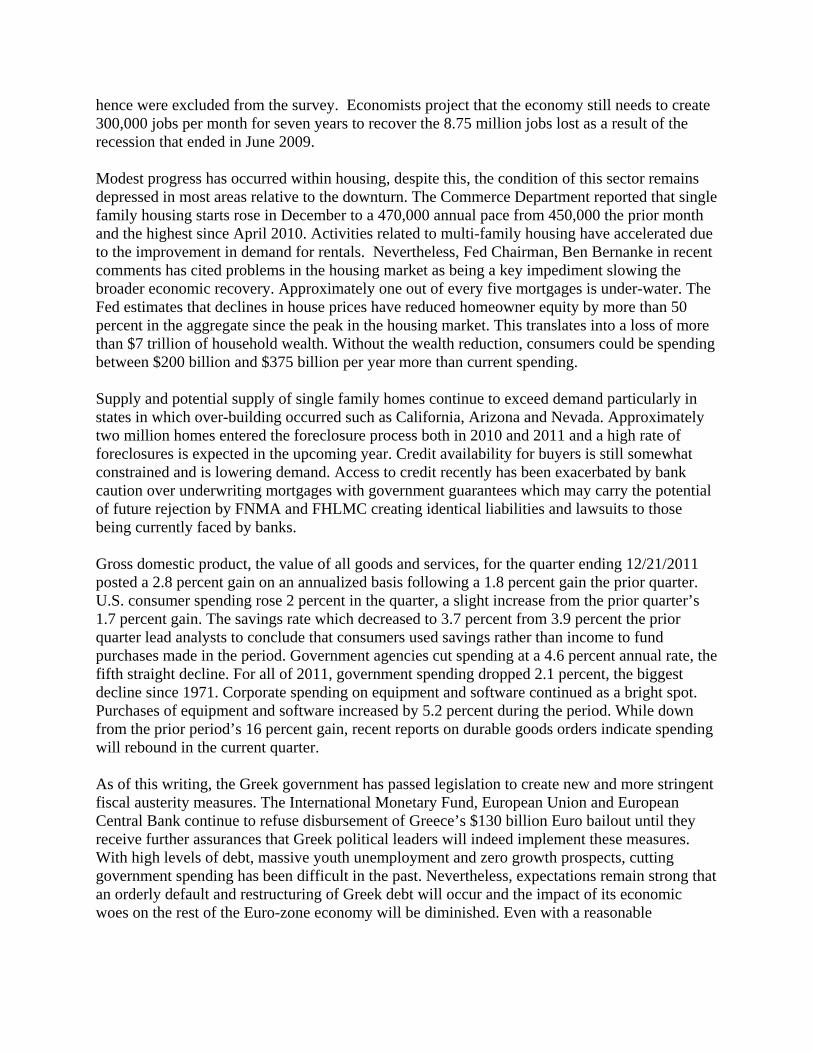
DEC NOV OCT SEP AUG JUL
Average Days to Maturity 450 463 456 443 460 501
County Yield (end of month) 0.71% 0.80% 0.81% 0.83% 0.91% 0..92%
LAIF Yield (end of month) 0.37% 0.38% 0.38% 0.37% 0.37% 0.36%
ATTACHMENT A
PercentIncrease Increase
Fund Cost Market Value (Decrease) (Decrease)
Commingled Investments 4,567,454,458 4,580,107,294 $12,652,836 0.277% Retiree Health Fixed Income* 146,981,548 155,776,542 $8,794,994 5.984% Retiree Health Equity* 11,348,192 11,100,618 -$247,574 -2.182%
Foothill Comm Col Series B 2,025,080 2,101,436 $76,356 3.771% Mountain View-Los Altos*** 2,002,658 1,994,202 -$8,456 -0.422%
Palo Alto Unified*** 4,071,099 4,066,377 -$4,722 -0.116%West Valley Mission CCD - Building Fund*** 110,651,430 110,447,280 -$204,150 -0.184%
(1) Medical Malpractice Ins Fund 13,716,459 13,968,972 $252,513 1.841%
(1) Managed by Chandler Asset Management, Inc.
Fund 2010
Oct 31 Nov 30 Dec 31 Dec 31Commingled Investments 0.81% 0.80% 0.71% 0.81%Retiree Health Fixed Income 3.70% 3.43% 3.35% 3.88%Weighted Yield 0.92% 0.89% 0.79% 0.91%
Santa Clara County Commingled Pool and Segregated InvestmentsCost vs Market Value and Historical Yield Comparisons
December 31, 2011
*These accounts reflect two components of the Retiree Health Fund. The third component is included in the Commingled Pool.**Yield to maturity (YTM) is the rate of return paid on a bond, note, or other fixed income security if the investor buys and holds it to its maturity date and if the coupon interest paid over the life of the bond is reinvested at the same rate as the coupon rate. The calculation for YTM is based on the coupon rate, length of time to maturity, and market price at time of purchase. Yield is a snapshot measure of the yield of the portfolio on the day it was measured based on the current portfolio holdings on that day. This is not a measure of total return, and is not intended to be, since it does not factor in unrealized capital gains and losses and reinvestment rates are dependent upon interest rate changes
***Indivdual securities within municipal security accounts are from time purchased at a premium price. The purpose of the price premium is to adjust the bond's price higher as an offset to the bond's above market coupon. With the passage of time, the price of the security approaches par because that is what the holder will receive at maturity. At this time, because of the premium, and not necessarily due to a decline in value, the security's cost will exceed its market value.
2011
Summary of Yields** for Select Santa Clara County Investment Funds
Attachment B
*Amounts are based on book value and in Millions (M).
**A total par amount of $93.9M in corporate bonds are guaranteed by NCUA (National Credit Union Administration) and $181.5M are guaranteed by FDIC.
SANTA CLARA COUNTY TREASURY-COMMINGLED POOLINVESTMENT CONCENTRATION AND MATURITY DISTRIBUTION
SECURITIES BY TYPE*
SECURITIES BY MATURITY
December 31, 2011
Negotiable CD's $310.0, 6.8%
Agency Bonds $2,138.6, 46.8%
Corporate Bonds $331.2, 7.2%
Corp. Bonds, Govt. Guar.** $275.4, 6.0%
Commercial Paper $706.7, 15.5%
Agency Discount Notes $25.0, 0.6%
Money Market Funds $594.0,13.0%
MBS $4.5, 0.1%
ABS $150.5, 3.3% Municipal Securities $31.6, 0.7%
Cash Equivalent-Money Market, 13.0%
1-30 days, 13.7%
31-90 days, 3.6%
91-180 days, 5.9%
181-365 days, 18.5%
366-730 days, 20.5%
731 days - 5 yrs, 24.8%
ATTACHMENT C1
At Cost Market Value
Total Fund 177,380,965 187,115,467
Fixed Income 146,981,548 155,776,542
Equity 11,348,192 11,100,618
Commingled Pool 8,011,225 8,033,416
FAF Loan* 11,040,000 12,204,891
*FAF Loan is a 5 year loan maturing on 12/31/15 with a fixed interest rate of 2.84%.
The County Investment Policy adopted by the Board of Supervisors provides that up to 67%
of the Santa Clara Retiree Health Trust may be invested in equities through mutual funds or
through the purchase of common stocks by a money management firm(s) approved by the
Board of Supervisors.
Retiree Health Program
December 31, 2011
Fixed Income82.9%
Equity6.4%
Commingled Pool 4.5%
FAF Loan6.2%
At CostFixed Income83.3%
Equity5.9%Commingled
Pool 4.3%
FAF Loan6.5%
Market Value
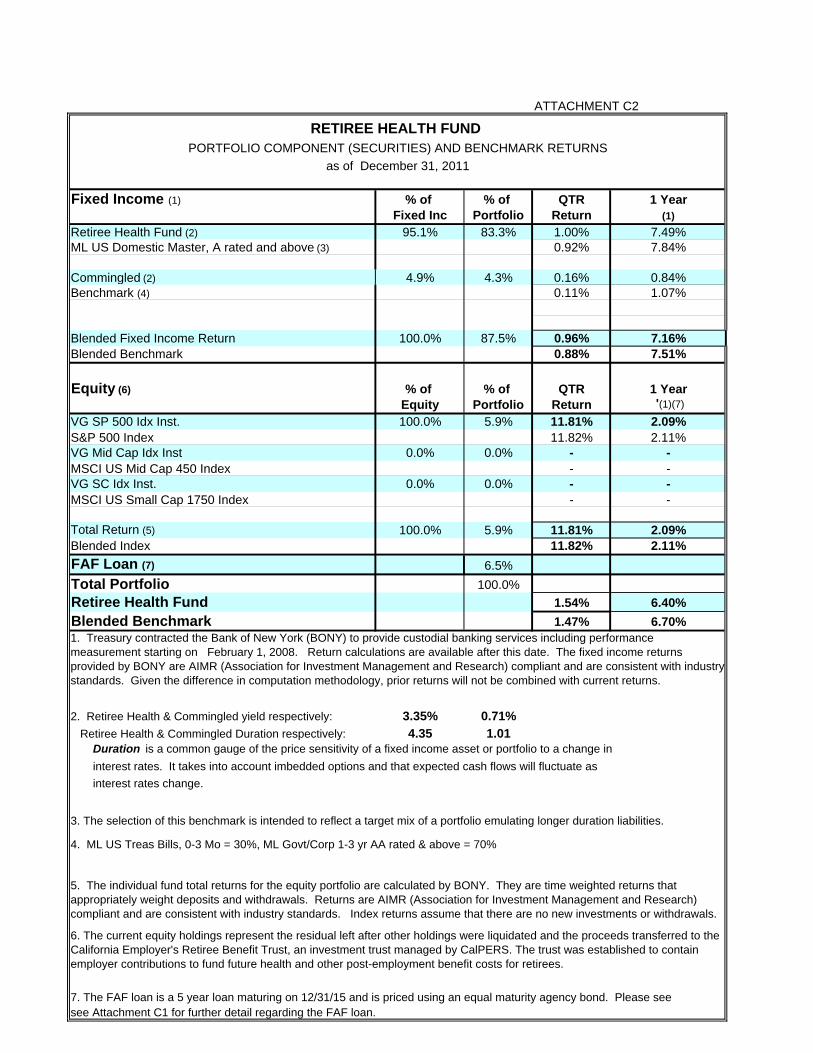
ATTACHMENT C2
Fixed Income (1) % of % of QTR 1 YearFixed Inc Portfolio Return (1)
Retiree Health Fund (2) 95.1% 83.3% 1.00% 7.49%ML US Domestic Master, A rated and above (3) 0.92% 7.84%
Commingled (2) 4.9% 4.3% 0.16% 0.84%Benchmark (4) 0.11% 1.07%
Blended Fixed Income Return 100.0% 87.5% 0.96% 7.16%Blended Benchmark 0.88% 7.51%
Equity (6) % of % of QTR 1 YearEquity Portfolio Return '(1)(7)
VG SP 500 Idx Inst. 100.0% 5.9% 11.81% 2.09%S&P 500 Index 11.82% 2.11%VG Mid Cap Idx Inst 0.0% 0.0% - -MSCI US Mid Cap 450 Index - -VG SC Idx Inst. 0.0% 0.0% - -MSCI US Small Cap 1750 Index - -
Total Return (5) 100.0% 5.9% 11.81% 2.09%Blended Index 11.82% 2.11%
FAF Loan (7) 6.5%
Total Portfolio 100.0%
Retiree Health Fund 1.54% 6.40%
Blended Benchmark 1.47% 6.70%
2. Retiree Health & Commingled yield respectively: 3.35% 0.71%
Retiree Health & Commingled Duration respectively: 4.35 1.01
4. ML US Treas Bills, 0-3 Mo = 30%, ML Govt/Corp 1-3 yr AA rated & above = 70%
see Attachment C1 for further detail regarding the FAF loan.
RETIREE HEALTH FUND PORTFOLIO COMPONENT (SECURITIES) AND BENCHMARK RETURNS
as of December 31, 2011
interest rates. It takes into account imbedded options and that expected cash flows will fluctuate as
Duration is a common gauge of the price sensitivity of a fixed income asset or portfolio to a change in
1. Treasury contracted the Bank of New York (BONY) to provide custodial banking services including performance measurement starting on February 1, 2008. Return calculations are available after this date. The fixed income returns provided by BONY are AIMR (Association for Investment Management and Research) compliant and are consistent with industry standards. Given the difference in computation methodology, prior returns will not be combined with current returns.
interest rates change.
3. The selection of this benchmark is intended to reflect a target mix of a portfolio emulating longer duration liabilities.
7. The FAF loan is a 5 year loan maturing on 12/31/15 and is priced using an equal maturity agency bond. Please see
6. The current equity holdings represent the residual left after other holdings were liquidated and the proceeds transferred to the California Employer's Retiree Benefit Trust, an investment trust managed by CalPERS. The trust was established to contain employer contributions to fund future health and other post-employment benefit costs for retirees.
5. The individual fund total returns for the equity portfolio are calculated by BONY. They are time weighted returns that appropriately weight deposits and withdrawals. Returns are AIMR (Association for Investment Management and Research) compliant and are consistent with industry standards. Index returns assume that there are no new investments or withdrawals.
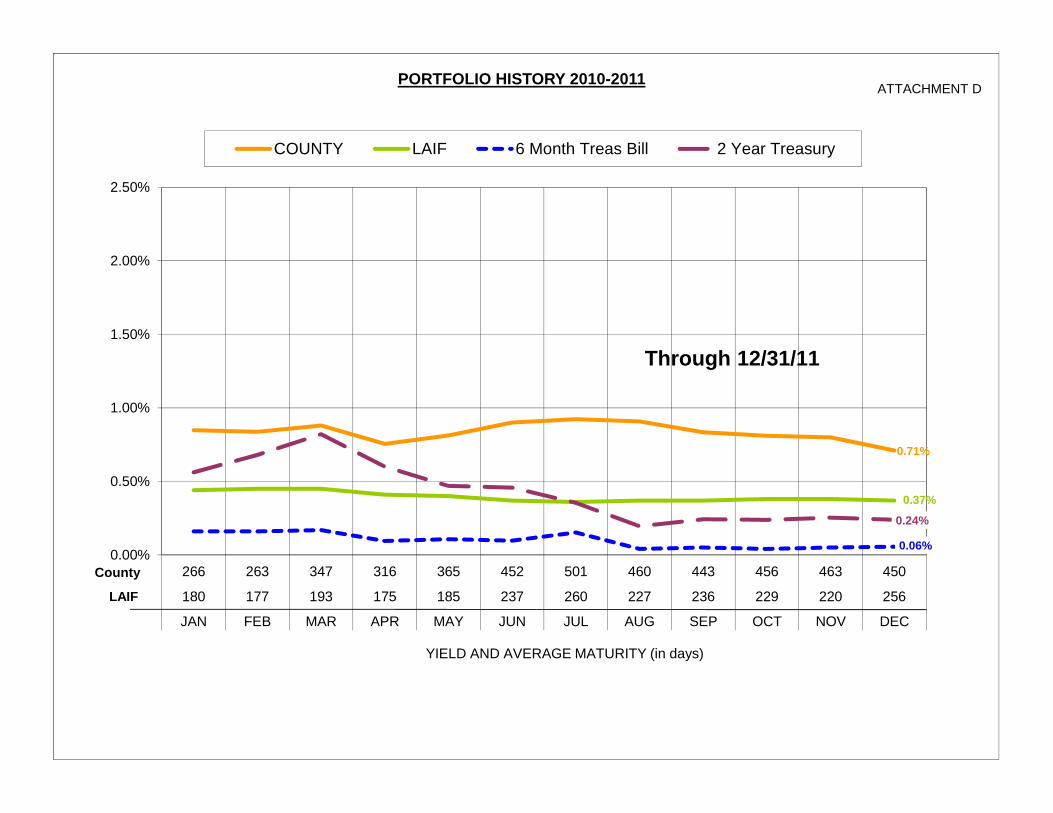
ATTACHMENT D
0.71%
0.37%
0.06%
0.24%
0.00%
0.50%
1.00%
1.50%
2.00%
2.50%
266 263 347 316 365 452 501 460 443 456 463 450
180 177 193 175 185 237 260 227 236 229 220 256
JAN FEB MAR APR MAY JUN JUL AUG SEP OCT NOV DEC
YIELD AND AVERAGE MATURITY (in days)
PORTFOLIO HISTORY 2010-2011
COUNTY LAIF 6 Month Treas Bill 2 Year Treasury
County
LAIF
Through 12/31/11
SANTA CLARA COUNTY INVESTMENTSSANTA CLARA COUNTY
70 WEST HEDDINGEAST WING 6TH FLOOR
SAN JOSE, CA 95110
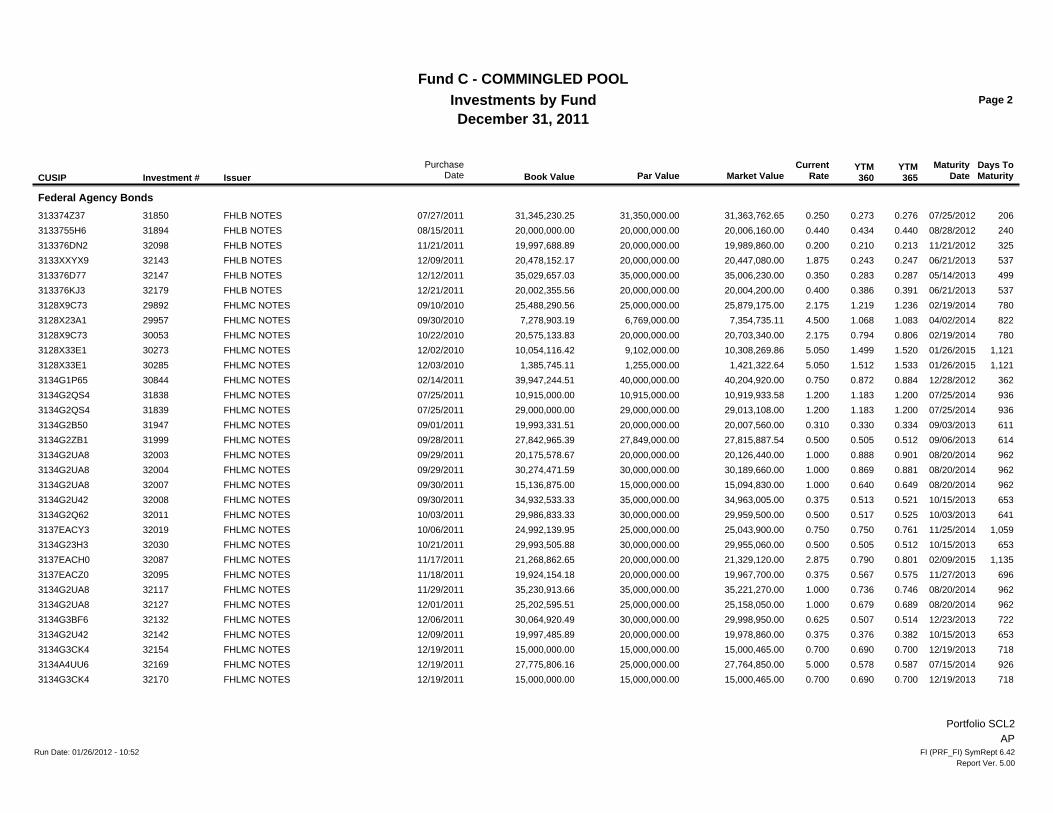
December 31, 2011
Fund C - COMMINGLED POOLInvestments by Fund
Par ValueDays ToMaturity
MaturityDate
CurrentRateMarket ValueCUSIP Investment # Issuer
PurchaseDate Book Value
YTM360
YTM365
Negotiable CDs
BANK OF AMERICA CORP31798 50,000,000.000605C03W0 01/09/2012 80.29007/12/2011 49,999,850.00 0.290 0.29450,000,000.00BANK OF NOVA SCOTIA32137 45,000,000.0006417ESD6 06/07/2012 1580.44012/08/2011 44,989,996.50 0.440 0.44645,000,000.00BANK OF NOVA SCOTIA28828 25,000,000.0006416P4T3 03/05/2012 640.77703/08/2010 24,993,600.00 0.609 0.61725,000,000.00NATIONAL AUSTRALIA-BK-NY32146 70,000,000.0063253TKP2 06/11/2012 1620.52012/12/2011 69,974,506.00 0.520 0.52770,000,000.00ROYAL BANK OF CANADA32039 45,000,000.0078009NBJ4 10/26/2012 2990.56010/26/2011 45,078,615.00 0.560 0.56745,000,000.00ROYAL BANK OF CANADA32176 25,000,000.0078009NCV6 06/20/2014 9011.10012/21/2011 24,937,500.00 1.084 1.10025,000,000.00TORONTO DOMINION BANK31732 50,000,000.0089112YQ89 03/27/2012 860.25506/27/2011 50,015,250.00 0.255 0.25850,000,000.00
Subtotal and Average 310,000,000.00 310,000,000.00 309,989,317.50 0.487 0.494 195
MBS
FHLMC30100 4,475,207.6031398JNB5 08/15/2014 9571.85011/02/2010 4,500,834.88 0.968 0.9824,533,245.45
Subtotal and Average 4,533,245.45 4,475,207.60 4,500,834.88 0.969 0.982 957
Federal Agency Bonds
FARMER MAC30297 35,000,000.0031315PLT4 12/06/2013 7051.25012/06/2010 35,495,670.00 1.279 1.29734,968,918.06FARMER MAC31449 25,000,000.0031315PVUO 05/10/2013 4950.76005/10/2011 25,074,775.00 0.774 0.78524,991,510.42FFCB NOTES27950 25,000,000.0031331GV30 10/01/2012 2740.37010/08/2009 25,037,000.00 0.345 0.35025,001,887.05FFCB NOTES29448 35,000,000.0031331JPK3 06/25/2013 5411.37505/25/2010 35,571,130.00 1.458 1.47934,947,465.95FFCB NOTES31109 10,000,000.0031331KET3 09/23/2013 6310.98003/23/2011 10,101,630.00 1.019 1.0349,990,808.22FHLB NOTES28067 40,000,000.003133XVNT4 12/14/2012 3481.75011/19/2009 40,542,440.00 1.625 1.64740,037,621.36FHLB NOTES28136 16,775,000.003133XUMR1 09/12/2014 9853.25012/04/2009 17,958,979.50 2.393 2.42717,124,188.81FHLB NOTES28166 35,000,000.003133XVNT4 12/14/2012 3481.75012/09/2009 35,474,635.00 1.513 1.53435,069,927.74FHLB NOTES29065 25,000,000.003133XXYX9 06/21/2013 5371.87504/08/2010 25,558,850.00 1.939 1.96524,967,823.07FHLB NOTES29066 5,000,000.003133XXYX9 06/21/2013 5371.87504/08/2010 5,111,770.00 1.939 1.9654,993,564.61FHLB NOTES29090 15,200,000.003133XJUT3 03/09/2012 685.00004/09/2010 15,335,903.20 1.138 1.15415,308,884.52FHLB NOTES31408 25,000,000.0031339X2M5 06/14/2013 5303.87505/03/2011 26,270,175.00 0.722 0.73226,130,205.75FHLB NOTES31733 10,000,000.00313374FF2 06/27/2012 1780.25006/27/2011 10,003,630.00 0.246 0.25010,000,000.00FHLB NOTES31787 70,000,000.00313374K66 07/06/2012 1870.26007/06/2011 70,017,570.00 0.256 0.26070,000,000.00FHLB NOTES31797 13,365,000.003133XUE41 08/22/2012 2341.75007/12/2011 13,493,397.56 0.270 0.27413,491,271.18FHLB NOTES31811 45,000,000.00313374SV3 07/30/2012 2110.25007/15/2011 45,005,175.00 0.251 0.25544,998,695.84FHLB NOTES31812 25,000,000.00313374TX8 02/15/2012 450.12007/15/2011 25,000,000.00 0.142 0.14424,999,288.37
Portfolio SCL2AP
Run Date: 01/26/2012 - 10:52 FI (PRF_FI) SymRept 6.42Report Ver. 5.00
December 31, 2011
Par ValueDays ToMaturity
MaturityDate
CurrentRateMarket Value
Fund C - COMMINGLED POOLInvestments by Fund Page 2
CUSIP Investment # IssuerPurchase
Date Book ValueYTM360
YTM365
Federal Agency Bonds
FHLB NOTES31850 31,350,000.00313374Z37 07/25/2012 2060.25007/27/2011 31,363,762.65 0.273 0.27631,345,230.25FHLB NOTES31894 20,000,000.003133755H6 08/28/2012 2400.44008/15/2011 20,006,160.00 0.434 0.44020,000,000.00FHLB NOTES32098 20,000,000.00313376DN2 11/21/2012 3250.20011/21/2011 19,989,860.00 0.210 0.21319,997,688.89FHLB NOTES32143 20,000,000.003133XXYX9 06/21/2013 5371.87512/09/2011 20,447,080.00 0.243 0.24720,478,152.17FHLB NOTES32147 35,000,000.00313376D77 05/14/2013 4990.35012/12/2011 35,006,230.00 0.283 0.28735,029,657.03FHLB NOTES32179 20,000,000.00313376KJ3 06/21/2013 5370.40012/21/2011 20,004,200.00 0.386 0.39120,002,355.56FHLMC NOTES29892 25,000,000.003128X9C73 02/19/2014 7802.17509/10/2010 25,879,175.00 1.219 1.23625,488,290.56FHLMC NOTES29957 6,769,000.003128X23A1 04/02/2014 8224.50009/30/2010 7,354,735.11 1.068 1.0837,278,903.19FHLMC NOTES30053 20,000,000.003128X9C73 02/19/2014 7802.17510/22/2010 20,703,340.00 0.794 0.80620,575,133.83FHLMC NOTES30273 9,102,000.003128X33E1 01/26/2015 1,1215.05012/02/2010 10,308,269.86 1.499 1.52010,054,116.42FHLMC NOTES30285 1,255,000.003128X33E1 01/26/2015 1,1215.05012/03/2010 1,421,322.64 1.512 1.5331,385,745.11FHLMC NOTES30844 40,000,000.003134G1P65 12/28/2012 3620.75002/14/2011 40,204,920.00 0.872 0.88439,947,244.51FHLMC NOTES31838 10,915,000.003134G2QS4 07/25/2014 9361.20007/25/2011 10,919,933.58 1.183 1.20010,915,000.00FHLMC NOTES31839 29,000,000.003134G2QS4 07/25/2014 9361.20007/25/2011 29,013,108.00 1.183 1.20029,000,000.00FHLMC NOTES31947 20,000,000.003134G2B50 09/03/2013 6110.31009/01/2011 20,007,560.00 0.330 0.33419,993,331.51FHLMC NOTES31999 27,849,000.003134G2ZB1 09/06/2013 6140.50009/28/2011 27,815,887.54 0.505 0.51227,842,965.39FHLMC NOTES32003 20,000,000.003134G2UA8 08/20/2014 9621.00009/29/2011 20,126,440.00 0.888 0.90120,175,578.67FHLMC NOTES32004 30,000,000.003134G2UA8 08/20/2014 9621.00009/29/2011 30,189,660.00 0.869 0.88130,274,471.59FHLMC NOTES32007 15,000,000.003134G2UA8 08/20/2014 9621.00009/30/2011 15,094,830.00 0.640 0.64915,136,875.00FHLMC NOTES32008 35,000,000.003134G2U42 10/15/2013 6530.37509/30/2011 34,963,005.00 0.513 0.52134,932,533.33FHLMC NOTES32011 30,000,000.003134G2Q62 10/03/2013 6410.50010/03/2011 29,959,500.00 0.517 0.52529,986,833.33FHLMC NOTES32019 25,000,000.003137EACY3 11/25/2014 1,0590.75010/06/2011 25,043,900.00 0.750 0.76124,992,139.95FHLMC NOTES32030 30,000,000.003134G23H3 10/15/2013 6530.50010/21/2011 29,955,060.00 0.505 0.51229,993,505.88FHLMC NOTES32087 20,000,000.003137EACH0 02/09/2015 1,1352.87511/17/2011 21,329,120.00 0.790 0.80121,268,862.65FHLMC NOTES32095 20,000,000.003137EACZ0 11/27/2013 6960.37511/18/2011 19,967,700.00 0.567 0.57519,924,154.18FHLMC NOTES32117 35,000,000.003134G2UA8 08/20/2014 9621.00011/29/2011 35,221,270.00 0.736 0.74635,230,913.66FHLMC NOTES32127 25,000,000.003134G2UA8 08/20/2014 9621.00012/01/2011 25,158,050.00 0.679 0.68925,202,595.51FHLMC NOTES32132 30,000,000.003134G3BF6 12/23/2013 7220.62512/06/2011 29,998,950.00 0.507 0.51430,064,920.49FHLMC NOTES32142 20,000,000.003134G2U42 10/15/2013 6530.37512/09/2011 19,978,860.00 0.376 0.38219,997,485.89FHLMC NOTES32154 15,000,000.003134G3CK4 12/19/2013 7180.70012/19/2011 15,000,465.00 0.690 0.70015,000,000.00FHLMC NOTES32169 25,000,000.003134A4UU6 07/15/2014 9265.00012/19/2011 27,764,850.00 0.578 0.58727,775,806.16FHLMC NOTES32170 15,000,000.003134G3CK4 12/19/2013 7180.70012/19/2011 15,000,465.00 0.690 0.70015,000,000.00
Portfolio SCL2AP
Run Date: 01/26/2012 - 10:52 FI (PRF_FI) SymRept 6.42Report Ver. 5.00
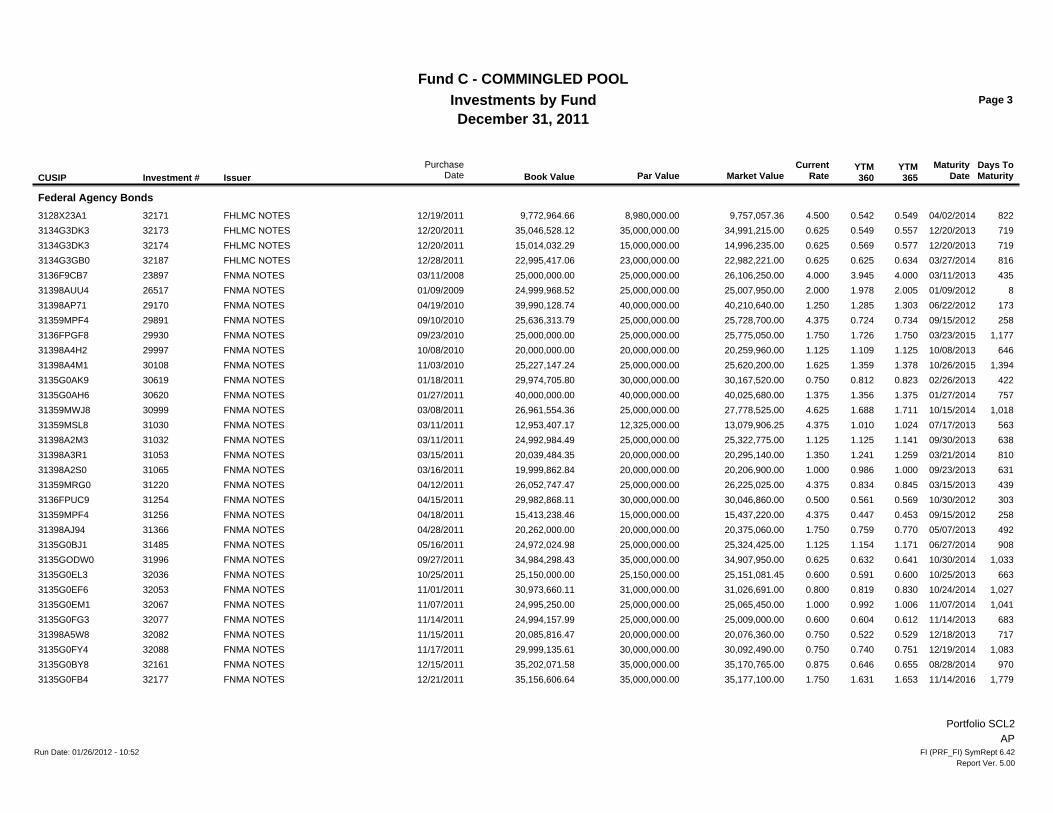
December 31, 2011
Par ValueDays ToMaturity
MaturityDate
CurrentRateMarket Value
Fund C - COMMINGLED POOLInvestments by Fund Page 3
CUSIP Investment # IssuerPurchase
Date Book ValueYTM360
YTM365
Federal Agency Bonds
FHLMC NOTES32171 8,980,000.003128X23A1 04/02/2014 8224.50012/19/2011 9,757,057.36 0.542 0.5499,772,964.66FHLMC NOTES32173 35,000,000.003134G3DK3 12/20/2013 7190.62512/20/2011 34,991,215.00 0.549 0.55735,046,528.12FHLMC NOTES32174 15,000,000.003134G3DK3 12/20/2013 7190.62512/20/2011 14,996,235.00 0.569 0.57715,014,032.29FHLMC NOTES32187 23,000,000.003134G3GB0 03/27/2014 8160.62512/28/2011 22,982,221.00 0.625 0.63422,995,417.06FNMA NOTES23897 25,000,000.003136F9CB7 03/11/2013 4354.00003/11/2008 26,106,250.00 3.945 4.00025,000,000.00FNMA NOTES26517 25,000,000.0031398AUU4 01/09/2012 82.00001/09/2009 25,007,950.00 1.978 2.00524,999,968.52FNMA NOTES29170 40,000,000.0031398AP71 06/22/2012 1731.25004/19/2010 40,210,640.00 1.285 1.30339,990,128.74FNMA NOTES29891 25,000,000.0031359MPF4 09/15/2012 2584.37509/10/2010 25,728,700.00 0.724 0.73425,636,313.79FNMA NOTES29930 25,000,000.003136FPGF8 03/23/2015 1,1771.75009/23/2010 25,775,050.00 1.726 1.75025,000,000.00FNMA NOTES29997 20,000,000.0031398A4H2 10/08/2013 6461.12510/08/2010 20,259,960.00 1.109 1.12520,000,000.00FNMA NOTES30108 25,000,000.0031398A4M1 10/26/2015 1,3941.62511/03/2010 25,620,200.00 1.359 1.37825,227,147.24FNMA NOTES30619 30,000,000.003135G0AK9 02/26/2013 4220.75001/18/2011 30,167,520.00 0.812 0.82329,974,705.80FNMA NOTES30620 40,000,000.003135G0AH6 01/27/2014 7571.37501/27/2011 40,025,680.00 1.356 1.37540,000,000.00FNMA NOTES30999 25,000,000.0031359MWJ8 10/15/2014 1,0184.62503/08/2011 27,778,525.00 1.688 1.71126,961,554.36FNMA NOTES31030 12,325,000.0031359MSL8 07/17/2013 5634.37503/11/2011 13,079,906.25 1.010 1.02412,953,407.17FNMA NOTES31032 25,000,000.0031398A2M3 09/30/2013 6381.12503/11/2011 25,322,775.00 1.125 1.14124,992,984.49FNMA NOTES31053 20,000,000.0031398A3R1 03/21/2014 8101.35003/15/2011 20,295,140.00 1.241 1.25920,039,484.35FNMA NOTES31065 20,000,000.0031398A2S0 09/23/2013 6311.00003/16/2011 20,206,900.00 0.986 1.00019,999,862.84FNMA NOTES31220 25,000,000.0031359MRG0 03/15/2013 4394.37504/12/2011 26,225,025.00 0.834 0.84526,052,747.47FNMA NOTES31254 30,000,000.003136FPUC9 10/30/2012 3030.50004/15/2011 30,046,860.00 0.561 0.56929,982,868.11FNMA NOTES31256 15,000,000.0031359MPF4 09/15/2012 2584.37504/18/2011 15,437,220.00 0.447 0.45315,413,238.46FNMA NOTES31366 20,000,000.0031398AJ94 05/07/2013 4921.75004/28/2011 20,375,060.00 0.759 0.77020,262,000.00FNMA NOTES31485 25,000,000.003135G0BJ1 06/27/2014 9081.12505/16/2011 25,324,425.00 1.154 1.17124,972,024.98FNMA NOTES31996 35,000,000.003135GODW0 10/30/2014 1,0330.62509/27/2011 34,907,950.00 0.632 0.64134,984,298.43FNMA NOTES32036 25,150,000.003135G0EL3 10/25/2013 6630.60010/25/2011 25,151,081.45 0.591 0.60025,150,000.00FNMA NOTES32053 31,000,000.003135G0EF6 10/24/2014 1,0270.80011/01/2011 31,026,691.00 0.819 0.83030,973,660.11FNMA NOTES32067 25,000,000.003135G0EM1 11/07/2014 1,0411.00011/07/2011 25,065,450.00 0.992 1.00624,995,250.00FNMA NOTES32077 25,000,000.003135G0FG3 11/14/2013 6830.60011/14/2011 25,009,000.00 0.604 0.61224,994,157.99FNMA NOTES32082 20,000,000.0031398A5W8 12/18/2013 7170.75011/15/2011 20,076,360.00 0.522 0.52920,085,816.47FNMA NOTES32088 30,000,000.003135G0FY4 12/19/2014 1,0830.75011/17/2011 30,092,490.00 0.740 0.75129,999,135.61FNMA NOTES32161 35,000,000.003135G0BY8 08/28/2014 9700.87512/15/2011 35,170,765.00 0.646 0.65535,202,071.58FNMA NOTES32177 35,000,000.003135G0FB4 11/14/2016 1,7791.75012/21/2011 35,177,100.00 1.631 1.65335,156,606.64
Portfolio SCL2AP
Run Date: 01/26/2012 - 10:52 FI (PRF_FI) SymRept 6.42Report Ver. 5.00
December 31, 2011
Par ValueDays ToMaturity
MaturityDate
CurrentRateMarket Value
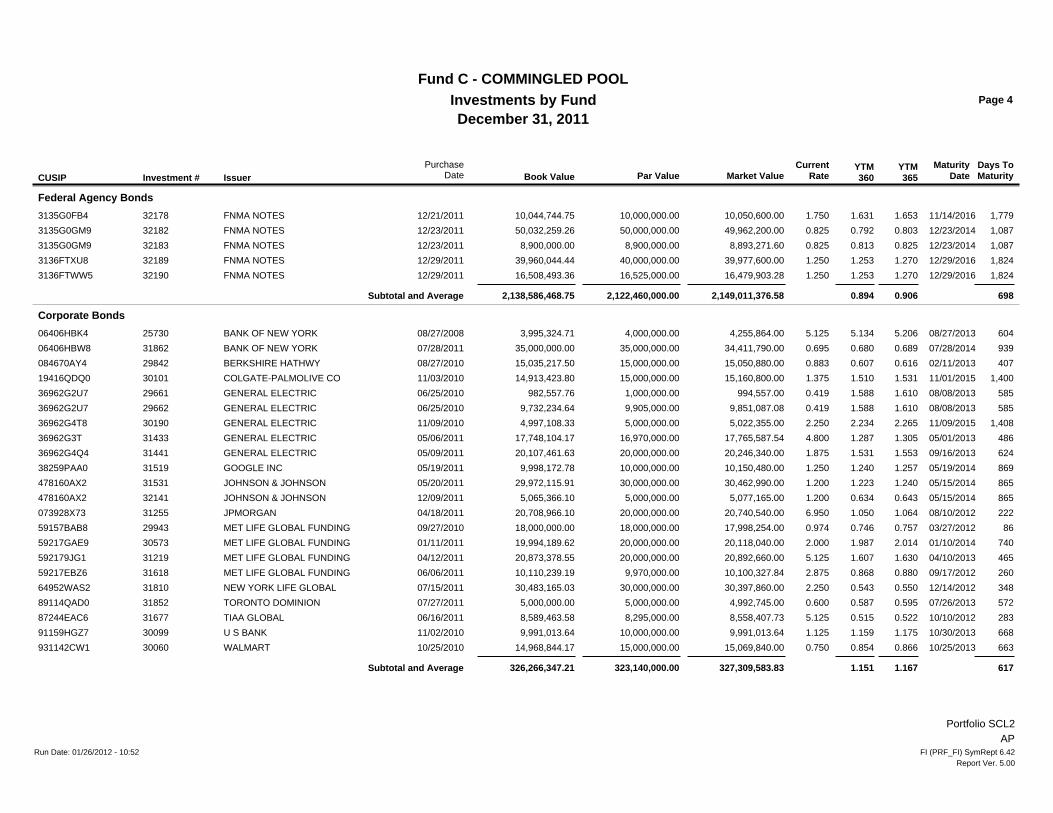
Fund C - COMMINGLED POOLInvestments by Fund Page 4
CUSIP Investment # IssuerPurchase
Date Book ValueYTM360
YTM365
Federal Agency Bonds
FNMA NOTES32178 10,000,000.003135G0FB4 11/14/2016 1,7791.75012/21/2011 10,050,600.00 1.631 1.65310,044,744.75FNMA NOTES32182 50,000,000.003135G0GM9 12/23/2014 1,0870.82512/23/2011 49,962,200.00 0.792 0.80350,032,259.26FNMA NOTES32183 8,900,000.003135G0GM9 12/23/2014 1,0870.82512/23/2011 8,893,271.60 0.813 0.8258,900,000.00FNMA NOTES32189 40,000,000.003136FTXU8 12/29/2016 1,8241.25012/29/2011 39,977,600.00 1.253 1.27039,960,044.44FNMA NOTES32190 16,525,000.003136FTWW5 12/29/2016 1,8241.25012/29/2011 16,479,903.28 1.253 1.27016,508,493.36
Subtotal and Average 2,138,586,468.75 2,122,460,000.00 2,149,011,376.58 0.894 0.906 698
Corporate Bonds
BANK OF NEW YORK25730 4,000,000.0006406HBK4 08/27/2013 6045.12508/27/2008 4,255,864.00 5.134 5.2063,995,324.71BANK OF NEW YORK31862 35,000,000.0006406HBW8 07/28/2014 9390.69507/28/2011 34,411,790.00 0.680 0.68935,000,000.00BERKSHIRE HATHWY29842 15,000,000.00084670AY4 02/11/2013 4070.88308/27/2010 15,050,880.00 0.607 0.61615,035,217.50COLGATE-PALMOLIVE CO30101 15,000,000.0019416QDQ0 11/01/2015 1,4001.37511/03/2010 15,160,800.00 1.510 1.53114,913,423.80GENERAL ELECTRIC29661 1,000,000.0036962G2U7 08/08/2013 5850.41906/25/2010 994,557.00 1.588 1.610982,557.76GENERAL ELECTRIC29662 9,905,000.0036962G2U7 08/08/2013 5850.41906/25/2010 9,851,087.08 1.588 1.6109,732,234.64GENERAL ELECTRIC30190 5,000,000.0036962G4T8 11/09/2015 1,4082.25011/09/2010 5,022,355.00 2.234 2.2654,997,108.33GENERAL ELECTRIC31433 16,970,000.0036962G3T 05/01/2013 4864.80005/06/2011 17,765,587.54 1.287 1.30517,748,104.17GENERAL ELECTRIC31441 20,000,000.0036962G4Q4 09/16/2013 6241.87505/09/2011 20,246,340.00 1.531 1.55320,107,461.63GOOGLE INC31519 10,000,000.0038259PAA0 05/19/2014 8691.25005/19/2011 10,150,480.00 1.240 1.2579,998,172.78JOHNSON & JOHNSON31531 30,000,000.00478160AX2 05/15/2014 8651.20005/20/2011 30,462,990.00 1.223 1.24029,972,115.91JOHNSON & JOHNSON32141 5,000,000.00478160AX2 05/15/2014 8651.20012/09/2011 5,077,165.00 0.634 0.6435,065,366.10JPMORGAN31255 20,000,000.00073928X73 08/10/2012 2226.95004/18/2011 20,740,540.00 1.050 1.06420,708,966.10MET LIFE GLOBAL FUNDING29943 18,000,000.0059157BAB8 03/27/2012 860.97409/27/2010 17,998,254.00 0.746 0.75718,000,000.00MET LIFE GLOBAL FUNDING30573 20,000,000.0059217GAE9 01/10/2014 7402.00001/11/2011 20,118,040.00 1.987 2.01419,994,189.62MET LIFE GLOBAL FUNDING31219 20,000,000.00592179JG1 04/10/2013 4655.12504/12/2011 20,892,660.00 1.607 1.63020,873,378.55MET LIFE GLOBAL FUNDING31618 9,970,000.0059217EBZ6 09/17/2012 2602.87506/06/2011 10,100,327.84 0.868 0.88010,110,239.19NEW YORK LIFE GLOBAL31810 30,000,000.0064952WAS2 12/14/2012 3482.25007/15/2011 30,397,860.00 0.543 0.55030,483,165.03TORONTO DOMINION31852 5,000,000.0089114QAD0 07/26/2013 5720.60007/27/2011 4,992,745.00 0.587 0.5955,000,000.00TIAA GLOBAL31677 8,295,000.0087244EAC6 10/10/2012 2835.12506/16/2011 8,558,407.73 0.515 0.5228,589,463.58U S BANK30099 10,000,000.0091159HGZ7 10/30/2013 6681.12511/02/2010 9,991,013.64 1.159 1.1759,991,013.64WALMART30060 15,000,000.00931142CW1 10/25/2013 6630.75010/25/2010 15,069,840.00 0.854 0.86614,968,844.17
Subtotal and Average 326,266,347.21 323,140,000.00 327,309,583.83 1.151 1.167 617
Portfolio SCL2AP
Run Date: 01/26/2012 - 10:52 FI (PRF_FI) SymRept 6.42Report Ver. 5.00
December 31, 2011
Par ValueDays ToMaturity
MaturityDate
CurrentRateMarket Value
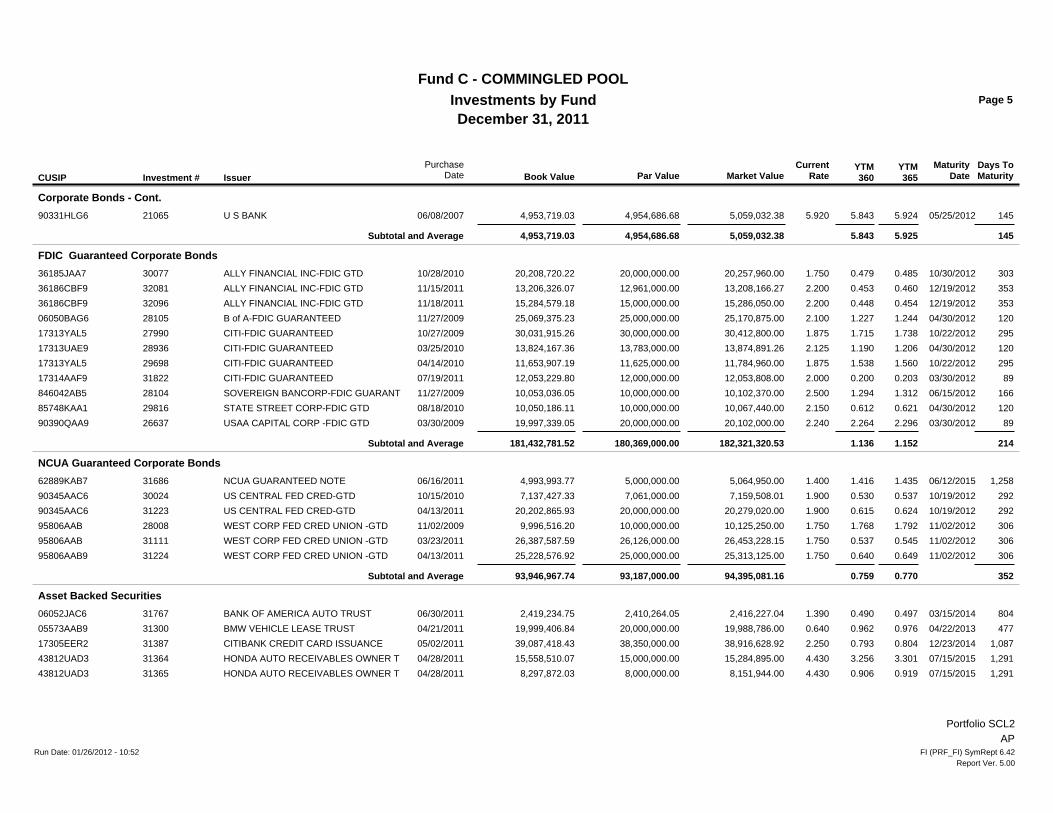
Fund C - COMMINGLED POOLInvestments by Fund Page 5
CUSIP Investment # IssuerPurchase
Date Book ValueYTM360
YTM365
Corporate Bonds - Cont.
U S BANK21065 4,954,686.6890331HLG6 05/25/2012 1455.92006/08/2007 5,059,032.38 5.843 5.9244,953,719.03
Subtotal and Average 4,953,719.03 4,954,686.68 5,059,032.38 5.843 5.925 145
FDIC Guaranteed Corporate Bonds
ALLY FINANCIAL INC-FDIC GTD30077 20,000,000.0036185JAA7 10/30/2012 3031.75010/28/2010 20,257,960.00 0.479 0.48520,208,720.22ALLY FINANCIAL INC-FDIC GTD32081 12,961,000.0036186CBF9 12/19/2012 3532.20011/15/2011 13,208,166.27 0.453 0.46013,206,326.07ALLY FINANCIAL INC-FDIC GTD32096 15,000,000.0036186CBF9 12/19/2012 3532.20011/18/2011 15,286,050.00 0.448 0.45415,284,579.18B of A-FDIC GUARANTEED28105 25,000,000.0006050BAG6 04/30/2012 1202.10011/27/2009 25,170,875.00 1.227 1.24425,069,375.23CITI-FDIC GUARANTEED27990 30,000,000.0017313YAL5 10/22/2012 2951.87510/27/2009 30,412,800.00 1.715 1.73830,031,915.26CITI-FDIC GUARANTEED28936 13,783,000.0017313UAE9 04/30/2012 1202.12503/25/2010 13,874,891.26 1.190 1.20613,824,167.36CITI-FDIC GUARANTEED29698 11,625,000.0017313YAL5 10/22/2012 2951.87504/14/2010 11,784,960.00 1.538 1.56011,653,907.19CITI-FDIC GUARANTEED31822 12,000,000.0017314AAF9 03/30/2012 892.00007/19/2011 12,053,808.00 0.200 0.20312,053,229.80SOVEREIGN BANCORP-FDIC GUARANT28104 10,000,000.00846042AB5 06/15/2012 1662.50011/27/2009 10,102,370.00 1.294 1.31210,053,036.05STATE STREET CORP-FDIC GTD29816 10,000,000.0085748KAA1 04/30/2012 1202.15008/18/2010 10,067,440.00 0.612 0.62110,050,186.11USAA CAPITAL CORP -FDIC GTD26637 20,000,000.0090390QAA9 03/30/2012 892.24003/30/2009 20,102,000.00 2.264 2.29619,997,339.05
Subtotal and Average 181,432,781.52 180,369,000.00 182,321,320.53 1.136 1.152 214
NCUA Guaranteed Corporate Bonds
NCUA GUARANTEED NOTE31686 5,000,000.0062889KAB7 06/12/2015 1,2581.40006/16/2011 5,064,950.00 1.416 1.4354,993,993.77US CENTRAL FED CRED-GTD30024 7,061,000.0090345AAC6 10/19/2012 2921.90010/15/2010 7,159,508.01 0.530 0.5377,137,427.33US CENTRAL FED CRED-GTD31223 20,000,000.0090345AAC6 10/19/2012 2921.90004/13/2011 20,279,020.00 0.615 0.62420,202,865.93WEST CORP FED CRED UNION -GTD28008 10,000,000.0095806AAB 11/02/2012 3061.75011/02/2009 10,125,250.00 1.768 1.7929,996,516.20WEST CORP FED CRED UNION -GTD31111 26,126,000.0095806AAB 11/02/2012 3061.75003/23/2011 26,453,228.15 0.537 0.54526,387,587.59WEST CORP FED CRED UNION -GTD31224 25,000,000.0095806AAB9 11/02/2012 3061.75004/13/2011 25,313,125.00 0.640 0.64925,228,576.92
Subtotal and Average 93,946,967.74 93,187,000.00 94,395,081.16 0.759 0.770 352
Asset Backed Securities
BANK OF AMERICA AUTO TRUST31767 2,410,264.0506052JAC6 03/15/2014 8041.39006/30/2011 2,416,227.04 0.490 0.4972,419,234.75BMW VEHICLE LEASE TRUST31300 20,000,000.0005573AAB9 04/22/2013 4770.64004/21/2011 19,988,786.00 0.962 0.97619,999,406.84CITIBANK CREDIT CARD ISSUANCE31387 38,350,000.0017305EER2 12/23/2014 1,0872.25005/02/2011 38,916,628.92 0.793 0.80439,087,418.43HONDA AUTO RECEIVABLES OWNER T31364 15,000,000.0043812UAD3 07/15/2015 1,2914.43004/28/2011 15,284,895.00 3.256 3.30115,558,510.07HONDA AUTO RECEIVABLES OWNER T31365 8,000,000.0043812UAD3 07/15/2015 1,2914.43004/28/2011 8,151,944.00 0.906 0.9198,297,872.03
Portfolio SCL2AP
Run Date: 01/26/2012 - 10:52 FI (PRF_FI) SymRept 6.42Report Ver. 5.00
December 31, 2011
Par ValueDays ToMaturity
MaturityDate
CurrentRateMarket Value
Fund C - COMMINGLED POOLInvestments by Fund Page 6
CUSIP Investment # IssuerPurchase
Date Book ValueYTM360
YTM365
Asset Backed Securities
JOHN DEERE OWNER TRUST31285 21,000,000.00477867AB1 06/16/2014 8970.64004/20/2011 20,986,484.40 0.637 0.64620,999,077.29MERCEDES -BENZ AUTO REC TRUST31830 8,000,000.00587728AC0 03/16/2015 1,1700.85007/20/2011 8,006,232.00 0.841 0.8537,999,797.79USAA AUTO OWNER TRUST31388 6,083,038.3190327YAC6 02/18/2014 7791.54005/03/2011 6,098,424.75 0.426 0.4326,108,970.90VOLKSWAGEN AUTO LOAN ENHANCED31149 30,000,000.0092867DAC4 06/20/2015 1,2661.22003/30/2011 30,145,086.00 1.205 1.22229,997,399.29
Subtotal and Average 150,467,687.39 148,843,302.36 149,994,708.11 1.120 1.136 1,034
Municipal Bonds
CALIFORNIA ST POLL CONTROL FI32033 7,710,000.00130534XG0 06/01/2014 8825.90010/24/2011 8,597,806.50 1.085 1.1008,589,159.70COLORADO ST HSG & FIN AUTH32073 4,000,000.00196479UG2 05/01/2014 8511.15011/10/2011 3,999,160.00 1.342 1.3604,000,000.00UNIVERSITY CALIFORNIA REVS31851 19,000,000.0091412GFC4 07/01/2013 5470.88707/27/2011 19,032,870.00 0.874 0.88719,000,000.00
Subtotal and Average 31,589,159.70 30,710,000.00 31,629,836.50 0.991 1.005 676
Commercial Paper, Discount Notes
BARCLAYS U S FDG CORP32166 75,000,000.0006737HAA7 01/10/2012 90.14012/16/2011 74,996,332.50 0.140 0.14174,997,432.76BNP PARIBAS32192 75,000,000.000556N0A39 01/03/2012 20.12012/30/2011 75,000,000.00 0.119 0.12174,999,511.02CORPORATE ASSET FUNDING CO.32116 60,000,000.0012476EAQ2 01/24/2012 230.29011/29/2011 59,995,416.00 0.290 0.29459,989,128.96GENERAL ELECTRIC32124 98,000,000.0036959HHQ3 08/24/2012 2360.38011/30/2011 97,773,237.80 0.387 0.39297,755,099.74SALVATION ARMY32113 14,270,000.0079583RD30 04/03/2012 930.25011/28/2011 14,257,870.50 0.250 0.25314,260,935.59SHEFFIELD RECEIV32072 25,000,000.0082124LAH5 01/17/2012 160.34011/09/2011 24,998,187.50 0.340 0.34424,996,305.35TORONTO DOMINION31855 40,000,000.0089116EAT0 01/27/2012 260.29007/27/2011 39,997,520.00 0.296 0.30139,991,616.89TOYOTA MOTOR CREDIT31831 50,000,000.0089233GAD8 01/13/2012 120.29007/21/2011 49,999,100.00 0.290 0.29449,995,268.68TOYOTA MOTOR CREDIT31863 50,000,000.0089233GAP1 01/23/2012 220.30007/28/2011 49,997,890.00 0.300 0.30449,991,026.76TOYOTA MOTOR CREDIT32020 30,000,000.0089233GEP7 05/23/2012 1430.69010/06/2011 29,958,675.00 0.704 0.71429,917,254.77TOYOTA MOTOR CREDIT32101 40,000,000.0089233GHH2 08/17/2012 2290.68011/22/2011 39,899,132.00 0.692 0.70239,826,689.64U S BANK32160 150,000,000.009033E0A48 01/04/2012 30.05012/15/2011 149,996,880.00 0.050 0.050149,999,388.64
Subtotal and Average 706,719,658.80 707,270,000.00 706,870,241.30 0.261 0.265 61
Federal Agency, Discount Notes
FNMA DISCOUNT NOTE31651 25,000,000.00313588RX5 01/17/2012 160.15006/13/2011 24,999,800.00 0.152 0.15424,998,341.69
Subtotal and Average 24,998,341.69 25,000,000.00 24,999,800.00 0.153 0.155 16
Dreyfus Money Market Fund
Portfolio SCL2AP
Run Date: 01/26/2012 - 10:52 FI (PRF_FI) SymRept 6.42Report Ver. 5.00
December 31, 2011
Par ValueDays ToMaturity
MaturityDate
CurrentRateMarket Value
Fund C - COMMINGLED POOLInvestments by Fund Page 7
CUSIP Investment # IssuerPurchase
Date Book ValueYTM360
YTM365
Dreyfus Money Market Fund
DREYFUS CASH MANAGEMENT23519 236,670,098.91SYS23519 10.05002/01/2008 236,670,098.91 0.049 0.050236,670,098.91
Subtotal and Average 236,670,098.91 236,670,098.91 236,670,098.91 0.049 0.050 1
Other Money Market Funds
LOCAL AGENCY INVEST FUND8506 40,000,000.00SYS8506 10.37007/01/2004 40,066,079.88 0.364 0.37040,000,000.00MORGAN STANLEY PRIME INST #83031991 156,512,403.58SYS31991 10.11009/23/2011 156,512,403.58 0.108 0.110156,512,403.58
Subtotal and Average 196,512,403.58 196,512,403.58 196,578,483.46 0.161 0.163 1
Blackrock Money Market Fund
BLACKROCK MMK31920 160,777,578.67SYS31920 10.15008/24/2011 160,777,578.67 0.147 0.150160,777,578.67
Subtotal and Average 160,777,578.67 160,777,578.67 160,777,578.67 0.148 0.150 1
Total Investments and Average 4,567,454,458.44 4,544,369,277.80 4,580,107,293.81 0.702 0.711 450
Portfolio SCL2AP
Run Date: 01/26/2012 - 10:52 FI (PRF_FI) SymRept 6.42Report Ver. 5.00
SANTA CLARA COUNTY INVESTMENTSSANTA CLARA COUNTY
70 WEST HEDDINGEAST WING 6TH FLOOR
SAN JOSE, CA 95110
December 31, 2011
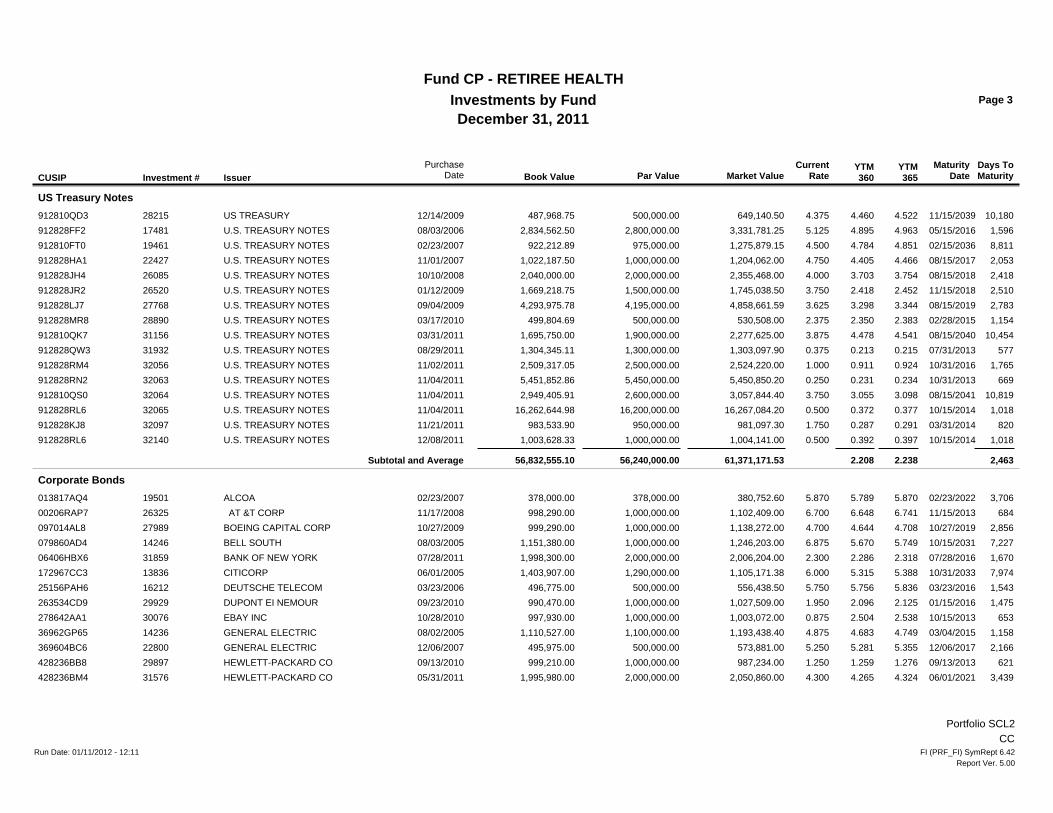
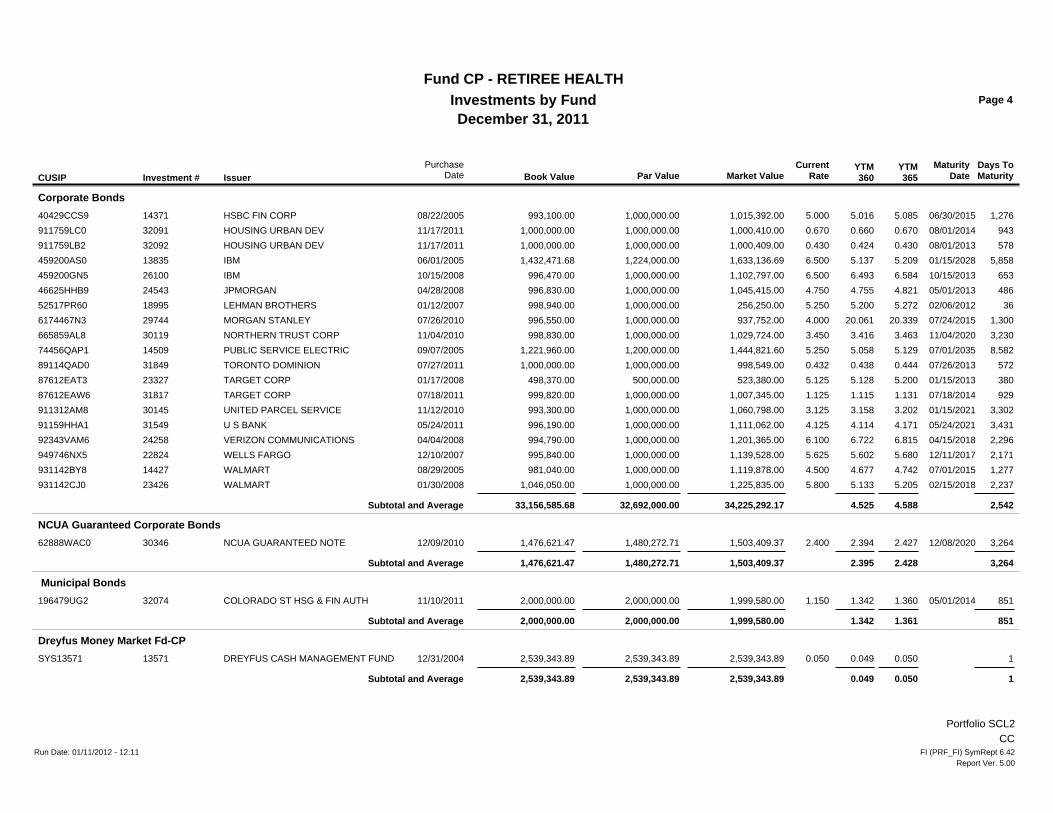
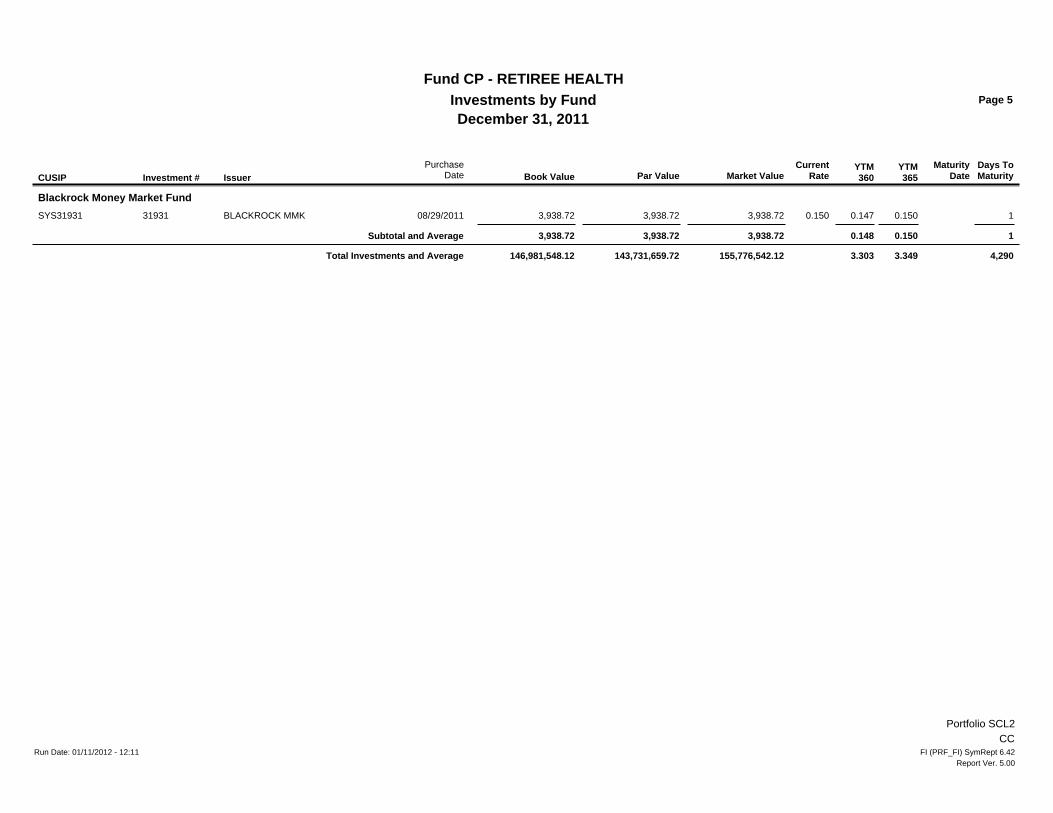
Fund CP - RETIREE HEALTHInvestments by Fund
Par ValueDays ToMaturity
MaturityDate
CurrentRateMarket ValueCUSIP Investment # Issuer
PurchaseDate Book Value
YTM360
YTM365
MBS
FHLMC 15 YR MBS31530 2,863,251.753128PUDN9 02/01/2026 5,1454.00005/20/2011 3,009,467.08 2.788 2.8272,983,597.80FHLMC 30 YR MBS13758 924,826.8531297QSX8 06/01/2035 8,5525.00005/12/2005 995,088.47 5.131 5.203915,145.07FHLMC 30 YR MBS13785 276,068.7831296SMB9 01/01/2034 8,0365.50005/12/2005 302,089.38 5.126 5.197279,045.15FHLMC 30 YR MBS13786 276,068.7731296SMB9 01/01/2034 8,0365.50005/12/2005 302,089.36 5.126 5.197279,045.14FHLMC 30 YR MBS13787 211,315.3231292H7J7 03/01/2034 8,0955.50005/12/2005 230,176.06 5.130 5.201213,593.56FHRR R005 AB15906 365,794.0031396HAN9 12/15/2018 2,5405.50002/17/2006 371,474.20 5.667 5.745364,022.19FNMA 15 YR MBS13695 490,117.4931406E2D5 03/01/2035 8,4604.50005/12/2005 522,577.89 5.018 5.088472,657.06FNMA 15 YR MBS13722 6,535.2331404WC79 07/01/2019 2,7385.00005/17/2005 7,059.67 4.748 4.8146,574.03FNMA 15 YR MBS13723 36,283.4231405HA24 07/01/2019 2,7385.00005/17/2005 39,195.10 4.902 4.97036,498.85FNMA 15 YR MBS13724 139,843.2731405FKM3 08/01/2019 2,7695.00005/17/2005 151,065.44 4.902 4.970140,673.59FNMA 15 YR MBS13725 6,902.0831402VHF0 09/01/2018 2,4355.00005/17/2005 7,495.86 4.902 4.9706,943.06FNMA 15 YR MBS13726 59,682.4531405FJR4 06/01/2019 2,7085.00005/17/2005 64,471.86 4.902 4.97060,036.82FNMA 15 YR MBS13727 133,943.7831405UEY1 01/01/2020 2,9225.00005/17/2005 144,692.52 4.902 4.970134,739.07FNMA 15 YR MBS13728 5,846.3331402VAT7 09/01/2018 2,4355.00005/17/2005 6,314.57 4.902 4.9705,881.04FNMA 15 YR MBS13729 48,355.2231402DEK2 12/01/2018 2,5265.00005/17/2005 52,228.08 4.902 4.97048,642.33FNMA 15 YR MBS13730 173,304.2631404WBY1 07/01/2019 2,7385.00005/17/2005 187,211.61 4.902 4.970174,333.25FNMA 15 YR MBS13731 72,678.7131405TLN0 11/01/2019 2,8615.00005/17/2005 78,511.04 4.902 4.97073,110.24FNMA 15 YR MBS13732 101,013.4331403V2Y4 02/01/2019 2,5885.00005/17/2005 109,119.57 4.902 4.970101,613.20FNMA 15 YR MBS14624 762,406.3331407RZ49 10/01/2020 3,1965.50009/19/2005 829,663.46 5.319 5.393777,416.20FNMA 15 YR MBS14625 46,166.1131402RJC4 06/01/2020 3,0746.00009/19/2005 49,687.49 5.740 5.81947,594.37FNMA 15 YR MBS14626 742,686.0731371MDH7 07/01/2020 3,1044.50009/19/2005 794,305.48 4.726 4.792732,126.00FNMA 30 YR MBS13675 36,683.2731405EB61 08/01/2034 8,2486.50005/12/2005 41,430.46 6.159 6.24538,179.26FNMA 30 YR MBS13676 66,670.0731405SUJ1 03/01/2035 8,4606.50005/12/2005 75,297.86 4.756 4.82369,388.96FNMA 30 YR MBS13677 1,151.1231379YSC8 08/01/2028 6,0576.50005/12/2005 1,315.91 4.756 4.8231,198.06FNMA 30 YR MBS13678 100,985.4031377Z3U4 02/01/2028 5,8756.50005/12/2005 115,358.34 4.756 4.823105,103.71FNMA 30 YR MBS13696 1,637,506.5031406YGL8 05/01/2035 8,5215.50005/12/2005 1,788,010.10 5.373 5.4481,653,113.99FNMA 30 YR MBS14585 697,717.1831402RDG1 04/01/2035 8,4916.00009/14/2005 777,761.27 5.792 5.872712,870.73FNMA 30 YR MBS20674 886,483.2131411WWN3 05/01/2037 9,2525.50005/14/2007 966,020.90 5.730 5.810876,648.79FNMA 30 YR MBS20675 1,146,015.7131407JFT4 10/01/2036 9,0406.50005/14/2007 1,287,159.27 5.844 5.9251,169,652.28FNMA 30 YR MBS20676 1,499,648.6331409HDV3 05/01/2036 8,8876.50005/14/2007 1,684,345.70 5.777 5.8571,530,578.88
Portfolio SCL2CC
Run Date: 01/11/2012 - 12:11 FI (PRF_FI) SymRept 6.42Report Ver. 5.00
December 31, 2011
Par ValueDays ToMaturity
MaturityDate
CurrentRateMarket Value
Fund CP - RETIREE HEALTHInvestments by Fund Page 2
CUSIP Investment # IssuerPurchase
Date Book ValueYTM360
YTM365
MBS
FNMA 30 YR MBS20677 57,300.8831407JFT4 10/01/2036 9,0406.50005/14/2007 64,358.07 5.844 5.92558,482.71FNMA 30 YR MBS20678 8,834.0131407FGG9 07/01/2035 8,5824.50005/14/2007 9,424.61 5.551 5.6288,306.73FNMA 30 YR MBS20679 13,552.9631407G6Z6 08/01/2035 8,6134.50005/14/2007 14,450.57 5.548 5.62512,744.02FNMA 30 YR MBS20680 308,537.3131407YRS0 10/01/2035 8,6744.50005/14/2007 328,971.69 5.541 5.618290,121.49FNMA 30 YR MBS20681 19,653.2431371MJ65 10/01/2035 8,6744.50005/14/2007 20,954.87 5.541 5.61818,480.19FNMA 30 YR MBS20682 23,733.6531407MZK4 09/01/2035 8,6444.50005/14/2007 25,305.53 5.544 5.62122,317.05FNMA 30 YR MBS20683 431,018.2531403CZL8 12/01/2035 8,7354.50005/14/2007 459,564.52 5.533 5.609405,291.85FNMA 30 YR MBS20754 1,347,206.4731409BDG9 03/01/2021 3,3475.50005/17/2007 1,463,526.85 5.413 5.4881,349,942.99FNMA 30 YR MBS20755 602,714.5031410WDM7 04/01/2022 3,7435.00005/17/2007 649,480.27 5.349 5.424594,144.65FNMA 30 YR MBS31514 1,013,089.0931410KH56 05/01/2038 9,6176.00005/19/2011 1,116,333.33 2.625 2.6621,117,880.49FNMA 30 YR MBS31515 4,469,153.7131412RBJ5 02/01/2040 10,2584.00005/19/2011 4,699,008.99 3.752 3.8044,506,862.19FNMA 30 YR MBS31516 1,218,835.8831416X5D8 05/01/2041 10,7134.50005/19/2011 1,298,035.64 3.584 3.6341,267,589.32FNMA 30 YR MBS31517 3,706,563.9836241KXL7 12/15/2038 9,8455.00005/19/2011 4,110,492.39 2.917 2.9574,016,409.56FNMA 30 YR MBS31518 4,264,364.8331412MSA7 05/01/2038 9,6175.50005/19/2011 4,646,975.28 2.752 2.7904,625,503.22FNMA 30 YR MBS31529 4,879,526.3831402RSN0 10/01/2035 8,6745.00005/20/2011 5,275,397.62 3.116 3.1605,205,844.71GNMA 30YR14347 566,184.5736292CCK8 08/15/2035 8,6275.00008/18/2005 629,721.07 5.023 5.093563,795.95GNMA 30YR14348 302,589.9036225B6K9 05/15/2034 8,1706.50008/18/2005 350,805.69 6.134 6.220316,206.44GNMA 30 YR31541 4,927,294.053620AMVL3 02/15/2041 10,6384.50005/23/2011 5,421,101.05 3.285 3.3315,213,693.02
Subtotal and Average 43,603,639.26 41,976,104.40 45,574,592.04 3.897 3.951 8,528
Federal Agency Bonds
FHLB NOTES28187 4,000,000.003133XMFY2 09/30/2022 3,9255.37512/11/2009 5,002,292.00 4.374 4.4354,364,000.00FHLMC NOTES26120 2,000,000.003137EAAS8 04/18/2017 1,9345.00010/17/2008 2,372,000.00 4.904 4.9732,003,700.00FNMA NOTES14207 600,000.0031359MGK3 11/15/2030 6,8936.62507/28/2005 888,691.80 4.815 4.882750,924.00FNMA NOTES14209 200,000.0031359MGK3 11/15/2030 6,8936.62507/28/2005 296,230.60 4.817 4.884250,240.00
Subtotal and Average 7,368,864.00 6,800,000.00 8,559,214.40 4.579 4.642 3,786
US Treasury Notes
US TREASURY13674 5,070,000.00912828DM9 02/15/2015 1,1414.00005/12/2005 5,630,868.75 4.118 4.1754,999,099.22US TREASURY13784 1,300,000.00912810FP8 02/15/2031 6,9855.37505/24/2005 1,852,905.60 4.316 4.3761,499,062.50US TREASURY14770 2,500,000.00912828DV9 05/15/2015 1,2304.12510/13/2005 2,804,492.19 4.441 4.5032,426,953.13US TREASURY15505 2,000,000.00912828EE6 08/15/2015 1,3224.25012/30/2005 2,266,406.00 4.336 4.3971,977,031.25
Portfolio SCL2CC
Run Date: 01/11/2012 - 12:11 FI (PRF_FI) SymRept 6.42Report Ver. 5.00
December 31, 2011
Par ValueDays ToMaturity
MaturityDate
CurrentRateMarket Value
Fund CP - RETIREE HEALTHInvestments by Fund Page 3
CUSIP Investment # IssuerPurchase
Date Book ValueYTM360
YTM365
US Treasury Notes
US TREASURY28215 500,000.00912810QD3 11/15/2039 10,1804.37512/14/2009 649,140.50 4.460 4.522487,968.75U.S. TREASURY NOTES17481 2,800,000.00912828FF2 05/15/2016 1,5965.12508/03/2006 3,331,781.25 4.895 4.9632,834,562.50U.S. TREASURY NOTES19461 975,000.00912810FT0 02/15/2036 8,8114.50002/23/2007 1,275,879.15 4.784 4.851922,212.89U.S. TREASURY NOTES22427 1,000,000.00912828HA1 08/15/2017 2,0534.75011/01/2007 1,204,062.00 4.405 4.4661,022,187.50U.S. TREASURY NOTES26085 2,000,000.00912828JH4 08/15/2018 2,4184.00010/10/2008 2,355,468.00 3.703 3.7542,040,000.00U.S. TREASURY NOTES26520 1,500,000.00912828JR2 11/15/2018 2,5103.75001/12/2009 1,745,038.50 2.418 2.4521,669,218.75U.S. TREASURY NOTES27768 4,195,000.00912828LJ7 08/15/2019 2,7833.62509/04/2009 4,858,661.59 3.298 3.3444,293,975.78U.S. TREASURY NOTES28890 500,000.00912828MR8 02/28/2015 1,1542.37503/17/2010 530,508.00 2.350 2.383499,804.69U.S. TREASURY NOTES31156 1,900,000.00912810QK7 08/15/2040 10,4543.87503/31/2011 2,277,625.00 4.478 4.5411,695,750.00U.S. TREASURY NOTES31932 1,300,000.00912828QW3 07/31/2013 5770.37508/29/2011 1,303,097.90 0.213 0.2151,304,345.11U.S. TREASURY NOTES32056 2,500,000.00912828RM4 10/31/2016 1,7651.00011/02/2011 2,524,220.00 0.911 0.9242,509,317.05U.S. TREASURY NOTES32063 5,450,000.00912828RN2 10/31/2013 6690.25011/04/2011 5,450,850.20 0.231 0.2345,451,852.86U.S. TREASURY NOTES32064 2,600,000.00912810QS0 08/15/2041 10,8193.75011/04/2011 3,057,844.40 3.055 3.0982,949,405.91U.S. TREASURY NOTES32065 16,200,000.00912828RL6 10/15/2014 1,0180.50011/04/2011 16,267,084.20 0.372 0.37716,262,644.98U.S. TREASURY NOTES32097 950,000.00912828KJ8 03/31/2014 8201.75011/21/2011 981,097.30 0.287 0.291983,533.90U.S. TREASURY NOTES32140 1,000,000.00912828RL6 10/15/2014 1,0180.50012/08/2011 1,004,141.00 0.392 0.3971,003,628.33
Subtotal and Average 56,832,555.10 56,240,000.00 61,371,171.53 2.208 2.238 2,463
Corporate Bonds
ALCOA19501 378,000.00013817AQ4 02/23/2022 3,7065.87002/23/2007 380,752.60 5.789 5.870378,000.00 AT &T CORP26325 1,000,000.0000206RAP7 11/15/2013 6846.70011/17/2008 1,102,409.00 6.648 6.741998,290.00BOEING CAPITAL CORP27989 1,000,000.00097014AL8 10/27/2019 2,8564.70010/27/2009 1,138,272.00 4.644 4.708999,290.00BELL SOUTH14246 1,000,000.00079860AD4 10/15/2031 7,2276.87508/03/2005 1,246,203.00 5.670 5.7491,151,380.00BANK OF NEW YORK31859 2,000,000.0006406HBX6 07/28/2016 1,6702.30007/28/2011 2,006,204.00 2.286 2.3181,998,300.00CITICORP13836 1,290,000.00172967CC3 10/31/2033 7,9746.00006/01/2005 1,105,171.38 5.315 5.3881,403,907.00DEUTSCHE TELECOM16212 500,000.0025156PAH6 03/23/2016 1,5435.75003/23/2006 556,438.50 5.756 5.836496,775.00DUPONT EI NEMOUR29929 1,000,000.00263534CD9 01/15/2016 1,4751.95009/23/2010 1,027,509.00 2.096 2.125990,470.00EBAY INC30076 1,000,000.00278642AA1 10/15/2013 6530.87510/28/2010 1,003,072.00 2.504 2.538997,930.00GENERAL ELECTRIC14236 1,100,000.0036962GP65 03/04/2015 1,1584.87508/02/2005 1,193,438.40 4.683 4.7491,110,527.00GENERAL ELECTRIC22800 500,000.00369604BC6 12/06/2017 2,1665.25012/06/2007 573,881.00 5.281 5.355495,975.00HEWLETT-PACKARD CO29897 1,000,000.00428236BB8 09/13/2013 6211.25009/13/2010 987,234.00 1.259 1.276999,210.00HEWLETT-PACKARD CO31576 2,000,000.00428236BM4 06/01/2021 3,4394.30005/31/2011 2,050,860.00 4.265 4.3241,995,980.00
Portfolio SCL2CC
Run Date: 01/11/2012 - 12:11 FI (PRF_FI) SymRept 6.42Report Ver. 5.00
December 31, 2011
Par ValueDays ToMaturity
MaturityDate
CurrentRateMarket Value
Fund CP - RETIREE HEALTHInvestments by Fund Page 4
CUSIP Investment # IssuerPurchase
Date Book ValueYTM360
YTM365
Corporate Bonds
HSBC FIN CORP14371 1,000,000.0040429CCS9 06/30/2015 1,2765.00008/22/2005 1,015,392.00 5.016 5.085993,100.00HOUSING URBAN DEV32091 1,000,000.00911759LC0 08/01/2014 9430.67011/17/2011 1,000,410.00 0.660 0.6701,000,000.00HOUSING URBAN DEV32092 1,000,000.00911759LB2 08/01/2013 5780.43011/17/2011 1,000,409.00 0.424 0.4301,000,000.00IBM13835 1,224,000.00459200AS0 01/15/2028 5,8586.50006/01/2005 1,633,136.69 5.137 5.2091,432,471.68IBM26100 1,000,000.00459200GN5 10/15/2013 6536.50010/15/2008 1,102,797.00 6.493 6.584996,470.00JPMORGAN24543 1,000,000.0046625HHB9 05/01/2013 4864.75004/28/2008 1,045,415.00 4.755 4.821996,830.00LEHMAN BROTHERS18995 1,000,000.0052517PR60 02/06/2012 365.25001/12/2007 256,250.00 5.200 5.272998,940.00MORGAN STANLEY29744 1,000,000.006174467N3 07/24/2015 1,3004.00007/26/2010 937,752.00 20.061 20.339996,550.00NORTHERN TRUST CORP30119 1,000,000.00665859AL8 11/04/2020 3,2303.45011/04/2010 1,029,724.00 3.416 3.463998,830.00PUBLIC SERVICE ELECTRIC14509 1,200,000.0074456QAP1 07/01/2035 8,5825.25009/07/2005 1,444,821.60 5.058 5.1291,221,960.00TORONTO DOMINION31849 1,000,000.0089114QAD0 07/26/2013 5720.43207/27/2011 998,549.00 0.438 0.4441,000,000.00TARGET CORP23327 500,000.0087612EAT3 01/15/2013 3805.12501/17/2008 523,380.00 5.128 5.200498,370.00TARGET CORP31817 1,000,000.0087612EAW6 07/18/2014 9291.12507/18/2011 1,007,345.00 1.115 1.131999,820.00UNITED PARCEL SERVICE30145 1,000,000.00911312AM8 01/15/2021 3,3023.12511/12/2010 1,060,798.00 3.158 3.202993,300.00U S BANK31549 1,000,000.0091159HHA1 05/24/2021 3,4314.12505/24/2011 1,111,062.00 4.114 4.171996,190.00VERIZON COMMUNICATIONS24258 1,000,000.0092343VAM6 04/15/2018 2,2966.10004/04/2008 1,201,365.00 6.722 6.815994,790.00WELLS FARGO22824 1,000,000.00949746NX5 12/11/2017 2,1715.62512/10/2007 1,139,528.00 5.602 5.680995,840.00WALMART14427 1,000,000.00931142BY8 07/01/2015 1,2774.50008/29/2005 1,119,878.00 4.677 4.742981,040.00WALMART23426 1,000,000.00931142CJ0 02/15/2018 2,2375.80001/30/2008 1,225,835.00 5.133 5.2051,046,050.00
Subtotal and Average 33,156,585.68 32,692,000.00 34,225,292.17 4.525 4.588 2,542
NCUA Guaranteed Corporate Bonds
NCUA GUARANTEED NOTE30346 1,480,272.7162888WAC0 12/08/2020 3,2642.40012/09/2010 1,503,409.37 2.394 2.4271,476,621.47
Subtotal and Average 1,476,621.47 1,480,272.71 1,503,409.37 2.395 2.428 3,264
Municipal Bonds
COLORADO ST HSG & FIN AUTH32074 2,000,000.00196479UG2 05/01/2014 8511.15011/10/2011 1,999,580.00 1.342 1.3602,000,000.00
Subtotal and Average 2,000,000.00 2,000,000.00 1,999,580.00 1.342 1.361 851
Dreyfus Money Market Fd-CP
DREYFUS CASH MANAGEMENT FUND13571 2,539,343.89SYS13571 10.05012/31/2004 2,539,343.89 0.049 0.0502,539,343.89
Subtotal and Average 2,539,343.89 2,539,343.89 2,539,343.89 0.049 0.050 1
Portfolio SCL2CC
Run Date: 01/11/2012 - 12:11 FI (PRF_FI) SymRept 6.42Report Ver. 5.00
December 31, 2011
Par ValueDays ToMaturity
MaturityDate
CurrentRateMarket Value
Fund CP - RETIREE HEALTHInvestments by Fund Page 5
CUSIP Investment # IssuerPurchase
Date Book ValueYTM360
YTM365
Blackrock Money Market Fund
BLACKROCK MMK31931 3,938.72SYS31931 10.15008/29/2011 3,938.72 0.147 0.1503,938.72
Subtotal and Average 3,938.72 3,938.72 3,938.72 0.148 0.150 1
Total Investments and Average 146,981,548.12 143,731,659.72 155,776,542.12 3.303 3.349 4,290
Portfolio SCL2CC
Run Date: 01/11/2012 - 12:11 FI (PRF_FI) SymRept 6.42Report Ver. 5.00
SANTA CLARA COUNTY
VANGUARD INDEX 500 VANGUARD MID CAP VANGUARD SMALL CAP
BOOK SHARES MARKET VALUE BOOK SHARES MARKET VALUE BOOK SHARES MARKET VALUE
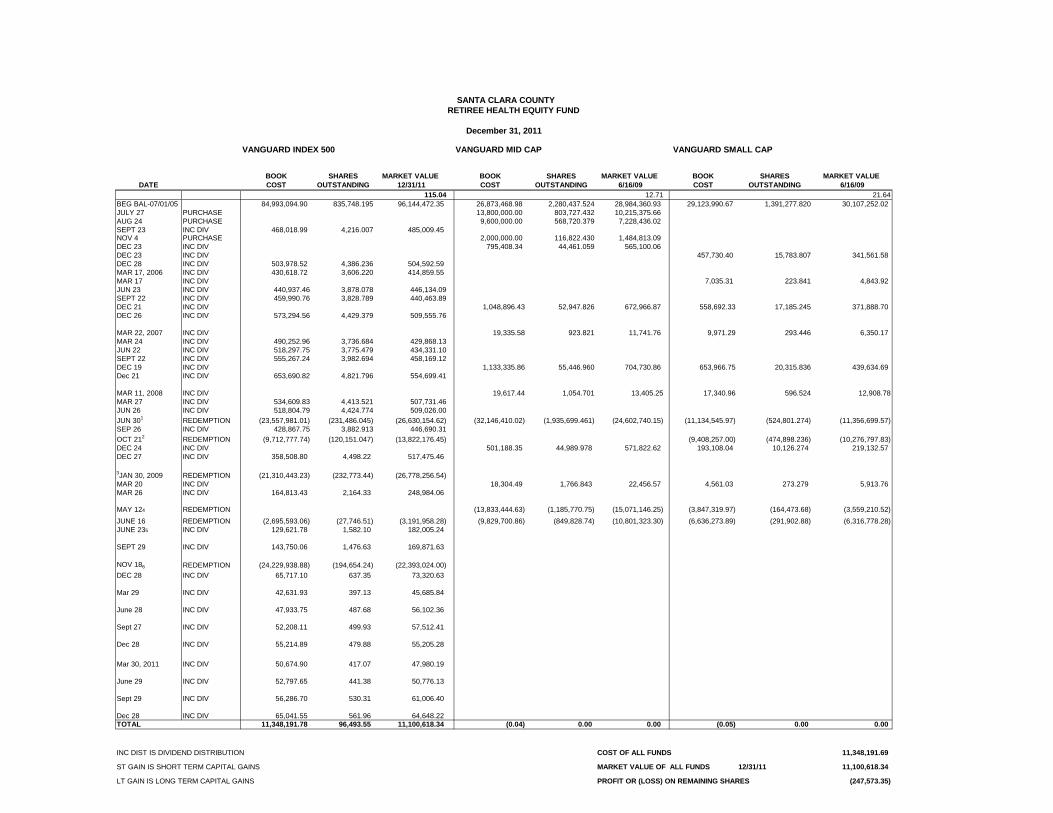
DATE COST OUTSTANDING 12/31/11 COST OUTSTANDING 6/16/09 COST OUTSTANDING 6/16/09115.04 12.71 21.64
BEG BAL-07/01/05 84,993,094.90 835,748.195 96,144,472.35 26,873,468.98 2,280,437.524 28,984,360.93 29,123,990.67 1,391,277.820 30,107,252.02JULY 27 PURCHASE 13,800,000.00 803,727.432 10,215,375.66 AUG 24 PURCHASE 9,600,000.00 568,720.379 7,228,436.02 SEPT 23 INC DIV 468,018.99 4,216.007 485,009.45 NOV 4 PURCHASE 2,000,000.00 116,822.430 1,484,813.09DEC 23 INC DIV 795,408.34 44,461.059 565,100.06 DEC 23 INC DIV 457,730.40 15,783.807 341,561.58DEC 28 INC DIV 503,978.52 4,386.236 504,592.59 MAR 17, 2006 INC DIV 430,618.72 3,606.220 414,859.55 MAR 17 INC DIV 7,035.31 223.841 4,843.92JUN 23 INC DIV 440,937.46 3,878.078 446,134.09 SEPT 22 INC DIV 459,990.76 3,828.789 440,463.89 DEC 21 INC DIV 1,048,896.43 52,947.826 672,966.87 558,692.33 17,185.245 371,888.70DEC 26 INC DIV 573,294.56 4,429.379 509,555.76
MAR 22, 2007 INC DIV 19,335.58 923.821 11,741.76 9,971.29 293.446 6,350.17MAR 24 INC DIV 490,252.96 3,736.684 429,868.13 JUN 22 INC DIV 518,297.75 3,775.479 434,331.10 SEPT 22 INC DIV 555,267.24 3,982.694 458,169.12 DEC 19 INC DIV 1,133,335.86 55,446.960 704,730.86 653,966.75 20,315.836 439,634.69Dec 21 INC DIV 653,690.82 4,821.796 554,699.41
MAR 11, 2008 INC DIV 19,617.44 1,054.701 13,405.25 17,340.96 596.524 12,908.78MAR 27 INC DIV 534,609.83 4,413.521 507,731.46 JUN 26 INC DIV 518,804.79 4,424.774 509,026.00
JUN 301 REDEMPTION (23,557,981.01) (231,486.045) (26,630,154.62) (32,146,410.02) (1,935,699.461) (24,602,740.15) (11,134,545.97) (524,801.274) (11,356,699.57)SEP 26 INC DIV 428,867.75 3,882.913 446,690.31
OCT 212 REDEMPTION (9,712,777.74) (120,151.047) (13,822,176.45) (9,408,257.00) (474,898.236) (10,276,797.83)DEC 24 INC DIV 501,188.35 44,989.978 571,822.62 193,108.04 10,126.274 219,132.57DEC 27 INC DIV 358,508.80 4,498.22 517,475.46
3JAN 30, 2009 REDEMPTION (21,310,443.23) (232,773.44) (26,778,256.54)MAR 20 INC DIV 18,304.49 1,766.843 22,456.57 4,561.03 273.279 5,913.76MAR 26 INC DIV 164,813.43 2,164.33 248,984.06
MAY 124 REDEMPTION (13,833,444.63) (1,185,770.75) (15,071,146.25) (3,847,319.97) (164,473.68) (3,559,210.52)
JUNE 16 REDEMPTION (2,695,593.06) (27,746.51) (3,191,958.28) (9,829,700.86) (849,828.74) (10,801,323.30) (6,636,273.89) (291,902.88) (6,316,778.28)JUNE 235 INC DIV 129,621.78 1,582.10 182,005.24
SEPT 29 INC DIV 143,750.06 1,476.63 169,871.63
NOV 186 REDEMPTION (24,229,938.88) (194,654.24) (22,393,024.00)
DEC 28 INC DIV 65,717.10 637.35 73,320.63
Mar 29 INC DIV 42,631.93 397.13 45,685.84
June 28 INC DIV 47,933.75 487.68 56,102.36
Sept 27 INC DIV 52,208.11 499.93 57,512.41
Dec 28 INC DIV 55,214.89 479.88 55,205.28
Mar 30, 2011 INC DIV 50,674.90 417.07 47,980.19
June 29 INC DIV 52,797.65 441.38 50,776.13
Sept 29 INC DIV 56,286.70 530.31 61,006.40
Dec 28 INC DIV 65,041.55 561.96 64,648.22TOTAL 11,348,191.78 96,493.55 11,100,618.34 (0.04) 0.00 0.00 (0.05) 0.00 0.00
INC DIST IS DIVIDEND DISTRIBUTION COST OF ALL FUNDS 11,348,191.69
ST GAIN IS SHORT TERM CAPITAL GAINS MARKET VALUE OF ALL FUNDS 12/31/11 11,100,618.34
LT GAIN IS LONG TERM CAPITAL GAINS PROFIT OR (LOSS) ON REMAINING SHARES (247,573.35)
RETIREE HEALTH EQUITY FUND
December 31, 2011
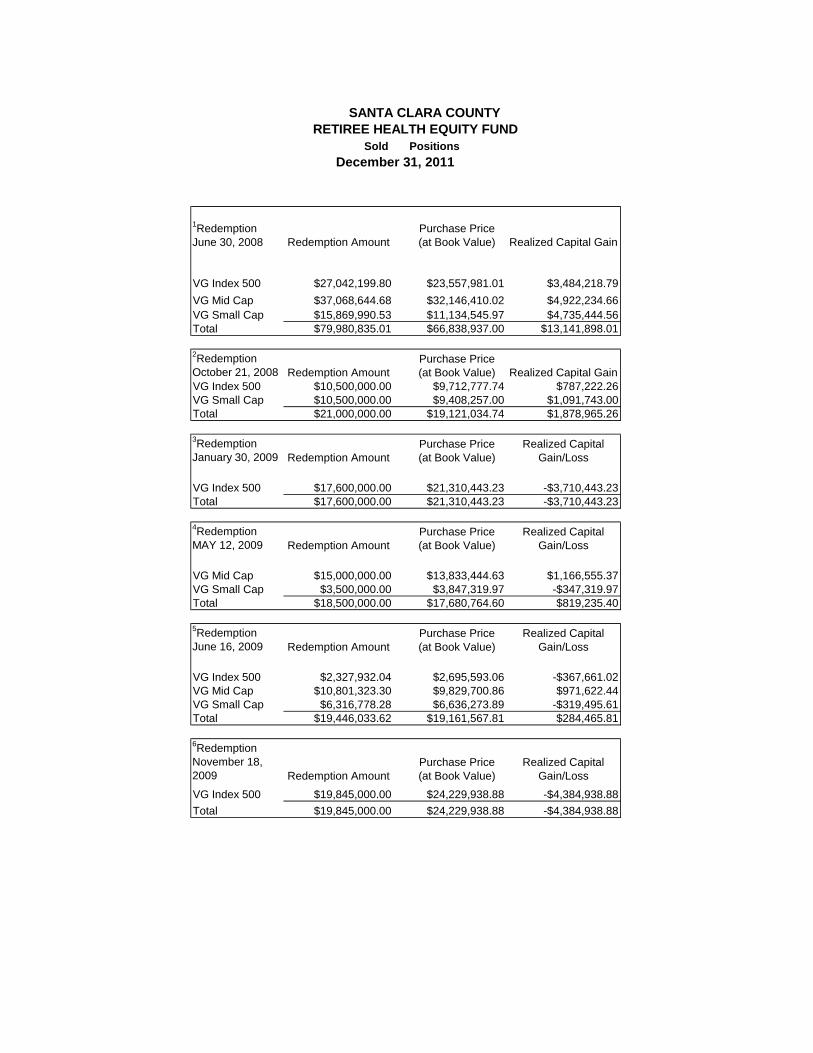
SANTA CLARA COUNTY RETIREE HEALTH EQUITY FUND
Sold Positions
1Redemption June 30, 2008 Redemption Amount
Purchase Price (at Book Value) Realized Capital Gain
VG Index 500 $27,042,199.80 $23,557,981.01 $3,484,218.79
VG Mid Cap $37,068,644.68 $32,146,410.02 $4,922,234.66VG Small Cap $15,869,990.53 $11,134,545.97 $4,735,444.56Total $79,980,835.01 $66,838,937.00 $13,141,898.01
2Redemption October 21, 2008 Redemption Amount
Purchase Price (at Book Value) Realized Capital Gain
VG Index 500 $10,500,000.00 $9,712,777.74 $787,222.26VG Small Cap $10,500,000.00 $9,408,257.00 $1,091,743.00Total $21,000,000.00 $19,121,034.74 $1,878,965.26
3Redemption January 30, 2009 Redemption Amount
Purchase Price (at Book Value)
Realized Capital Gain/Loss
VG Index 500 $17,600,000.00 $21,310,443.23 -$3,710,443.23Total $17,600,000.00 $21,310,443.23 -$3,710,443.23
4Redemption MAY 12, 2009 Redemption Amount
Purchase Price (at Book Value)
Realized Capital Gain/Loss
VG Mid Cap $15,000,000.00 $13,833,444.63 $1,166,555.37VG Small Cap $3,500,000.00 $3,847,319.97 -$347,319.97Total $18,500,000.00 $17,680,764.60 $819,235.40
5Redemption June 16, 2009 Redemption Amount
Purchase Price (at Book Value)
Realized Capital Gain/Loss
VG Index 500 $2,327,932.04 $2,695,593.06 -$367,661.02VG Mid Cap $10,801,323.30 $9,829,700.86 $971,622.44VG Small Cap $6,316,778.28 $6,636,273.89 -$319,495.61Total $19,446,033.62 $19,161,567.81 $284,465.81
6Redemption November 18, 2009 Redemption Amount
Purchase Price (at Book Value)
Realized Capital Gain/Loss
VG Index 500 $19,845,000.00 $24,229,938.88 -$4,384,938.88
Total $19,845,000.00 $24,229,938.88 -$4,384,938.88
December 31, 2011
December 31, 2011
Par ValueDays ToMaturity
MaturityDate
CurrentRateMarket Value
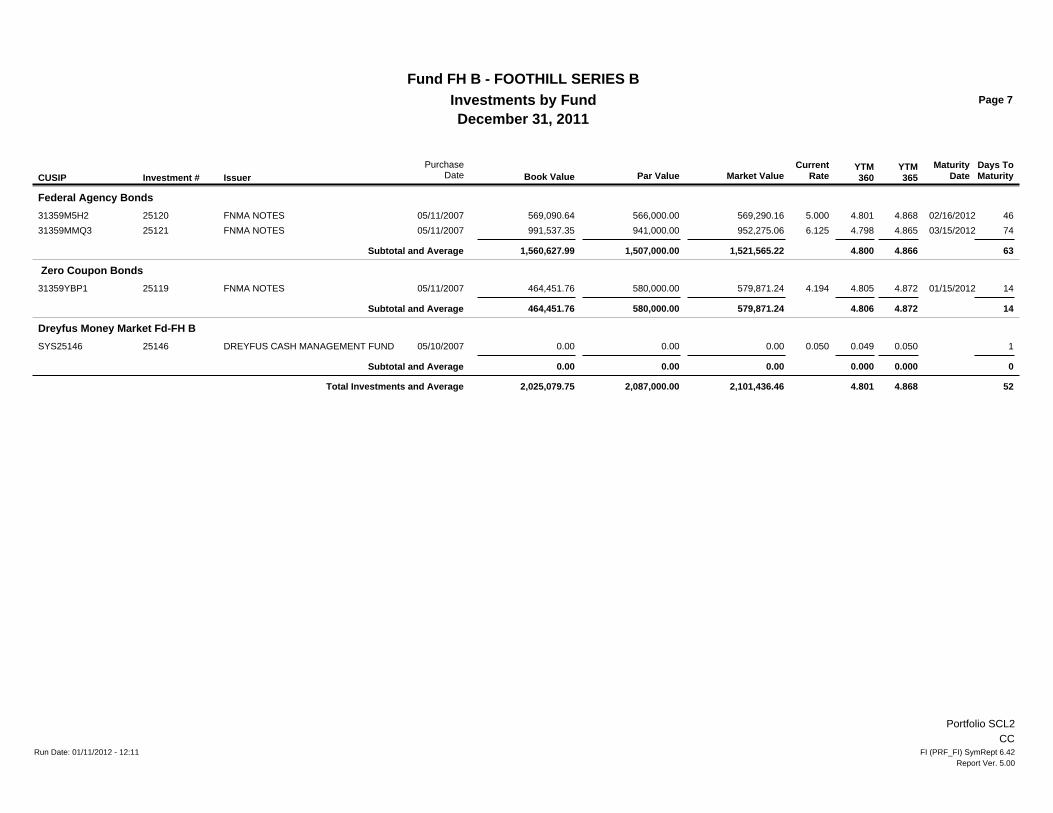
Fund FH B - FOOTHILL SERIES BInvestments by Fund Page 7
CUSIP Investment # IssuerPurchase
Date Book ValueYTM360
YTM365
Federal Agency Bonds
FNMA NOTES25120 566,000.0031359M5H2 02/16/2012 465.00005/11/2007 569,290.16 4.801 4.868569,090.64FNMA NOTES25121 941,000.0031359MMQ3 03/15/2012 746.12505/11/2007 952,275.06 4.798 4.865991,537.35
Subtotal and Average 1,560,627.99 1,507,000.00 1,521,565.22 4.800 4.866 63
Zero Coupon Bonds
FNMA NOTES25119 580,000.0031359YBP1 01/15/2012 144.19405/11/2007 579,871.24 4.805 4.872464,451.76
Subtotal and Average 464,451.76 580,000.00 579,871.24 4.806 4.872 14
Dreyfus Money Market Fd-FH B
DREYFUS CASH MANAGEMENT FUND25146 0.00SYS25146 10.05005/10/2007 0.00 0.049 0.0500.00
Subtotal and Average 0.00 0.00 0.00 0.000 0.000 0
Total Investments and Average 2,025,079.75 2,087,000.00 2,101,436.46 4.801 4.868 52
Portfolio SCL2CC
Run Date: 01/11/2012 - 12:11 FI (PRF_FI) SymRept 6.42Report Ver. 5.00
December 31, 2011
Par ValueDays ToMaturity
MaturityDate
CurrentRateMarket Value
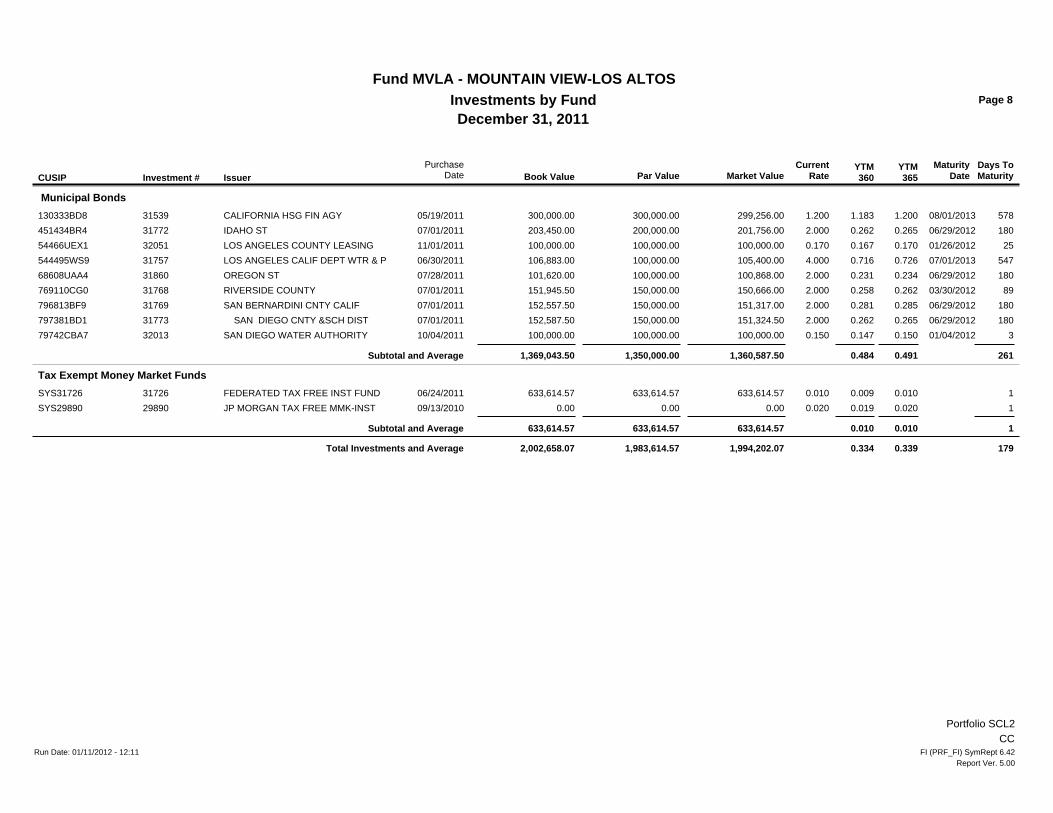
Fund MVLA - MOUNTAIN VIEW-LOS ALTOSInvestments by Fund Page 8
CUSIP Investment # IssuerPurchase
Date Book ValueYTM360
YTM365
Municipal Bonds
CALIFORNIA HSG FIN AGY31539 300,000.00130333BD8 08/01/2013 5781.20005/19/2011 299,256.00 1.183 1.200300,000.00IDAHO ST31772 200,000.00451434BR4 06/29/2012 1802.00007/01/2011 201,756.00 0.262 0.265203,450.00LOS ANGELES COUNTY LEASING32051 100,000.0054466UEX1 01/26/2012 250.17011/01/2011 100,000.00 0.167 0.170100,000.00LOS ANGELES CALIF DEPT WTR & P31757 100,000.00544495WS9 07/01/2013 5474.00006/30/2011 105,400.00 0.716 0.726106,883.00OREGON ST31860 100,000.0068608UAA4 06/29/2012 1802.00007/28/2011 100,868.00 0.231 0.234101,620.00RIVERSIDE COUNTY31768 150,000.00769110CG0 03/30/2012 892.00007/01/2011 150,666.00 0.258 0.262151,945.50SAN BERNARDINI CNTY CALIF31769 150,000.00796813BF9 06/29/2012 1802.00007/01/2011 151,317.00 0.281 0.285152,557.50 SAN DIEGO CNTY &SCH DIST31773 150,000.00797381BD1 06/29/2012 1802.00007/01/2011 151,324.50 0.262 0.265152,587.50SAN DIEGO WATER AUTHORITY32013 100,000.0079742CBA7 01/04/2012 30.15010/04/2011 100,000.00 0.147 0.150100,000.00
Subtotal and Average 1,369,043.50 1,350,000.00 1,360,587.50 0.484 0.491 261
Tax Exempt Money Market Funds
FEDERATED TAX FREE INST FUND31726 633,614.57SYS31726 10.01006/24/2011 633,614.57 0.009 0.010633,614.57JP MORGAN TAX FREE MMK-INST29890 0.00SYS29890 10.02009/13/2010 0.00 0.019 0.0200.00
Subtotal and Average 633,614.57 633,614.57 633,614.57 0.010 0.010 1
Total Investments and Average 2,002,658.07 1,983,614.57 1,994,202.07 0.334 0.339 179
Portfolio SCL2CC
Run Date: 01/11/2012 - 12:11 FI (PRF_FI) SymRept 6.42Report Ver. 5.00
December 31, 2011
Par ValueDays ToMaturity
MaturityDate
CurrentRateMarket Value
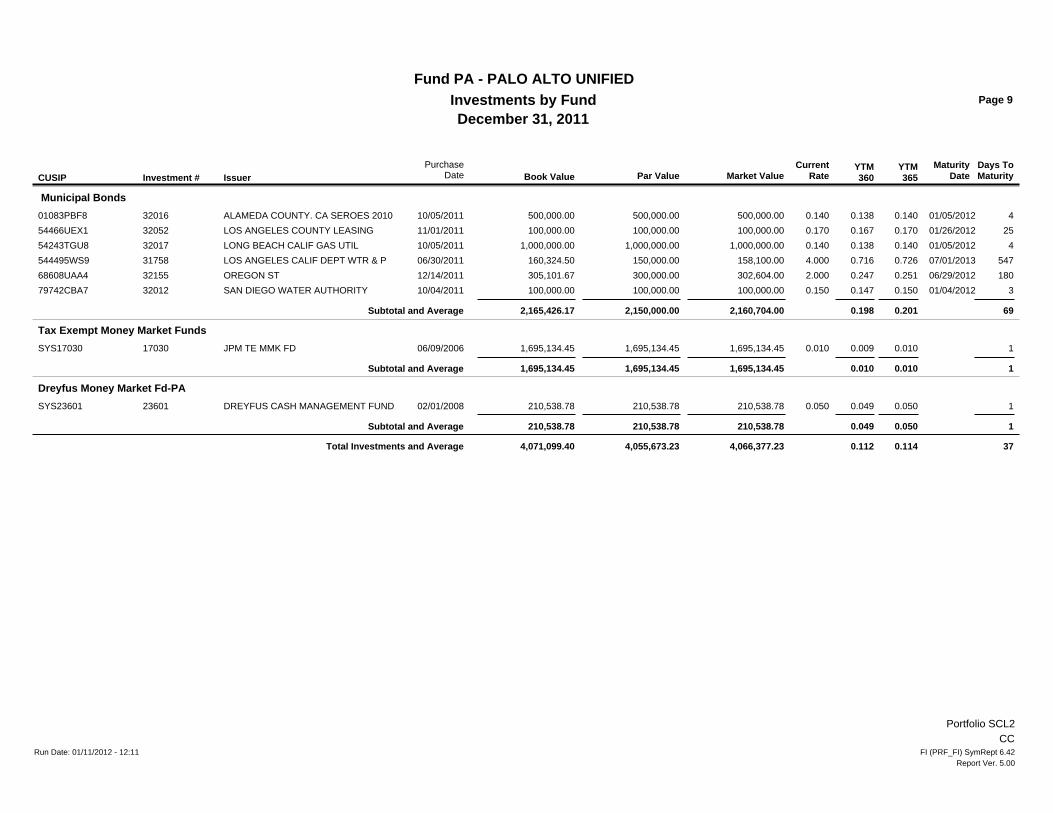
Fund PA - PALO ALTO UNIFIEDInvestments by Fund Page 9
CUSIP Investment # IssuerPurchase
Date Book ValueYTM360
YTM365
Municipal Bonds
ALAMEDA COUNTY. CA SEROES 201032016 500,000.0001083PBF8 01/05/2012 40.14010/05/2011 500,000.00 0.138 0.140500,000.00LOS ANGELES COUNTY LEASING32052 100,000.0054466UEX1 01/26/2012 250.17011/01/2011 100,000.00 0.167 0.170100,000.00LONG BEACH CALIF GAS UTIL32017 1,000,000.0054243TGU8 01/05/2012 40.14010/05/2011 1,000,000.00 0.138 0.1401,000,000.00LOS ANGELES CALIF DEPT WTR & P31758 150,000.00544495WS9 07/01/2013 5474.00006/30/2011 158,100.00 0.716 0.726160,324.50OREGON ST32155 300,000.0068608UAA4 06/29/2012 1802.00012/14/2011 302,604.00 0.247 0.251305,101.67SAN DIEGO WATER AUTHORITY32012 100,000.0079742CBA7 01/04/2012 30.15010/04/2011 100,000.00 0.147 0.150100,000.00
Subtotal and Average 2,165,426.17 2,150,000.00 2,160,704.00 0.198 0.201 69
Tax Exempt Money Market Funds
JPM TE MMK FD17030 1,695,134.45SYS17030 10.01006/09/2006 1,695,134.45 0.009 0.0101,695,134.45
Subtotal and Average 1,695,134.45 1,695,134.45 1,695,134.45 0.010 0.010 1
Dreyfus Money Market Fd-PA
DREYFUS CASH MANAGEMENT FUND23601 210,538.78SYS23601 10.05002/01/2008 210,538.78 0.049 0.050210,538.78
Subtotal and Average 210,538.78 210,538.78 210,538.78 0.049 0.050 1
Total Investments and Average 4,071,099.40 4,055,673.23 4,066,377.23 0.112 0.114 37
Portfolio SCL2CC
Run Date: 01/11/2012 - 12:11 FI (PRF_FI) SymRept 6.42Report Ver. 5.00
December 31, 2011
Par ValueDays ToMaturity
MaturityDate
CurrentRateMarket Value
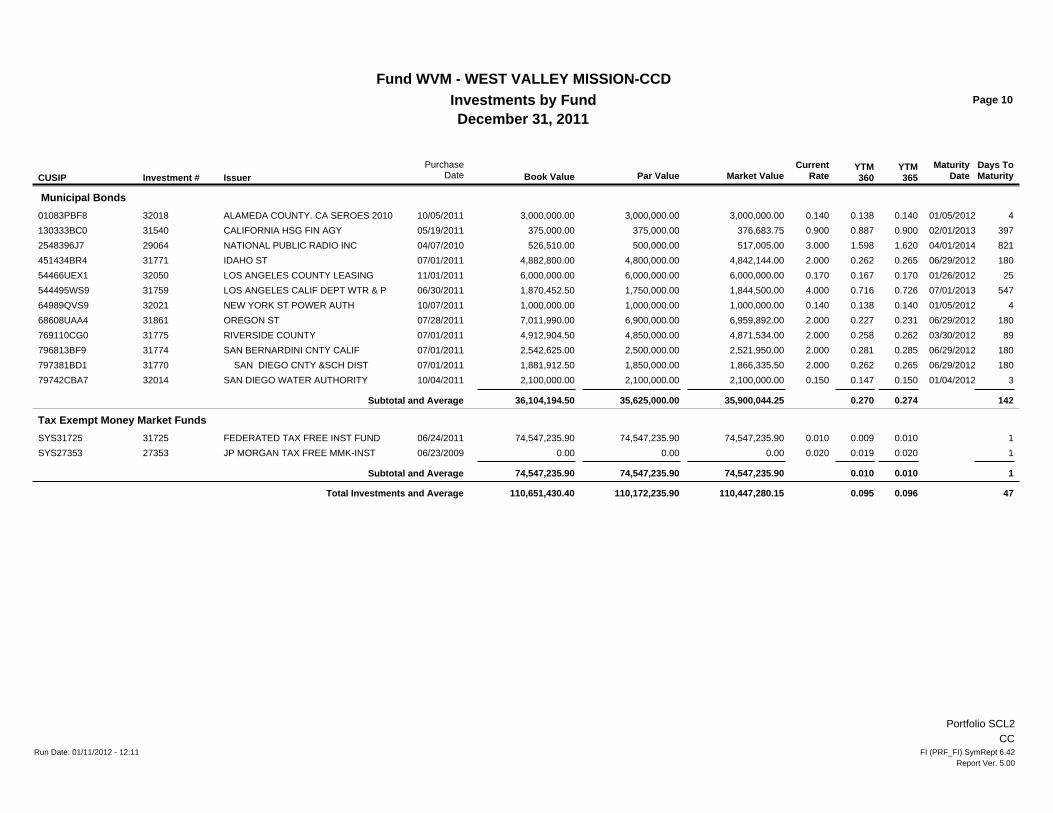
Fund WVM - WEST VALLEY MISSION-CCDInvestments by Fund Page 10
CUSIP Investment # IssuerPurchase
Date Book ValueYTM360
YTM365
Municipal Bonds
ALAMEDA COUNTY. CA SEROES 201032018 3,000,000.0001083PBF8 01/05/2012 40.14010/05/2011 3,000,000.00 0.138 0.1403,000,000.00CALIFORNIA HSG FIN AGY31540 375,000.00130333BC0 02/01/2013 3970.90005/19/2011 376,683.75 0.887 0.900375,000.00NATIONAL PUBLIC RADIO INC29064 500,000.002548396J7 04/01/2014 8213.00004/07/2010 517,005.00 1.598 1.620526,510.00IDAHO ST31771 4,800,000.00451434BR4 06/29/2012 1802.00007/01/2011 4,842,144.00 0.262 0.2654,882,800.00LOS ANGELES COUNTY LEASING32050 6,000,000.0054466UEX1 01/26/2012 250.17011/01/2011 6,000,000.00 0.167 0.1706,000,000.00LOS ANGELES CALIF DEPT WTR & P31759 1,750,000.00544495WS9 07/01/2013 5474.00006/30/2011 1,844,500.00 0.716 0.7261,870,452.50NEW YORK ST POWER AUTH32021 1,000,000.0064989QVS9 01/05/2012 40.14010/07/2011 1,000,000.00 0.138 0.1401,000,000.00OREGON ST31861 6,900,000.0068608UAA4 06/29/2012 1802.00007/28/2011 6,959,892.00 0.227 0.2317,011,990.00RIVERSIDE COUNTY31775 4,850,000.00769110CG0 03/30/2012 892.00007/01/2011 4,871,534.00 0.258 0.2624,912,904.50SAN BERNARDINI CNTY CALIF31774 2,500,000.00796813BF9 06/29/2012 1802.00007/01/2011 2,521,950.00 0.281 0.2852,542,625.00 SAN DIEGO CNTY &SCH DIST31770 1,850,000.00797381BD1 06/29/2012 1802.00007/01/2011 1,866,335.50 0.262 0.2651,881,912.50SAN DIEGO WATER AUTHORITY32014 2,100,000.0079742CBA7 01/04/2012 30.15010/04/2011 2,100,000.00 0.147 0.1502,100,000.00
Subtotal and Average 36,104,194.50 35,625,000.00 35,900,044.25 0.270 0.274 142
Tax Exempt Money Market Funds
FEDERATED TAX FREE INST FUND31725 74,547,235.90SYS31725 10.01006/24/2011 74,547,235.90 0.009 0.01074,547,235.90JP MORGAN TAX FREE MMK-INST27353 0.00SYS27353 10.02006/23/2009 0.00 0.019 0.0200.00
Subtotal and Average 74,547,235.90 74,547,235.90 74,547,235.90 0.010 0.010 1
Total Investments and Average 110,651,430.40 110,172,235.90 110,447,280.15 0.095 0.096 47
Portfolio SCL2CC
Run Date: 01/11/2012 - 12:11 FI (PRF_FI) SymRept 6.42Report Ver. 5.00
SANTA CLARA COUNTY70 WEST HEDDING
EAST WING 6TH FLOORSAN JOSE, CA 95110
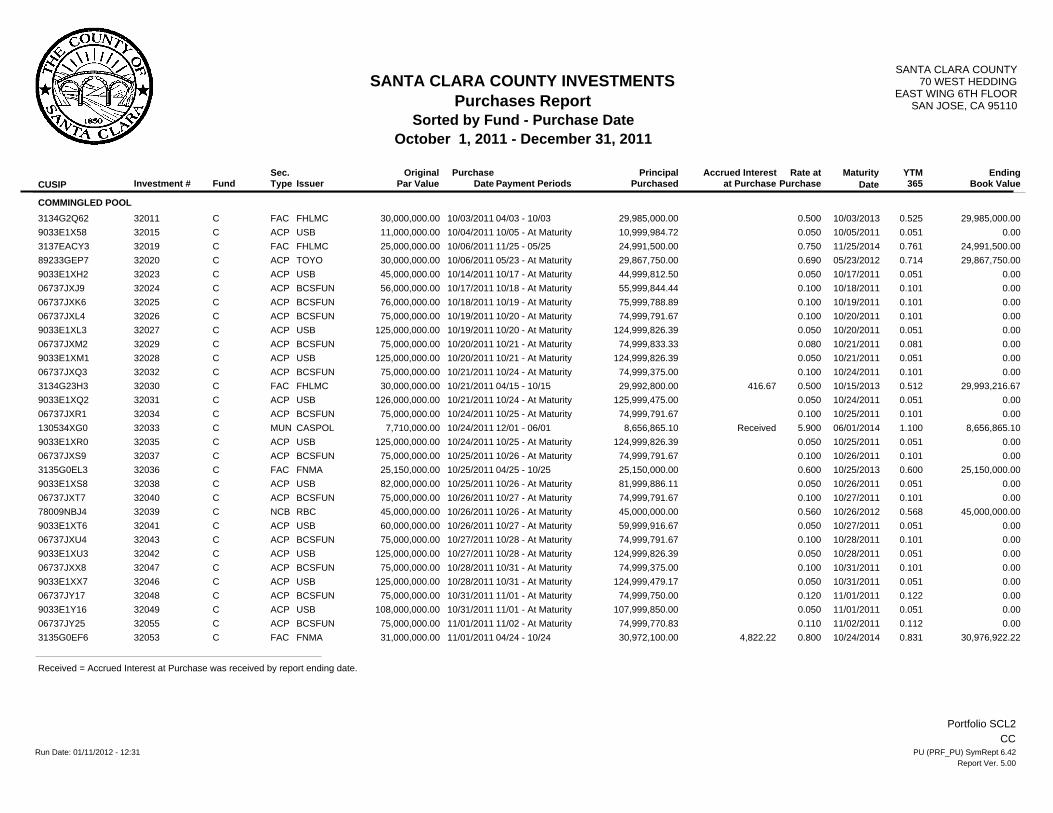
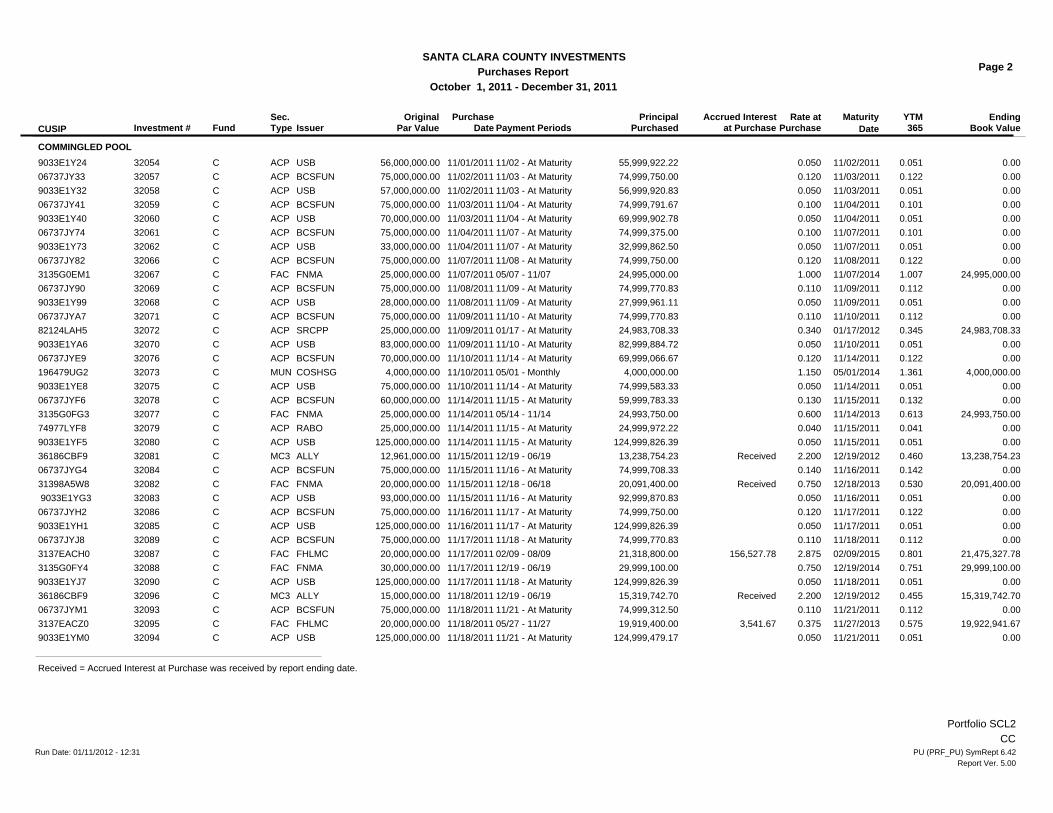
SANTA CLARA COUNTY INVESTMENTSPurchases Report
Sorted by Fund - Purchase DateOctober 1, 2011 - December 31, 2011
OriginalPar Value
EndingBook Value
Sec.TypeFund
Maturity365
YTMAccrued Interestat PurchasePayment Periods DateCUSIP Investment # Issuer
PurchaseDate
PrincipalPurchased
Rate atPurchase
COMMINGLED POOL
30,000,000.00 0.500 10/03/2013 29,985,000.0029,985,000.0010/03/2011 0.52504/03 - 10/03FHLMC320113134G2Q62 FACC11,000,000.00 0.050 10/05/2011 0.0010,999,984.7210/04/2011 0.05110/05 - At MaturityUSB320159033E1X58 ACPC25,000,000.00 0.750 11/25/2014 24,991,500.0024,991,500.0010/06/2011 0.76111/25 - 05/25FHLMC320193137EACY3 FACC30,000,000.00 0.690 05/23/2012 29,867,750.0029,867,750.0010/06/2011 0.71405/23 - At MaturityTOYO3202089233GEP7 ACPC45,000,000.00 0.050 10/17/2011 0.0044,999,812.5010/14/2011 0.05110/17 - At MaturityUSB320239033E1XH2 ACPC56,000,000.00 0.100 10/18/2011 0.0055,999,844.4410/17/2011 0.10110/18 - At MaturityBCSFUN3202406737JXJ9 ACPC76,000,000.00 0.100 10/19/2011 0.0075,999,788.8910/18/2011 0.10110/19 - At MaturityBCSFUN3202506737JXK6 ACPC75,000,000.00 0.100 10/20/2011 0.0074,999,791.6710/19/2011 0.10110/20 - At MaturityBCSFUN3202606737JXL4 ACPC
125,000,000.00 0.050 10/20/2011 0.00124,999,826.3910/19/2011 0.05110/20 - At MaturityUSB320279033E1XL3 ACPC75,000,000.00 0.080 10/21/2011 0.0074,999,833.3310/20/2011 0.08110/21 - At MaturityBCSFUN3202906737JXM2 ACPC
125,000,000.00 0.050 10/21/2011 0.00124,999,826.3910/20/2011 0.05110/21 - At MaturityUSB320289033E1XM1 ACPC75,000,000.00 0.100 10/24/2011 0.0074,999,375.0010/21/2011 0.10110/24 - At MaturityBCSFUN3203206737JXQ3 ACPC30,000,000.00 0.500 10/15/2013 29,993,216.6729,992,800.00 416.6710/21/2011 0.51204/15 - 10/15FHLMC320303134G23H3 FACC
126,000,000.00 0.050 10/24/2011 0.00125,999,475.0010/21/2011 0.05110/24 - At MaturityUSB320319033E1XQ2 ACPC75,000,000.00 0.100 10/25/2011 0.0074,999,791.6710/24/2011 0.10110/25 - At MaturityBCSFUN3203406737JXR1 ACPC
7,710,000.00 5.900 06/01/2014 8,656,865.108,656,865.10 Received10/24/2011 1.10012/01 - 06/01CASPOL32033130534XG0 MUNC125,000,000.00 0.050 10/25/2011 0.00124,999,826.3910/24/2011 0.05110/25 - At MaturityUSB320359033E1XR0 ACPC
75,000,000.00 0.100 10/26/2011 0.0074,999,791.6710/25/2011 0.10110/26 - At MaturityBCSFUN3203706737JXS9 ACPC25,150,000.00 0.600 10/25/2013 25,150,000.0025,150,000.0010/25/2011 0.60004/25 - 10/25FNMA320363135G0EL3 FACC82,000,000.00 0.050 10/26/2011 0.0081,999,886.1110/25/2011 0.05110/26 - At MaturityUSB320389033E1XS8 ACPC75,000,000.00 0.100 10/27/2011 0.0074,999,791.6710/26/2011 0.10110/27 - At MaturityBCSFUN3204006737JXT7 ACPC45,000,000.00 0.560 10/26/2012 45,000,000.0045,000,000.0010/26/2011 0.56810/26 - At MaturityRBC3203978009NBJ4 NCBC60,000,000.00 0.050 10/27/2011 0.0059,999,916.6710/26/2011 0.05110/27 - At MaturityUSB320419033E1XT6 ACPC75,000,000.00 0.100 10/28/2011 0.0074,999,791.6710/27/2011 0.10110/28 - At MaturityBCSFUN3204306737JXU4 ACPC
125,000,000.00 0.050 10/28/2011 0.00124,999,826.3910/27/2011 0.05110/28 - At MaturityUSB320429033E1XU3 ACPC75,000,000.00 0.100 10/31/2011 0.0074,999,375.0010/28/2011 0.10110/31 - At MaturityBCSFUN3204706737JXX8 ACPC
125,000,000.00 0.050 10/31/2011 0.00124,999,479.1710/28/2011 0.05110/31 - At MaturityUSB320469033E1XX7 ACPC75,000,000.00 0.120 11/01/2011 0.0074,999,750.0010/31/2011 0.12211/01 - At MaturityBCSFUN3204806737JY17 ACPC
108,000,000.00 0.050 11/01/2011 0.00107,999,850.0010/31/2011 0.05111/01 - At MaturityUSB320499033E1Y16 ACPC75,000,000.00 0.110 11/02/2011 0.0074,999,770.8311/01/2011 0.11211/02 - At MaturityBCSFUN3205506737JY25 ACPC31,000,000.00 0.800 10/24/2014 30,976,922.2230,972,100.00 4,822.2211/01/2011 0.83104/24 - 10/24FNMA320533135G0EF6 FACC
Received = Accrued Interest at Purchase was received by report ending date.
Portfolio SCL2CC
Run Date: 01/11/2012 - 12:31 PU (PRF_PU) SymRept 6.42Report Ver. 5.00
OriginalPar Value
EndingBook Value
Sec.Type
Page 2
FundMaturity
365YTMAccrued Interest
at PurchasePayment Periods
October 1, 2011 - December 31, 2011Purchases Report
SANTA CLARA COUNTY INVESTMENTS
DateCUSIP Investment # IssuerPurchase
DatePrincipal
PurchasedRate at
Purchase
COMMINGLED POOL
56,000,000.00 0.050 11/02/2011 0.0055,999,922.2211/01/2011 0.05111/02 - At MaturityUSB320549033E1Y24 ACPC75,000,000.00 0.120 11/03/2011 0.0074,999,750.0011/02/2011 0.12211/03 - At MaturityBCSFUN3205706737JY33 ACPC57,000,000.00 0.050 11/03/2011 0.0056,999,920.8311/02/2011 0.05111/03 - At MaturityUSB320589033E1Y32 ACPC75,000,000.00 0.100 11/04/2011 0.0074,999,791.6711/03/2011 0.10111/04 - At MaturityBCSFUN3205906737JY41 ACPC70,000,000.00 0.050 11/04/2011 0.0069,999,902.7811/03/2011 0.05111/04 - At MaturityUSB320609033E1Y40 ACPC75,000,000.00 0.100 11/07/2011 0.0074,999,375.0011/04/2011 0.10111/07 - At MaturityBCSFUN3206106737JY74 ACPC33,000,000.00 0.050 11/07/2011 0.0032,999,862.5011/04/2011 0.05111/07 - At MaturityUSB320629033E1Y73 ACPC75,000,000.00 0.120 11/08/2011 0.0074,999,750.0011/07/2011 0.12211/08 - At MaturityBCSFUN3206606737JY82 ACPC25,000,000.00 1.000 11/07/2014 24,995,000.0024,995,000.0011/07/2011 1.00705/07 - 11/07FNMA320673135G0EM1 FACC75,000,000.00 0.110 11/09/2011 0.0074,999,770.8311/08/2011 0.11211/09 - At MaturityBCSFUN3206906737JY90 ACPC28,000,000.00 0.050 11/09/2011 0.0027,999,961.1111/08/2011 0.05111/09 - At MaturityUSB320689033E1Y99 ACPC75,000,000.00 0.110 11/10/2011 0.0074,999,770.8311/09/2011 0.11211/10 - At MaturityBCSFUN3207106737JYA7 ACPC25,000,000.00 0.340 01/17/2012 24,983,708.3324,983,708.3311/09/2011 0.34501/17 - At MaturitySRCPP3207282124LAH5 ACPC83,000,000.00 0.050 11/10/2011 0.0082,999,884.7211/09/2011 0.05111/10 - At MaturityUSB320709033E1YA6 ACPC70,000,000.00 0.120 11/14/2011 0.0069,999,066.6711/10/2011 0.12211/14 - At MaturityBCSFUN3207606737JYE9 ACPC
4,000,000.00 1.150 05/01/2014 4,000,000.004,000,000.0011/10/2011 1.36105/01 - MonthlyCOSHSG32073196479UG2 MUNC75,000,000.00 0.050 11/14/2011 0.0074,999,583.3311/10/2011 0.05111/14 - At MaturityUSB320759033E1YE8 ACPC60,000,000.00 0.130 11/15/2011 0.0059,999,783.3311/14/2011 0.13211/15 - At MaturityBCSFUN3207806737JYF6 ACPC25,000,000.00 0.600 11/14/2013 24,993,750.0024,993,750.0011/14/2011 0.61305/14 - 11/14FNMA320773135G0FG3 FACC25,000,000.00 0.040 11/15/2011 0.0024,999,972.2211/14/2011 0.04111/15 - At MaturityRABO3207974977LYF8 ACPC
125,000,000.00 0.050 11/15/2011 0.00124,999,826.3911/14/2011 0.05111/15 - At MaturityUSB320809033E1YF5 ACPC12,961,000.00 2.200 12/19/2012 13,238,754.2313,238,754.23 Received11/15/2011 0.46012/19 - 06/19ALLY3208136186CBF9 MC3C75,000,000.00 0.140 11/16/2011 0.0074,999,708.3311/15/2011 0.14211/16 - At MaturityBCSFUN3208406737JYG4 ACPC20,000,000.00 0.750 12/18/2013 20,091,400.0020,091,400.00 Received11/15/2011 0.53012/18 - 06/18FNMA3208231398A5W8 FACC93,000,000.00 0.050 11/16/2011 0.0092,999,870.8311/15/2011 0.05111/16 - At MaturityUSB32083 9033E1YG3 ACPC75,000,000.00 0.120 11/17/2011 0.0074,999,750.0011/16/2011 0.12211/17 - At MaturityBCSFUN3208606737JYH2 ACPC
125,000,000.00 0.050 11/17/2011 0.00124,999,826.3911/16/2011 0.05111/17 - At MaturityUSB320859033E1YH1 ACPC75,000,000.00 0.110 11/18/2011 0.0074,999,770.8311/17/2011 0.11211/18 - At MaturityBCSFUN3208906737JYJ8 ACPC20,000,000.00 2.875 02/09/2015 21,475,327.7821,318,800.00 156,527.7811/17/2011 0.80102/09 - 08/09FHLMC320873137EACH0 FACC30,000,000.00 0.750 12/19/2014 29,999,100.0029,999,100.0011/17/2011 0.75112/19 - 06/19FNMA320883135G0FY4 FACC
125,000,000.00 0.050 11/18/2011 0.00124,999,826.3911/17/2011 0.05111/18 - At MaturityUSB320909033E1YJ7 ACPC15,000,000.00 2.200 12/19/2012 15,319,742.7015,319,742.70 Received11/18/2011 0.45512/19 - 06/19ALLY3209636186CBF9 MC3C75,000,000.00 0.110 11/21/2011 0.0074,999,312.5011/18/2011 0.11211/21 - At MaturityBCSFUN3209306737JYM1 ACPC20,000,000.00 0.375 11/27/2013 19,922,941.6719,919,400.00 3,541.6711/18/2011 0.57505/27 - 11/27FHLMC320953137EACZ0 FACC
125,000,000.00 0.050 11/21/2011 0.00124,999,479.1711/18/2011 0.05111/21 - At MaturityUSB320949033E1YM0 ACPC
Received = Accrued Interest at Purchase was received by report ending date.
Portfolio SCL2CC
Run Date: 01/11/2012 - 12:31 PU (PRF_PU) SymRept 6.42Report Ver. 5.00
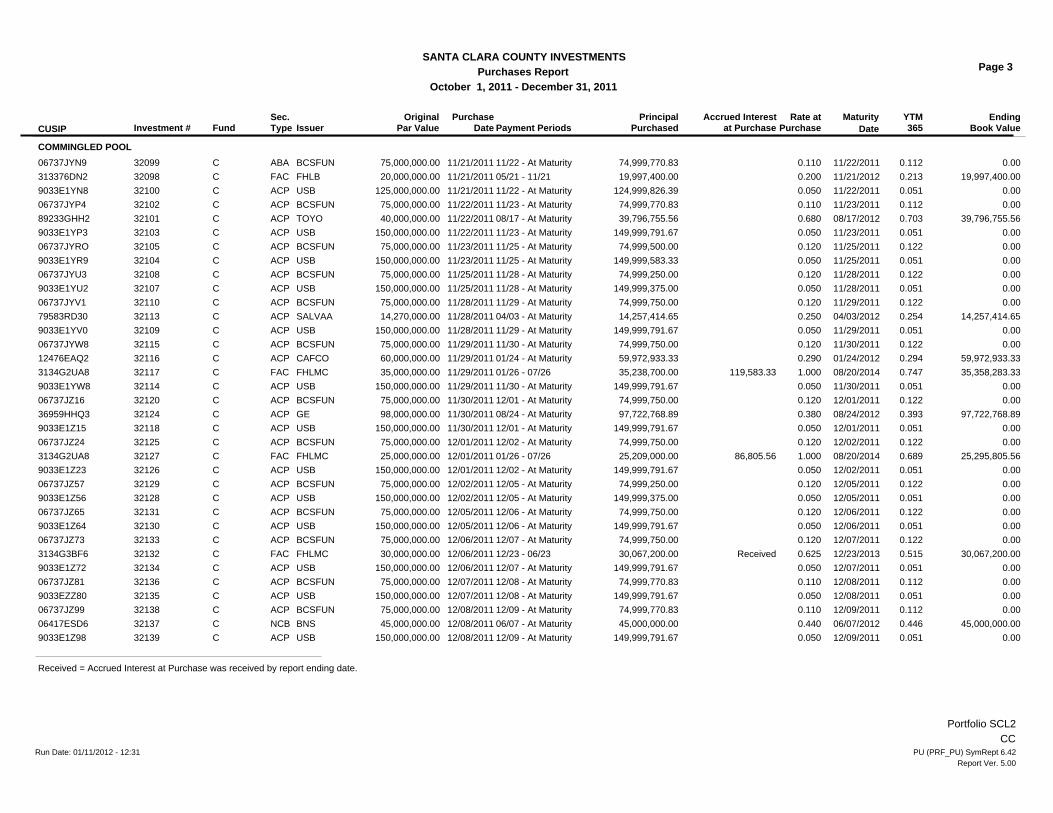
OriginalPar Value
EndingBook Value
Sec.Type
Page 3
FundMaturity
365YTMAccrued Interest
at PurchasePayment Periods
October 1, 2011 - December 31, 2011Purchases Report
SANTA CLARA COUNTY INVESTMENTS
DateCUSIP Investment # IssuerPurchase
DatePrincipal
PurchasedRate at
Purchase
COMMINGLED POOL
75,000,000.00 0.110 11/22/2011 0.0074,999,770.8311/21/2011 0.11211/22 - At MaturityBCSFUN3209906737JYN9 ABAC20,000,000.00 0.200 11/21/2012 19,997,400.0019,997,400.0011/21/2011 0.21305/21 - 11/21FHLB32098313376DN2 FACC
125,000,000.00 0.050 11/22/2011 0.00124,999,826.3911/21/2011 0.05111/22 - At MaturityUSB321009033E1YN8 ACPC75,000,000.00 0.110 11/23/2011 0.0074,999,770.8311/22/2011 0.11211/23 - At MaturityBCSFUN3210206737JYP4 ACPC40,000,000.00 0.680 08/17/2012 39,796,755.5639,796,755.5611/22/2011 0.70308/17 - At MaturityTOYO3210189233GHH2 ACPC
150,000,000.00 0.050 11/23/2011 0.00149,999,791.6711/22/2011 0.05111/23 - At MaturityUSB321039033E1YP3 ACPC75,000,000.00 0.120 11/25/2011 0.0074,999,500.0011/23/2011 0.12211/25 - At MaturityBCSFUN3210506737JYRO ACPC
150,000,000.00 0.050 11/25/2011 0.00149,999,583.3311/23/2011 0.05111/25 - At MaturityUSB321049033E1YR9 ACPC75,000,000.00 0.120 11/28/2011 0.0074,999,250.0011/25/2011 0.12211/28 - At MaturityBCSFUN3210806737JYU3 ACPC
150,000,000.00 0.050 11/28/2011 0.00149,999,375.0011/25/2011 0.05111/28 - At MaturityUSB321079033E1YU2 ACPC75,000,000.00 0.120 11/29/2011 0.0074,999,750.0011/28/2011 0.12211/29 - At MaturityBCSFUN3211006737JYV1 ACPC14,270,000.00 0.250 04/03/2012 14,257,414.6514,257,414.6511/28/2011 0.25404/03 - At MaturitySALVAA3211379583RD30 ACPC
150,000,000.00 0.050 11/29/2011 0.00149,999,791.6711/28/2011 0.05111/29 - At MaturityUSB321099033E1YV0 ACPC75,000,000.00 0.120 11/30/2011 0.0074,999,750.0011/29/2011 0.12211/30 - At MaturityBCSFUN3211506737JYW8 ACPC60,000,000.00 0.290 01/24/2012 59,972,933.3359,972,933.3311/29/2011 0.29401/24 - At MaturityCAFCO3211612476EAQ2 ACPC35,000,000.00 1.000 08/20/2014 35,358,283.3335,238,700.00 119,583.3311/29/2011 0.74701/26 - 07/26FHLMC321173134G2UA8 FACC
150,000,000.00 0.050 11/30/2011 0.00149,999,791.6711/29/2011 0.05111/30 - At MaturityUSB321149033E1YW8 ACPC75,000,000.00 0.120 12/01/2011 0.0074,999,750.0011/30/2011 0.12212/01 - At MaturityBCSFUN3212006737JZ16 ACPC98,000,000.00 0.380 08/24/2012 97,722,768.8997,722,768.8911/30/2011 0.39308/24 - At MaturityGE3212436959HHQ3 ACPC
150,000,000.00 0.050 12/01/2011 0.00149,999,791.6711/30/2011 0.05112/01 - At MaturityUSB321189033E1Z15 ACPC75,000,000.00 0.120 12/02/2011 0.0074,999,750.0012/01/2011 0.12212/02 - At MaturityBCSFUN3212506737JZ24 ACPC25,000,000.00 1.000 08/20/2014 25,295,805.5625,209,000.00 86,805.5612/01/2011 0.68901/26 - 07/26FHLMC321273134G2UA8 FACC
150,000,000.00 0.050 12/02/2011 0.00149,999,791.6712/01/2011 0.05112/02 - At MaturityUSB321269033E1Z23 ACPC75,000,000.00 0.120 12/05/2011 0.0074,999,250.0012/02/2011 0.12212/05 - At MaturityBCSFUN3212906737JZ57 ACPC
150,000,000.00 0.050 12/05/2011 0.00149,999,375.0012/02/2011 0.05112/05 - At MaturityUSB321289033E1Z56 ACPC75,000,000.00 0.120 12/06/2011 0.0074,999,750.0012/05/2011 0.12212/06 - At MaturityBCSFUN3213106737JZ65 ACPC
150,000,000.00 0.050 12/06/2011 0.00149,999,791.6712/05/2011 0.05112/06 - At MaturityUSB321309033E1Z64 ACPC75,000,000.00 0.120 12/07/2011 0.0074,999,750.0012/06/2011 0.12212/07 - At MaturityBCSFUN3213306737JZ73 ACPC30,000,000.00 0.625 12/23/2013 30,067,200.0030,067,200.00 Received12/06/2011 0.51512/23 - 06/23FHLMC321323134G3BF6 FACC
150,000,000.00 0.050 12/07/2011 0.00149,999,791.6712/06/2011 0.05112/07 - At MaturityUSB321349033E1Z72 ACPC75,000,000.00 0.110 12/08/2011 0.0074,999,770.8312/07/2011 0.11212/08 - At MaturityBCSFUN3213606737JZ81 ACPC
150,000,000.00 0.050 12/08/2011 0.00149,999,791.6712/07/2011 0.05112/08 - At MaturityUSB321359033EZZ80 ACPC75,000,000.00 0.110 12/09/2011 0.0074,999,770.8312/08/2011 0.11212/09 - At MaturityBCSFUN3213806737JZ99 ACPC45,000,000.00 0.440 06/07/2012 45,000,000.0045,000,000.0012/08/2011 0.44606/07 - At MaturityBNS3213706417ESD6 NCBC
150,000,000.00 0.050 12/09/2011 0.00149,999,791.6712/08/2011 0.05112/09 - At MaturityUSB321399033E1Z98 ACPC
Received = Accrued Interest at Purchase was received by report ending date.
Portfolio SCL2CC
Run Date: 01/11/2012 - 12:31 PU (PRF_PU) SymRept 6.42Report Ver. 5.00
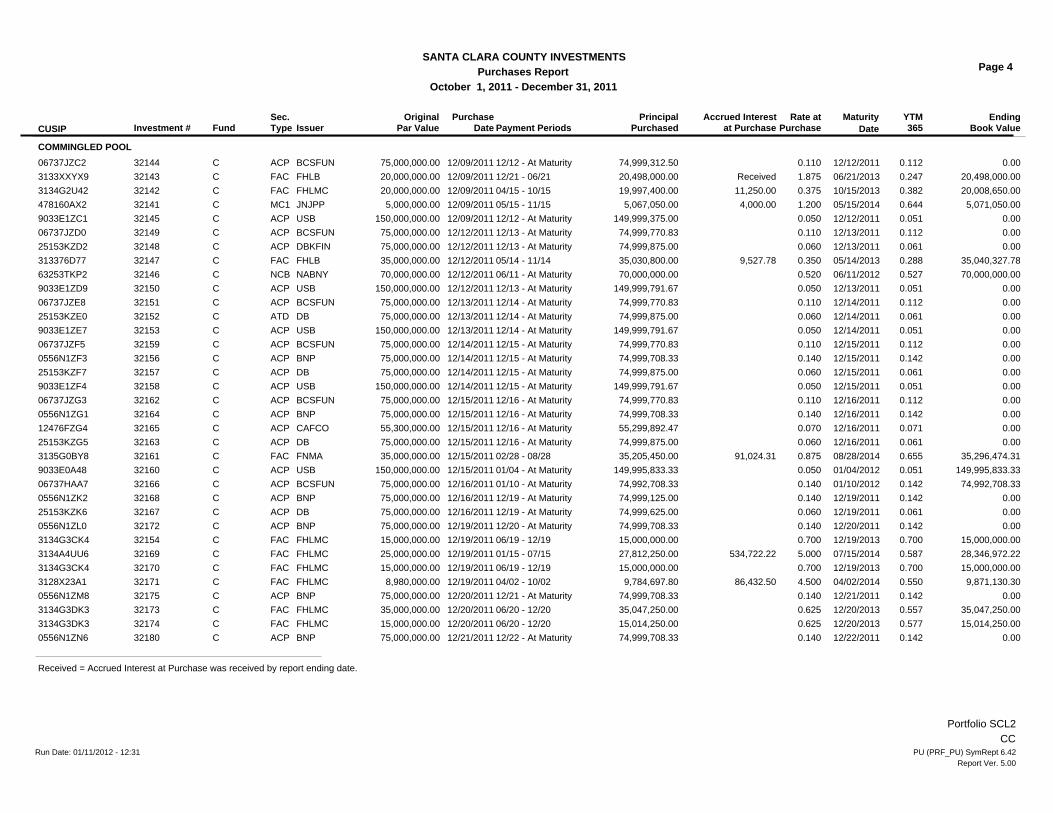
OriginalPar Value
EndingBook Value
Sec.Type
Page 4
FundMaturity
365YTMAccrued Interest
at PurchasePayment Periods
October 1, 2011 - December 31, 2011Purchases Report
SANTA CLARA COUNTY INVESTMENTS
DateCUSIP Investment # IssuerPurchase
DatePrincipal
PurchasedRate at
Purchase
COMMINGLED POOL
75,000,000.00 0.110 12/12/2011 0.0074,999,312.5012/09/2011 0.11212/12 - At MaturityBCSFUN3214406737JZC2 ACPC20,000,000.00 1.875 06/21/2013 20,498,000.0020,498,000.00 Received12/09/2011 0.24712/21 - 06/21FHLB321433133XXYX9 FACC20,000,000.00 0.375 10/15/2013 20,008,650.0019,997,400.00 11,250.0012/09/2011 0.38204/15 - 10/15FHLMC321423134G2U42 FACC
5,000,000.00 1.200 05/15/2014 5,071,050.005,067,050.00 4,000.0012/09/2011 0.64405/15 - 11/15JNJPP32141478160AX2 MC1C150,000,000.00 0.050 12/12/2011 0.00149,999,375.0012/09/2011 0.05112/12 - At MaturityUSB321459033E1ZC1 ACPC
75,000,000.00 0.110 12/13/2011 0.0074,999,770.8312/12/2011 0.11212/13 - At MaturityBCSFUN3214906737JZD0 ACPC75,000,000.00 0.060 12/13/2011 0.0074,999,875.0012/12/2011 0.06112/13 - At MaturityDBKFIN3214825153KZD2 ACPC35,000,000.00 0.350 05/14/2013 35,040,327.7835,030,800.00 9,527.7812/12/2011 0.28805/14 - 11/14FHLB32147313376D77 FACC70,000,000.00 0.520 06/11/2012 70,000,000.0070,000,000.0012/12/2011 0.52706/11 - At MaturityNABNY3214663253TKP2 NCBC
150,000,000.00 0.050 12/13/2011 0.00149,999,791.6712/12/2011 0.05112/13 - At MaturityUSB321509033E1ZD9 ACPC75,000,000.00 0.110 12/14/2011 0.0074,999,770.8312/13/2011 0.11212/14 - At MaturityBCSFUN3215106737JZE8 ACPC75,000,000.00 0.060 12/14/2011 0.0074,999,875.0012/13/2011 0.06112/14 - At MaturityDB3215225153KZE0 ATDC
150,000,000.00 0.050 12/14/2011 0.00149,999,791.6712/13/2011 0.05112/14 - At MaturityUSB321539033E1ZE7 ACPC75,000,000.00 0.110 12/15/2011 0.0074,999,770.8312/14/2011 0.11212/15 - At MaturityBCSFUN3215906737JZF5 ACPC75,000,000.00 0.140 12/15/2011 0.0074,999,708.3312/14/2011 0.14212/15 - At MaturityBNP321560556N1ZF3 ACPC75,000,000.00 0.060 12/15/2011 0.0074,999,875.0012/14/2011 0.06112/15 - At MaturityDB3215725153KZF7 ACPC
150,000,000.00 0.050 12/15/2011 0.00149,999,791.6712/14/2011 0.05112/15 - At MaturityUSB321589033E1ZF4 ACPC75,000,000.00 0.110 12/16/2011 0.0074,999,770.8312/15/2011 0.11212/16 - At MaturityBCSFUN3216206737JZG3 ACPC75,000,000.00 0.140 12/16/2011 0.0074,999,708.3312/15/2011 0.14212/16 - At MaturityBNP321640556N1ZG1 ACPC55,300,000.00 0.070 12/16/2011 0.0055,299,892.4712/15/2011 0.07112/16 - At MaturityCAFCO3216512476FZG4 ACPC75,000,000.00 0.060 12/16/2011 0.0074,999,875.0012/15/2011 0.06112/16 - At MaturityDB3216325153KZG5 ACPC35,000,000.00 0.875 08/28/2014 35,296,474.3135,205,450.00 91,024.3112/15/2011 0.65502/28 - 08/28FNMA321613135G0BY8 FACC
150,000,000.00 0.050 01/04/2012 149,995,833.33149,995,833.3312/15/2011 0.05101/04 - At MaturityUSB321609033E0A48 ACPC75,000,000.00 0.140 01/10/2012 74,992,708.3374,992,708.3312/16/2011 0.14201/10 - At MaturityBCSFUN3216606737HAA7 ACPC75,000,000.00 0.140 12/19/2011 0.0074,999,125.0012/16/2011 0.14212/19 - At MaturityBNP321680556N1ZK2 ACPC75,000,000.00 0.060 12/19/2011 0.0074,999,625.0012/16/2011 0.06112/19 - At MaturityDB3216725153KZK6 ACPC75,000,000.00 0.140 12/20/2011 0.0074,999,708.3312/19/2011 0.14212/20 - At MaturityBNP321720556N1ZL0 ACPC15,000,000.00 0.700 12/19/2013 15,000,000.0015,000,000.0012/19/2011 0.70006/19 - 12/19FHLMC321543134G3CK4 FACC25,000,000.00 5.000 07/15/2014 28,346,972.2227,812,250.00 534,722.2212/19/2011 0.58701/15 - 07/15FHLMC321693134A4UU6 FACC15,000,000.00 0.700 12/19/2013 15,000,000.0015,000,000.0012/19/2011 0.70006/19 - 12/19FHLMC321703134G3CK4 FACC
8,980,000.00 4.500 04/02/2014 9,871,130.309,784,697.80 86,432.5012/19/2011 0.55004/02 - 10/02FHLMC321713128X23A1 FACC75,000,000.00 0.140 12/21/2011 0.0074,999,708.3312/20/2011 0.14212/21 - At MaturityBNP321750556N1ZM8 ACPC35,000,000.00 0.625 12/20/2013 35,047,250.0035,047,250.0012/20/2011 0.55706/20 - 12/20FHLMC321733134G3DK3 FACC15,000,000.00 0.625 12/20/2013 15,014,250.0015,014,250.0012/20/2011 0.57706/20 - 12/20FHLMC321743134G3DK3 FACC75,000,000.00 0.140 12/22/2011 0.0074,999,708.3312/21/2011 0.14212/22 - At MaturityBNP321800556N1ZN6 ACPC
Received = Accrued Interest at Purchase was received by report ending date.
Portfolio SCL2CC
Run Date: 01/11/2012 - 12:31 PU (PRF_PU) SymRept 6.42Report Ver. 5.00
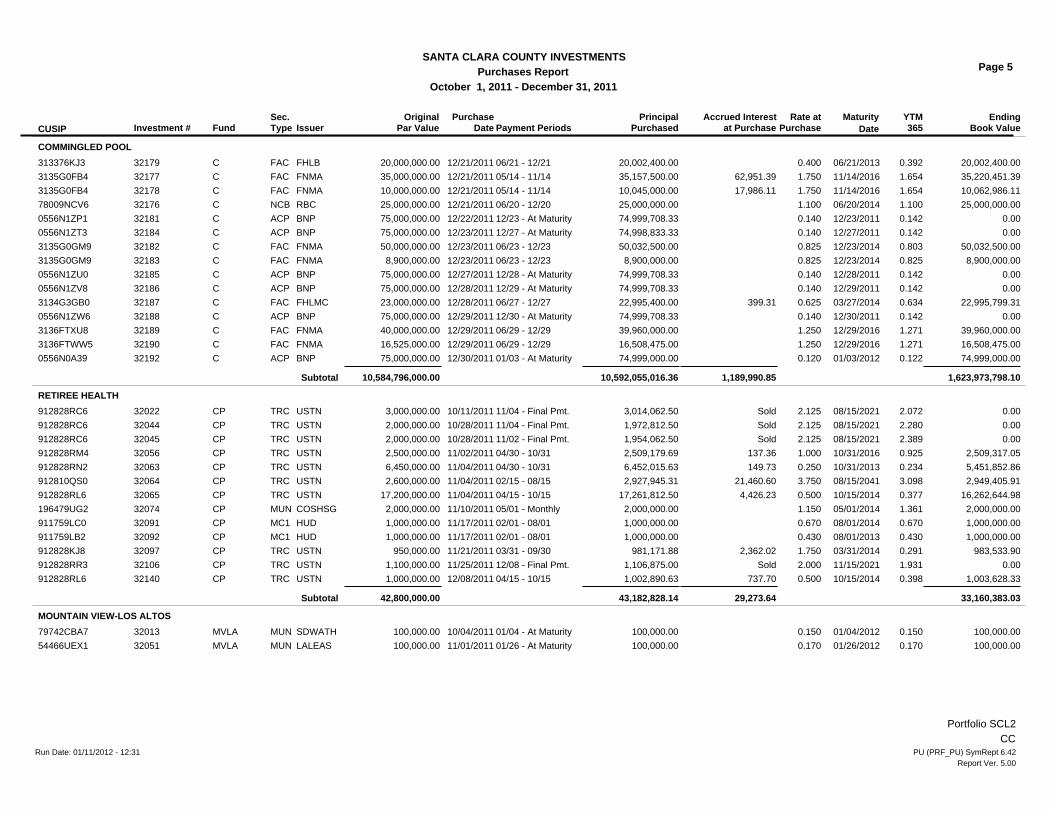
OriginalPar Value
EndingBook Value
Sec.Type
Page 5
FundMaturity
365YTMAccrued Interest
at PurchasePayment Periods
October 1, 2011 - December 31, 2011Purchases Report
SANTA CLARA COUNTY INVESTMENTS
DateCUSIP Investment # IssuerPurchase
DatePrincipal
PurchasedRate at
Purchase
COMMINGLED POOL
20,000,000.00 0.400 06/21/2013 20,002,400.0020,002,400.0012/21/2011 0.39206/21 - 12/21FHLB32179313376KJ3 FACC35,000,000.00 1.750 11/14/2016 35,220,451.3935,157,500.00 62,951.3912/21/2011 1.65405/14 - 11/14FNMA321773135G0FB4 FACC10,000,000.00 1.750 11/14/2016 10,062,986.1110,045,000.00 17,986.1112/21/2011 1.65405/14 - 11/14FNMA321783135G0FB4 FACC25,000,000.00 1.100 06/20/2014 25,000,000.0025,000,000.0012/21/2011 1.10006/20 - 12/20RBC3217678009NCV6 NCBC75,000,000.00 0.140 12/23/2011 0.0074,999,708.3312/22/2011 0.14212/23 - At MaturityBNP321810556N1ZP1 ACPC75,000,000.00 0.140 12/27/2011 0.0074,998,833.3312/23/2011 0.14212/27 - At MaturityBNP321840556N1ZT3 ACPC50,000,000.00 0.825 12/23/2014 50,032,500.0050,032,500.0012/23/2011 0.80306/23 - 12/23FNMA321823135G0GM9 FACC
8,900,000.00 0.825 12/23/2014 8,900,000.008,900,000.0012/23/2011 0.82506/23 - 12/23FNMA321833135G0GM9 FACC75,000,000.00 0.140 12/28/2011 0.0074,999,708.3312/27/2011 0.14212/28 - At MaturityBNP321850556N1ZU0 ACPC75,000,000.00 0.140 12/29/2011 0.0074,999,708.3312/28/2011 0.14212/29 - At MaturityBNP321860556N1ZV8 ACPC23,000,000.00 0.625 03/27/2014 22,995,799.3122,995,400.00 399.3112/28/2011 0.63406/27 - 12/27FHLMC321873134G3GB0 FACC75,000,000.00 0.140 12/30/2011 0.0074,999,708.3312/29/2011 0.14212/30 - At MaturityBNP321880556N1ZW6 ACPC40,000,000.00 1.250 12/29/2016 39,960,000.0039,960,000.0012/29/2011 1.27106/29 - 12/29FNMA321893136FTXU8 FACC16,525,000.00 1.250 12/29/2016 16,508,475.0016,508,475.0012/29/2011 1.27106/29 - 12/29FNMA321903136FTWW5 FACC75,000,000.00 0.120 01/03/2012 74,999,000.0074,999,000.0012/30/2011 0.12201/03 - At MaturityBNP321920556N0A39 ACPC
Subtotal 1,623,973,798.1010,592,055,016.36 1,189,990.8510,584,796,000.00
RETIREE HEALTH
3,000,000.00 2.125 08/15/2021 0.003,014,062.50 Sold10/11/2011 2.07211/04 - Final Pmt.USTN32022912828RC6 TRCCP2,000,000.00 2.125 08/15/2021 0.001,972,812.50 Sold10/28/2011 2.28011/04 - Final Pmt.USTN32044912828RC6 TRCCP2,000,000.00 2.125 08/15/2021 0.001,954,062.50 Sold10/28/2011 2.38911/02 - Final Pmt.USTN32045912828RC6 TRCCP2,500,000.00 1.000 10/31/2016 2,509,317.052,509,179.69 137.3611/02/2011 0.92504/30 - 10/31USTN32056912828RM4 TRCCP6,450,000.00 0.250 10/31/2013 5,451,852.866,452,015.63 149.7311/04/2011 0.23404/30 - 10/31USTN32063912828RN2 TRCCP2,600,000.00 3.750 08/15/2041 2,949,405.912,927,945.31 21,460.6011/04/2011 3.09802/15 - 08/15USTN32064912810QS0 TRCCP
17,200,000.00 0.500 10/15/2014 16,262,644.9817,261,812.50 4,426.2311/04/2011 0.37704/15 - 10/15USTN32065912828RL6 TRCCP2,000,000.00 1.150 05/01/2014 2,000,000.002,000,000.0011/10/2011 1.36105/01 - MonthlyCOSHSG32074196479UG2 MUNCP1,000,000.00 0.670 08/01/2014 1,000,000.001,000,000.0011/17/2011 0.67002/01 - 08/01HUD32091911759LC0 MC1CP1,000,000.00 0.430 08/01/2013 1,000,000.001,000,000.0011/17/2011 0.43002/01 - 08/01HUD32092911759LB2 MC1CP
950,000.00 1.750 03/31/2014 983,533.90981,171.88 2,362.0211/21/2011 0.29103/31 - 09/30USTN32097912828KJ8 TRCCP1,100,000.00 2.000 11/15/2021 0.001,106,875.00 Sold11/25/2011 1.93112/08 - Final Pmt.USTN32106912828RR3 TRCCP1,000,000.00 0.500 10/15/2014 1,003,628.331,002,890.63 737.7012/08/2011 0.39804/15 - 10/15USTN32140912828RL6 TRCCP
Subtotal 33,160,383.0343,182,828.14 29,273.6442,800,000.00
MOUNTAIN VIEW-LOS ALTOS
100,000.00 0.150 01/04/2012 100,000.00100,000.0010/04/2011 0.15001/04 - At MaturitySDWATH3201379742CBA7 MUNMVLA100,000.00 0.170 01/26/2012 100,000.00100,000.0011/01/2011 0.17001/26 - At MaturityLALEAS3205154466UEX1 MUNMVLA
Portfolio SCL2CC
Run Date: 01/11/2012 - 12:31 PU (PRF_PU) SymRept 6.42Report Ver. 5.00
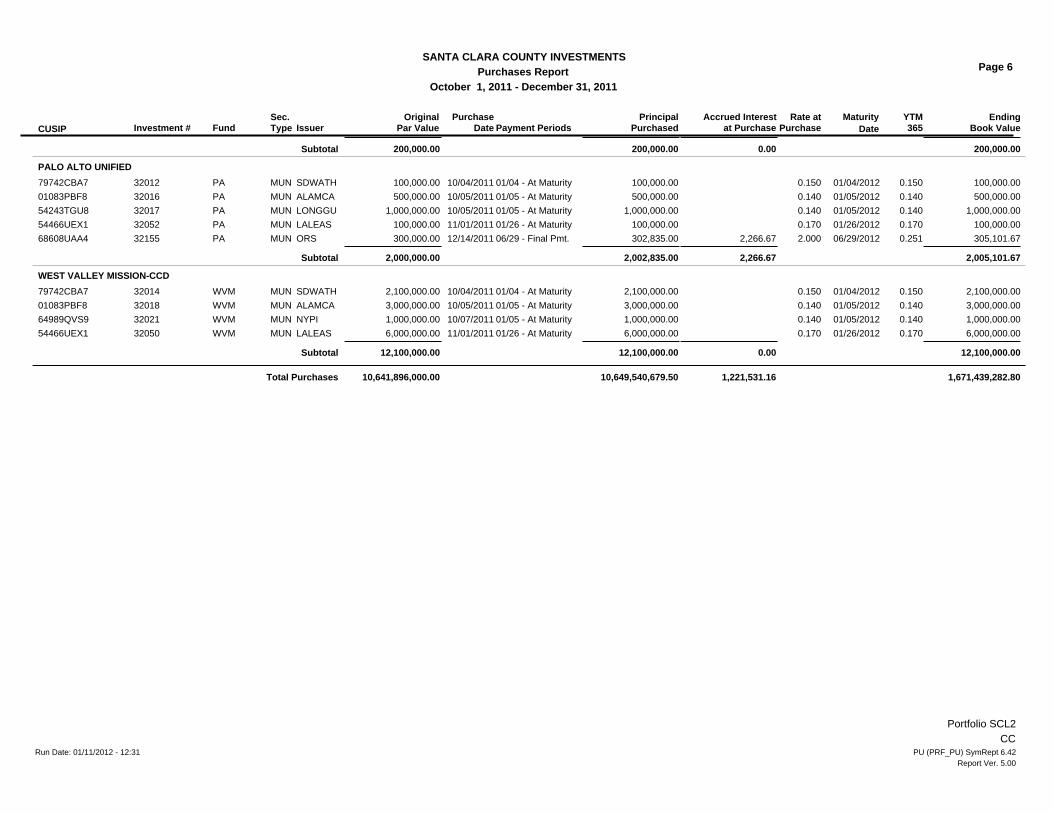
OriginalPar Value
EndingBook Value
Sec.Type
Page 6
FundMaturity
365YTMAccrued Interest
at PurchasePayment Periods
October 1, 2011 - December 31, 2011Purchases Report
SANTA CLARA COUNTY INVESTMENTS
DateCUSIP Investment # IssuerPurchase
DatePrincipal
PurchasedRate at
Purchase
Subtotal 200,000.00200,000.00 0.00200,000.00
PALO ALTO UNIFIED
100,000.00 0.150 01/04/2012 100,000.00100,000.0010/04/2011 0.15001/04 - At MaturitySDWATH3201279742CBA7 MUNPA500,000.00 0.140 01/05/2012 500,000.00500,000.0010/05/2011 0.14001/05 - At MaturityALAMCA3201601083PBF8 MUNPA
1,000,000.00 0.140 01/05/2012 1,000,000.001,000,000.0010/05/2011 0.14001/05 - At MaturityLONGGU3201754243TGU8 MUNPA100,000.00 0.170 01/26/2012 100,000.00100,000.0011/01/2011 0.17001/26 - At MaturityLALEAS3205254466UEX1 MUNPA300,000.00 2.000 06/29/2012 305,101.67302,835.00 2,266.6712/14/2011 0.25106/29 - Final Pmt.ORS3215568608UAA4 MUNPA
Subtotal 2,005,101.672,002,835.00 2,266.672,000,000.00
WEST VALLEY MISSION-CCD
2,100,000.00 0.150 01/04/2012 2,100,000.002,100,000.0010/04/2011 0.15001/04 - At MaturitySDWATH3201479742CBA7 MUNWVM3,000,000.00 0.140 01/05/2012 3,000,000.003,000,000.0010/05/2011 0.14001/05 - At MaturityALAMCA3201801083PBF8 MUNWVM1,000,000.00 0.140 01/05/2012 1,000,000.001,000,000.0010/07/2011 0.14001/05 - At MaturityNYPI3202164989QVS9 MUNWVM6,000,000.00 0.170 01/26/2012 6,000,000.006,000,000.0011/01/2011 0.17001/26 - At MaturityLALEAS3205054466UEX1 MUNWVM
Subtotal 12,100,000.0012,100,000.00 0.0012,100,000.00
10,649,540,679.50Total Purchases 10,641,896,000.00 1,221,531.16 1,671,439,282.80
Portfolio SCL2CC
Run Date: 01/11/2012 - 12:31 PU (PRF_PU) SymRept 6.42Report Ver. 5.00

County of Santa ClaraFinance AgencyController-Treasurer DepartmentInternal Audit Division
County Government Center70 W. Hedding Street, East Wing,2nd FloorSan Jose, Cal i forn ia 951l0-1705(408) 299-6830 FAX (408) 289-862e
February 15,2012
Board of SupervisorsCounty of Santa Clara
INDEPENDENT AUDITOR'S REPORTAPPLYI NG AGREED-UPON PROCEDURES
CASH AND INVESTMENTS
We have performed the procedures enumerated below on the cash and investments in the County'scommingled fund as of December 31,2011. The procedures were agreed to by the Director, FinanceAgency to determine whether the accountability for the cash and investments by the Controller-Treasurer'sDepartment is accurate and whether investments comply with the County's policies and State law.
Based upon the work performed, we found that investments comply with County policy and State law andthat cash and investments are accounted for in the Accounting and Treasury Divisions of the Controller-Treasurer's Department in accordance with policy and established procedures. No material exceptions orirregularities were found except as noted in paragraph i.
The procedures applied follow:
a. On December 31,2011 there was a $493 difference between the accounting for cash andinvestments maintained by the Treasury Division and the records of the Accounting Division.
b. For the securities purchased in December and held at December 31,2011, we compared theissuers'credit ratings to the minimum rating requirements to determine compliance with Countypolicy and State law.
c. We identified and/or computed the investment limitations for each type of investment and testedactual investments by type and issuer to the limitations permitted by law and policy.
d. We tested the automated system's computation of the weighted average of maturities to themaximum permitted by policy (the accuracy of the system was previously tested).
e. We compared the cash and securities held by the depository and custodial banks to these banks'equity balances and verified the deposiUequity or securities book value/equity ratios were within thelegal requirements.
f. We examined supporting documentation for the purchase of investments.
Board of Supervisors: Mike Wasserman, George Shirakawa, Dave Cortese, Ken Yeager, Liz KnissCounty Executive: Jeffrey V. Smith
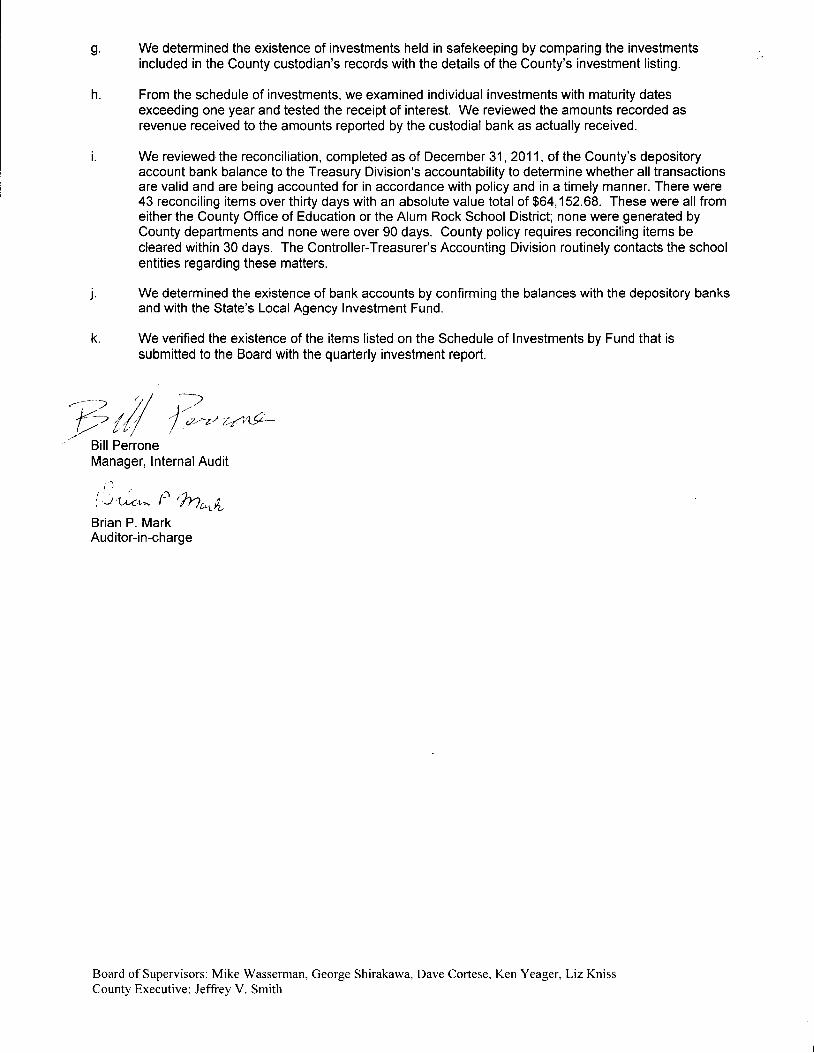
g We determined the existence of investments held in safekeeping by comparing the investmentsincluded in the County custodian's records with the details of the County's investment listing.
h. From the schedule of investments, we examined individual investments with maturity datesexceeding one year and tested the receipt of interest. We reviewed the amounts recorded asrevenue received to the amounts reported by the custodial bank as actually received.
i. We reviewed the reconciliation, completed as of December 31,2011, of the County's depositoryaccount bank balance to the Treasury Division's accountability to determine whether all transactionsare valid and are being accounted for in accordance with policy and in a timely manner. There were43 reconciling items over thirty days with an absolute value total of $64,152.68. These were all fromeither the County Office of Education or the Alum Rock School District; none were generated byCounty departments and none were over 90 days. County policy requires reconciling items becleared within 30 days. The Controller-Treasurer's Accounting Division routinely contacts the schoolentities regarding these matters.
j. We determined the existence of bank accounts by confirming the balances with the depository banksand with the State's LocalAgency Investment Fund.
k. We verified the existence of the items listed on the Schedule of Investments by Fund that issubmitted to the Board with the quarterly investment report.
{- l// )-r'^,' 14L4-).t
t' u/
Bill PerroneManager, lnternal Audit
r )
i -t ti,.- ta Q,Dar;,Brian P. MarkAuditor-in-charge
Board of Supervisors: Mike Wasserman, George Shirakawa, Dave Cortese, Ken Yeager, Liz KnissCounty Executive: Jeflrey V. Smith