Embed Size (px)
Citation preview
Costs Associated with Developmentand Implementation of Comprehensive
Nutrient Management Plans
Part I—Nutrient Management, Land Treatment, Manureand Wastewater Handling and Storage, andRecordkeeping
June 2003
Executive Summary
Issued June 2003
The U.S. Department of Agriculture (USDA) prohibits discrimination in allits programs and activities on the basis of race, color, national origin, sex,religion, age, disability, political beliefs, sexual orientation, or marital orfamily status. (Not all prohibited bases apply to all programs.) Persons withdisabilities who require alternative means for communication of programinformation (Braille, large print, audiotape, etc.) should contact USDA’sTARGET Center at (202) 720-2600 (voice and TDD).
To file a complaint of discrimination, write USDA, Director, Office of CivilRights, Room 326W, Whitten Building, 14th and Independence Avenue, SW,Washington, DC 20250-9410 or call (202) 720-5964 (voice and TDD). USDAis an equal opportunity provider and employer.
Ex
ecutiv
e Su
mm
ary
1
IntroductionThe Nation’s livestock sector has undergone dramaticchange in recent decades. The substantial productiv-ity increases in animal agriculture have fueledconsolidation and geographic concentration. Corre-spondingly, the industry has seen marked declines inthe number of livestock operations and an increase inthe number of animals produced in confinement. Thelargest of animal feeding operations—concentratedanimal feeding operations (CAFOs)—are defined aspoint sources and regulated under the authority ofthe Clean Water Act. However, all animal feedingoperations (AFOs) are being scrutinized for theirpotential to contribute to non-point source pollutionof the Nation’s water resources.
Costs Associated with Development and Implementationof Comprehensive Nutrient Management Plans (CNMP)
Part I—Nutrient Management, Land Treatment, Manure
and Wastewater Handling and Storage, and Recordkeeping
Executive Summary
In 1999, the U.S. Department of Agriculture (USDA)and the U.S. Environmental Protection Agency (EPA)released a joint “Unified National Strategy for AnimalFeeding Operations” (Strategy), which presented aplan for addressing the potential water quality andpublic health impacts associated with AFOs. TheStrategy recognized the complementary roles to beplayed by voluntary and regulatory programs. Impor-tantly, the Strategy articulated a national performanceexpectation that all AFOs should develop and imple-ment technically sound, economically feasible, andsite-specific comprehensive nutrient managementplans (CNMPs) to minimize potential adverse impactson water quality and public health, and to accomplishthis within a 10-year implementation period.
Comprehensive Nutrient Management Plans
A comprehensive nutrient management plan (CNMP) is a conservation system that is unique to animalfeeding operations. It includes conservation practices and management activities which, when imple-mented as part of a conservation system, will help to ensure that production and natural resource protec-tion goals are achieved. CNMPs may include the following six elements:
Manure and Wastewater Handling and Storage – addresses components and activities associated with theproduction facility, feedlot, manure and wastewater storage and treatment structures and areas, and anyareas used to facilitate transfer of manure and wastewater.
Land Treatment Practices – addresses components and activities associated with the fields where manureand organic by-products are applied as beneficial nutrients. Generally, this includes identification ofsensitive areas and implementation of conservation practices, such as residue management, contouring,and terraces, to retain nutrients on-site and available for plant uptake.
Nutrient Management – addresses components and activities associated with land application of allnutrients and organic by-products to meet crop needs and minimize potential adverse impacts to theenvironment and public health. Generally, this includes planning and applying nutrients with consider-ation of form, timing, rate, and application method.
Recordkeeping – addresses the need for AFO owners/operators to document management and implemen-tation activities associated with their CNMP. Typically, this includes recording soil tests, manure tests,manure and wastewater field application dates and rates, manure transfers, and operations and mainte-nance activities.
Feed Management – addresses activities that improve feed delivery, reduce feed wastage, or improvenutrient uptake efficiency.
Other Utilization Activities – addresses AFO alternatives to land application of manure and organic by-products, such as energy production, nutrient stabilization and extraction for commercial fertilizers orother products, composting or pelletizing, mixing or co-composting with other by-products to producespecialized use materials.
Ex
ecu
tiv
e S
um
ma
ry2
The Strategy recognized the importance of under-standing the costs of nationwide CNMP implementa-tion and called upon EPA and USDA to evaluate costsand benefits. In September 2000, USDA initiated thefirst phase of an assessment of:
1. The cost of upgrading facilities and practiceson AFOs nationwide to meet CNMP technicalguidance.
2. The technical assistance needed to plan,design, implement, and follow up on neededstructures and practices.
3. The cost of alternatives to land application ofmanure, including feed management, alterna-tive uses, and treatment options.
This is a summary of the report addressing the firsttwo components of the USDA assessment. Presentedhere is an overview of the findings on the numberand distribution of operations potentially needingCNMPs, estimated costs for developing and imple-menting CNMPs on these operations, and overall costsummaries by region, livestock type, and operationsize. For detailed information on the assessment thereader is directed to the full report, Costs Associated
with Development and Implementation of Compre-
hensive Nutrient Management Plans, Part I –
Nutrient Management, Land Treatment, Manure
and Wastewater Handling and Storage, and
Recordkeeping. A subsequent report will address thecost of alternatives to land application of manure andother strategies to minimize potential nutrientexcesses.
Operations Needing Comprehensive Nutrient
Management PlansThe 1997 Census of Agriculture reported that therewere 1.9 million farms and ranches in the UnitedStates. Livestock are produced on nearly 1.3 millionof these farms and ranches and in every state acrossthe United States. Operations that were estimated toneed a CNMP were identified on the basis of threecriteria:
1. Number of animals—operations with too fewanimals were eliminated from considerationas they were unlikely to need a CNMP.
2. Recoverable manure—operations withsufficient animal numbers to generate atleast 200 pounds of recoverable manurenitrogen annually (approximately equivalentto 11 tons of manure).
3. Specialty livestock—operations with spe-cialty livestock types most likely to be raisedin confinement settings (primarily operationswith fur-bearing animals and poultry otherthan turkeys and chickens, mostly ducks andgeese).
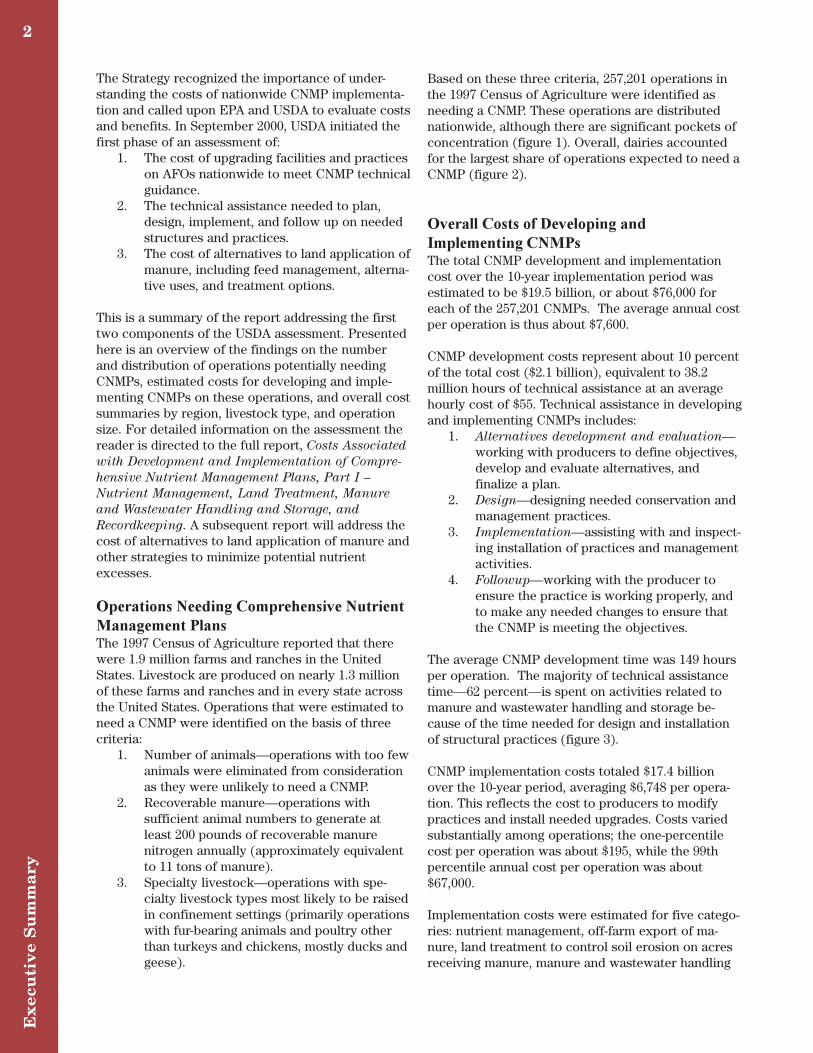
Based on these three criteria, 257,201 operations inthe 1997 Census of Agriculture were identified asneeding a CNMP. These operations are distributednationwide, although there are significant pockets ofconcentration (figure 1). Overall, dairies accountedfor the largest share of operations expected to need aCNMP (figure 2).
Overall Costs of Developing and
Implementing CNMPsThe total CNMP development and implementationcost over the 10-year implementation period wasestimated to be $19.5 billion, or about $76,000 foreach of the 257,201 CNMPs. The average annual costper operation is thus about $7,600.
CNMP development costs represent about 10 percentof the total cost ($2.1 billion), equivalent to 38.2million hours of technical assistance at an averagehourly cost of $55. Technical assistance in developingand implementing CNMPs includes:
1. Alternatives development and evaluation—
working with producers to define objectives,develop and evaluate alternatives, andfinalize a plan.
2. Design—designing needed conservation andmanagement practices.
3. Implementation—assisting with and inspect-ing installation of practices and managementactivities.
4. Followup—working with the producer toensure the practice is working properly, andto make any needed changes to ensure thatthe CNMP is meeting the objectives.
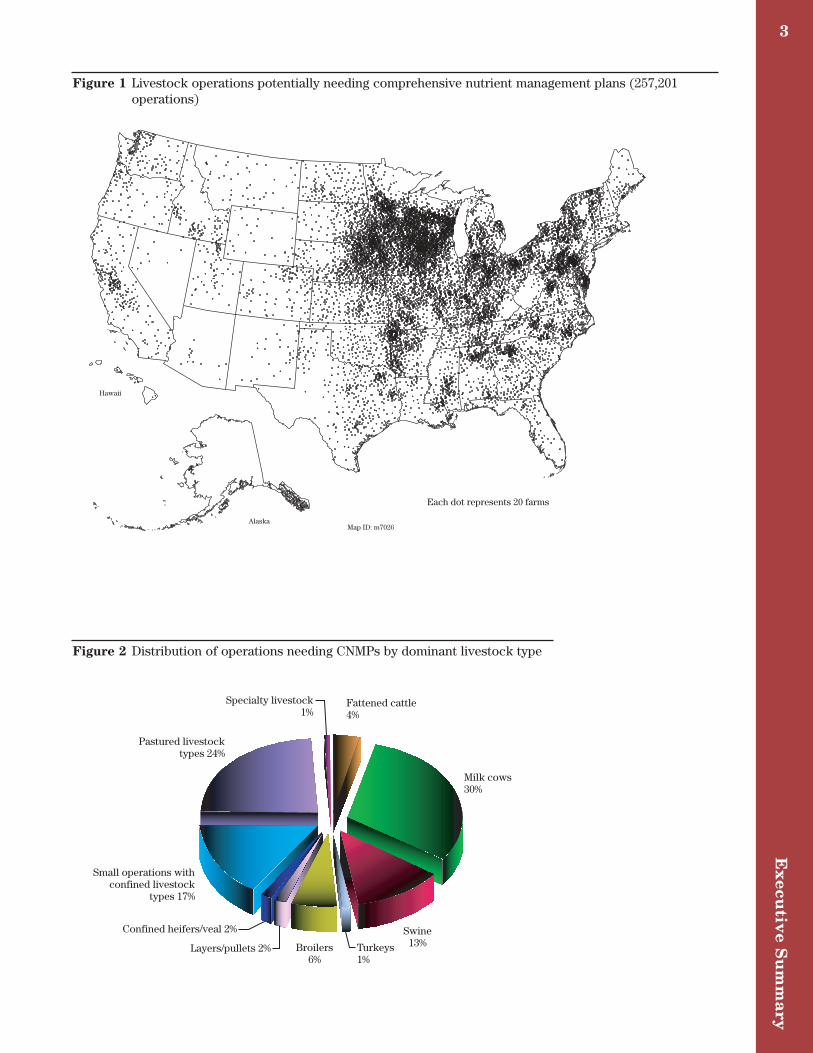
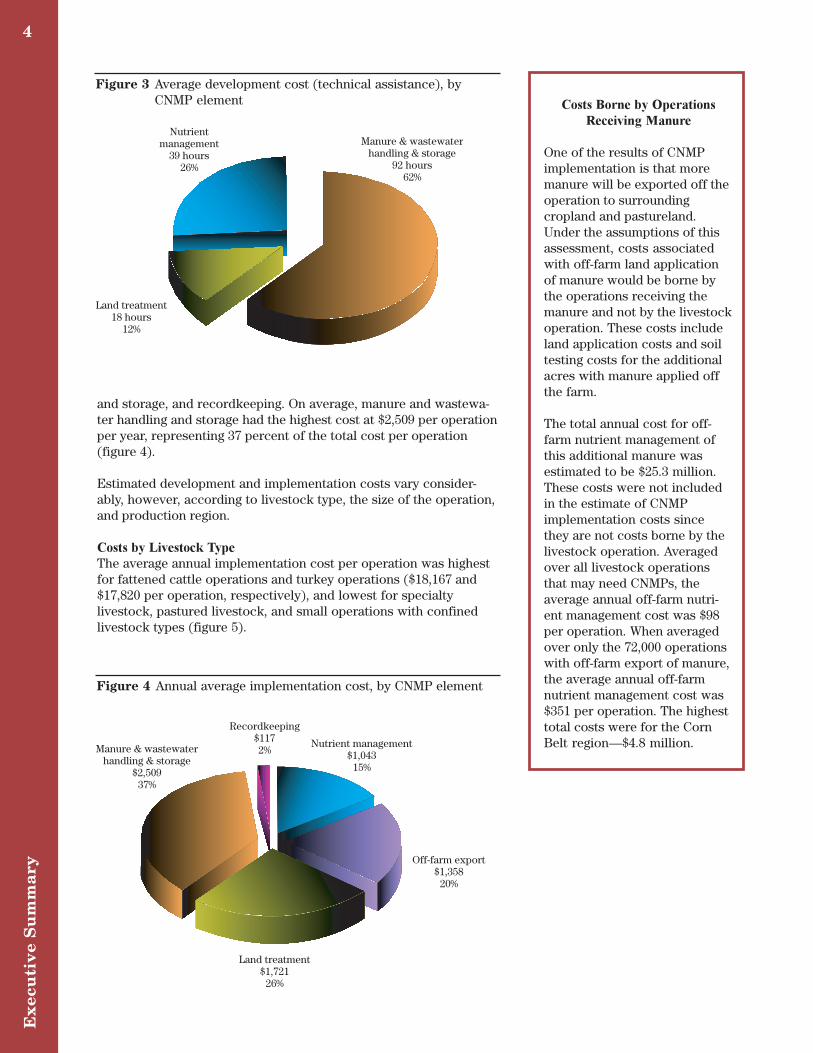
The average CNMP development time was 149 hoursper operation. The majority of technical assistancetime—62 percent—is spent on activities related tomanure and wastewater handling and storage be-cause of the time needed for design and installationof structural practices (figure 3).
CNMP implementation costs totaled $17.4 billionover the 10-year period, averaging $6,748 per opera-tion. This reflects the cost to producers to modifypractices and install needed upgrades. Costs variedsubstantially among operations; the one-percentilecost per operation was about $195, while the 99thpercentile annual cost per operation was about$67,000.
Implementation costs were estimated for five catego-ries: nutrient management, off-farm export of ma-nure, land treatment to control soil erosion on acresreceiving manure, manure and wastewater handling
Ex
ecutiv
e Su
mm
ary
3
Hawaii
AlaskaMap ID: m7026
Each dot represents 20 farms
Figure 2 Distribution of operations needing CNMPs by dominant livestock type
Figure 1 Livestock operations potentially needing comprehensive nutrient management plans (257,201operations)
Specialty livestock1%
Layers/pullets 2%
Confined heifers/veal 2%
Small operations withconfined livestock
types 17%
Pastured livestocktypes 24%
Fattened cattle4%
Milk cows30%
Swine13%Turkeys
1%Broilers
6%
Ex
ecu
tiv
e S
um
ma
ry4
Recordkeeping$1172%
Nutrient management$1,043
15%
Off-farm export$1,358
20%
Land treatment$1,721
26%
Manure & wastewaterhandling & storage
$2,509 37%
Nutrientmanagement
39 hours26%
Land treatment18 hours
12%
Manure & wastewaterhandling & storage
92 hours62%
and storage, and recordkeeping. On average, manure and wastewa-ter handling and storage had the highest cost at $2,509 per operationper year, representing 37 percent of the total cost per operation(figure 4).
Estimated development and implementation costs vary consider-ably, however, according to livestock type, the size of the operation,and production region.
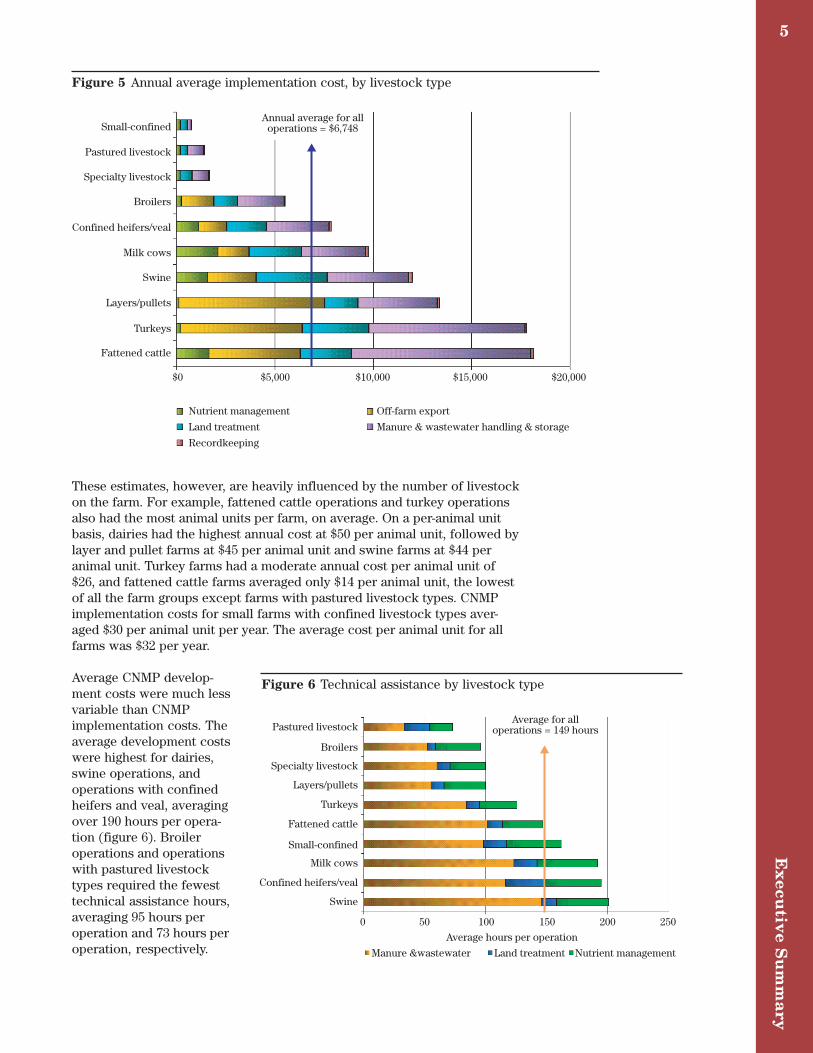
Costs by Livestock Type
The average annual implementation cost per operation was highestfor fattened cattle operations and turkey operations ($18,167 and$17,820 per operation, respectively), and lowest for specialtylivestock, pastured livestock, and small operations with confinedlivestock types (figure 5).
Figure 3 Average development cost (technical assistance), byCNMP element
Figure 4 Annual average implementation cost, by CNMP element
Costs Borne by Operations
Receiving Manure
One of the results of CNMPimplementation is that moremanure will be exported off theoperation to surroundingcropland and pastureland.Under the assumptions of thisassessment, costs associatedwith off-farm land applicationof manure would be borne bythe operations receiving themanure and not by the livestockoperation. These costs includeland application costs and soiltesting costs for the additionalacres with manure applied offthe farm.
The total annual cost for off-farm nutrient management ofthis additional manure wasestimated to be $25.3 million.These costs were not includedin the estimate of CNMPimplementation costs sincethey are not costs borne by thelivestock operation. Averagedover all livestock operationsthat may need CNMPs, theaverage annual off-farm nutri-ent management cost was $98per operation. When averagedover only the 72,000 operationswith off-farm export of manure,the average annual off-farmnutrient management cost was$351 per operation. The highesttotal costs were for the CornBelt region—$4.8 million.
Ex
ecutiv
e Su
mm
ary
5
Small-confined
Pastured livestock
Specialty livestock
Broilers
Confined heifers/veal
Milk cows
Swine
Layers/pullets
Turkeys
Fattened cattle
Nutrient management
Land treatment
Recordkeeping
Off-farm export
Manure & wastewater handling & storage
$0 $5,000 $10,000 $20,000$15,000
Annual average for alloperations = $6,748
These estimates, however, are heavily influenced by the number of livestockon the farm. For example, fattened cattle operations and turkey operationsalso had the most animal units per farm, on average. On a per-animal unitbasis, dairies had the highest annual cost at $50 per animal unit, followed bylayer and pullet farms at $45 per animal unit and swine farms at $44 peranimal unit. Turkey farms had a moderate annual cost per animal unit of$26, and fattened cattle farms averaged only $14 per animal unit, the lowestof all the farm groups except farms with pastured livestock types. CNMPimplementation costs for small farms with confined livestock types aver-aged $30 per animal unit per year. The average cost per animal unit for allfarms was $32 per year.
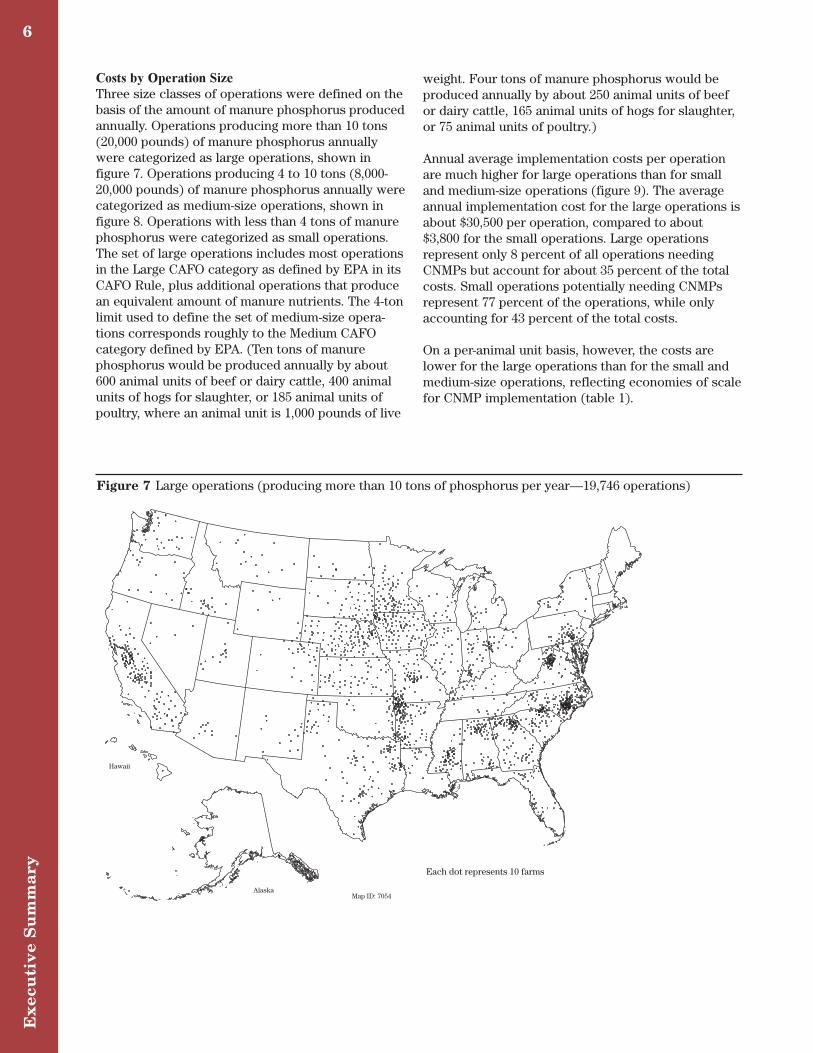
Average CNMP develop-ment costs were much lessvariable than CNMPimplementation costs. Theaverage development costswere highest for dairies,swine operations, andoperations with confinedheifers and veal, averagingover 190 hours per opera-tion (figure 6). Broileroperations and operationswith pastured livestocktypes required the fewesttechnical assistance hours,averaging 95 hours peroperation and 73 hours peroperation, respectively.
Figure 5 Annual average implementation cost, by livestock type
Small-confined
Pastured livestock
Specialty livestock
Broilers
Confined heifers/veal
Milk cows
Swine
Layers/pullets
Turkeys
Fattened cattle
Manure &wastewater Land treatment Nutrient management
0 50 100
Average hours per operation
200 250150
Average for alloperations = 149 hours
Figure 6 Technical assistance by livestock type
Ex
ecu
tiv
e S
um
ma
ry6
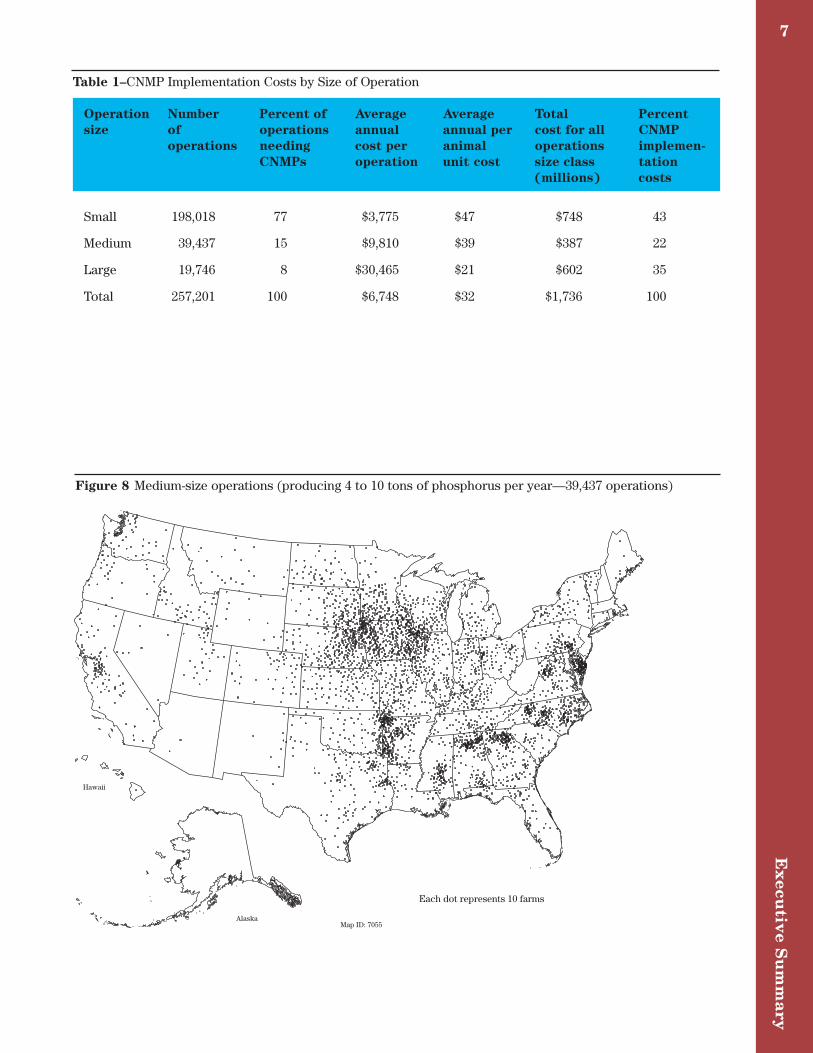
Costs by Operation Size
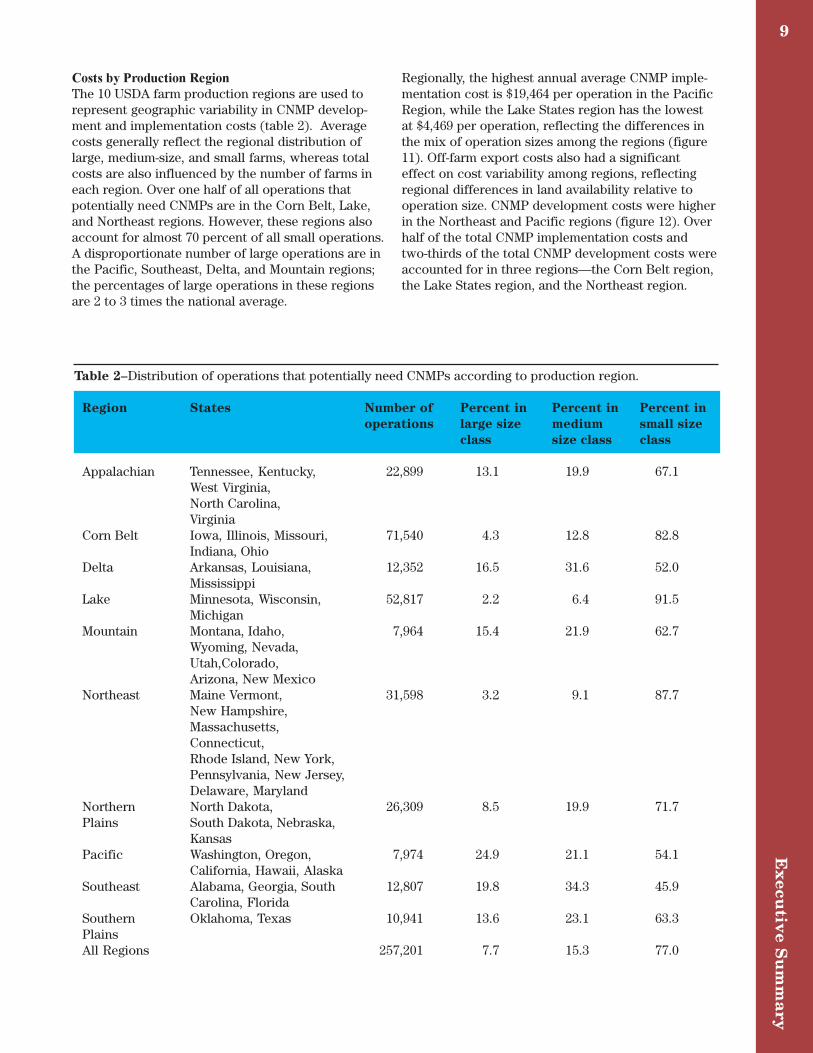
Three size classes of operations were defined on thebasis of the amount of manure phosphorus producedannually. Operations producing more than 10 tons(20,000 pounds) of manure phosphorus annuallywere categorized as large operations, shown infigure 7. Operations producing 4 to 10 tons (8,000-20,000 pounds) of manure phosphorus annually werecategorized as medium-size operations, shown infigure 8. Operations with less than 4 tons of manurephosphorus were categorized as small operations.The set of large operations includes most operationsin the Large CAFO category as defined by EPA in itsCAFO Rule, plus additional operations that producean equivalent amount of manure nutrients. The 4-tonlimit used to define the set of medium-size opera-tions corresponds roughly to the Medium CAFOcategory defined by EPA. (Ten tons of manurephosphorus would be produced annually by about600 animal units of beef or dairy cattle, 400 animalunits of hogs for slaughter, or 185 animal units ofpoultry, where an animal unit is 1,000 pounds of live
weight. Four tons of manure phosphorus would beproduced annually by about 250 animal units of beefor dairy cattle, 165 animal units of hogs for slaughter,or 75 animal units of poultry.)
Annual average implementation costs per operationare much higher for large operations than for smalland medium-size operations (figure 9). The averageannual implementation cost for the large operations isabout $30,500 per operation, compared to about$3,800 for the small operations. Large operationsrepresent only 8 percent of all operations needingCNMPs but account for about 35 percent of the totalcosts. Small operations potentially needing CNMPsrepresent 77 percent of the operations, while onlyaccounting for 43 percent of the total costs.
On a per-animal unit basis, however, the costs arelower for the large operations than for the small andmedium-size operations, reflecting economies of scalefor CNMP implementation (table 1).
Hawaii
AlaskaMap ID: 7054
Each dot represents 10 farms
Figure 7 Large operations (producing more than 10 tons of phosphorus per year—19,746 operations)
Ex
ecutiv
e Su
mm
ary
7
Table 1–CNMP Implementation Costs by Size of Operation
Operation Number Percent of Average Average Total Percent
size of operations annual annual per cost for all CNMP
operations needing cost per animal operations implemen-
CNMPs operation unit cost size class tation
(millions) costs
Small 198,018 77 $3,775 $47 $748 43
Medium 39,437 15 $9,810 $39 $387 22
Large 19,746 8 $30,465 $21 $602 35
Total 257,201 100 $6,748 $32 $1,736 100
Figure 8 Medium-size operations (producing 4 to 10 tons of phosphorus per year—39,437 operations)
Hawaii
AlaskaMap ID: 7055
Each dot represents 10 farms

Ex
ecu
tiv
e S
um
ma
ry8
Small
Medium-size
Large
Nutrient managementLand treatmentRecordkeeping
$0 $5,000 $10,000 $20,000 $25,000 $30,000 $35,000$15,000
Annual average for alloperations = $6,748
Off-farm exportManure & wastewater handling & storage
Small
Medium-size
Large
0Average hours per operation
100 150 20050
Average for alloperations = 149 hours
Manure & wastewater Land treatment Nutrient management
Variation in CNMP development costs according tothe size of operation was not pronounced, which isexpected as there is a practical minimum cost fordeveloping a CNMP. Large operations averaged 170hours of technical assistance per operation and small
operations averaged 146 hours per operation (figure10). Larger farms generally have more complexsituations, but the technical assistance required isnot proportional to the size of the operation.
Figure 9 Annual average implementation costs, by operation size
Figure 10 Technical assistance by operation size
Ex
ecutiv
e Su
mm
ary
9
Costs by Production Region
The 10 USDA farm production regions are used torepresent geographic variability in CNMP develop-ment and implementation costs (table 2). Averagecosts generally reflect the regional distribution oflarge, medium-size, and small farms, whereas totalcosts are also influenced by the number of farms ineach region. Over one half of all operations thatpotentially need CNMPs are in the Corn Belt, Lake,and Northeast regions. However, these regions alsoaccount for almost 70 percent of all small operations.A disproportionate number of large operations are inthe Pacific, Southeast, Delta, and Mountain regions;the percentages of large operations in these regionsare 2 to 3 times the national average.
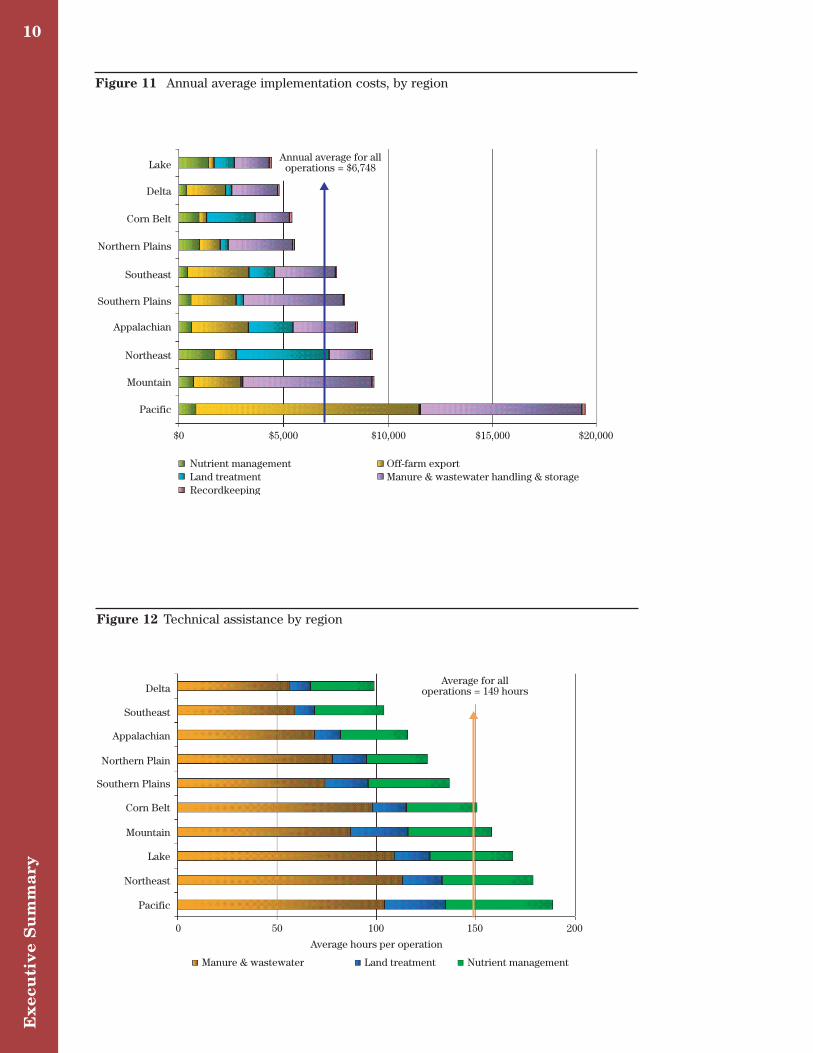
Regionally, the highest annual average CNMP imple-mentation cost is $19,464 per operation in the PacificRegion, while the Lake States region has the lowestat $4,469 per operation, reflecting the differences inthe mix of operation sizes among the regions (figure11). Off-farm export costs also had a significanteffect on cost variability among regions, reflectingregional differences in land availability relative tooperation size. CNMP development costs were higherin the Northeast and Pacific regions (figure 12). Overhalf of the total CNMP implementation costs andtwo-thirds of the total CNMP development costs wereaccounted for in three regions—the Corn Belt region,the Lake States region, and the Northeast region.
Table 2–Distribution of operations that potentially need CNMPs according to production region.
Region States Number of Percent in Percent in Percent in
operations large size medium small size
class size class class
Appalachian Tennessee, Kentucky, 22,899 13.1 19.9 67.1West Virginia,North Carolina,Virginia
Corn Belt Iowa, Illinois, Missouri, 71,540 4.3 12.8 82.8Indiana, Ohio
Delta Arkansas, Louisiana, 12,352 16.5 31.6 52.0Mississippi
Lake Minnesota, Wisconsin, 52,817 2.2 6.4 91.5Michigan
Mountain Montana, Idaho, 7,964 15.4 21.9 62.7Wyoming, Nevada,Utah,Colorado,Arizona, New Mexico
Northeast Maine Vermont, 31,598 3.2 9.1 87.7New Hampshire,Massachusetts,Connecticut,Rhode Island, New York,Pennsylvania, New Jersey,Delaware, Maryland
Northern North Dakota, 26,309 8.5 19.9 71.7Plains South Dakota, Nebraska,
KansasPacific Washington, Oregon, 7,974 24.9 21.1 54.1
California, Hawaii, AlaskaSoutheast Alabama, Georgia, South 12,807 19.8 34.3 45.9
Carolina, FloridaSouthern Oklahoma, Texas 10,941 13.6 23.1 63.3PlainsAll Regions 257,201 7.7 15.3 77.0
Ex
ecu
tiv
e S
um
ma
ry10
Lake
Delta
Corn Belt
Northern Plains
Southeast
Southern Plains
Northeast
Appalachian
Mountain
Pacific
Nutrient managementLand treatmentRecordkeeping
Off-farm exportManure & wastewater handling & storage
$0 $5,000 $10,000 $20,000$15,000
Annual average for alloperations = $6,748
Delta
Southeast
Appalachian
Northern Plain
Southern Plains
Corn Belt
Mountain
Lake
Northeast
Pacific
Manure & wastewater Nutrient managementLand treatment
0 50 100
Average hours per operation
200150
Average for alloperations = 149 hours
Figure 11 Annual average implementation costs, by region
Figure 12 Technical assistance by region
Ex
ecutiv
e Su
mm
ary
11
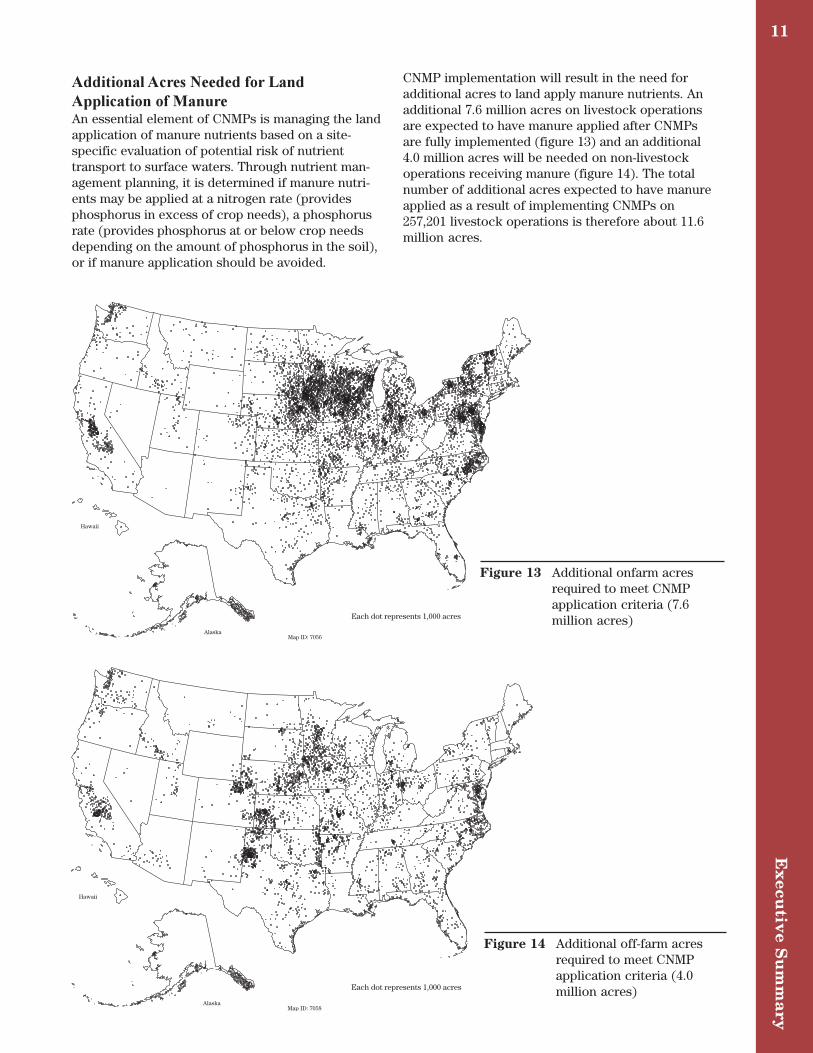
Additional Acres Needed for Land
Application of ManureAn essential element of CNMPs is managing the landapplication of manure nutrients based on a site-specific evaluation of potential risk of nutrienttransport to surface waters. Through nutrient man-agement planning, it is determined if manure nutri-ents may be applied at a nitrogen rate (providesphosphorus in excess of crop needs), a phosphorusrate (provides phosphorus at or below crop needsdepending on the amount of phosphorus in the soil),or if manure application should be avoided.
CNMP implementation will result in the need foradditional acres to land apply manure nutrients. Anadditional 7.6 million acres on livestock operationsare expected to have manure applied after CNMPsare fully implemented (figure 13) and an additional4.0 million acres will be needed on non-livestockoperations receiving manure (figure 14). The totalnumber of additional acres expected to have manureapplied as a result of implementing CNMPs on257,201 livestock operations is therefore about 11.6million acres.
Figure 13 Additional onfarm acresrequired to meet CNMPapplication criteria (7.6million acres)
Hawaii
AlaskaMap ID: 7056
Each dot represents 1,000 acres
Figure 14 Additional off-farm acresrequired to meet CNMPapplication criteria (4.0million acres)
Hawaii
AlaskaMap ID: 7058
Each dot represents 1,000 acres
Ex
ecu
tiv
e S
um
ma
ry12
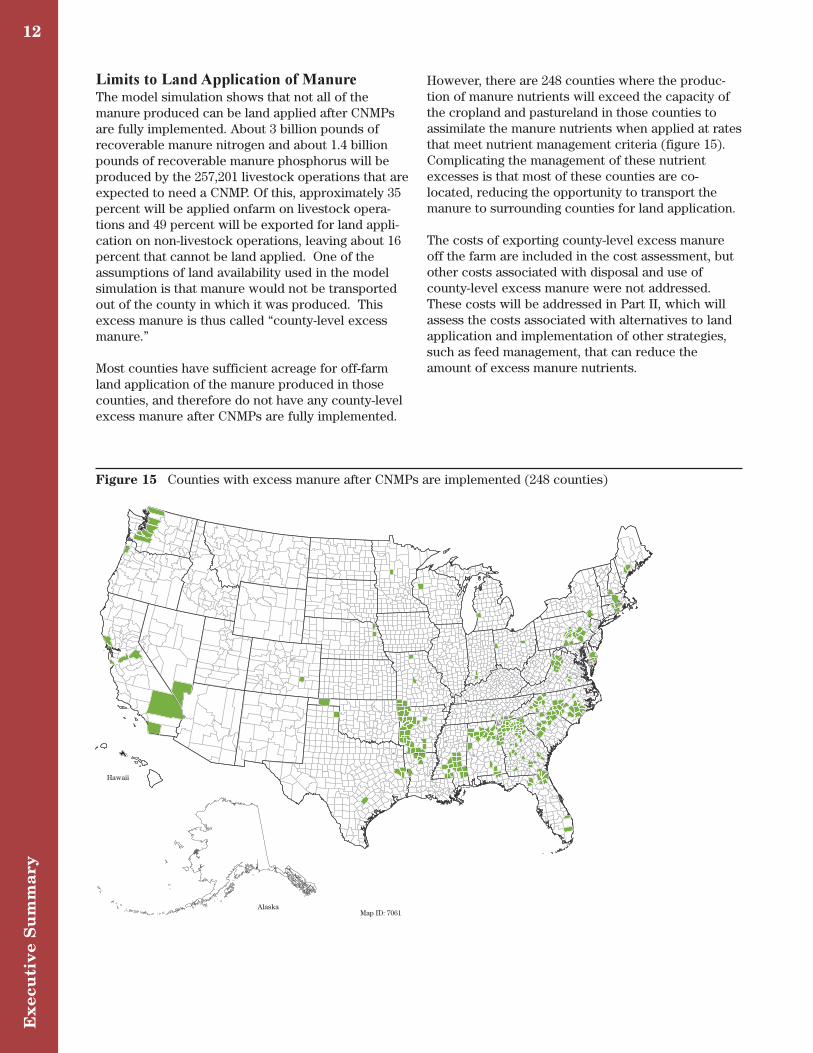
Limits to Land Application of ManureThe model simulation shows that not all of themanure produced can be land applied after CNMPsare fully implemented. About 3 billion pounds ofrecoverable manure nitrogen and about 1.4 billionpounds of recoverable manure phosphorus will beproduced by the 257,201 livestock operations that areexpected to need a CNMP. Of this, approximately 35percent will be applied onfarm on livestock opera-tions and 49 percent will be exported for land appli-cation on non-livestock operations, leaving about 16percent that cannot be land applied. One of theassumptions of land availability used in the modelsimulation is that manure would not be transportedout of the county in which it was produced. Thisexcess manure is thus called “county-level excessmanure.”
Most counties have sufficient acreage for off-farmland application of the manure produced in thosecounties, and therefore do not have any county-levelexcess manure after CNMPs are fully implemented.
However, there are 248 counties where the produc-tion of manure nutrients will exceed the capacity ofthe cropland and pastureland in those counties toassimilate the manure nutrients when applied at ratesthat meet nutrient management criteria (figure 15).Complicating the management of these nutrientexcesses is that most of these counties are co-located, reducing the opportunity to transport themanure to surrounding counties for land application.
The costs of exporting county-level excess manureoff the farm are included in the cost assessment, butother costs associated with disposal and use ofcounty-level excess manure were not addressed.These costs will be addressed in Part II, which willassess the costs associated with alternatives to landapplication and implementation of other strategies,such as feed management, that can reduce theamount of excess manure nutrients.
Figure 15 Counties with excess manure after CNMPs are implemented (248 counties)
Hawaii
AlaskaMap ID: 7061
Ex
ecutiv
e Su
mm
ary
13
Concluding RemarksThe costs presented in this assessment reflect theupgrades needed to bring existing operations up to alevel of environmental performance characterized bya CNMP. Presently, CNMPs primarily address waterquality concerns. Thus, cost could be affected aspractices and treatments to address emerging envi-ronmental concerns—such as air quality, pathogens,and use of growth hormones and pharmaceuticals—are woven into CNMPs.
There are aspects of the simulation that limit theaccuracy of the estimates presented or affect howthese estimates can be used appropriately, including:
• Uncertainty regarding input data and
assumptions. The simulation model is amix of census, survey, and statistical datawith further benefit of expert judgment andmodeling assumptions. The resulting costestimates for specific operations are there-fore inexact. The expectation is that under-estimates of CNMP costs for specific opera-tions will balance against over-estimates forother operations, and that the final result willbe a reasonable cost estimate at the nationaland regional level.
• Changes in the livestock sector. Thesecost estimates represent costs associatedwith the assemblage of farms and ranches asof December 31, 1997. No adjustment wasmade for continuing trends of concentrationand consolidation; thus actual costs areexpected to differ somewhat from theestimated costs presented here.
• State and local regulations. States con-tinue to move forward in addressing theirspecific AFO concerns. Many have alreadyimplemented legislation calling for AFOs toadopt nutrient management. It was notpossible to factor the ongoing adoption rateinto this assessment; hence, some CNMPcosts may have already been borne by somelivestock operations.
• Inflation and potential cost offsets. Costsrepresented do not reflect inflation over the10-year implementation period or anypotential cost offsets that producers mightreceive. Cost offsets could include reduc-tions in commercial fertilizer purchases,benefits from improved efficiencies attainedby CNMP implementation, improved yieldsresulting from enhanced soil quality andbetter management of nutrients, and govern-ment cost-share or incentive payments.
CNMP development and implementation
costs are not estimates of the costs to
producers of complying with EPA
regulations
The largest livestock operations and operationsthat may pose a risk to the environment becauseof location are regulated by the U.S. Environ-mental Protection Agency. Under the NationalPollutant Discharge Elimination System(NPDES), Concentrated Animal Feeding Opera-tions (CAFOs) are required to have permits toensure that the operation of the facility does notthreaten water quality. In December 2002, EPAannounced revisions to the CAFO rule. Underthe new rule all large CAFOs will be required toapply for a permit, submit an annual report, anddevelop and follow a plan for handling manureand wastewater. EPA estimates that the CAFOrule will affect about 15,500 operations nation-wide.
It was not the purpose of this publication toestimate the costs to livestock operations ofcomplying with EPA regulations, but rather toestimate the costs for the development andimplementation of CNMPs on all operationsexpected to need CNMPs (257,201 operations).The costs associated with regulation may bemore or less than the costs of developing andimplementing a CNMP, depending on the spe-cific location and characteristics of the facility.