Embed Size (px)
Citation preview

54 MANAGED CARE / DECEMBER 2015
Incremental Hospital Costs Associated With Comorbidities of PrematurityLibby Black, PharmD,1 Thomas Hulsey, ScD,2 Kwan Lee, PhD,3 Daniel C. Parks, PhD,4 Myla D. Ebeling, RA2
1GlaxoSmithKline, Research Triangle Park, NC 2Division of Neonatology, Department of Pediatrics, Medical University of South Carolina, Charleston, SC3GlaxoSmithKline, Brentford, London, United Kingdom 4U.S. Payer Evidence Group, GlaxoSmithKline, Research Triangle Park, NC
INtRoDuCtIoN An increasing worldwide incidence of preterm birth (earlier than gestational age [GA] 37 weeks) has been reported in recent years (IOM 2007, Blencowe 2012). In 2010, an estimated 14.9 mil-lion babies were born preterm, repre-senting 11.1% of live births worldwide (Blencowe 2012). Preterm birth rates are generally highest in low income regions; however, the United States has one of the highest incidences, which peaked at 12.8% in 2006 before decreasing to 11.4% in 2013 (IOM 2007, Blencowe 2012, Hamilton 2014, Martin 2011). In 2010, 35.2% of all US infant deaths were deemed to be re-lated to prematurity (Matthews 2013).
Preterm birth is associated with greater infant morbidity and in-creased health care costs, including higher delivery visit costs due to lon-ger hospital stays and a greater need for intensive care due to medical care related to morbidities of prematurity (IOM 2007, McLaurin 2009). In a US national study conducted in 2001, 8% of infants were judged as preterm, ac-counting for 47% of the total cost of infant hospitalizations and 27% of the cost for all pediatric admissions, or $5.8 billion in all (Russell 2007). Overall, most premature infants born in the United States each year are ei-ther moderately premature (31–33 weeks gestation) or later preterm (34– 36weeks gestation) (Martin 2011). Together, these 2 groups account for more than 70% of all preterm births. A retrospective, US-based study published in 2009 demonstrated
Original Research
infants born 33–36 weeks GA had substantially longer mean birth- hospitalization stays than term infants (8.8 vs 2.2 days) and incurred mean hospitalization costs of $26,054—more than 12-fold greater than those reported for term infants ($2,061) (McLaurin 2009).
Although the moderately and late-preterm birth populations make up a greater proportion of costs for the en-tire population, the per patient costs and rates of morbidities associated
with prematurity are much greater in the lower GAs. Studies have demon-strated that the rates of comorbidities associated with prematurity increase in infants with decreasing GA (Berard 2012, Stoll 2010). Respiratory distress syndrome (RDS), for example, has been reported in 82% of infants born at GA 25 weeks compared with 0.6% of infants born at GA 38 weeks (Gil-bert 2003). Therefore, the cost burden of preterm birth is often increased by further treatment for associated
AbstRACtPurpose: Preterm birth (PTB), defined as birth at a gestational age (GA) of
less than 37 weeks, is associated with increased hospital costs. Lower GA at birth is negatively correlated with the presence of neonatal comorbidities, further increasing costs. This study evaluated incremental costs associated with comorbidities of PTB following spontaneous labor at 24–36 weeks.
Design: Birth records from January 2001 to December 2010 at the Medical University of South Carolina were screened to identify infants born at GA 23–37 weeks after uncomplicated singleton pregnancies and surviving to discharge.
Methodology: Comorbidities of interest and incremental costs were analyzed with a partial least squares (PLS) regression model adjusted for comorbidities and GA. Incremental comorbidity-associated costs, as well as total costs, were estimated for infants of GA 24–36 weeks.
Results: A total of 4,292 delivery visit records were analyzed. Use of the PLS regression model eliminated issues of multicollinearity and allowed derivation of stable cost estimates. Incremental costs of comorbidities at a mean GA of 34 weeks ranged from $4,529 to $23,121, and exceeded $9,000 in 6 cases. Incremental costs ranged from a high of $41,161 for a GA 24-week infant with a comorbidity of retinopathy of prematurity requiring surgery (ROP4) to $3,683 for a GA 36-week infant with a comorbidity of convulsions. Incremental comorbidity costs are additive, so the costs for infants with mul-tiple comorbidities could easily exceed the high of $41,161 seen with ROP4.
Conclusions: The PLS regression model allowed derivation of stable cost estimates from multivariate and highly collinear data and can be used in future cost analyses. Using this data set, predicted costs of all comorbidities, as well as total costs, negatively correlated with GA at birth.
DECEMBER 2015 / MANAGED CARE 55
Incremental Costs Associated With Prematurity
quiring surgery (ROP4), convulsions, and brain injury (PVL/choroid plexus cyst, porencephalic cyst, and/or ac-quired hydrocephalus).
Costs for preterm birth with no comorbidities, together with incre-mental costs for the presence of any of 13 comorbidities, were estimated at a mean GA of 34.3 weeks using a partial least squares (PLS) regression model. Data were adjusted for comor-bidities and GA, log transformed, and inserted into the PLS model to calcu-late the effect of 27 variables (presence or absence of any of 13 comorbidi-ties plus week of GA at birth) on in-cremental health care costs. Tenfold cross-validation of the full model us-ing an independent data set not used during the training stage of the PLS model optimized the predictive accu-racy of the PLS model (Picard 1984). Cost outliers were retained in the model and bootstrapping was used to test model stability.
Costs for preterm birth with
comorbidities and negatively cor-relates with GA at birth (Matthews 2013, McLaurin 2009). However, few studies explore how costs vary with the diagnosis of comorbidities of pre-maturity and GA.
High and potentially increasing rates of preterm birth are an impor-tant issue due to the associated social and health care cost burdens of pre-maturity (IOM 2007). Complete and valid estimates of costs and cost driv-ers associated with prematurity at dif-fering weeks of gestation are needed to inform allocation of health care re-sources and support the development and reimbursement of therapies that may help to prevent preterm labor and preterm birth, identify best practices and/or quality measures, and further the implementation of cost-effective treatments.
This study was designed to evalu-ate the incremental costs associated with premature birth and neonatal comorbidities of prematurity at a GA of between 24 and 36 weeks. In ad-dition, the study explored whether stable cost estimates could be derived for use in future economic evaluations or costing studies.
MethodsA retrospective review of 14,276 ma-ternal and infant records from January 2001 to December 2010 at the Medical University of South Carolina (MUSC) identified infants born at GA 23 to 37 weeks to mothers who had been admitted in spontaneous preterm la-bor with intact membranes following uncomplicated singleton pregnancies. MUSC is a regional tertiary referral hospital in the southern United States with a perinatal database (Perinatal Information System) containing de-tailed delivery information and neo-natal data from birth to discharge, including diagnosis codes for babies born at each GA week. Data on total hospital charges, as calculated with a specific algorithm for each insurer/
payer, were available for all infants. Prior studies of the cost during the neonatal period, showed that neonatal costs tended to be higher for preterm infants who survive compared with those who die (Johnson 2013). Also, very premature infants who die are likely to die in the first 2 weeks of life and are less likely to be diagnosed with a comorbidity. Thus, our analysis included all infants who survived to discharge, irrespective of the presence of comorbidities of interest. Thirteen recognized comorbidities associated with prematurity were identified (Stoll 2010, Gilbert 2003, Finer 2006, Johnson 2013, Okike 2014, Simon-sen 2014, Strauss 2010). In addition to RDS, they included broncho-pulmonary dysplasia (BPD), sepsis, meningitis, necrotizing enterocolitis (NEC), intraventricular hemorrhage I & II and III & IV (IVH I/II & IVH III/IV), periventricular leukomalacia (PVL), anemia requiring transfusion, apnea, retinopathy of prematurity re-
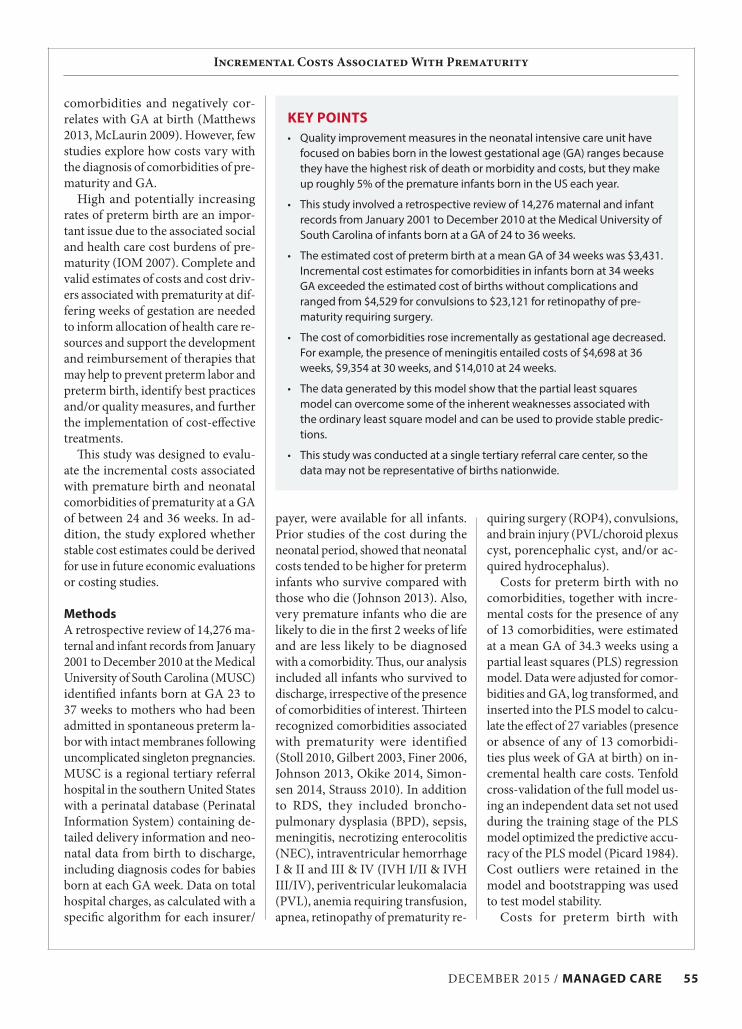
KEy PoINts• Quality improvement measures in the neonatal intensive care unit have
focused on babies born in the lowest gestational age (GA) ranges because they have the highest risk of death or morbidity and costs, but they make up roughly 5% of the premature infants born in the US each year.
• This study involved a retrospective review of 14,276 maternal and infant records from January 2001 to December 2010 at the Medical University of South Carolina of infants born at a GA of 24 to 36 weeks.
• The estimated cost of preterm birth at a mean GA of 34 weeks was $3,431. Incremental cost estimates for comorbidities in infants born at 34 weeks GA exceeded the estimated cost of births without complications and ranged from $4,529 for convulsions to $23,121 for retinopathy of pre-maturity requiring surgery.
• The cost of comorbidities rose incrementally as gestational age decreased. For example, the presence of meningitis entailed costs of $4,698 at 36 weeks, $9,354 at 30 weeks, and $14,010 at 24 weeks.
• The data generated by this model show that the partial least squares model can overcome some of the inherent weaknesses associated with the ordinary least square model and can be used to provide stable predic-tions.
• This study was conducted at a single tertiary referral care center, so the data may not be representative of births nationwide.

56 MANAGED CARE / DECEMBER 2015
Incremental Costs Associated With Prematurity
Adjusting the predicted costs for differing GA at birth demonstrated a negative correlation between GA and total associated costs for all co-morbidities, as well as for a birth without complications (Table 2). Adjustments from the mean GA at birth (34 weeks) for comorbidities ranged from $423 (convulsions) to
in all cases, and ranged from $4,529 for convulsions to $23,121 for ROP4. Costs in excess of $9,000 were associ-ated with the presence of any of the following comorbidities at 34 weeks GA: BPD, $11,652; sepsis, $9,040; NEC, $10,371; IVH (III/IV), $9,447; anemia requiring transfusion, $9,590; and ROP4, $23,121 (Table 2).
no comorbidities, together with comorbidity- associated costs at any GA (24–36 weeks), were subsequently calculated from the mean value ac-cording to the following equation:
Predicted cost = (incremental comorbidity cost estimate) – (comorbidity adjusted for GA) × (gestational age difference [from the mean value of 34.3 weeks]).
REsultsThe study sample included 4,292 delivery visit hospital records for in-fants born at GA 23–37 weeks. Demo-graphic distributions are presented in Table 1. Comorbidities of interest identified most commonly across all infant records were RDS (19.8%), apnea (12.5%), anemia requiring transfusion (7.9%), and BPD (5.8%) (Table 1). One of the main problems when applying multivariate regres-sion and discriminant analyses is the collinearity among the variables used in the models. Such collinearity problems can lead to serious stability problems when the methods are ap-plied. Transformation of our infant cost data and implementation of the PLS regression analysis model elimi-nated issues with collinearity, leading to stable incremental cost estimates (cross-validated R2, Q2 = 0.69) that correlated with actual costs observed in the database (Figure 1). To estimate the precision of our sample statistics (medians, variances, percentiles) we used bootstrapping statistics (drawing randomly with replacement). Further analysis demonstrated that the model was stable under bootstrapping, and that the accuracy of prediction was preserved when outlier cost data were retained (Figure 1).
The estimated cost of preterm birth at a mean GA of 34 weeks was $3,431. Incremental cost estimates for comorbidities in infants born at GA 34 weeks exceeded the estimated cost of births without complications
tAblE 1Infant demographics
N %
Total number of infants 4,292 100.0
Sex
Male 2,185 50.9
Race
Black 2,295 53.5
White 1,335 31.1
Hispanic 601 14.0
Othera 61 1.4
Insurance status
Private insurance 1,120 26.1
Medicaid 2,459 57.3
Indigent 708 16.5
Comorbidity presenceb
RDS 851 19.8
BPD 247 5.8
Sepsis 189 4.4
Meningitis 22 0.5
NEC 45 1.1
IVH (I/II) 210 4.9
IVH (III/IV) 30 0.7
PVL 86 2.0
Anemia 340 7.9
Apnea 539 12.6
Brain injury (PVL/CPV) 44 1.0
ROP4 7 0.2
Convulsions 17 0.4a Other=American Indian, Asian, other.b Comorbidities do not add up to 100% due to the presence of subjects with either no or multiple comorbidities. BPD=bronchopulmonary dysplasia; IVH=intraventricular hemorrhage; NEC=necrotizing enterocolitis; PVL=periventricular leukomalacia; PVL/CPV=periventricular leukomalacia/choroid plexus cyst, porencephalic cyst, and/or acquired hydrocephalus; RDS=respiratory distress syndrome; ROP4=retinopathy of prematurity requiring surgery.

DECEMBER 2015 / MANAGED CARE 57
Incremental Costs Associated With Prematurity
$1,804 (ROP4) per weekly decrease in GA, whereas the cost of preterm birth with no comorbidities increased by $884 for every reduction in GA by week (Table 2). The cost of pre-term birth without comorbidities was estimated at $1,663 at GA 36 weeks, increasing more than sevenfold to $12,271 at GA 24 weeks. The cost of comorbidities also rose incrementally over the GA range; the presence of BPD, for example, entailed costs of $9,356 at GA 36 weeks compared with $23,132 at GA 24 weeks. Incremental costs for all comorbidities of interest at GA 24, 30, and 36 weeks are shown in Figure 2, while full breakdowns of costs for comorbidities at GA 24 to 36 weeks are listed in Table 3.
Total costs of preterm birth for infants with comorbidities (pre-term birth plus incremental co-morbidity-associated costs) at GA 36 weeks ranged from $5,346 with convulsions to $21,176 with ROP4. In comparison, total costs at GA 24 weeks ranged from $21,030 with con-vulsions to $53,432 with ROP4. Costs by GA for birth with and without selected comorbidities are shown in Figure 3.
DIsCussIoN There is a shortage of reliable data on the cost of comorbidities associ-ated with prematurity by GA. John-son (2013) is the only other study to explore the costs of multiple comor-bidities of prematurity. Their study differed from ours by focusing on very low birth weight (VLBW) in-fants (<1500 g) and considered only 4 comorbidities of prematurity (brain injury, which comprised IVH, PVL, and acquired hydrocephalus; NEC stages 2 & 3; BPD; and late-onset sep-sis). They reported marginal costs, controlling for GA, birth weight and socioeconomic status, thus not allowing the reader to explore how costs would vary with increasing or decreasing GA. Our results allow for
tAblE 2Estimated incremental cost of comorbidities adjusted for GA and further comorbidities
Variable
Incremental cost estimate at
Week 34.3 (us$)
Cost adjustment for each increase in weekly
GA at birth (us$)Birth without complications (intercept)
3,431 –884
RDS 5,453 –841
BPD 11,652 –1,148
Sepsis 9,040 –1,022
Meningitis 6,250 –776
NEC 10,371 –1,151
IVH (I/II) 6,491 –868
IVH (III/IV) 9,447 –768
PVL 6,010 –857
Anemia 9,590 –1,023
Apnea 6,196 –878
PVL/CPV 7,810 –936
ROP4 23,121 –1,804
Convulsions 4,529 –423BPD=bronchopulmonary dysplasia; GA=gestational age; IVH=intraventricular hemorrhage; NEC=necrotizing enterocolitis; PVL=periventricular leukomalacia; PVL/CPV=periventricular leukomalacia/choroid plexus cyst, porencephalic cyst, and/or acquired hydrocephalus; RDS=respiratory distress syndrome; ROP4=retinopathy of prematurity requiring surgery.
FIGuRE 1Predicted vs observed costs (us$) during cross-validation of the partial least squares means analysis with outliers retained
Cross-validation of the partial least squares (PLS) model using an independent data set not used during the training stage of the PLS model indicated strong perfor-mance (R2=0.69) of the model during prediction. The majority of predicted values correlated well with known observed costs in this data set (red line shows perfect correlation), with only a few outliers where costs were underestimated.
Observed cost
Predicted cost vs observed cost
Pred
icte
d co
st (U
S$ th
ousa
nds)
700
600
500
400
300
200
100
0
0 100 200 300 400 500 600 700

58 MANAGED CARE / DECEMBER 2015
Incremental Costs Associated With Prematurity
the exploration of how costs will vary for different GAs in addition to the impact of individual and overlapping comorbidities of prematurity. Thus, our results allow the user to calculate the costs of prematurity based on the distribution of premature births by GA seen within an institution in ad-dition to adjusting these costs by the distribution and incremental costs of 13 of the most common comorbidi-ties associated with prematurity. This would allow for the tailoring of cost calculations based on incremental costs for specific GA and comorbidi-ties of interest rather than the use of diagnostic-related groups (based on birth weight classifications) or Clini-cal Classifications Software categories (used by Healthcare Utilization Proj-ect–HCUP), which cluster patient di-agnoses and procedures into grouped codes. This is an important step to-ward enabling payers to anticipate the costs of individual cases and allow for better management of benefits based on the needs of individual infants.
Initially an ordinary least squares (OLS) regression model was explored
tAblE 3Adjusted cost (us$) estimates of comorbidities by GA (weeks) at birthGAat birth RDs bPD sepsis
Menin-gitis NEC IVH I/II
IVH III/IV PVl Anemia Apnea
PVl/CPV RoP4
Convul-sions
24 13,863 23,132 19,260 14,010 21,881 15,171 17,127 14,580 19,820 14,976 17,170 41,161 8,759
25 13,022 21,984 18,238 13,234 20,730 14,303 16,359 13,723 18,797 14,098 16,234 39,357 8,336
26 12,181 20,836 17,216 12,458 19,579 13,435 15,591 12,866 17,774 13,220 15,298 37,553 7,913
27 11,340 19,688 16,194 11,682 18,428 12,567 14,823 12,009 16,751 12,342 14,362 35,749 7,490
28 10,499 18,540 15,172 10,906 17,277 11,699 14,055 11,152 15,728 11,464 13,426 33,945 7,067
29 9,658 17,392 14,150 10,130 16,126 10,831 13,287 10,295 14,705 10,586 12,490 32,141 6,644
30 8,817 16,244 13,128 9,354 14,975 9,963 12,519 9,438 13,682 9,708 11,554 30,337 6,221
31 7,976 15,096 12,106 8,578 13,824 9,095 11,751 8,581 12,659 8,830 10,618 28,533 5,798
32 7,135 13,948 11,084 7,802 12,673 8,227 10,983 7,724 11,636 7,952 9,682 26,729 5,375
33 6,294 12,800 10,062 7,026 11,522 7,359 10,215 6,867 10,613 7,074 8,746 24,925 4,952
34 5,453 11,652 9,040 6,250 10,371 6,491 9,447 6,010 9,590 6,196 7,810 23,121 4,529
35 4,612 10,504 8,018 5,474 9,220 5,623 8,679 5,153 8,567 5,318 6,874 21,317 4,106
36 3,771 9,356 6,996 4,698 8,069 4,755 7,911 4,296 7,544 4,440 5,938 19,513 3,683
BPD=bronchopulmonary dysplasia; GA=gestational age; IVH=intraventricular hemorrhage; NEC=necrotizing enterocolitis; PVL=periventricular leukomalacia, PVL/CPV=periventricular leukomalacia/choroid plexus cyst, porencephalic cyst, and/or acquired hydrocephalus; RDS=respiratory distress syndrome; ROP4=retinopathy of prematurity requiring surgery.
BPD=bronchopulmonary dysplasia; GA=gestational age; IVH=intraventricular hemorrhage; NEC=necrotizing enterocolitis; PVL=periventricular leukomalacia; PVL/CPV=periventricular leukomalacia/choroid plexus cyst, porencephalic cyst, and/or acquired hydrocephalus; RDS=respiratory distress syndrome; ROP4=retinopathy of prematurity requiring surgery.
Calc
ulat
ed in
crem
enta
l cos
ts o
f com
orbi
ditie
s (U
S$ th
ousa
nds)
Comorbidity
45
40
35
30
25
20
15
10
5
0
RDSBPD
Sepsis
Meningitis NEC
IVH I/II
IVH III/IV PVL
Anemia
Apnea
PVL/CPV
ROP4
Convulsions
36-week GA30-week GA24-week GA
FIGuRE 2 Comorbidities of prematurity: estimated incremental costs at GA 24, 30, and 36 weeks

DECEMBER 2015 / MANAGED CARE 59
Incremental Costs Associated With Prematurity
limitationsLimitations of this study include the single-site origin of the data used to populate the PLS model. MUSC is a tertiary referral center and the data obtained may not be representative of births nationwide. Also, a high proportion of the populations were either uninsured (indigent, 16.5%) or enrolled in Medicaid (57.3%), which may have resulted in cost estimates lower than those that may be seen at sites with higher rates of private insur-ance. Therefore, validation of these results using data from multiple sites could enhance the accuracy of predic-tions that might be generalized across US or global settings. As our analysis excluded multiple pregnancies, babies born to mothers with pregnancy com-plications, and infants with congeni-tal abnormalities, the cost estimates
outlying cost data in the model, as there was a lack of effect on predictive accuracy or stability, and it had the added benefit of providing real-world representative predictions.
The data generated by this model demonstrate that PLS can overcome some of the inherent weaknesses as-sociated with OLS models and can be used to provide stable predictions with good cross-validated perfor-mance even when data contain ob-servational errors and multiple, highly collinear, explanatory variables—a scenario likely to occur when obser-vational data are used for predictive analysis (Simonsen 2014). In this study, PLS modeling demonstrated that GA at birth was inversely asso-ciated with incremental health care costs. Costs associated with comor-bidities of prematurity, as well as costs resulting directly from birth, were highest in infants born at lower GA. The greatest total estimated costs were associated with births at the lowest GA complicated by severe and costly comorbidities.
as a means of analyzing the comor-bidity incremental costs, with GAs grouped together. This approach to the analyses generated results that were unstable and not representative of the continuous nature of the data. There were also issues with multi-collinearity (e.g., 2 or more predic-tor variables in the regression model being highly correlated) between comorbidities and their interactions with GA, resulting in unstable co-efficient estimates (even negative es-timates). The PLS regression model that was subsequently adopted for this analysis allowed straightforward insertion of multicollinear variables within a single model, which gener-ated stable and accurate estimations of the variables of interest (cost by GA and costs for individual comor-bidities) and their relationships (Chin 2003). In this analysis, 10-fold cross-validation allowed the generation of a PLS model with optimized predictive accuracy (Picard 1984). We ran the model with outlier cost data excluded and included, and ended up retaining
Corresponding author
Libby Black 10 Big Bluff Pl. Durham, NC 27712 Email: [email protected] Tel: (919) 483-4145 Fax: (919) 315-3854
Funding source: This study was funded by GlaxoSmithKline (GHO-11-5081).
Disclosures. Black is employed by GlaxoSmithKline and is a GlaxoSmith-Kline shareholder; work performed on this publication was done while she was employed by GlaxoSmithKline. Lee and Parks are employees and shareholders. Hulsey and Ebeling are employees of the Medical University of South Carolina and were contracted and paid by Glaxo-SmithKline to conduct the study. No one was compensated for participation as an author. All authors met the International Committee for Medical Journal Editors criteria for authorship, were fully in-volved in manuscript development, and assume responsibility for the direction and content.
Acknowledgement: Assistance in the preparation of the manuscript was pro-vided by Matthew Thomas of Caudex and funded by GlaxoSmithKline.
FIGuRE 3 total estimated costs of preterm birth with, and without, selected comorbidities of prematurity
BPD=bronchopulmonary dysplasia; ROP4=retinopathy of prematurity requiring surgery.
Gestational age at birth (weeks)
Tota
l ass
ocia
ted
cost
(US$
thou
sand
s)
60
55
50
45
40
35
30
25
20
15
10
5
022 24 26 28 30 32 34 36 38
ROP4BPDConvulsionsNo comorbidity
60 MANAGED CARE / DECEMBER 2015
Incremental Costs Associated With Prematurity
Simonsen KA, Anderson-Berry AL, Delair SF, Davies HD. Early-onset neo natal sepsis. Clin Microbiol Rev. 2014; 27(1):21–47.
Stoll BJ, Hansen NI, Bell EF, et al. Neonatal outcomes of extremely preterm infants from the NICHD Neonatal Research Network. Pediatrics. 2010;126(3):443–456.
Strauss RG. Anaemia of prematurity: patho-physiology and treatment. Blood Rev. 2010;24(6):221–225.
REFERENCEsBerard A, Le TM, De Vera MA. Study of the
costs and morbidities of late-preterm birth. Arch Dis Child Fetal Neonatal Ed. 2012;97(5):F329–F334.
Blencowe H, Cousens S, Oestergaard MZ, et al. National, regional, and worldwide estimates of preterm birth rates in the year 2010 with time trends since 1990 for selected countries: a systematic analysis and implications. Lancet. 2012;379(9832):2162–2172.
Chin WW, Marcolin BL, Newsted PR. A par-tial least squares latent variable model-ing approach for measuring interaction effects: results from a Monte Carlo simulation study and an electronic-mail emotion/adoption study. Inform Syst Res. 2003;14(2):189–217.
Finer NN, Higgins R, Kattwinkel J, Martin RJ. Summary proceedings from the apnea-of-prematurity group. Pediatrics. 2006;117(3 Pt 2):S47–S51.
Gilbert WM, Nesbitt TS, Danielsen B. The cost of prematurity: quantification by gestational age and birth weight. Obstet Gynecol. 2003;102(3):488–492.
Hamilton BE, Martin JA, Osterman MJK, Curtin SC. Births: preliminary data for 2013. Natl Vital Stat Rep. 2014;63(2).
IOM (Institute of Medicine Committee on Understanding Premature Birth and Assuring Healthy Outcomes). Pre-term birth: causes, consequences, and prevention. In: Behrman RE, Butler AS, eds. The National Academies Col-lection: Reports funded by National Institutes of Health. Washington, DC: National Academies Press. 2007:1–20.
Johnson TJ, Patel AL, Jegier BJ, et al. Cost of morbidities in very low birth weight infants. J Pediatr. 2013;162(2):243–249.
Martin JA, Hamilton BE, Ventura SJ. Births: final data for 2009. Natl Vital Stat Rep. 2011;60(1):1–70.
Matthews TJ, MacDorman MF. Infant mor-tality statistics from the 2010 period linked birth/infant death data set. Natl Vital Stat Rep. 2013;62(8):1–26.
McLaurin KK, Hall CB, Jackson EA, et al. Persistence of morbidity and cost dif-ferences between late-preterm and term infants during the first year of life. Pedi-atrics. 2009;123(2):653–659.
Okike IO, Johnson AP, Henderson KL, et al. Incidence, etiology, and outcome of bacterial meningitis in infants aged <90 days in the United Kingdom and Republic of Ireland: prospec-tive, enhanced, national population-based surveillance. Clin Infect Dis. 2014;59(10):e150–e157.
Picard RR, Cook RD. Cross-validation of regression models. J Am Stat Assoc. 1984;79(387):575–583.
Russell RB, Green NS, Steiner CA, et al. Cost of hospitalization for preterm and low birth weight infants in the United States. Pediatrics. 2007;120(1):e1–e9.
provided here are also likely to be conservative.
CoNClusIoNGA at birth was inversely associated with delivery visit hospital costs. Ad-ditionally, total predicted costs were increased further by the association of comorbidities with preterm birth. The results of this study have broad implications and uses. These results could be used to guide development of quality improvement measures for treatment of preterm infants. Quality improvement measures in the neona-tal intensive care unit have primarily focused on babies born in the lowest gestational age ranges because they have the highest risk of death or mor-bidity and costs, but they make up roughly 5% of the premature infants born in the US each year (Martin 2011). Cost data from this study could be used to support development of quality improvement measures for treating preterm infants across the entire GA range, as our study demon-strates that costs and morbidities vary across the entire GA range.
Before quality measures can be maximized to treat babies born pre-maturely, they should first focus on prevention of preterm birth, as this is the preferred way to reduce mortality and morbidity associated with prema-turity. The results of this study could also be used to inform economic mod-els that assess cost-effectiveness of the treatment of preterm labor and pre-vention of preterm birth and could be used to guide reimbursement policy.
The costs of premature birth are substantial. The results derived from the PLS model detail how these costs can vary depending on an infant’s GA at birth and whether the infant develops comorbidities associated with prematurity. These results can be used in future economic analyses that explore the economic impact of therapies to prevent preterm birth or for treatment of preterm infants.