Embed Size (px)
Citation preview
Making sales tothe right cus-tomers, of the
right products, at theright price, at the righttime—which can becollected timely, hope-fully in advance or atthe time of shipmentor delivery receipt—can be a major contributor topositive net income and cashflow. But effective cost reductioncan be an even greater contribu-tor. While increased sales mayadd net profit margin contribu-tions, cost reductions add dollar-for-dollar contributions to thebottom line. Hence, there ismore to be contributed by reduc-ing and eliminating unnecessarycosts—and the company hasgreater control in making thishappen.
While sometimes all that isneeded to reduce such costs isgood common business sense,there are other management andoperational techniques thathave been used effectively inthe past or are currently invogue.
Let’s look at how bench-marking strategies can reducecosts for treasury managers.
BENCHMARKING STRATEGIES
Benchmarking identifies,implements, and maintainsobjective internal appraisal andexternal comparison and analy-sis. Benchmarking is becomingthe tool of choice for gatheringdata related to cost reductionanalysis and programs of contin-uous improvement, and gaininga competitive advantage.
Benchmarking can bedefined as a process for analyz-ing internal operations andactivities to identify areas forpositive cost reduction andimprovement in a program ofcontinuous improvement. Theprocess begins with an analysisof existing operations and activ-ities, identifies areas for costreduction and improvement, andthen establishes a performancestandard against which theactivity can be measured. The
goal is to improveeach identified activityso that it can be thebest possible—eco-nomically, efficiently,and effectively—andstay that way. The bestpractice is not alwaysmeasured in terms ofleast costs, but may
rather reflect what stakeholdersvalue and expected levels ofperformance.
THE CONCEPT OFSTAKEHOLDERS
Benchmarking processes aredirected toward the continuouspursuit of positive cost reductionand operational improvements,excellence in all activities, andthe effective use of best prac-tices. The focal point in achiev-ing these goals is the cus-tomer—both internal andexternal—who establishes per-formance expectations and is theultimate judge of resultant quali-ty. A company customer isdefined as anyone who has astake or interest in the ongoingoperations of the organization—that is, anyone who is affectedby its results. Stakeholders
Treasury managers know that strong sales andtimely collections are major contributors to cashflow. But effective cost reduction can be an evengreater contributor, argues the author of this article.And he presents a detailed guide to using bench-marking for cost reduction. © 2004 Wiley Periodicals, Inc.
Rob Reider
Cost Reduction Analysis: A Bench-marking Guide for Treasury Managers
featu
reartic
le
33© 2004 Wiley Periodicals, Inc.Published online in Wiley InterScience (www.interscience.wiley.com). DOI 10.1002/jcaf.20069
include all those who aredependent on the survival of theorganization, such as:
• Suppliers/vendors (external),• Owners/shareholders (inter-
nal/external),• Management/supervision
(internal),• Employees/subcontractors
(internal/external), and • Customers/end users
(external).
STRATEGIC CONCEPTS
Benchmarking results pro-vide the company—owners,management, and employees—with data necessary for effectiveresource allocation and thestrategic focus for the organiza-tion. The benchmarking processprovides for those objective mea-sures to determine the success ofthe company’s internal goals,objectives, and detail plans, as
well as external and competitiveperformance measures. Bench-marking the company’s perfor-mance against stakeholder expec-tations enables the company topursue its program of continuousimprovement and the road toexcellence. Effective benchmark-ing encompasses both internaland external needs. Some exam-
34 The Journal of Corporate Accounting & Finance
© 2004 Wiley Periodicals, Inc.
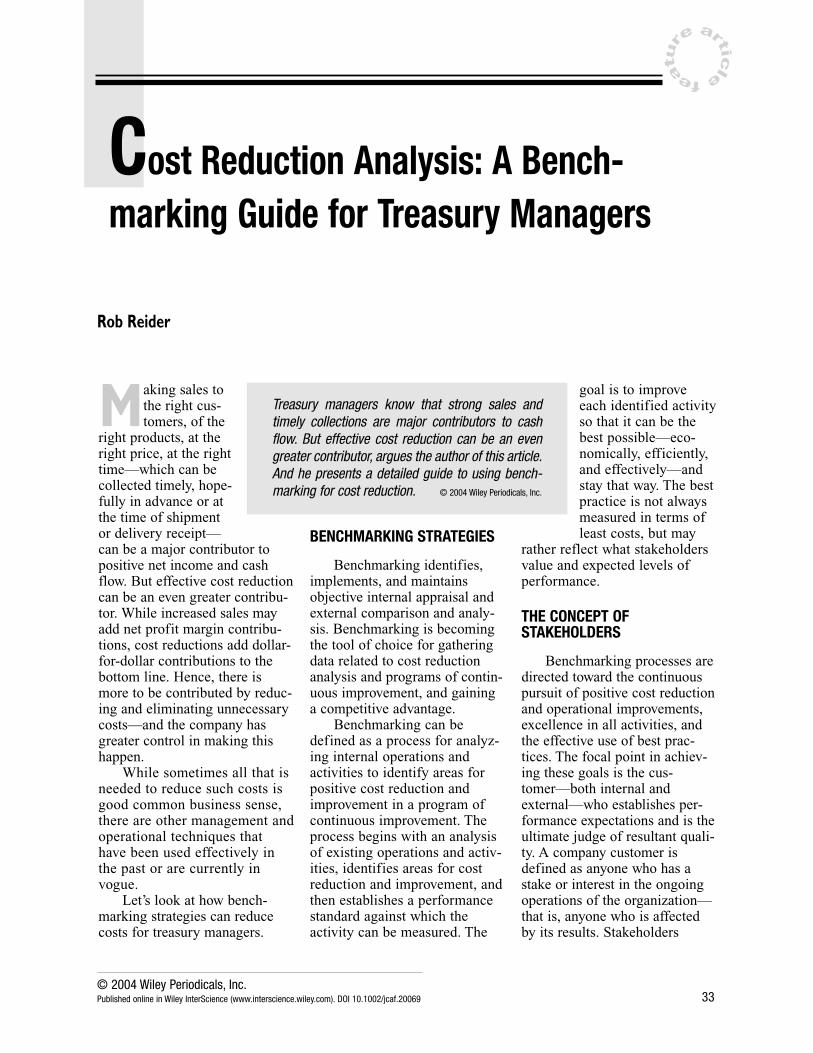
Internal Benchmarking Questions
People:1. Who is involved? And why?
• Number of people• Number of positions• How organized and managed• Current personnel resource demands
2. Are all personnel needed?• Reasons for involvement• What are they doing?• Value- or non-value-added• Vital operation or task• Special expertise
3. Responsibility for outcomes?• Hierarchical pyramid: power and control• Management-oriented: review and redo• Employee self-motivated disciplined behavior• Delegation of authority to lowest operational levels• Empire building: work continues—reason no longer valid
Procedures:1. Why is task performed? (e.g., “It’s always been done this way”)2. Necessary or unnecessary? (e.g., “That’s the way we do it”)3. Adding value to customer? (internal vs. external viewpoint)4. Unnecessary bureaucracy? (e.g., unwieldy hierarchy)5. Ineffective, inefficient, or redundant procedures?6. What does each one do and why does he or she do it? (foundation for
internal improvements)7. What are the bundles or groups of value- and non-value-added proce-
dures and activities?
Exhibit 1
Examples of InternalBenchmarks
Internal to the Organization:• Organizational policy
statements• Legislation, laws, and
regulations• Contractual arrangements • Funding arrangements• Organizational and depart-
mental plans: goals andobjectives
• Budgets, schedules, anddetail plans
Developed by the InternalBenchmarking Team:• Internal performance sta-
tistics: by individual orwork unit
• Performance of similarorganizations
• Industry or functionallyrelated statistics
• Past and presentperformance
• Engineered standards• Special analysis or studies• Benchmarking team’s
judgment• Sound business practices• Good common business
sense
Exhibit 2
November/December 2004 35
© 2004 Wiley Periodicals, Inc.
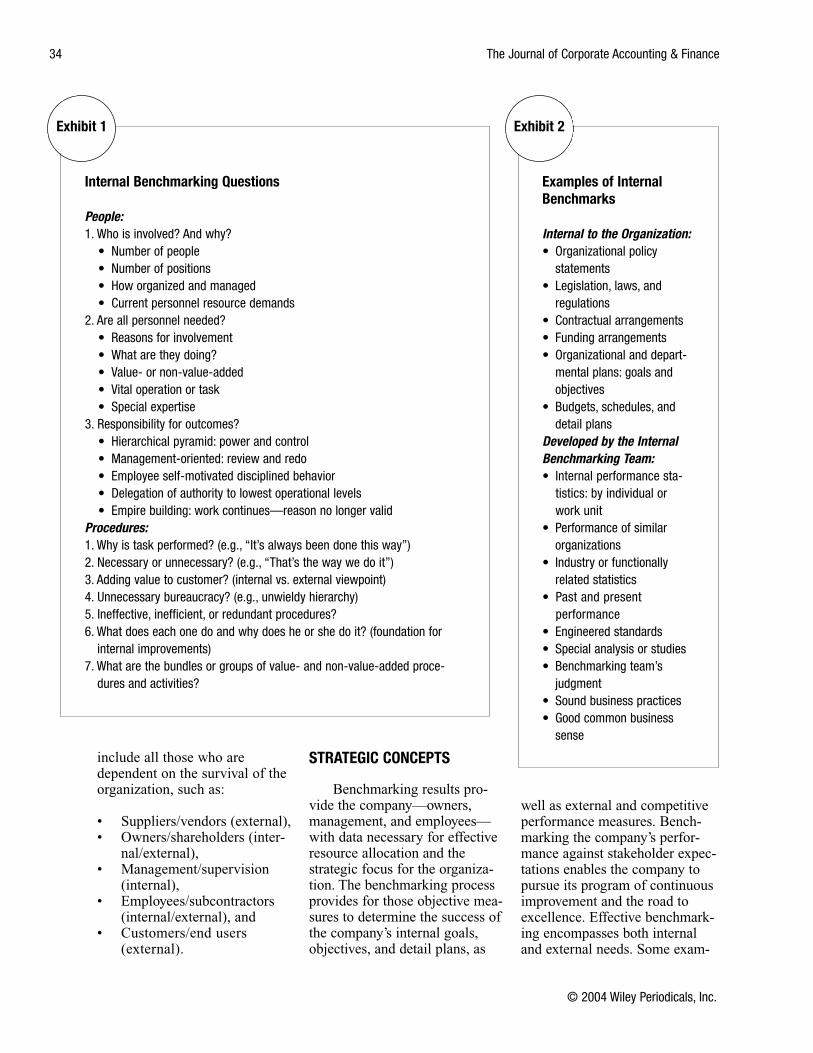
Examples of PerformanceMeasures
• Organizational environment• Company policy• Management and employee skills
and abilities• Market constraints (e.g., price,
quality)• Product constraints (e.g., labor-/
material-intensive)• Technology (e.g., high, low,
innovative)• Organizational structure• Management philosophy• Organizational culture• Type of structure• Single product/diversified• Locations/number of facilities• Upward/downward/horizontal
communication patterns• Control elements (e.g., strong
central versus delegated)• Job and behavioral expectations• Embedded value system• Evaluation and reward systems• Performance-related• Hiring, orientation, training,
evaluation, and promotionpractices and criteria
• Turnover or lack thereof• Delegation of authority and
responsibilities• Unwieldy organizational hierarchy• Overlaps of responsibility and job
functions• Emphasis on economy, efficiency,
and effectiveness• Quality and use of information
systems
Exhibit 3
Quantitative Benchmarks
Productivity:• Productivity/number of employees• Cost per good unit produced• Total productivity/total cost• Orders processed per hour by employee• Orders shipped per hour by employee• Increase/decrease in inventory by item• Inventory turnover ratiosQuality:• Number of good pieces/scrap• Amount and cost of rework• Amount and cost of quality inspection• Amount of vendor rejects • Number of customer returns/complaints• Warranty claims• Returns and allowances• Good units produced/material in• Parts availability• On-time deliveries• Sales forecast accuracyTimeliness:• On-time deliveries• Design time: customer to finished design• Production lead time • Purchasing to vendor delivery time• Shipping time• Number of late orders• Number of late deliveries• Number of back orders• Set-ups: number and time• Inspections: number and time• Nonproductive time• Order processing timeAccounting:• Number of items: invoices, payments, payroll time cards• Number of bills at time of shipment• Number of payments at terms/time• Accuracy of processing• Number of accounts payable debits• Number of accounts receivable credits• Employee productivity statistics• Timeliness and accuracy of reporting
Exhibit 4

ples of internal and externalbenchmarks for the organizationinclude the following:
• Increased sales (in total, byproduct line, and by product),
• Earnings per share,• Total assets,• Return on investment,• Return on assets,• Gross profits,• Net profits,• Debt/equity ratio,• Stock price,• Dividends,• Cash flow changes,• Survival and growth,• Internal excellence (positive
changes),• Competitive excellence (qual-
ity, timely, cost, responsive),• Supplier excellence (pre-
ferred vendors), and• Employer excellence
(employee participation,empowerment, etc.).
Whereas owners may bemost concerned with short-termbenchmarking criteria such asstock market price and earningsper share, other stakeholdersmay be more concerned withlonger-term criteria such as realearnings growth, customer satis-faction, and ongoing positivecash flow. There should be ameaningful balance betweensuch short-term and long-termgoals of divergent stakeholdersfor the benchmarking process tobe most successful. Benchmarksfor organizational growthinclude the following:
• Cost reductions (short-termgain for long-term pain),
• Price increases (may createmore external competition),
• Sales volume increases(present and potentialcustomers),
• New market expansion (local,national, international),
36 The Journal of Corporate Accounting & Finance
© 2004 Wiley Periodicals, Inc.
Qualitative Benchmarks
Product/Service:• Number of products/services• Number of activities/moves• Number of total parts/activities• Number of options• Number of products/services produced: by unit, equipment, location• Number of stockouts • Amount of delays/time promised changesFacilities/Capacity:• Number of work units • Number of personnel• Number and location of bottlenecks• Number of changes• Amount of preventive maintenance• Number of quality control inspections Customer Satisfaction:• Amount of repeat business• Satisfaction: with what?• Actual performance vs. promises• Referrals to others• Perceptions: quality, price, ease of use, featuresMarketing/Sales:• Number of salespeople• Amount of marketing effort• Increases in sales: number, profits, by customer, by salesperson• Customer support provided• Amount of flexibility• Product success rates• Sales to existing customers• Number and sales to new customersProcessing:• Time to process an order• Number of contacts per order filled• Number of errors• Time to get order into production• Time to process shipping • Time to process billing• Collection statistics• Number of orders in backlog• Amount of backlog never realized
Exhibit 5
• New distribution channels:(original equipment manu-facturer, wholesale, retail,mail order, Internet),
• Market share increase inexisting markets,
• Sell/close a losing operation/location,
• Acquire another company,division, operation, product,
• New product/service devel-opment,
• Efficiency/productivityimprovements (achieve morewith less), and
• Non-value-added activitieseliminated.
TYPES OF BENCHMARKING
Internal Benchmarking
Internal benchmarking is theanalysis of existing practiceswithin various operating areasof the company to identifyactivities and drivers and bestperformance. Drivers are thecauses of work or triggers (forexample, a customer order) thatset in motion a series of activi-ties. Internal benchmarkingfocuses on looking at the com-pany itself before looking exter-nally at others. Significant posi-tive improvements can be madeas the company asks questionssuch as:
• Is that activity needed?• Why do we do that?• Is that position/material
really needed?• Can the activity be done bet-
ter in another manner?• Is that step necessary? Does
it provide value added?
Internal benchmarking is thetechnique used to identify andimplement operational costreductions because it providesthe framework to compare inter-nal practices within the company
November/December 2004 37
© 2004 Wiley Periodicals, Inc.
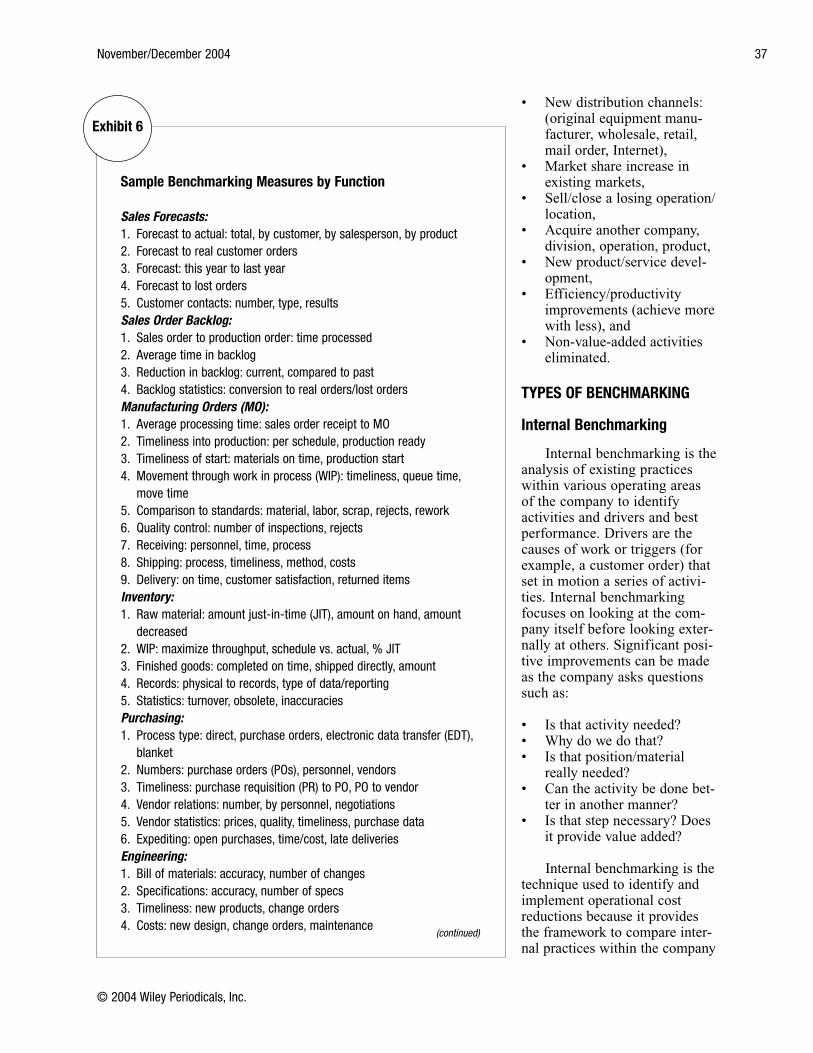
Sample Benchmarking Measures by Function
Sales Forecasts:1. Forecast to actual: total, by customer, by salesperson, by product2. Forecast to real customer orders3. Forecast: this year to last year4. Forecast to lost orders5. Customer contacts: number, type, resultsSales Order Backlog:1. Sales order to production order: time processed2. Average time in backlog3. Reduction in backlog: current, compared to past4. Backlog statistics: conversion to real orders/lost ordersManufacturing Orders (MO):1. Average processing time: sales order receipt to MO2. Timeliness into production: per schedule, production ready3. Timeliness of start: materials on time, production start4. Movement through work in process (WIP): timeliness, queue time,
move time5. Comparison to standards: material, labor, scrap, rejects, rework6. Quality control: number of inspections, rejects7. Receiving: personnel, time, process8. Shipping: process, timeliness, method, costs9. Delivery: on time, customer satisfaction, returned itemsInventory:1. Raw material: amount just-in-time (JIT), amount on hand, amount
decreased2. WIP: maximize throughput, schedule vs. actual, % JIT3. Finished goods: completed on time, shipped directly, amount4. Records: physical to records, type of data/reporting5. Statistics: turnover, obsolete, inaccuraciesPurchasing:1. Process type: direct, purchase orders, electronic data transfer (EDT),
blanket2. Numbers: purchase orders (POs), personnel, vendors3. Timeliness: purchase requisition (PR) to PO, PO to vendor4. Vendor relations: number, by personnel, negotiations5. Vendor statistics: prices, quality, timeliness, purchase data6. Expediting: open purchases, time/cost, late deliveriesEngineering:1. Bill of materials: accuracy, number of changes2. Specifications: accuracy, number of specs3. Timeliness: new products, change orders4. Costs: new design, change orders, maintenance
(continued)
Exhibit 6
as well as to external best prac-tice benchmark data.
External Benchmarking
External benchmarking isused to compare the company’soperations with those of other
organizations, particularly indeveloping cost reduction andpositive cash flow recommenda-tions, and includes the followingtypes of benchmarking:
• Competitive benchmarking.Looks to the outside to iden-
tify how other direct com-petitors are performing.Competitive benchmarkingidentifies the strengths andweaknesses of the company’scompetitors and is helpful indetermining its own success-ful competitive strategy. Itcan also help to prioritizespecific areas for improve-ment such as customer ser-vice, operating efficiencies,cost data, performanceresults, and so on.
• Industry benchmarking.Extending beyond the typi-cal one-to-one comparisonof competitive benchmark-ing, industry benchmarkingattempts to identify trends,innovations, and new ideas.Such identification can helpto establish better perfor-mance criteria, but may notlead to competitive break-throughs. Remember thatothers in the industry may begoing through the samebenchmarking process.
• Best-in-class benchmarking.This type of benchmarkinglooks across multiple indus-tries to identify new, innova-tive practices, regardless oftheir source. This search forbest practices should be theultimate goal of the bench-marking process. It supportscontinuous improvement,increased performance lev-els, and movement towardbest practices, and also iden-tifies opportunities for posi-tive improvements.
INTERNAL BENCHMARKINGCOMPARISONS
In performing an internalbenchmarking study as part of acost reduction analysis, there area number of bases on which tocompare to present practices,such as the following:
38 The Journal of Corporate Accounting & Finance
© 2004 Wiley Periodicals, Inc.
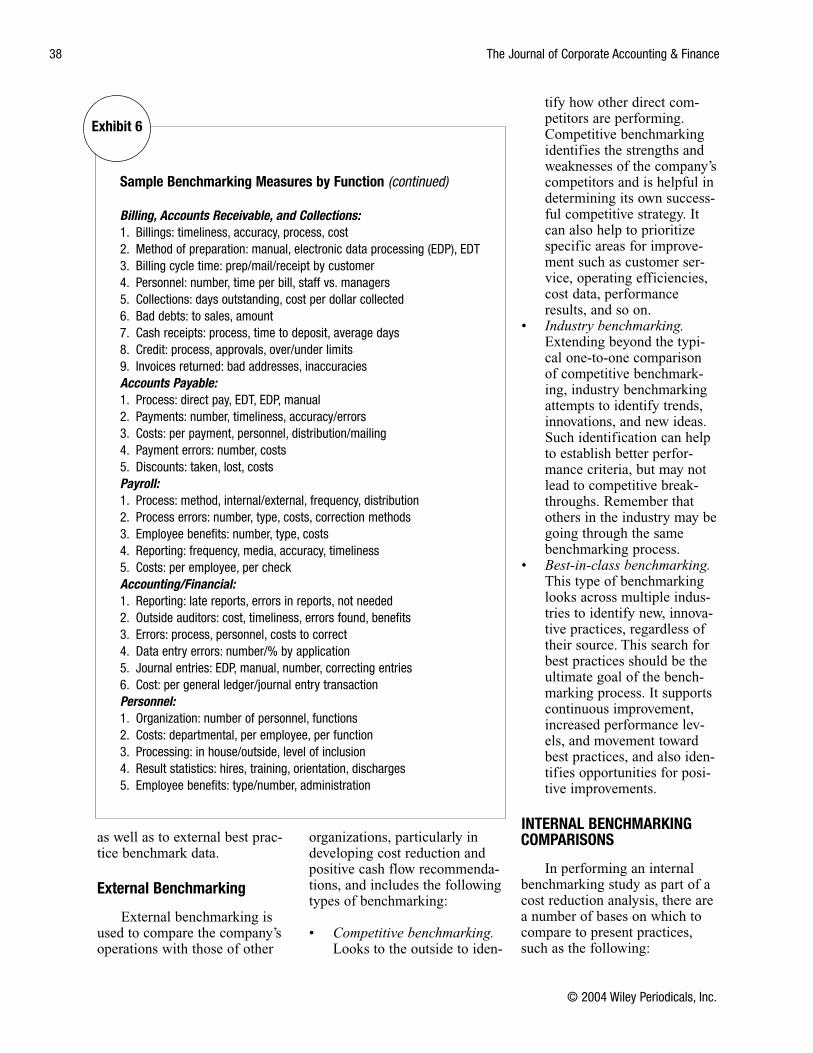
Sample Benchmarking Measures by Function (continued)
Billing, Accounts Receivable, and Collections:1. Billings: timeliness, accuracy, process, cost2. Method of preparation: manual, electronic data processing (EDP), EDT3. Billing cycle time: prep/mail/receipt by customer4. Personnel: number, time per bill, staff vs. managers5. Collections: days outstanding, cost per dollar collected6. Bad debts: to sales, amount7. Cash receipts: process, time to deposit, average days8. Credit: process, approvals, over/under limits9. Invoices returned: bad addresses, inaccuraciesAccounts Payable:1. Process: direct pay, EDT, EDP, manual2. Payments: number, timeliness, accuracy/errors3. Costs: per payment, personnel, distribution/mailing4. Payment errors: number, costs5. Discounts: taken, lost, costsPayroll:1. Process: method, internal/external, frequency, distribution2. Process errors: number, type, costs, correction methods3. Employee benefits: number, type, costs4. Reporting: frequency, media, accuracy, timeliness5. Costs: per employee, per checkAccounting/Financial:1. Reporting: late reports, errors in reports, not needed2. Outside auditors: cost, timeliness, errors found, benefits3. Errors: process, personnel, costs to correct4. Data entry errors: number/% by application5. Journal entries: EDP, manual, number, correcting entries6. Cost: per general ledger/journal entry transactionPersonnel:1. Organization: number of personnel, functions2. Costs: departmental, per employee, per function3. Processing: in house/outside, level of inclusion4. Result statistics: hires, training, orientation, discharges5. Employee benefits: type/number, administration
Exhibit 6
1. Comparisons between indi-viduals performing similarfunctions within a work unit;
2. Comparative analysisbetween different work unitswithin the company that per-form similar functions;
3. Comparisons to industrystandards;
4. Comparisons to publishedbenchmark standards; and
5. Comparisons to tests of rea-sonableness (e.g., do notprocess an accounts payabletransaction where the cost ofprocessing exceeds theamount of the payment).
In determining the correctbenchmark for a specific func-tion, the company should answerthe following questions concern-ing the activity:
• What should the functionbe?
• What is it measured against?• What is the standard proce-
dure or practice?• Is it a formal procedure or
an informal practice?
This results in comparingwhat is to what should be—thatis, the benchmark.
Questions that should beasked include those in Exhibit 1.
WHAT ARE THE BENEFITS?
The benefits of using inter-nal benchmarking comparisonsand identification of best prac-tices include the following:
1. Defines existing processesand activities and establishesbaseline of acceptable per-formance (helps to triggercontinuous improvementefforts);
2. Identifies gaps in perfor-mance in similar internalprocesses (provides a clear
November/December 2004 39
© 2004 Wiley Periodicals, Inc.
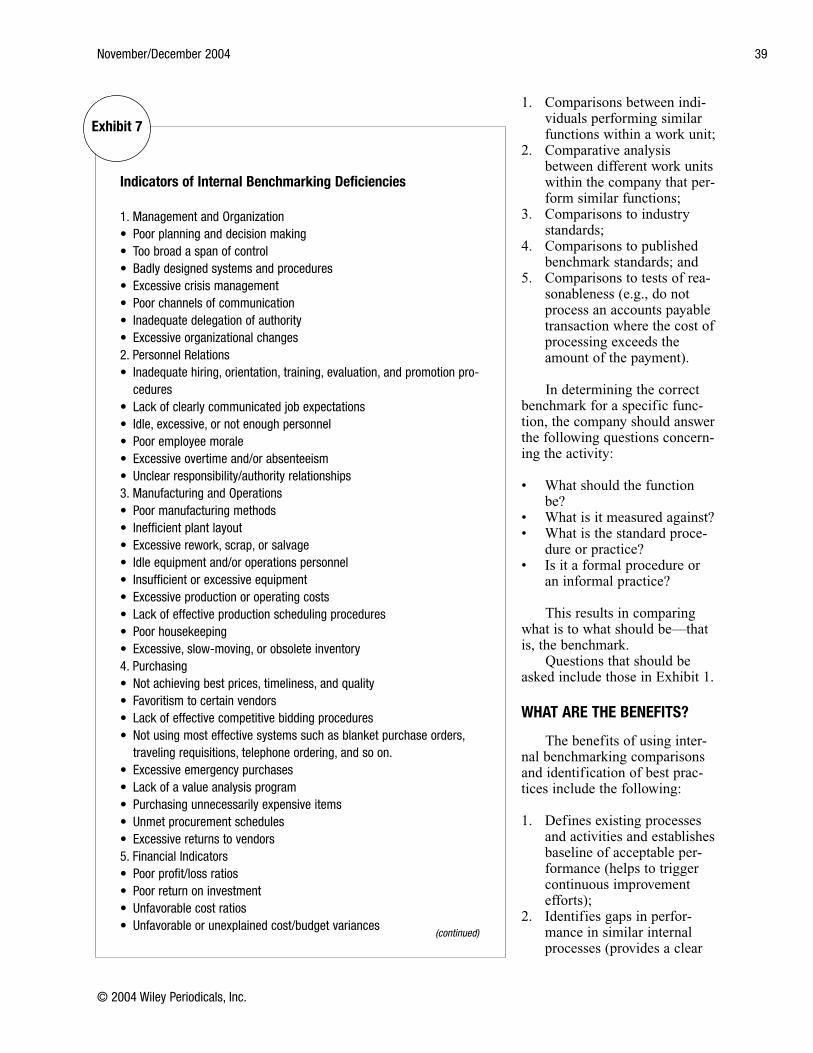
Indicators of Internal Benchmarking Deficiencies
1. Management and Organization• Poor planning and decision making• Too broad a span of control• Badly designed systems and procedures• Excessive crisis management• Poor channels of communication• Inadequate delegation of authority• Excessive organizational changes 2. Personnel Relations• Inadequate hiring, orientation, training, evaluation, and promotion pro-
cedures• Lack of clearly communicated job expectations• Idle, excessive, or not enough personnel• Poor employee morale• Excessive overtime and/or absenteeism• Unclear responsibility/authority relationships3. Manufacturing and Operations• Poor manufacturing methods• Inefficient plant layout• Excessive rework, scrap, or salvage• Idle equipment and/or operations personnel• Insufficient or excessive equipment• Excessive production or operating costs• Lack of effective production scheduling procedures• Poor housekeeping• Excessive, slow-moving, or obsolete inventory4. Purchasing• Not achieving best prices, timeliness, and quality• Favoritism to certain vendors• Lack of effective competitive bidding procedures• Not using most effective systems such as blanket purchase orders,
traveling requisitions, telephone ordering, and so on.• Excessive emergency purchases• Lack of a value analysis program• Purchasing unnecessarily expensive items• Unmet procurement schedules• Excessive returns to vendors5. Financial Indicators• Poor profit/loss ratios• Poor return on investment• Unfavorable cost ratios• Unfavorable or unexplained cost/budget variances
(continued)
Exhibit 7
picture of the organization’sproblems);
3. Brings all internal operationsup to the highest possiblelevel of performance (withinexisting constraints);
4. Identifies areas of internaloperational improvementswithout going outside theorganization (externalbenchmarking);
5. Establishes standards forcommon practices and pro-cedures (overcomes the “notcreated here” syndrome);
6. Opens up communicationlines within the organization(focuses resources on prob-lems that affect more thanone area);
7. Establishes organizationwidecommitment to internalbenchmarking concepts(recasts the problems facingthe company);
8. Establishes groundwork forexternal benchmarking(competitive, industry, andbest-in-class) efforts
40 The Journal of Corporate Accounting & Finance
© 2004 Wiley Periodicals, Inc.
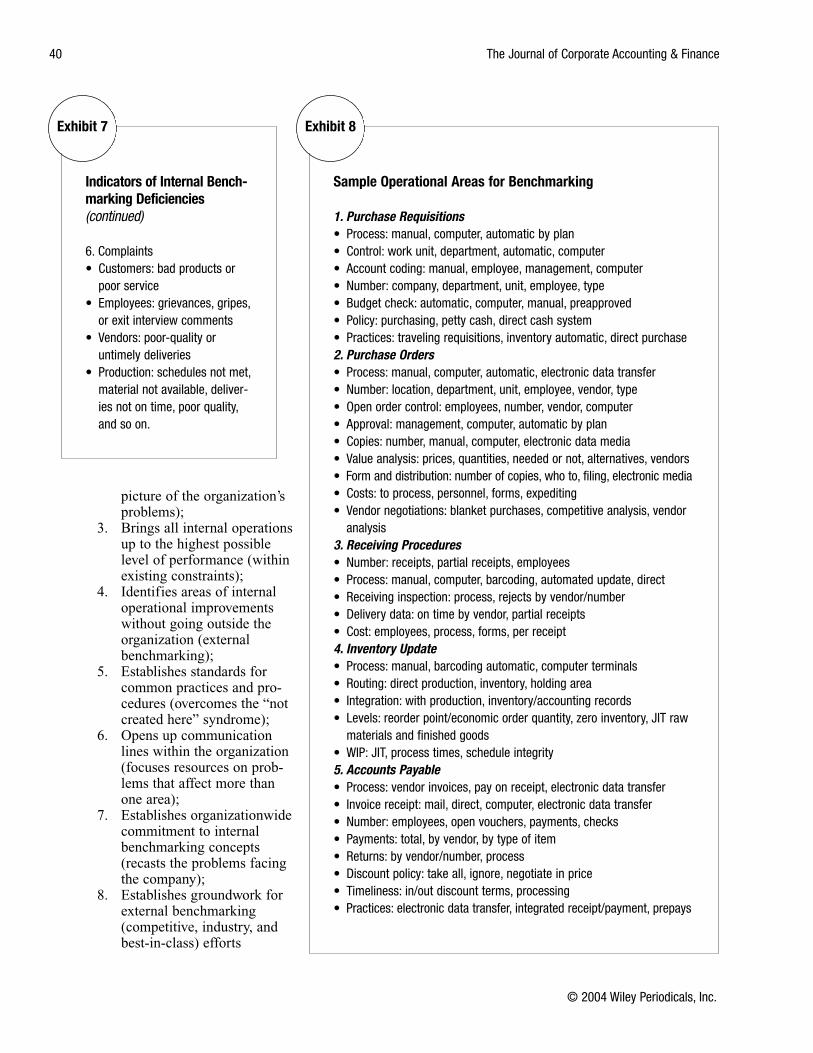
Indicators of Internal Bench-marking Deficiencies (continued)
6. Complaints• Customers: bad products or
poor service• Employees: grievances, gripes,
or exit interview comments• Vendors: poor-quality or
untimely deliveries• Production: schedules not met,
material not available, deliver-ies not on time, poor quality,and so on.
Exhibit 7
Sample Operational Areas for Benchmarking
1. Purchase Requisitions• Process: manual, computer, automatic by plan• Control: work unit, department, automatic, computer• Account coding: manual, employee, management, computer• Number: company, department, unit, employee, type• Budget check: automatic, computer, manual, preapproved• Policy: purchasing, petty cash, direct cash system• Practices: traveling requisitions, inventory automatic, direct purchase2. Purchase Orders• Process: manual, computer, automatic, electronic data transfer• Number: location, department, unit, employee, vendor, type• Open order control: employees, number, vendor, computer• Approval: management, computer, automatic by plan• Copies: number, manual, computer, electronic data media• Value analysis: prices, quantities, needed or not, alternatives, vendors• Form and distribution: number of copies, who to, filing, electronic media• Costs: to process, personnel, forms, expediting• Vendor negotiations: blanket purchases, competitive analysis, vendor
analysis 3. Receiving Procedures• Number: receipts, partial receipts, employees• Process: manual, computer, barcoding, automated update, direct• Receiving inspection: process, rejects by vendor/number• Delivery data: on time by vendor, partial receipts• Cost: employees, process, forms, per receipt4. Inventory Update• Process: manual, barcoding automatic, computer terminals• Routing: direct production, inventory, holding area• Integration: with production, inventory/accounting records• Levels: reorder point/economic order quantity, zero inventory, JIT raw
materials and finished goods• WIP: JIT, process times, schedule integrity5. Accounts Payable• Process: vendor invoices, pay on receipt, electronic data transfer• Invoice receipt: mail, direct, computer, electronic data transfer• Number: employees, open vouchers, payments, checks• Payments: total, by vendor, by type of item• Returns: by vendor/number, process• Discount policy: take all, ignore, negotiate in price• Timeliness: in/out discount terms, processing• Practices: electronic data transfer, integrated receipt/payment, prepays
Exhibit 8
(ensures greater results whenexternal benchmarking isdone);
9. Prioritizes critical areas forbenchmarking opportunities;and
10. Identifies and classifies thekey performance drivers.
INTERNAL BENCHMARKS
There are many examples ofinternal benchmarks that can beused for such comparison pur-poses. We have listed some inExhibit 2. Examples of perfor-mance measures are listed inExhibit 3. Quantitative bench-marks are listed in Exhibit 4,
while qualitative benchmarksyou can use are detailed inExhibit 5. Exhibit 6 covers sam-ple benchmarking measures byfunction.
But how can you determine ifyour benchmarking is adequate?Consult Exhibit 7 for some handyindicators of benchmarking defi-ciencies. Finally, Exhibit 8 givessome sample operational areasfor benchmarking.
The production/service coststhe company incurs represent themost significant cause of compa-ny costs and cash outflows. Inorder to reduce costs andimprove cash flow, it is essentialfor the company to control these
costs effectively. While cost con-trol is a well-accepted way for acompany to improve its prof-itability, its relevance to efficientoperations and cash flow is oftennot understood, not recognized,or (in the worst case) deliberate-ly ignored.
Benchmarking is a formal-ized method that can be used toinstitute better cost control with-in the company. Benchmarkingallows the company to compareits processes and related costs toobjective outside standards—methods developed by othersand proven to be best practices.It will certainly improve yourtreasury function.
November/December 2004 41
© 2004 Wiley Periodicals, Inc.
Rob Reider, CPA, MBA, PhD, is the president of Reider Associates, a management and organizational con-sulting firm located in Santa Fe, New Mexico. Rob has applied his expertise for clients in numerous indus-tries and disciplines—in the private and public sectors. He is the course author and nationally sought afterpresenter for over 20 different workshops and seminars conducted nationally. He has presented over1,000 such seminars throughout the country. He is the author of the following professional managementbooks published by John Wiley & Sons, Inc.: Operational Review: Maximum Results at Efficient Costs (bookand workbook); Benchmarking Strategies: A Tool for Profit Improvement; and Improving the Economy, Effi-ciency, and Effectiveness of Not-For-Profits. He is also the author of the recently released novel Road toOblivion: The Footpath Back Home, a novel of discovery that looks at the life of a downsized executive. Heis considered a national expert in the area of performing internal and external benchmarking studiestogether with operational reviews. He can be reached via e-mail at [email protected]. Thisarticle was adapted from Managing Cash Flow: An Operational Focus by Rob Reider and Peter B. Heyler,John Wiley & Sons, Inc., 2003.