Embed Size (px)
Citation preview

Charteris Treasury P f li M L dPortfolio Managers Ltd
C l Th M t iCycles – The Mysterious Forces that trigger events
Piers Corbyn Weather Action presentation
May 2016
For Professional advisers only. Not to be shown or given to any retail investors

CHARTERIS Cycles Seminar, Savile Club, 69 Brook Street, 11th May 2016
The Long Range Forecasters g g
Cycles in Business & Weather yand Wild weather patterns; what’s Going On?
- It’s NOT CO2 - Prospects for 2016 & coming decadest s O CO ospects o 0 6 & co g decades
1. Cycles in Business and Weather 2. What doesn’t drive change in Climate2. The Revolution of Solar-Lunar Long-Range forecasting months + yrs aheadg g g y3. Weather / Cycles and world food and business issues in coming two decades
After presentations at Cereals April 7+8th 2016 Geneva; Westcliff-On-Sea Essex 21Feb 2016; Stoke Newington School 3Feb; Paris Climate Challenge 3 Dec 2015; Parliament 25Nov 2015; Electric Ubniverse Conf Albequrque New Mexico USA March 2014; IAOM Tunisia Nov 2013; GAFTA Geneva May 2013; South AfricaParliament 25Nov 2015; Electric Ubniverse Conf Albequrque New Mexico USA March 2014; IAOM Tunisia Nov 2013; GAFTA Geneva May 2013; South Africa
Greenest EventJohahnnesburg 5 Jun 2012; State Uni Colarado USA , New York Heartland Institute Conf 2009+10; HG Wells Centenary Dinner Piccadilly 2008… Many farming and school / university venues in the last 20 years
Piers CorbynARCS (IC) Physics (1st class), FRAS, FRMetS*; Msc (QMC) Astrophysics, Founder & Director, WeatherAction
*originally student member then WeatherAction Holdings plc was a corporate member Royal Meteorological Society

• Piers Corbyn began doing science at 8 years old and first y g g ypublished scientific papers aged 17/18 and won a Royal Scholarship to Imperial College in 1965.
• Piers Corbyn’s ideas on Long Range forecasting using solar activity began in 1980s, especially 1984-85 – thanks to the y g , p yMiner’s strike!
• Tested by Weatherbets* with William Hill at odds decided by• Tested by Weatherbets with William Hill at odds decided by MetOffice 1988 to 1999 – giving significant profits (40% of stakes) (*about 30 bets at £20 each every month)stakes) ( about 30 bets at £20 each every month)
• First commercial operations 1990 from Piers Corbyn in SouthBank University Received £180 000 ~1992 from insuranceSouthBank University. Received £180,000 ~1992 from insurance industry consortium to advance research.

• Independent peer-reviewed testing of forecasts (storms/insurance events) for insurance industry consortium(storms/insurance events) for insurance industry consortium. (Dennis Wheeler, Sunderland Uni – publication showed significant skill).significant skill).
• No other long range (> one month ahead) forecasting standard meteorology methods have any published proven skillmeteorology methods have any published proven skill.
• Various commercial forms – WeatherPlan services Ltd, Piers Corbyn Weather Forecasting Services WeatherAction LtdCorbyn Weather Forecasting Services, WeatherAction Ltd
• Floated on Stock Exchange AIM Nov 1997, WeatherActionHoldings plc (dotcom bubble) withdrew Dec’99 in dot com dealHoldings plc (dotcom bubble) withdrew Dec 99 in dot.com deal resuming as WeatherAction Ltd / Piers Corbyn.
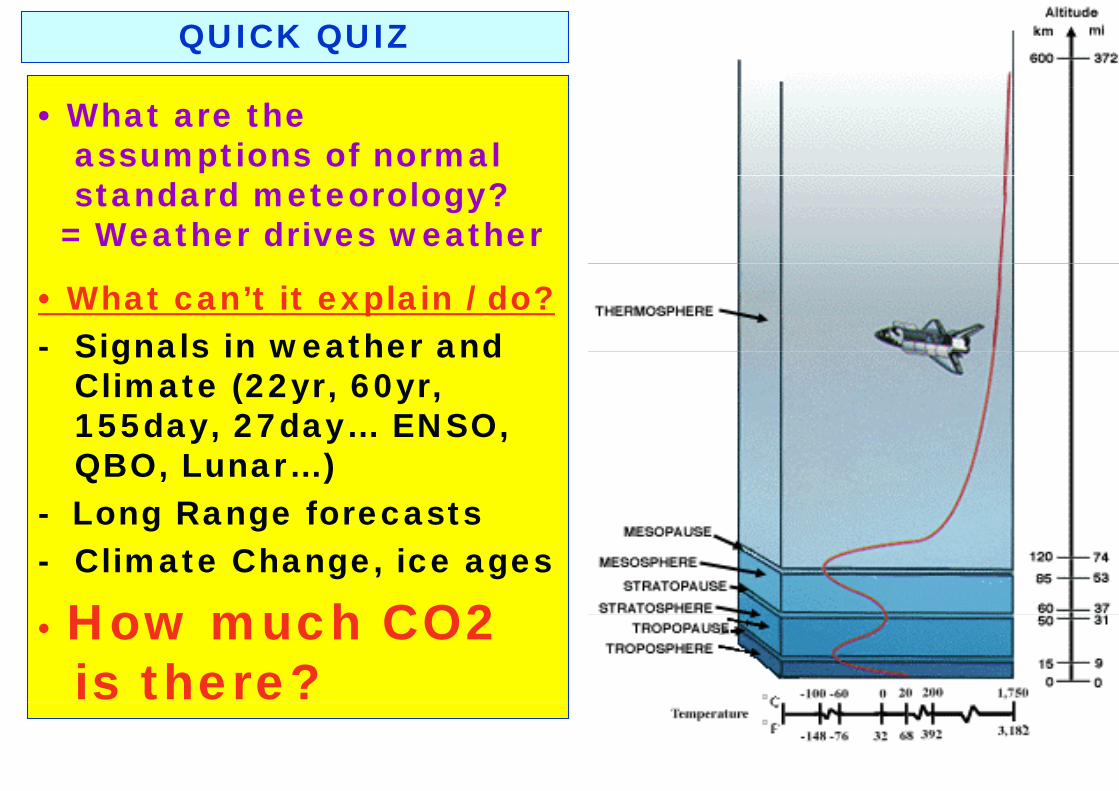
QUICK QUIZ
• What are the assumptions of normal standard meteorology?
= Weather drives weather
• What can’t it explain / do?- Signals in weather and Signals in weather and
Climate (22yr, 60yr, 155day, 27day… ENSO, y, y ,QBO, Lunar…)
- Long Range forecastsg g- Climate Change, ice ages
How much CO2 • How much CO2 is there?

Cycles in Weather & Business• Some cycles in both weather & Business eg 9.6yr, 55yr,
• Solar-lunar related cycles => weather => business
S l l l t d l ‘ l t ti ’ ff t > d h• Some solar-lunar related cycles more ‘electromagnetic’ effects => mood changes => market swings – related to solar flares / geomagnetic activity – 155d, 27.2d
• WeatherAction ‘Red Spikes’/ Red weather (R5, R4) periods – of major weather and electromagnetic effects – ‘bullets’ rather than ‘waves
•Solar-Lunar signals in bands – fast (weeks / months) – ‘Enso’ (3-7yr) –Solar/decadal – ‘Slow’ many decades).
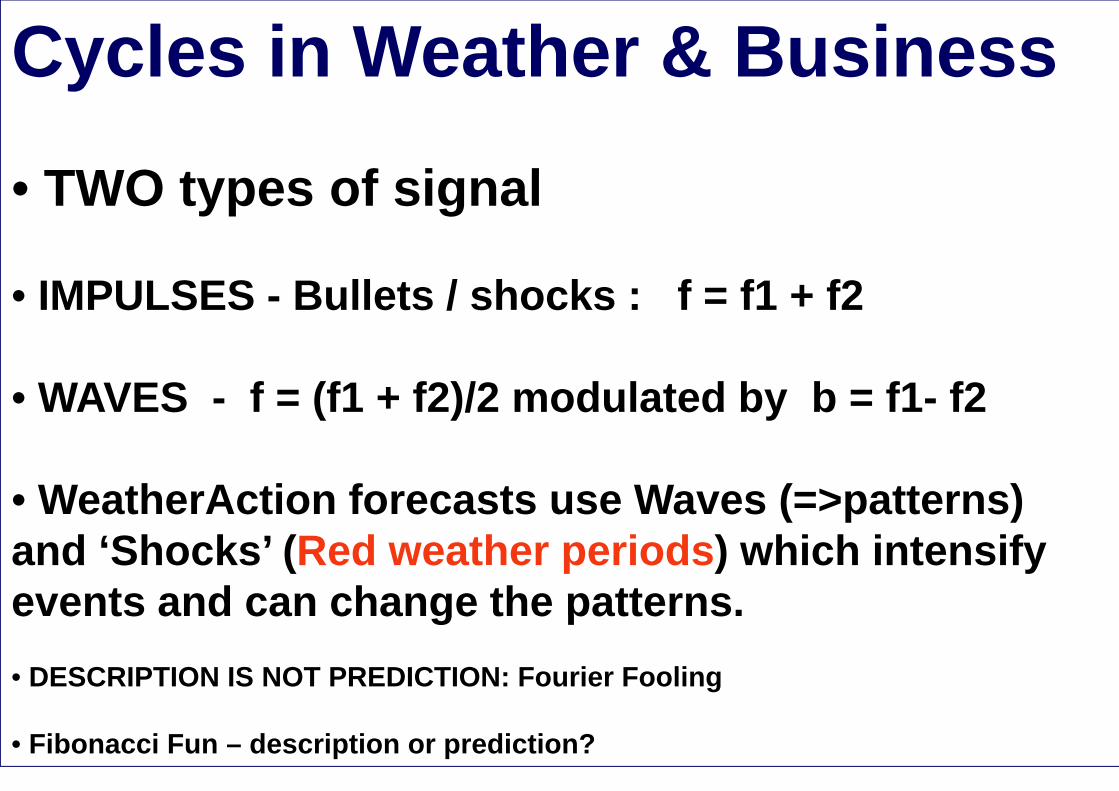
Cycles in Weather & Businessy
TWO t f i l• TWO types of signal
• IMPULSES - Bullets / shocks : f = f1 + f2
• WAVES - f = (f1 + f2)/2 modulated by b = f1- f2
• WeatherAction forecasts use Waves (=>patterns) and ‘Shocks’ (Red weather periods) which intensify events and can change the patterns.events and can change the patterns. • DESCRIPTION IS NOT PREDICTION: Fourier Fooling
• Fibonacci Fun – description or prediction?

There are many signals in weather data all(?) solar/lunar in origin – 155d, 11yr, 22yr…

CO2 & temperatures moved close together through the last 4 ice ages. Temperatures LEAD CO2 by ~800 yrs. Al Gore doesn’t tell you That Inconvenient Truth!
Note Rapid ‘spikes’ in CO2 levels are diffused away in ice cores and not visible in dataDepth (m)
Time43k yr tilt and 26k yr precession key
Close examination (eg see red boxes) of proxy Temp & CO2 data in ice cores show Temperatures lead CO2 changes Changes acrossClose examination (eg see red boxes) of proxy Temp & CO2 data in ice cores show Temperatures lead CO2 changes. Changes across Antarctica termination III (Caillon et al Science March 2003) 240k yr ago show Temperature leads CO2 by on average 800+/-200yrs

Breaking the CO2 Global-Warmist Delusion – THE FACTSHow Much Little CO2 is there in the atmosphere?
Compare the atmosphere with Big Ben’s Tower – 316 ft high
CO2 in the atmosphere is
Termites & CO2 - FACTSatmosphere is
equivalent to 1¼ i h t
CO2 FACTS
• Termites produce more1¼ inches on top
Man’s contribution is about
produce more CO2 each year than all other living things
One mm in that.Or about 0 04%
g gcombined.• Will there be a War on Ants?Or about 0.04%
Termites produce • It is estimated that for every human on EarthTEN times as much
CO2 as ALL man’s
human on Earth there may be 1000 pounds of termitesoutput! termites.http://www.termitedetector.com/detection.cfm

How do we know it’s NOT CO2? CO2?
• It’s NOT because of the meddling with data, fraud, g , ,tricks, fictional claims and suppression of evidence and arguments which oppose the CO2 theory –exposed in CLIMATEGATE
• It’s because the CO2 theory FAILS in ALL it’s predictions and expected past correlations.
• Climate change is a natural process and is not new! • Temperatures control CO2 NOT the other way• Temperatures control CO2 NOT the other way• No increase in extreme events with CO2• ALL predictions of CO2 “theory” have failed• ALL predictions of CO2 theory have failed• The “theory” itself is based on a conjuring trick etc
(confusion of rates of change with total change, non equilibrium systems, transpiration cooling….)

Temps drive CO2 as ice ages end.Fast CO2 changes (like now) are hidden
At the end of the last ice age Time
At a meeting Piers said: “There is just one timescale where CO2 & temperature correlate well, that is on averages of about a hundred years; BUT this shows TEMPERATURES CONTROL CO2 which changes AFTER temperatures have changed”
last ice age temperature changes LEAD
Time
gCO2 by 800yrsSimilar leads are in Antarctic Termination III 240kyr agoTermination III 240kyr ago(Caillon et al Science Mar 03)
CO2 diffuses through iceCO2 data points are at best 200yrs apart and show only small variations between ypoints. This is because CO2 is a gas and diffuses into centuries of ice layers. The present CO2 spike will amount to a mere blip in 1,000yrs time. b p , y s e.
There is No Evidence that the present CO2 rapid rise is unique.Inconvenient Truths for GW Orthodoxy!

The CO2 Warmist scares have comprehensively failedTHEY TOLD US in 2000: WHAT HAPPENEDTHEY TOLD US in 2000: WHAT HAPPENEDDangerous climate change within decade or so: from around 2007 to 2013
World runaway warming The World got colderWorld runaway warming The World got colderWhile CO2 went up
& &Droughts & Heatwaves UK Floods, cold & HailThe End of Snow by 2010 UK Dramatically more snowy y
More USA Hurricanes Less USA HurricanesWorld massive Ice melts MORE World ice, & Dishonest
reporting of Arctic
Springs Eu UK USA earlier Springs LATE & COLD!
Large Sea level rise NO S l i i l t I ALarge Sea level rise NO - Same slow rise since last Ice Age
NOW NOW THEY THEY SAY WARM IS COLD!!SAY WARM IS COLD!!NOW NOW THEY THEY SAY WARM IS COLD!!SAY WARM IS COLD!!

The UN (IPCC) Forecasts have comprehensively failedAt the Oct 27 2010 meeting Piers said: “Philip Foster (1st presentation) already gave graphs that show there is NO EVIDENCE
i illi f th t CO2 t l t t Th h h th IPCC di ti d t d ith th going over millions of years that CO2 controls temperature. These graphs shows the IPCC predictions do not accord with the facts. That means the theory fails. The University of East Anglia (CRU) however instead changed the facts. This is unacceptable”
In 2010 Warmist opinion admitted W ld t t (S f b )World temperatures (Surface obs) were falling since then they have changed (“adjusted”) past data to hide that fact.
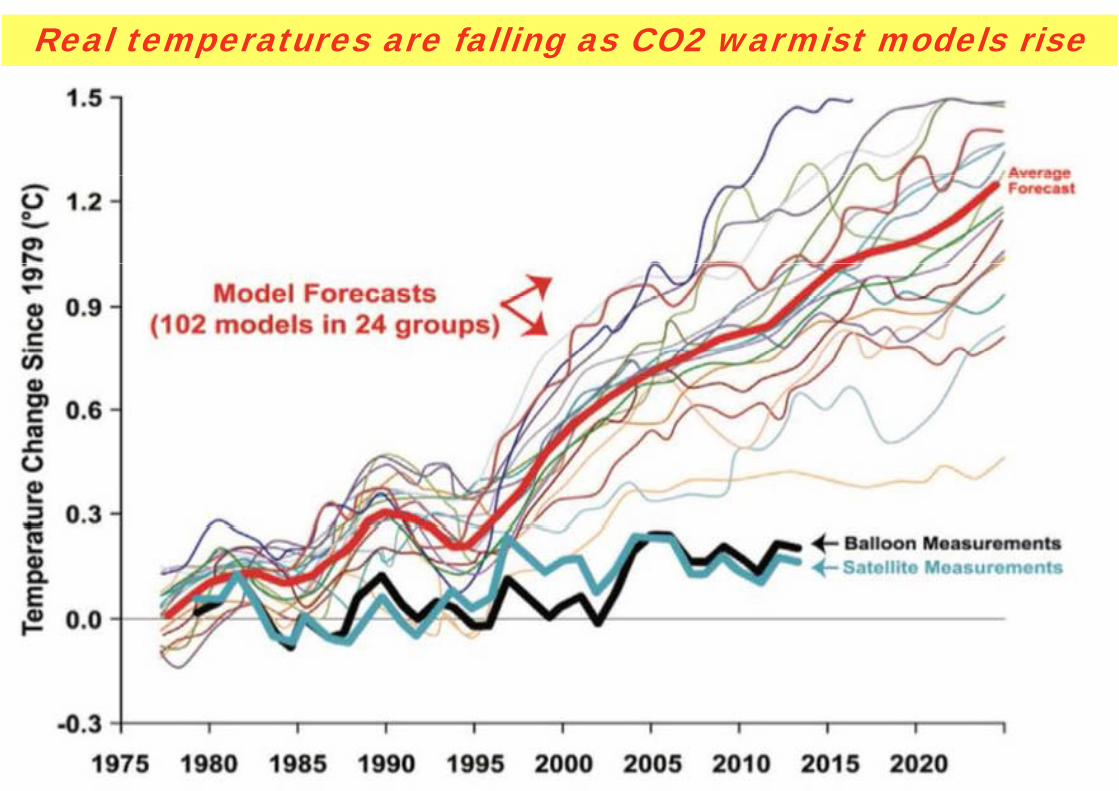
Real temperatures are falling as CO2 warmist models rise
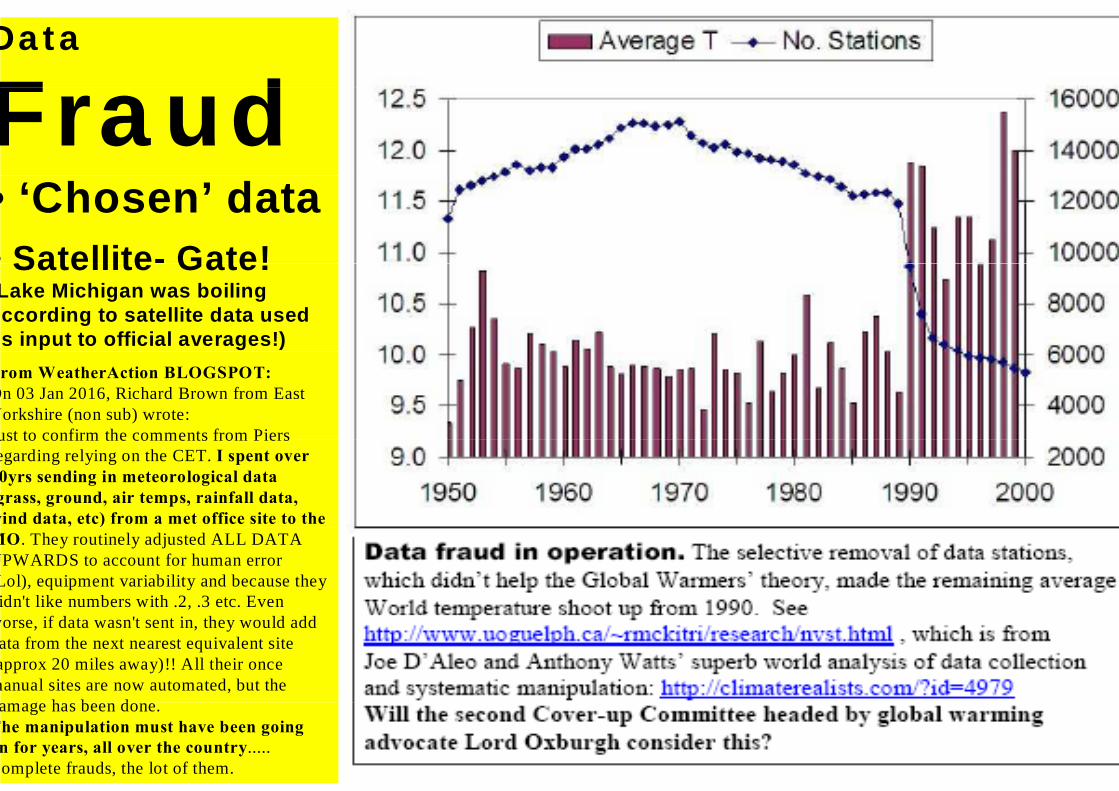
Data
F dFraud• ‘Chosen’ data• Satellite- Gate!Satellite Gate! Lake Michigan was boiling ccording to satellite data used s input to official averages!)rom WeatherAction BLOGSPOT:
On 03 Jan 2016, Richard Brown from East Yorkshire (non sub) wrote:ust to confirm the comments from Piersust to confirm the comments from Piers egarding relying on the CET. I spent over 0yrs sending in meteorological data grass, ground, air temps, rainfall data,
wind data, etc) from a met office site to the )MO. They routinely adjusted ALL DATA UPWARDS to account for human error Lol), equipment variability and because they idn't like numbers with .2, .3 etc. Even
worse, if data wasn't sent in, they would add ata from the next nearest equivalent site approx 20 miles away)!! All their once
manual sites are now automated, but the h b damage has been done.
The manipulation must have been going n for years, all over the country.....
Complete frauds, the lot of them.

WeatherActionWeatherAction Myth Buster Myth Buster -- Redistribution encouragedRedistribution encouraged
They Changed They Changed
W i t h the FACTS!the FACTS!
Warmists have been fiddling (“selecting”) data
This is where honest data would be; about 0.5C below official. Under fiddle-corrected data recent peaks(“selecting”) data
for years – About 0.5C of trickery. (Range 1975-2000 Red line minus Black)
corrected data recent peaks are about the same as ~1935-40 peak; ie NO WARMING
• systematically removing stations to make the data look colder in the past &
warmer now
• BUT Whatever they do, even with ‘new’ data the WORLD IS COOLING while CO2 COOLING while CO2 still rises

The World Meteorological Organization, NASA and National Met Services have been data tampering for years –p g y
They They Ch d th Ch d th Changed the Changed the
FACTS!FACTS!A f l i f 0 6C • A false rise of 0.6C
has been added into data 1880 - 2016
Offi i l b di id • Official bodies avoid satellite data which shows the world is now cooling

What does Global warming / Climate Policy eg of UN IPCC / UK Climate Change Act 2008 achieve?
1. It does NOT reduce CO2 production but re-locates it th t f f St l d ti f T id t I di
g
it – eg the transfer of Steel production from Teesside to India simply exports CO2 production. Wind-Farms use coal-fired back-up for when the wind doesn’t blow.
2. The economic effects are catastrophic: Destruction of manufacturing jobs in UK Sweden - Destruction of manufacturing jobs in UK, Sweden,
Finland….(not usually German industrial capital) G th f h i f t - Growth of phoney casino economy of asset
stripping and finance capital3. Pushing up energy and Oil pricesNote Big Oil back Man Made Climate Change policies (see BP web site) “providing a uniform price for carbon is maintained” (ie govt backed price hikes to help oil profit) uniform price for carbon is maintained” (ie govt backed price hikes to help oil profit). Aljazeera the biggest Climate Change propaganda TV on the planet is owned by Oil state Qatar.
4. Emasculation of “Left/progressives” – Red pro-coal-pro NUM anti nuke campaigners are now green anti-coal pro nuke.

What should you do? 1. ENJOY life! Enjoy the planet!
What should you do? 1. ENJOY life! Enjoy the planet!
Don't feel guilty about ‘carbon footprints’. CO2 is the Gas Of Life (GOL)! More GOL increases plant & animal life. GOL (CO2) IS NOT A POLLUTANT MORE CO2 IS GOOD NOT BAD!!!!GOL (CO2) IS NOT A POLLUTANT. MORE CO2 IS GOOD NOT BAD!!!!
2. Accept Man can’t change Climate! Th P bl i Cli t Ch POLICY ‘Cli t S i ’ l k i t it P & di t! The Problem is Climate Change POLICY. ‘Climate Science’ lacks integrity. Prove & predict!
Standards of science must apply to Climate.
3. STOP Carbon reductions, Carbon Tax & Trading 3. STOP Carbon reductions, Carbon Tax & Trading => SAVE UK STEEL <=NO PRAYER WHELLS (Wind farms) MONEY BACK on Green Electricit Charges TheftMONEY BACK on Green Electricity Charges - TheftYour electricity bill has gone up 25% for the Green Con and is set to double
4. KEEP honest green policies to reduce smoke & chemical g ppollution and defend biodiversity.
5. USE LONG RANGE Scientific Solar-Lunar Weather Forecasts & Prepare for the developing Mini Ice Age

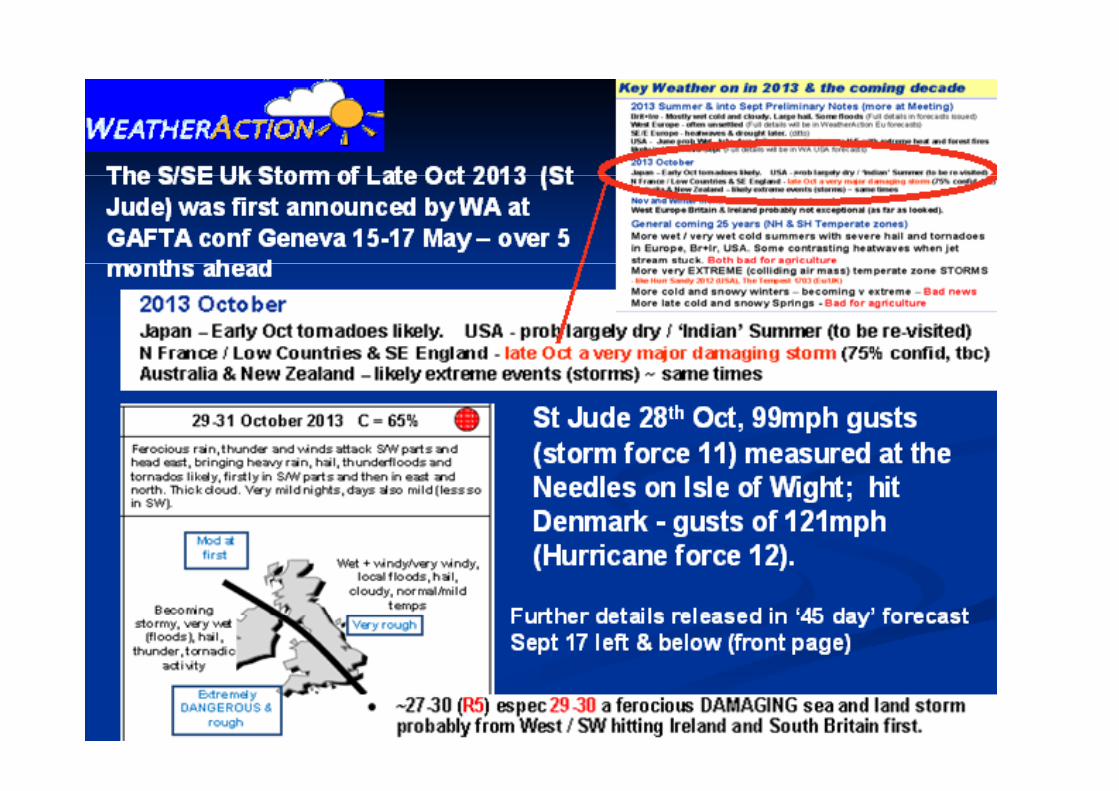


Some Recent weather – Brit+Ire & USA October Storms 2013

TopRed Warning: “Mega storms will hit across world around 28-31 Dec due to Top Level, R5, solar f t f t 10 k h d” Pi C bAmazing Xmas period factors - forecast 10 weeks ahead” – Piers CorbynShort Range charts both sides of the Atlantic confirm WeatherAction solar-based warnings. This is http://www.weatheraction.com/docs/WANews15No29.pdf
Amazing Xmas period 80%OFF Deals BI,Eu,USASUBSCRIBE NOWwww.WeatherAction.com
WeatherAction Long Range forecast notes first made 10 wks ahead warned of a “Top Red (R5)” period around 28-31 Dec which through extra solar activity would drive major storms worldwide. Forecast patterns BI+Eu (from choices 21Oct) such as very deep Lows (Atlantic & USA) are showing in real weather systems although the deep Atlantic Low might not penetrate Scandinavia as first forecast. There will be other extra extreme storm/ Tropical cyclone events in the world.
The graphs warn of Floods & wind damage

“Storm Henry”, blizzards in Scotland & displaced polar Vortex -shown by amazing “nacreous clouds” - confirm WeatherAction90days aheadStorm Henry which pounded Ireland 90days ahead.Storm Henry which pounded Ireland
and N Britain before its effects moved to Europe confirmed Weather-Action (Slat 12c) warning 90d ahead to the day. Next amazing ‘nacreous’ cloudsNext amazing nacreous clouds -associated with the ‘polar vortex’ (cold air normally around the North pole) -were seen in much of N Europe. This confirmed WeatherAction 90d ahead warning for the Polar Vortex to bewarning for the Polar Vortex to be displaced over Br/Ire & W Scand from around the turn of the months into Feb.

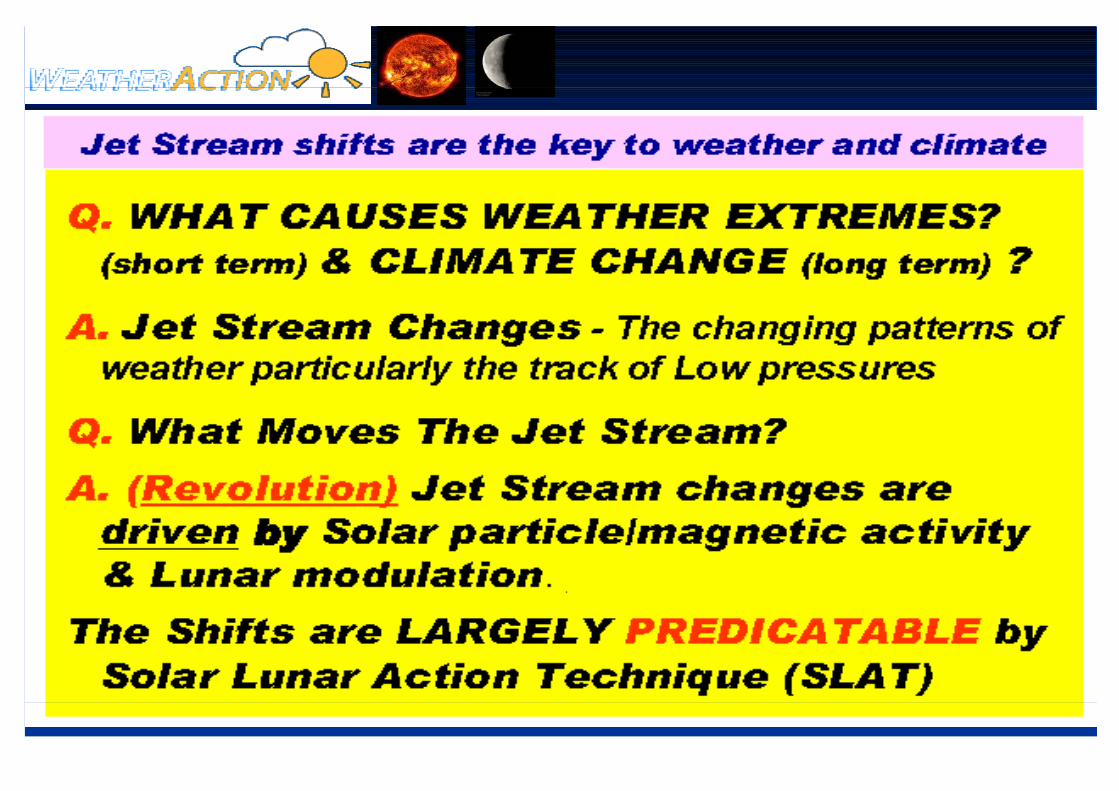
• Piers Corbyn’s Solar-Earth-Weather Science is yadvancing all the time.
• Solar Weather Technique (SWT) now Solar Lunar Action Technique (SLAT)Action Technique (SLAT)
Basic idea is solar activity y(particle and magnetic effects), modulated by Lunar ) yfactors affect Jet Stream and weather developments on hourly, daily, annual, decadal and centuries time scales.
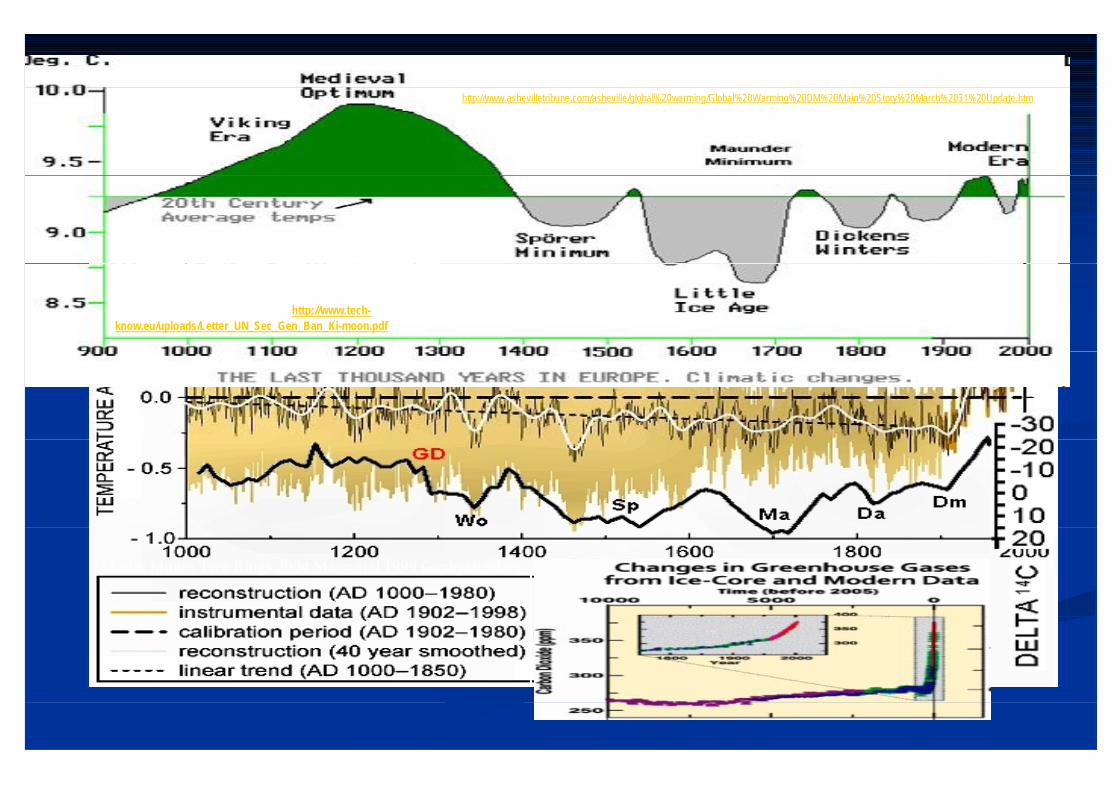
http://www.ashevilletribune.com/asheville/global%20warming/Global%20Warming%20DM%20Main%20Story%20March%2031%20Update.htm
The reality of the Medieval Warm period was accepted chST6H sSGliaSl0EivlaSHaS;((owS%l SviHISnaySviRSongoing rise of CO2 over the last 8,000 yrs (UN figures) see the ‘Gang of 13’ letter to UN: http://www.tech-know.eu/uploads/Letter_UN_Sec_Gen_Ban_Ki-moon.pdf
Martin Munro Tree Rings 2004 Mann etal 1999 GephysResLey

Beats between Lunar-nodal crossings (9.3yr) & the magnetic (~22yr) cycle of the sun drive the ~60yr modulationof Jet Stream hift dth lshifts and the prevalence
many circulation patterns.
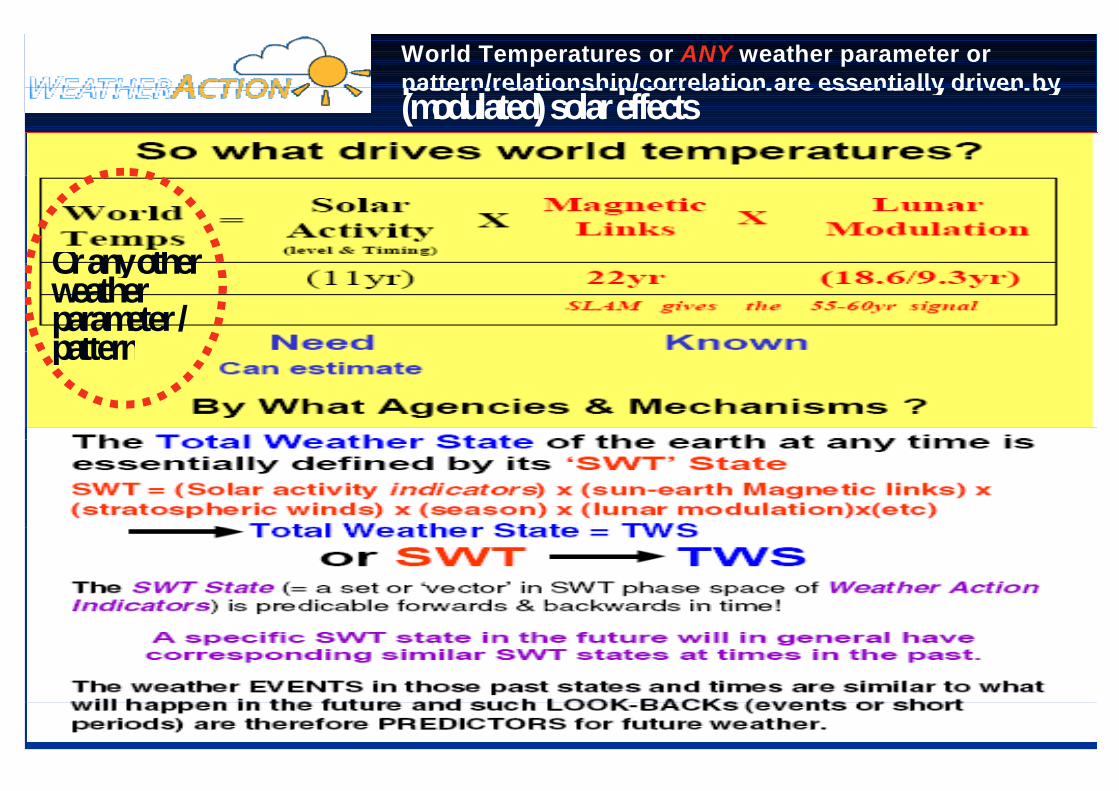
World Temperatures or ANY weather parameter or pattern/relationship/correlation are essentially driven bypattern/relationship/correlation are essentially driven by (modulated) solar effects
OranyotherOr any other weather parameter / patternpattern

Weather in 21st Century - Answers
Weather extremes of recent years are part of natural essentially predictable processes*
S f & (S )Severe summer floods 2007, 2008, 2009 not 2010 & 2011(Scot) 2012 !like very wet summers 1875, 1876, 1877 not 1878 & 1879 1880 !- associated with the approx 132 yr pattern* : 6X22=132, 7X19=133 pp y p ,
The 2007, 2008, 2009, 2011and 2012summer floods were predicted in detail bytheSWT/SLAT Thisflood-likelysummerssituationcan continuedetail by the SWT/SLAT. This flood-likely summers situation can continue for a few years but is SUBJECT TO other conditions (SWT) being satisfied.The Russian superheatwave & Pakistan superduluges were p p galso preceded by similar events ~132 years before - 1878*First explained by Piers Corbyn to Imperial College Union President’s centenary dinner 27 July 2007.
The slow sea level (volume) rise - 6 inches per century - will continue** even as world surface cools It is just ocean volume expansion due to ongoingeven as world surface cools. It is just ocean volume expansion due to ongoing warming of the deep ocean (which is still cold) since the end of the last ice age 10,000 years ago. NOTHING TO DO WITH CO2! {**notwithstanding changes in ocean floor h h th f t h d i th P ifi th I di b ti t h th Hi l d d i T i }9TuAH,9tiT,u9,RTH,uAAHueuaiH,nr,ReHaiTH9,uam,9tIA9,sa,RTH,6uisrsi,u9,RTH,Pamsua,9tF4inaRsaHaR,At9TH9,tA,RTH,!sIu1u&u9,uam,mesgH,o9tauIs9

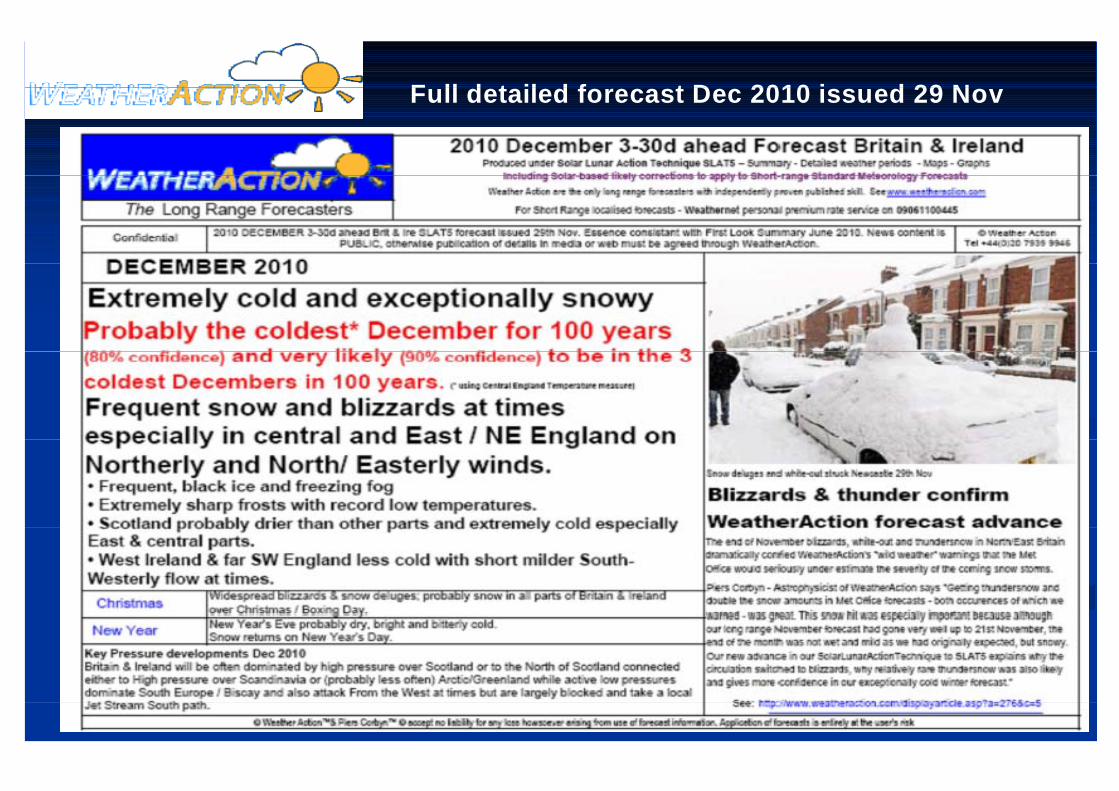
F ll d t il d f t D 2010 i d 29 NFull detailed forecast Dec 2010 issued 29 Nov

The Apocalyptic deluges of July 2012 were well captured in WeatherAction DETAIL 45-75d aheadcaptured in WeatherAction DETAIL 4575d ahead

WeatherAction well captured the cold late “Jet-Stream South” Spring 2013 & won the British Asparagus award for the date to market of field Asparagus –5week delay.

Weymouth Bay VIDEOS (28 03 13) CO2 with Approaching
StormJohn Constable
VIDEOS (28.03.13) – CO2 delusions exposed=> Sir John Beddington challenged to
Most of Constable’s paintings were done
in the period 1800 8 h id
produce EVIDENCE for CO2 changes driving temps in the REAL world with REAL Obs datahttp://www.youtube.com/watch?v=AloLvPdXVBI&feature=youtu.be
to 1820 - the mid and late stages of
the ‘Dalton Minimum’ of Solar
XVBI&feature youtu.be
=> Scientists discuss windfarms (aka 'Prayer Wheels') etc http://www.youtube.com/watch?v=Oco7ExX
Activity RpEs&feature=youtu.be

Instead of a super-computer SLAT uses the whole sun-Earth-moon-etc system as its own computer and applies
SLAT could choose
the principle similar input =>similar outputThe existence of solar-Lunar signals in weather data is
Solar-Lunar DRIVER F(t) – SLAT Equations & Rules
choose between ensemble options
in weather data is evidence that similar input => similar output HOLDS; ie THE SOLAR LUNAR
SLAT could modify the computing process in real time
THE SOLAR-LUNAR DRIVER IS ESSENTIALLY NOT CHAOTIC R5/R4
Earth World Weather WeatherWeather State
World Weather response
Computer Model and
Weather FutureEnsemble
Synoptic data sets
Computer Model and programme
Ensemble of Possible Futures
Extreme solar “Red” Period Effects R5/R4 predictably AJ F Gx z ’H‘ C‘ nt s ’’

There is NOTHING fundamentally new in weather. It has essentially all happened before.x 2 dk k O3C2 ss d2 ssdx 2 L L k O k A du k ) b l k Md
Similar Sun-Earth-Magnetic-Lunar states give similar circulation/weather Look-Back periods tell when to look in the past for weather (1 factor) corresponding to similar future Solar-magnetic-Lunar states.
…=>…=> ...=> Sun-Earth (modulated) state..=> …=>…..=>...=>
� � ' = � R b 32 sdHB b l sA z dW k 2 3x k l d’ 32 3k � MM' = d� ' = � MM' = � MM' = � MM

The developing MIA (LIA) circulation on now(Also http://www.weatheraction.com/displayarticle.asp?a=451&c=5 ) is Solar Climate Change here & now & is characterized by:( p p y p ) g y
1. Sun generally quieter & magnetically more confused, solar wind slower.2. Very large amplitude swings in the Jet stream (NH and SH) with the Jet 2. Very large amplitude swings in the Jet stream (NH and SH) with the Jet
stream average position shifted equator-wards => More ‘Sandy’s’3. General Cooling especially of temperate zones and simultaneous warm and cold (larger) regions
marking different ‘ends’ of jet stream large amplitude wave effectsmarking different ‘ends’ of jet stream large amplitude wave effects.4. Very rapid changes in weather particularly in temperate zones5. Rapid changes in standard parameters – NAO, AO etc6. Stark extremes including more giant hail and tornadic developments (higher lapse rate)7. An increase in major earthquakes and volcanism8 Serious limitations of the powers of standard meteorology even 1 or 2 days ahead at times This8. Serious limitations of the powers of standard meteorology even 1 or 2 days ahead at times. This
was in evidence through most of April and May 2012. These problems will largely continue for at least 25 years and no amount of tweeking standard models or increasing computer power even a thousand fold will overcome it. Standard Meteorology is past it's peak.
SLAT8 is designed to better predict in the approach to the New Little Ice Age circulation patterns the world is now in and uses a wider range of look-back weather data (NB we are constantly seeking more) and considers more rapid change options which may need more modification or changes (if rules suggest) of Look-Back maps particularly under potential sudden Jet stream switches and consequent sudden warming or sudden cooling in regions. SLAT 8 will also (as previous SLATs but more effectively) be able to give long range warning of impending errors in standard Meteorology.
A general inference of SLAT is that the Little Ice Ages** and periods such as The Medieval warm period and BronzeA general inference of SLAT is that the Little Ice Ages and periods such as The Medieval warm period and Bronze age were consequences of solar-lunar driven Jet stream shifts and hence covered the whole of the temperate zones in both North and South hemispheres at around the same time.** Eg the Maunder Minimum around 350 years ago and the Dalton Minima around 200 years ago.REAL CLIMATE CHANGE IS HAPPENING NOW, DRIVEN BY THE SUN & NOTHING TO DO WITH CO2!

Where is World Climate Going? Where is World Climate Going? Solar activity predicts Major COOLING Acknowledgements below
(or 2035)This graph of SUNSPOTS is by Timo Niroma. Its implied cooling is in line with Piers Corbyn’s Solar Lunar
( )
y yp yI vR SBASHmyHuyBHHrSmgFyCHARyALRyaa7y9REvyuSAySlyErlHy7Nhy( ErRyB9BrRy6LSBLyMREmlylMHHALR yARMI RvEAbvRlyBHvvRlI Hm y6RrrF