Embed Size (px)
Citation preview
Cost of Care in Hemophilia and Possible Implications of Health Care
Reform
Kathleen A. Johnson PharmD, MPH, PhDPrincipal Investigator – Hemophilia Utilization Group
Study (HUGS)Professor and Chair, Titus Family Department of Clinical
Pharmacy and Pharmaceutical Economics and Policy, Schaeffer Center for Health Policy and Economics
University of Southern California
1
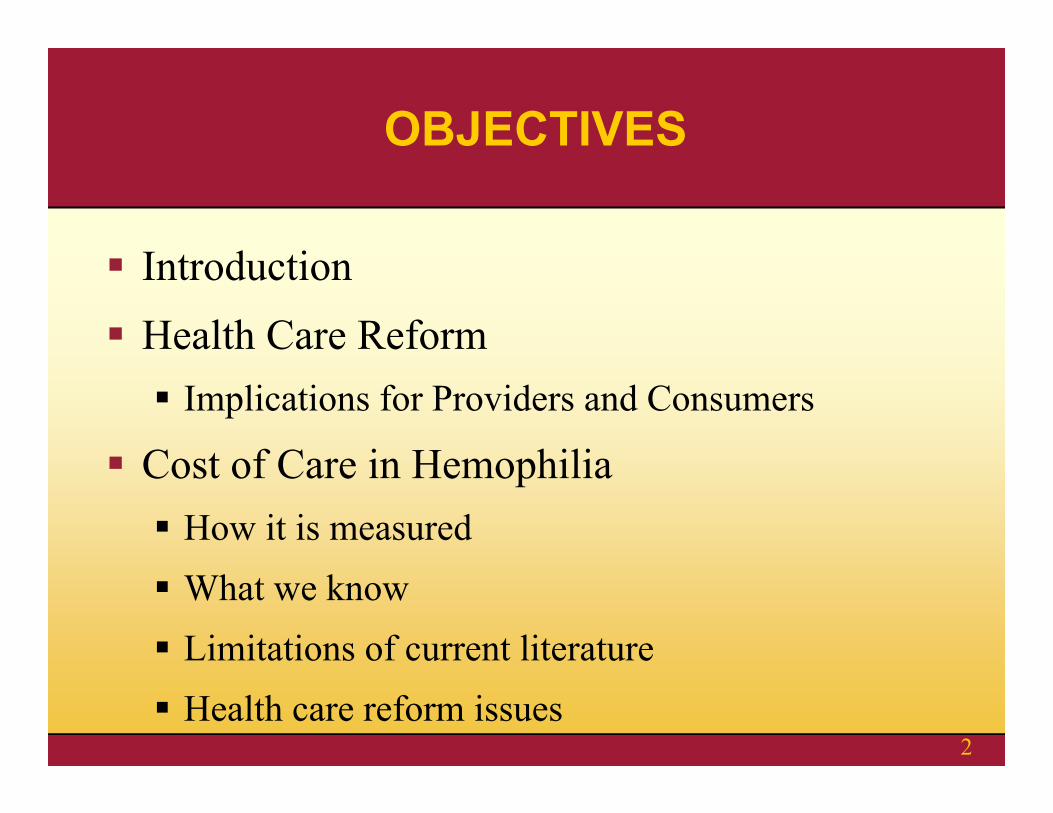
Introduction Health Care Reform Implications for Providers and Consumers
Cost of Care in Hemophilia How it is measured What we know Limitations of current literature Health care reform issues
OBJECTIVES
2
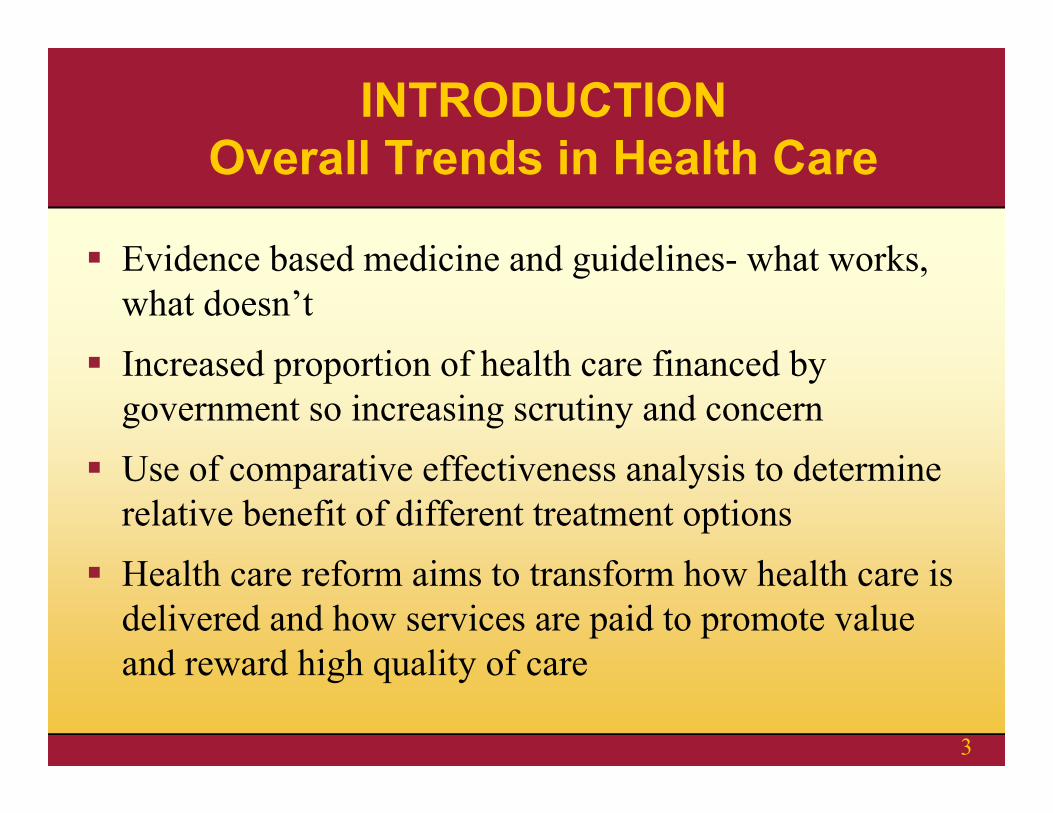
Evidence based medicine and guidelines- what works, what doesn’t
Increased proportion of health care financed by government so increasing scrutiny and concern
Use of comparative effectiveness analysis to determine relative benefit of different treatment options
Health care reform aims to transform how health care is delivered and how services are paid to promote value and reward high quality of care
INTRODUCTION Overall Trends in Health Care
3
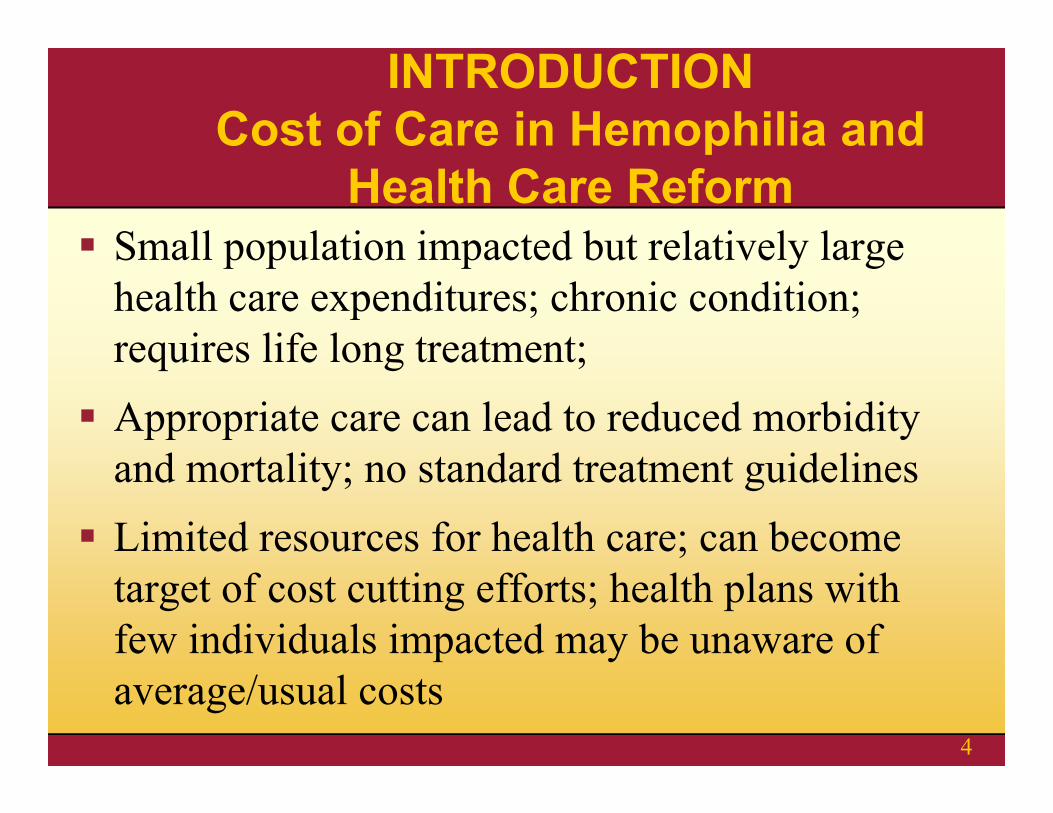
Small population impacted but relatively large health care expenditures; chronic condition; requires life long treatment; Appropriate care can lead to reduced morbidity
and mortality; no standard treatment guidelines Limited resources for health care; can become
target of cost cutting efforts; health plans with few individuals impacted may be unaware of average/usual costs
INTRODUCTIONCost of Care in Hemophilia and
Health Care Reform
4
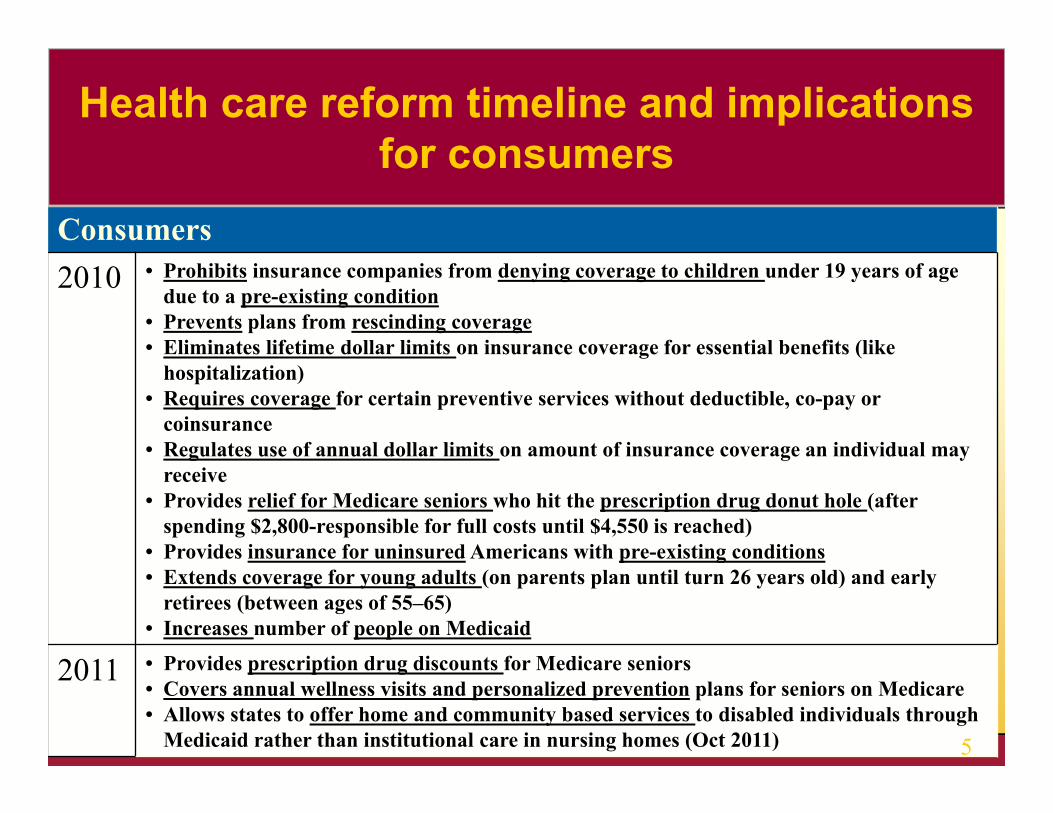
Consumers2010 • Prohibits insurance companies from denying coverage to children under 19 years of age
due to a pre-existing condition• Prevents plans from rescinding coverage• Eliminates lifetime dollar limits on insurance coverage for essential benefits (like
hospitalization)• Requires coverage for certain preventive services without deductible, co-pay or
coinsurance• Regulates use of annual dollar limits on amount of insurance coverage an individual may
receive• Provides relief for Medicare seniors who hit the prescription drug donut hole (after
spending $2,800-responsible for full costs until $4,550 is reached)• Provides insurance for uninsured Americans with pre-existing conditions• Extends coverage for young adults (on parents plan until turn 26 years old) and early
retirees (between ages of 55–65)• Increases number of people on Medicaid
2011 • Provides prescription drug discounts for Medicare seniors• Covers annual wellness visits and personalized prevention plans for seniors on Medicare• Allows states to offer home and community based services to disabled individuals through
Medicaid rather than institutional care in nursing homes (Oct 2011)
Health care reform timeline and implications for consumers
5
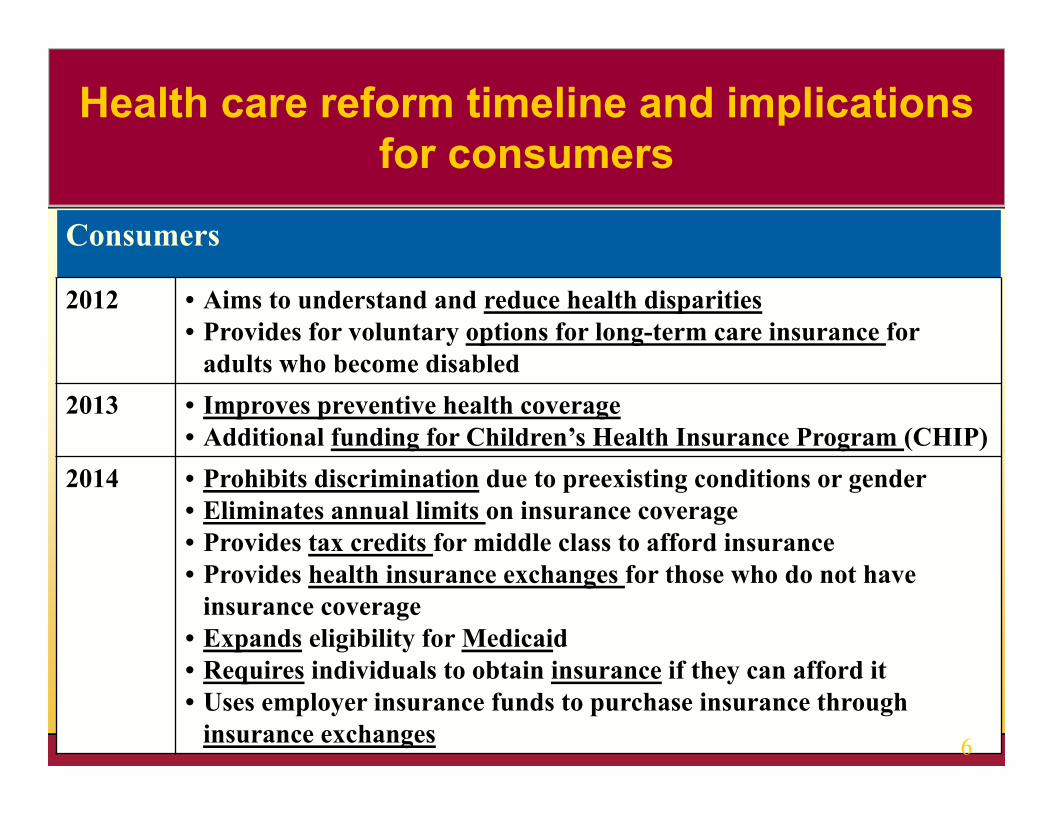
Consumers
2012 • Aims to understand and reduce health disparities• Provides for voluntary options for long-term care insurance for
adults who become disabled2013 • Improves preventive health coverage
• Additional funding for Children’s Health Insurance Program (CHIP)2014 • Prohibits discrimination due to preexisting conditions or gender
• Eliminates annual limits on insurance coverage• Provides tax credits for middle class to afford insurance• Provides health insurance exchanges for those who do not have
insurance coverage• Expands eligibility for Medicaid• Requires individuals to obtain insurance if they can afford it• Uses employer insurance funds to purchase insurance through
insurance exchanges
Health care reform timeline and implications for consumers
6
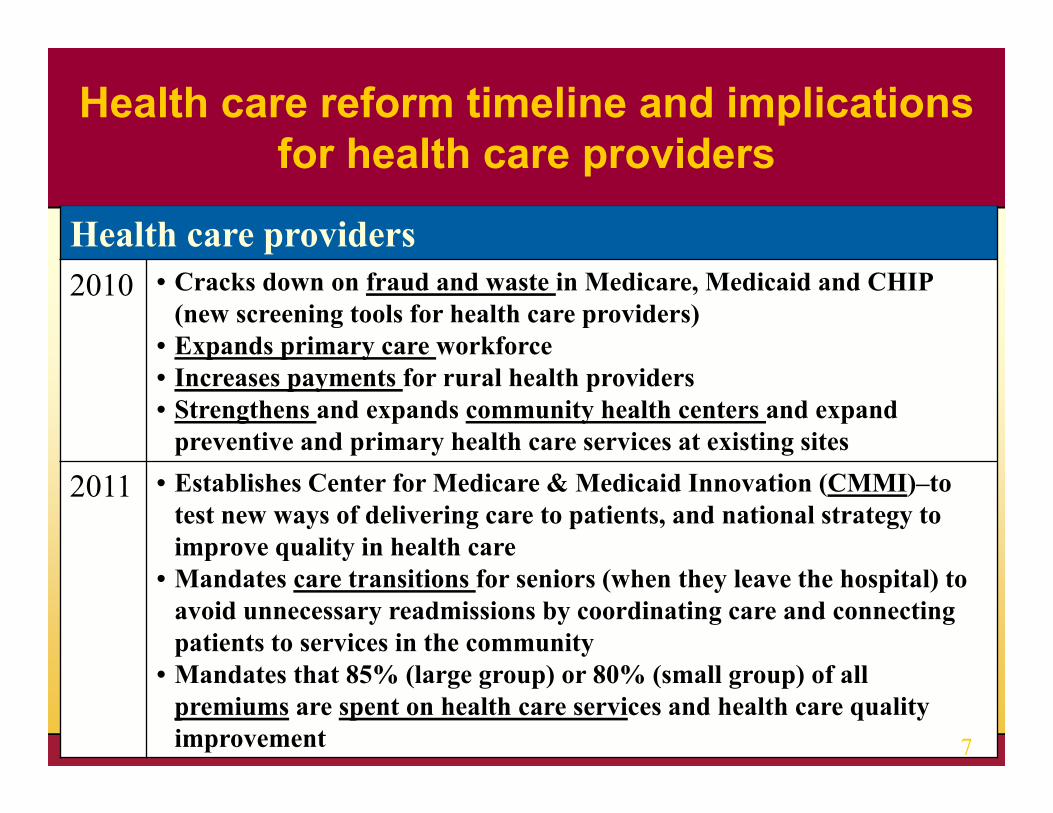
Health care providers2010 • Cracks down on fraud and waste in Medicare, Medicaid and CHIP
(new screening tools for health care providers)• Expands primary care workforce• Increases payments for rural health providers• Strengthens and expands community health centers and expand
preventive and primary health care services at existing sites
2011 • Establishes Center for Medicare & Medicaid Innovation (CMMI)–to test new ways of delivering care to patients, and national strategy to improve quality in health care
• Mandates care transitions for seniors (when they leave the hospital) to avoid unnecessary readmissions by coordinating care and connecting patients to services in the community
• Mandates that 85% (large group) or 80% (small group) of all premiums are spent on health care services and health care quality improvement
Health care reform timeline and implications for health care providers
7
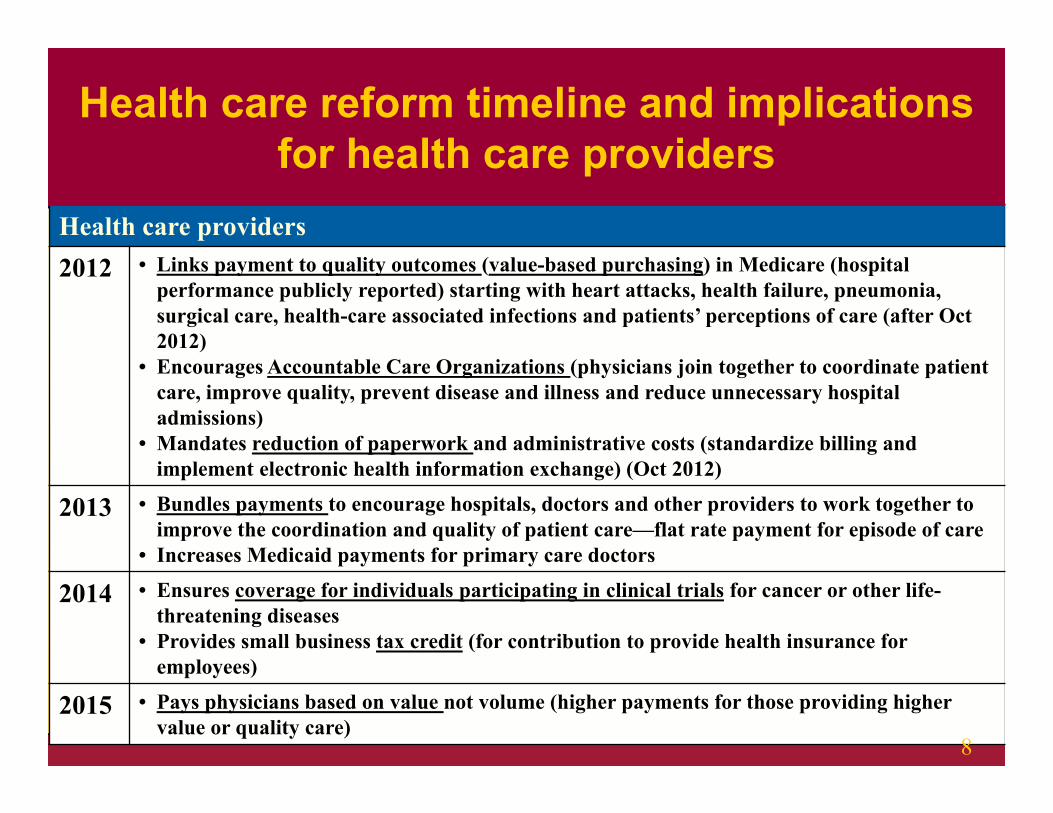
Health care providers2012 • Links payment to quality outcomes (value-based purchasing) in Medicare (hospital
performance publicly reported) starting with heart attacks, health failure, pneumonia, surgical care, health-care associated infections and patients’ perceptions of care (after Oct 2012)
• Encourages Accountable Care Organizations (physicians join together to coordinate patient care, improve quality, prevent disease and illness and reduce unnecessary hospital admissions)
• Mandates reduction of paperwork and administrative costs (standardize billing and implement electronic health information exchange) (Oct 2012)
2013 • Bundles payments to encourage hospitals, doctors and other providers to work together to improve the coordination and quality of patient care—flat rate payment for episode of care
• Increases Medicaid payments for primary care doctors
2014 • Ensures coverage for individuals participating in clinical trials for cancer or other life-threatening diseases
• Provides small business tax credit (for contribution to provide health insurance for employees)
2015 • Pays physicians based on value not volume (higher payments for those providing higher value or quality care)
Health care reform timeline and implications for health care providers
8
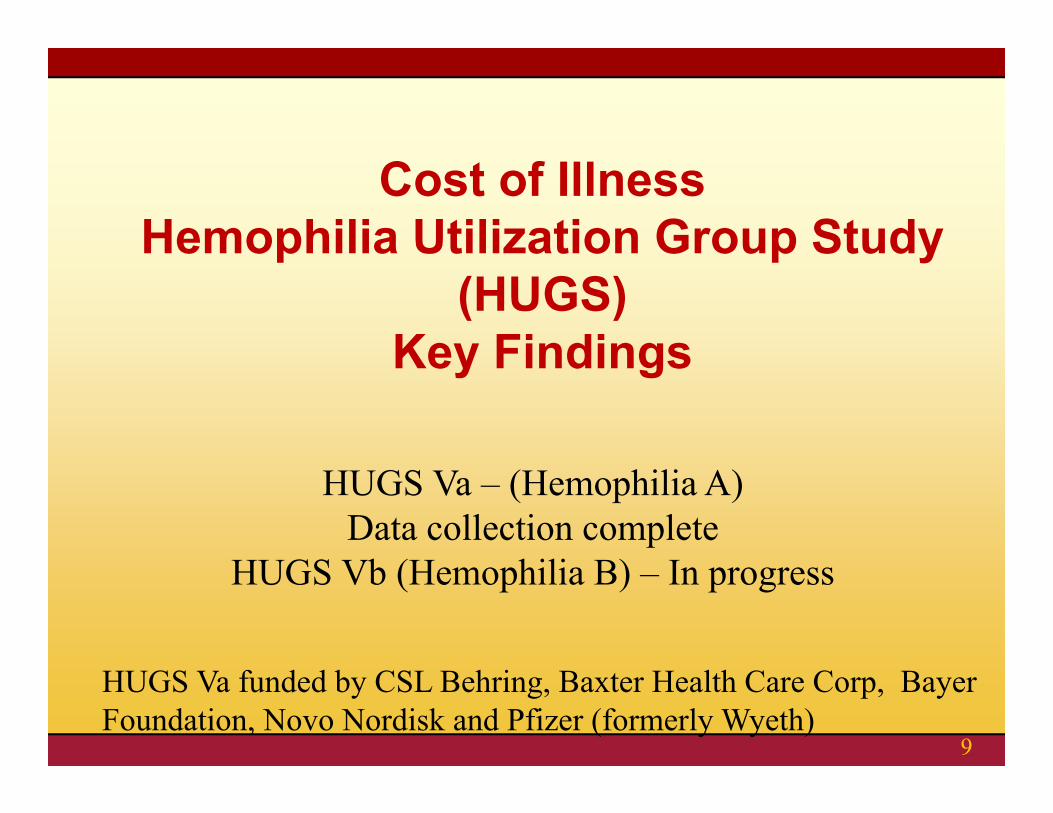
Cost of IllnessHemophilia Utilization Group Study
(HUGS)Key Findings
HUGS Va – (Hemophilia A)Data collection complete
HUGS Vb (Hemophilia B) – In progress
9
HUGS Va funded by CSL Behring, Baxter Health Care Corp, Bayer Foundation, Novo Nordisk and Pfizer (formerly Wyeth)
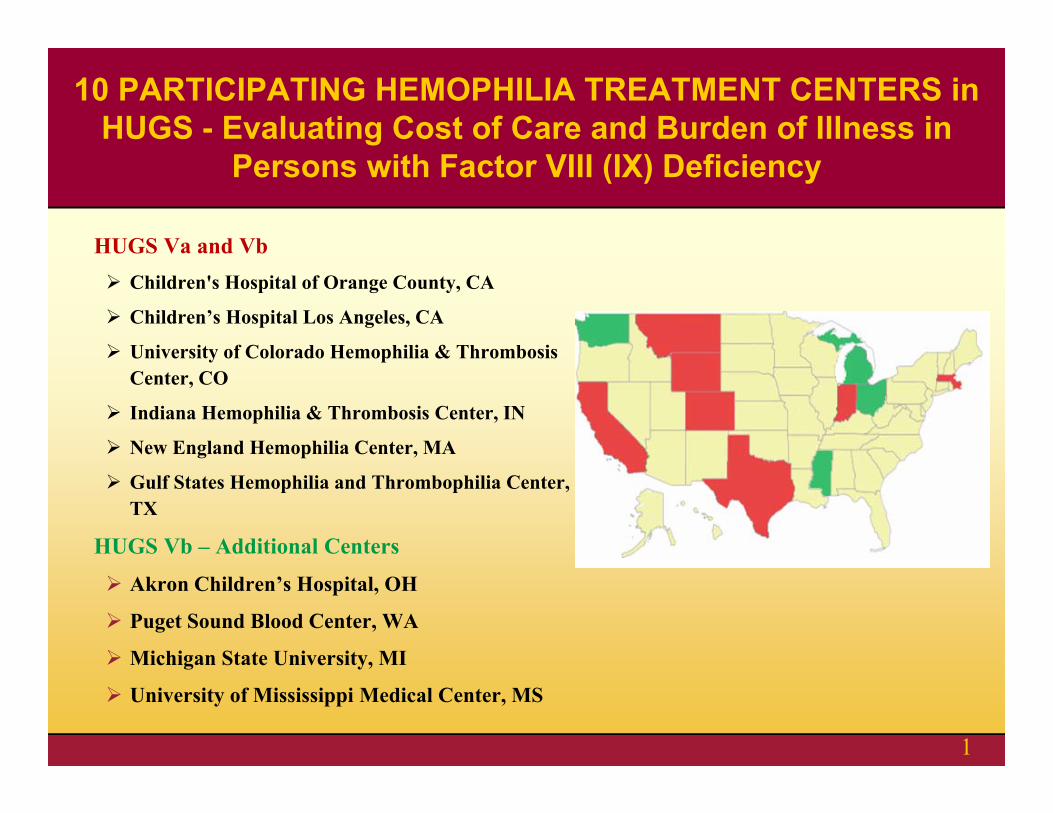
HUGS Va and Vb Children's Hospital of Orange County, CA
Children’s Hospital Los Angeles, CA
University of Colorado Hemophilia & Thrombosis Center, CO
Indiana Hemophilia & Thrombosis Center, IN
New England Hemophilia Center, MA
Gulf States Hemophilia and Thrombophilia Center, TX
HUGS Vb – Additional Centers
Akron Children’s Hospital, OH
Puget Sound Blood Center, WA
Michigan State University, MI
University of Mississippi Medical Center, MS
10 PARTICIPATING HEMOPHILIA TREATMENT CENTERS in HUGS - Evaluating Cost of Care and Burden of Illness in
Persons with Factor VIII (IX) Deficiency
1
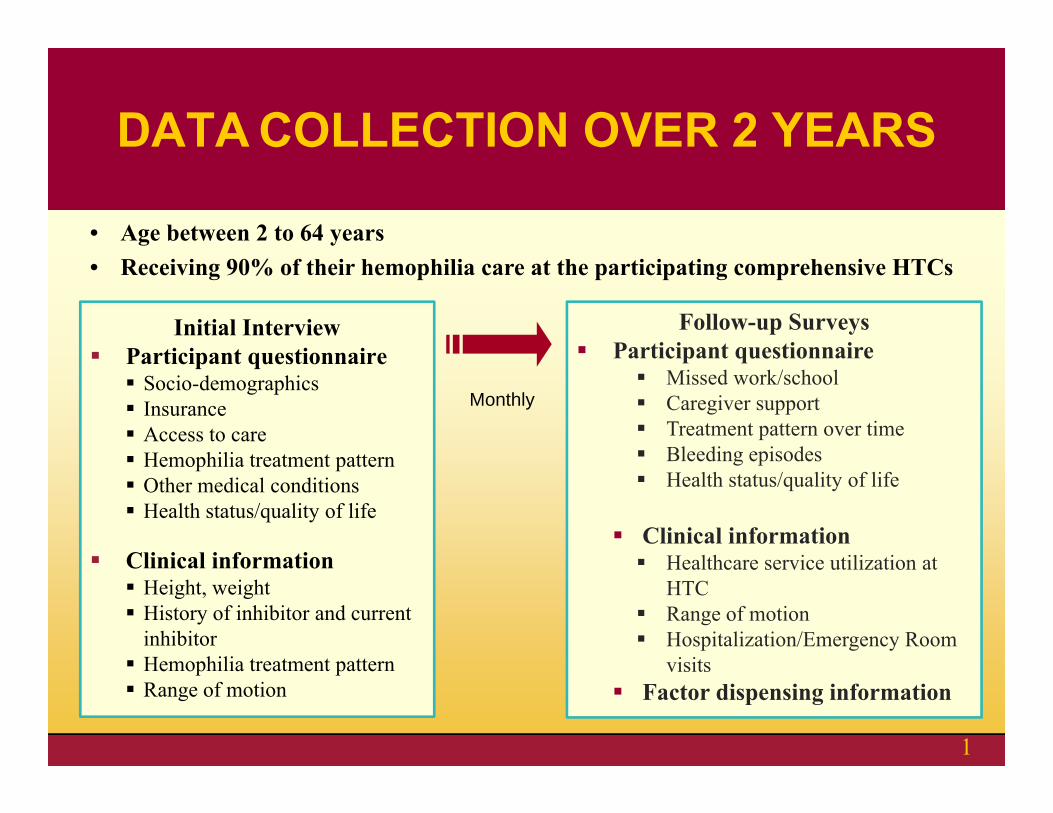
Initial Interview Participant questionnaire Socio-demographics Insurance Access to care Hemophilia treatment pattern Other medical conditions Health status/quality of life
Clinical information Height, weight History of inhibitor and current
inhibitor Hemophilia treatment pattern Range of motion
Follow-up Surveys Participant questionnaire
Missed work/school Caregiver support Treatment pattern over time Bleeding episodes Health status/quality of life
Clinical information Healthcare service utilization at
HTC Range of motion Hospitalization/Emergency Room
visits Factor dispensing information
Monthly
• Age between 2 to 64 years • Receiving 90% of their hemophilia care at the participating comprehensive HTCs
DATA COLLECTION OVER 2 YEARS
1
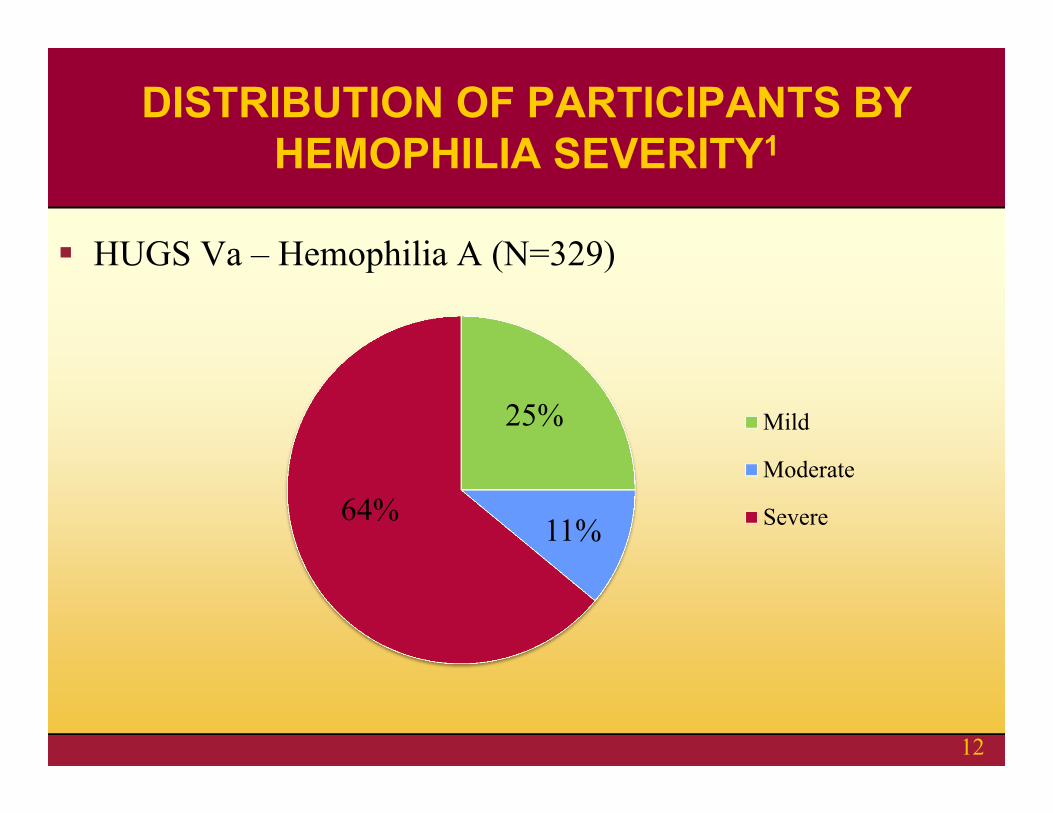
25%
11%64%
Mild
Moderate
Severe
HUGS Va – Hemophilia A (N=329)
DISTRIBUTION OF PARTICIPANTS BY HEMOPHILIA SEVERITY1
12
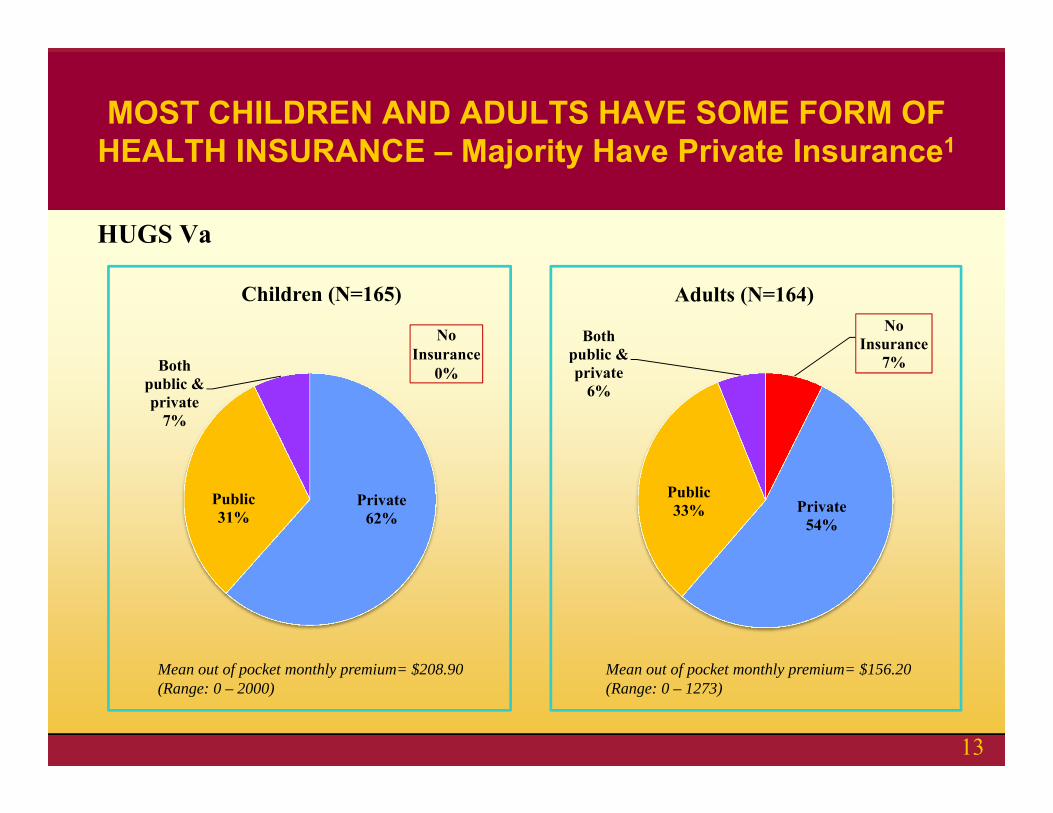
HUGS Va
Private62%
Public31%
Both public & private
7%
Children (N=165)No
Insurance7%
Private54%
Public33%
Both public & private
6%
Adults (N=164)
Mean out of pocket monthly premium= $208.90 (Range: 0 – 2000)
Mean out of pocket monthly premium= $156.20 (Range: 0 – 1273)
MOST CHILDREN AND ADULTS HAVE SOME FORM OF HEALTH INSURANCE – Majority Have Private Insurance1
No Insurance
0%
13
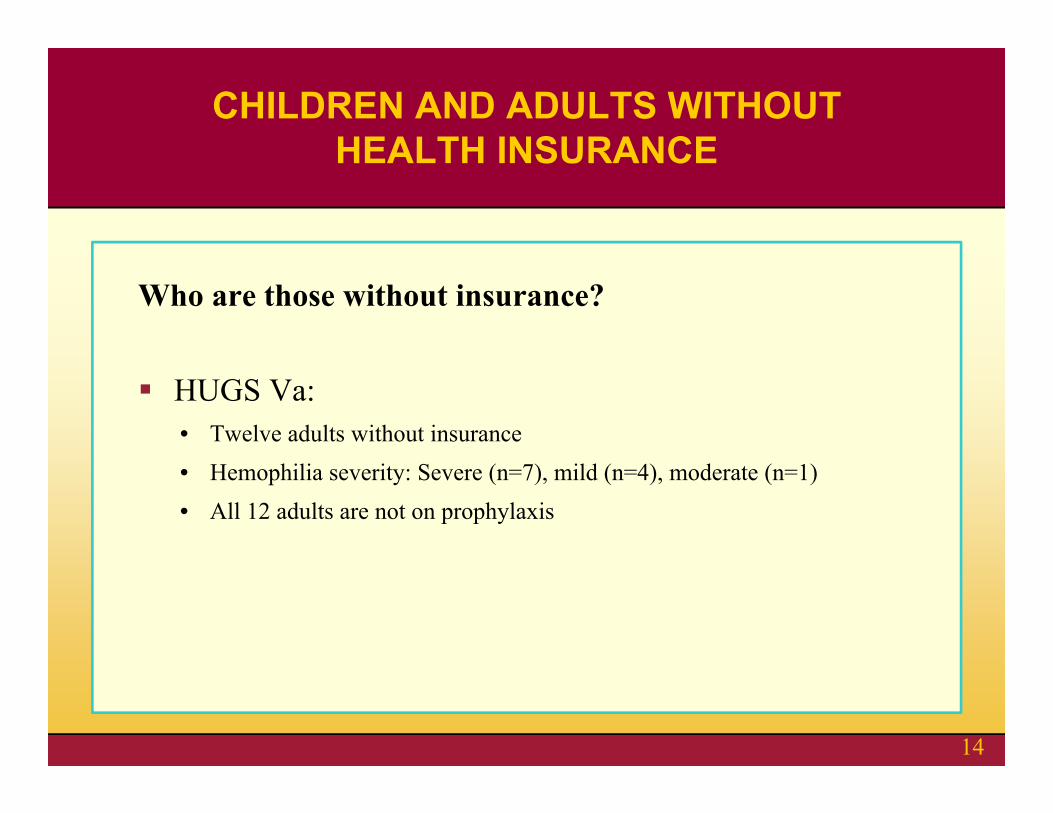
Who are those without insurance?
HUGS Va:• Twelve adults without insurance• Hemophilia severity: Severe (n=7), mild (n=4), moderate (n=1)• All 12 adults are not on prophylaxis
CHILDREN AND ADULTS WITHOUT HEALTH INSURANCE
14
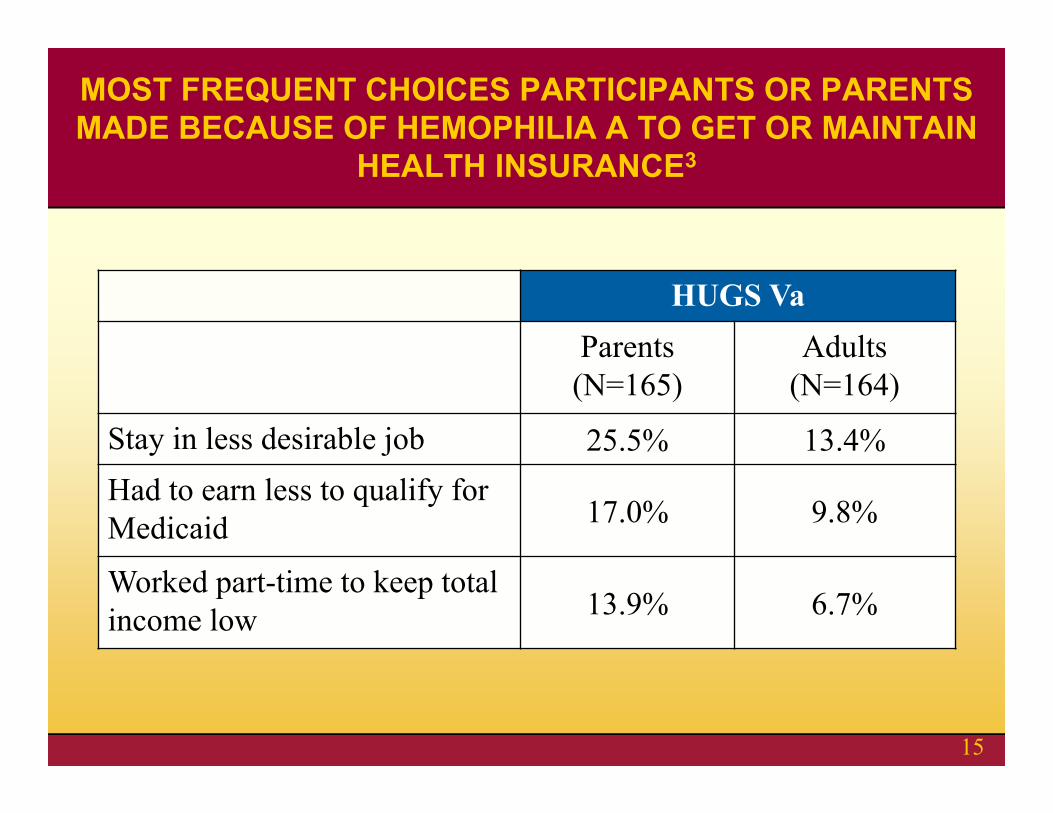
HUGS VaParents
(N=165)Adults
(N=164)
Stay in less desirable job 25.5% 13.4%Had to earn less to qualify for Medicaid 17.0% 9.8%
Worked part-time to keep total income low 13.9% 6.7%
MOST FREQUENT CHOICES PARTICIPANTS OR PARENTS MADE BECAUSE OF HEMOPHILIA A TO GET OR MAINTAIN
HEALTH INSURANCE3
15
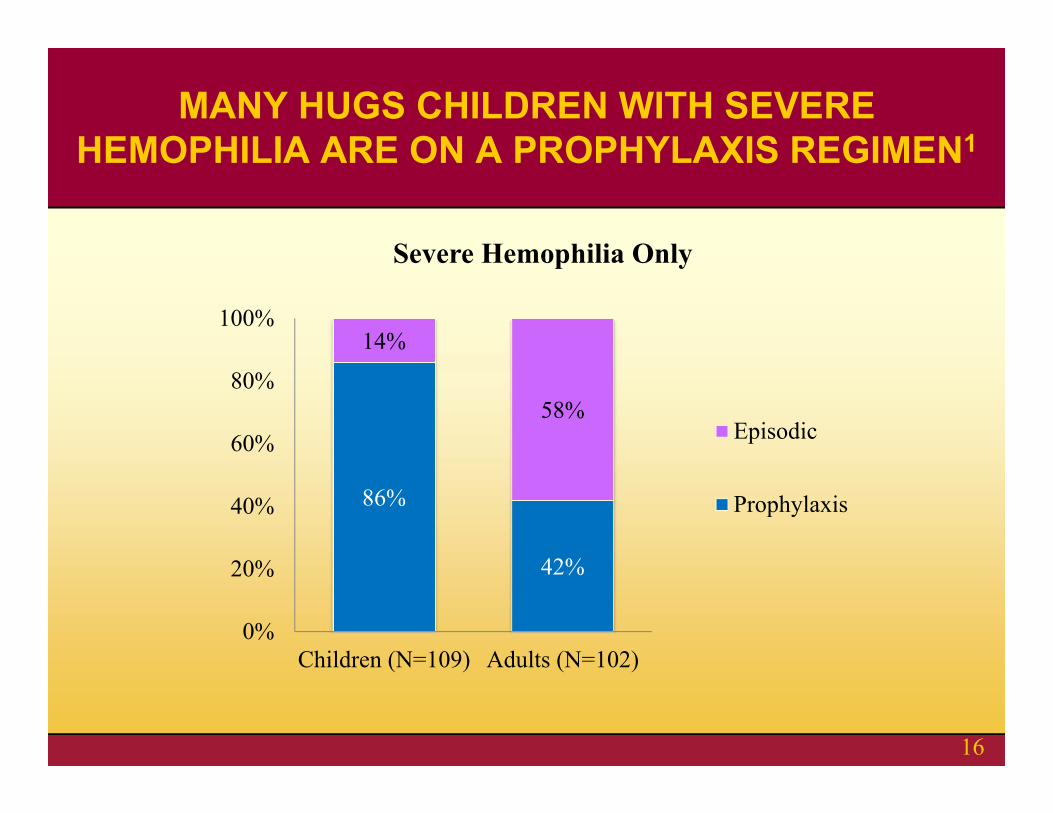
86%
42%
14%
58%
0%
20%
40%
60%
80%
100%
Children (N=109) Adults (N=102)
Severe Hemophilia Only
Episodic
Prophylaxis
MANY HUGS CHILDREN WITH SEVERE HEMOPHILIA ARE ON A PROPHYLAXIS REGIMEN1
16
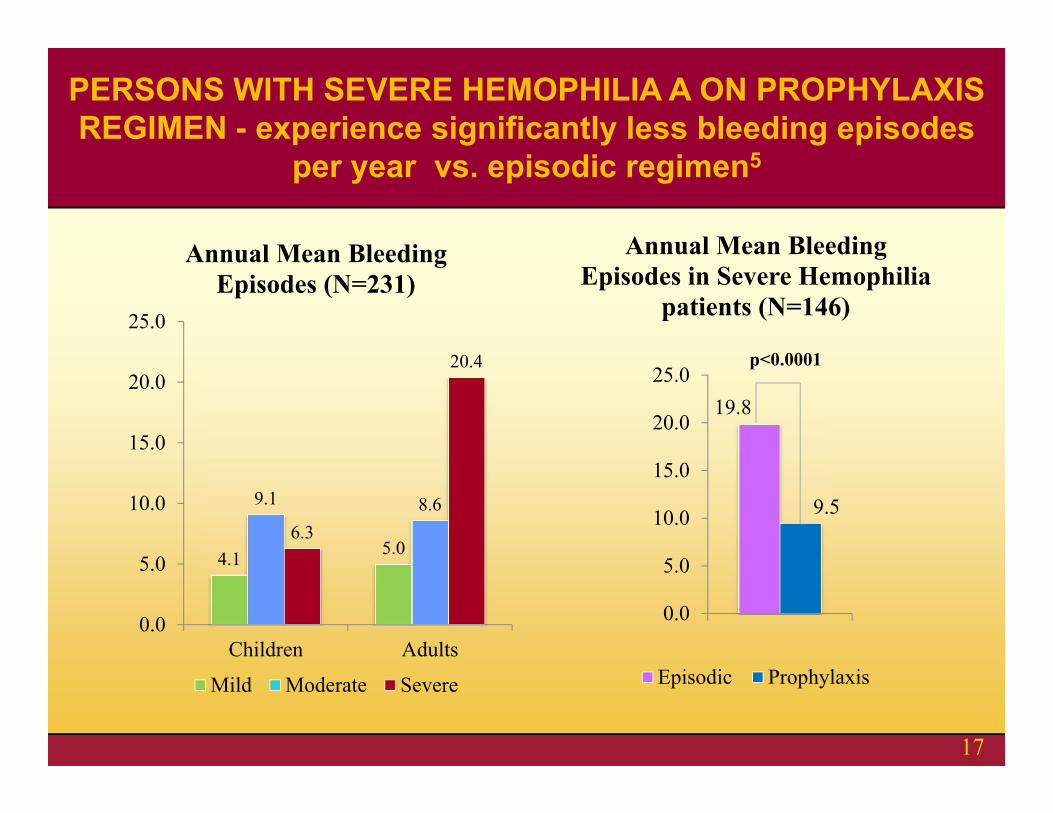
4.1 5.0
9.1 8.66.3
20.4
0.0
5.0
10.0
15.0
20.0
25.0
Children Adults
Annual Mean Bleeding Episodes (N=231)
Mild Moderate Severe
19.8
9.5
0.0
5.0
10.0
15.0
20.0
25.0
Annual Mean Bleeding Episodes in Severe Hemophilia
patients (N=146)
Episodic Prophylaxis
p<0.0001
PERSONS WITH SEVERE HEMOPHILIA A ON PROPHYLAXIS REGIMEN - experience significantly less bleeding episodes
per year vs. episodic regimen5
17
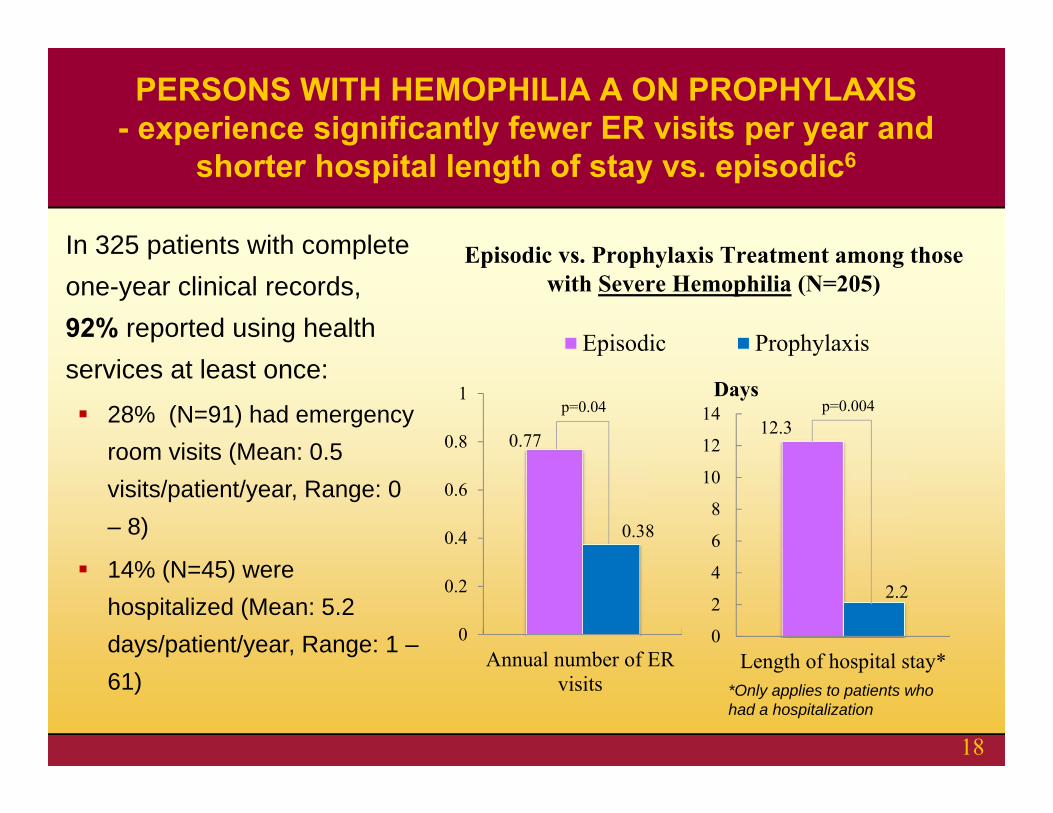
Episodic vs. Prophylaxis Treatment among those with Severe Hemophilia (N=205)
12.3
2.2
0
2
4
6
8
10
12
14
Length of hospital stay*
Days
Episodic Prophylaxis
p=0.004
*Only applies to patients who had a hospitalization
In 325 patients with complete one-year clinical records, 92% reported using health services at least once: 28% (N=91) had emergency
room visits (Mean: 0.5 visits/patient/year, Range: 0 – 8)
14% (N=45) were hospitalized (Mean: 5.2 days/patient/year, Range: 1 –61)
PERSONS WITH HEMOPHILIA A ON PROPHYLAXIS - experience significantly fewer ER visits per year and
shorter hospital length of stay vs. episodic6
0.77
0.38
0
0.2
0.4
0.6
0.8
1
Annual number of ERvisits
p=0.04
18
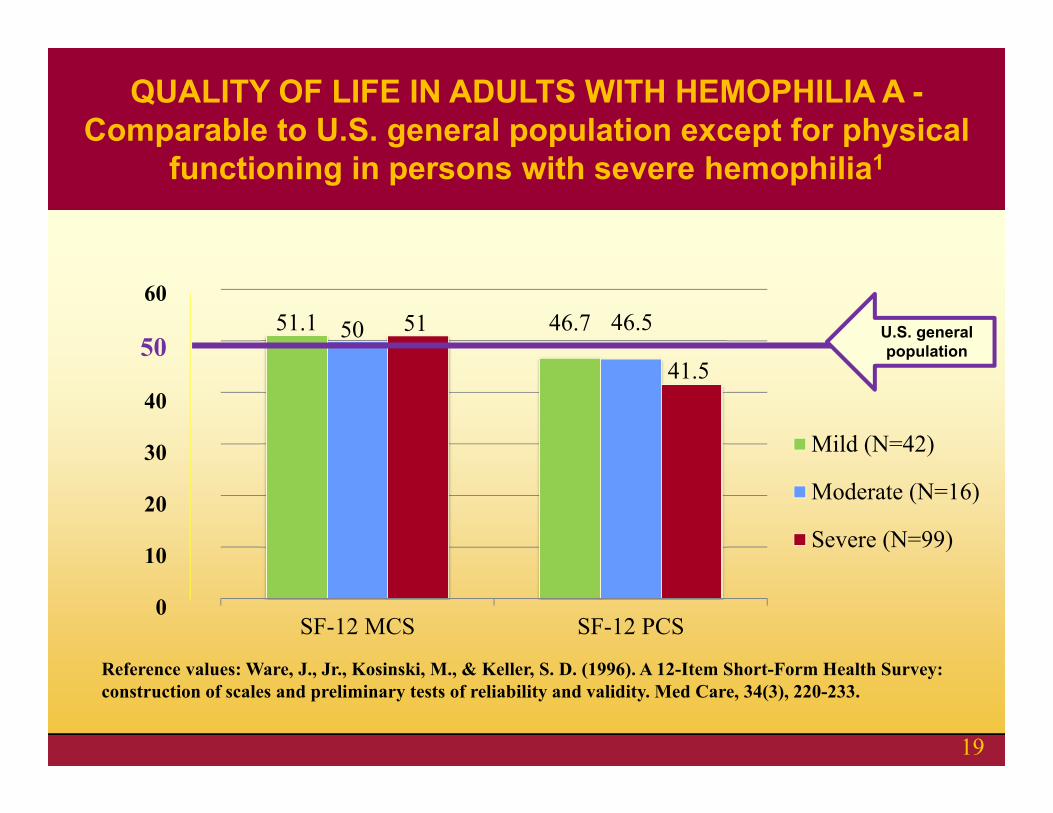
51.1 46.750 46.551
41.5
SF-12 MCS SF-12 PCS
Mild (N=42)
Moderate (N=16)
Severe (N=99)
U.S. general population
60
50
40
30
20
10
0
Reference values: Ware, J., Jr., Kosinski, M., & Keller, S. D. (1996). A 12-Item Short-Form Health Survey: construction of scales and preliminary tests of reliability and validity. Med Care, 34(3), 220-233.
QUALITY OF LIFE IN ADULTS WITH HEMOPHILIA A -Comparable to U.S. general population except for physical
functioning in persons with severe hemophilia1
19
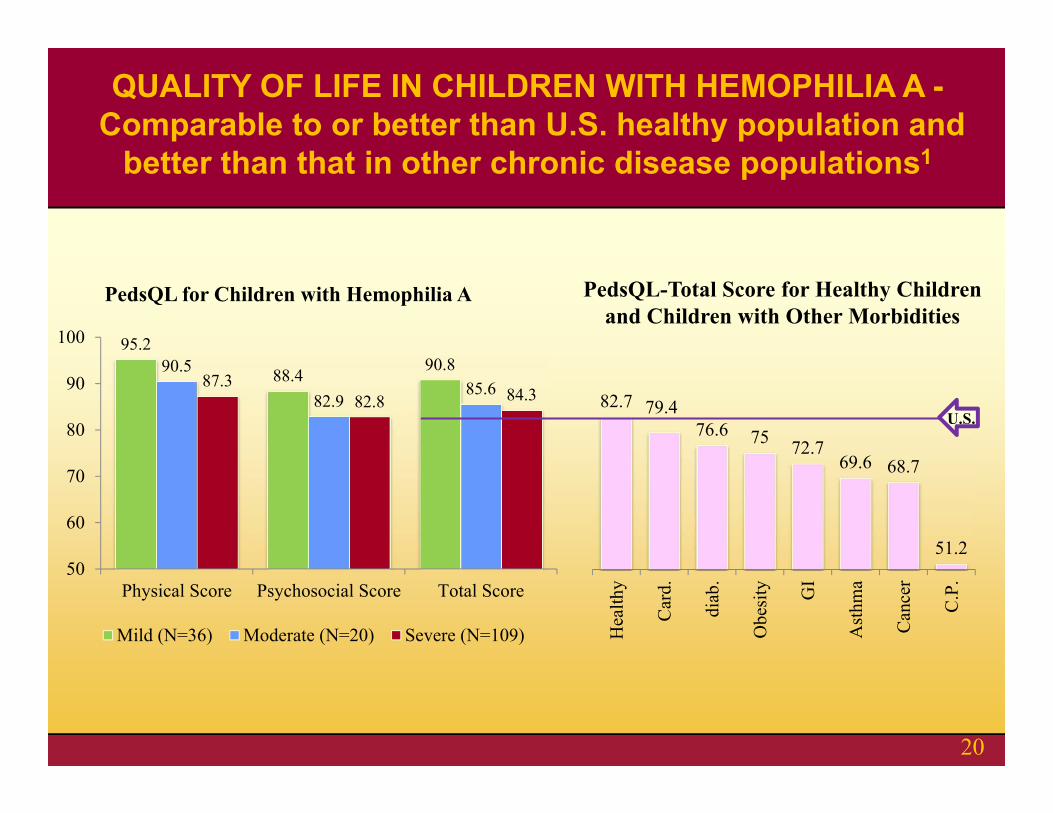
95.2
88.4 90.890.5
82.985.687.3
82.8 84.3
50
60
70
80
90
100
Physical Score Psychosocial Score Total Score
PedsQL for Children with Hemophilia A
Mild (N=36) Moderate (N=20) Severe (N=109)
82.7 79.476.6 75 72.7
69.6 68.7
51.2
Hea
lthy
Car
d.
diab
.
Obe
sity GI
Ast
hma
Can
cer
C.P
.
U.S.
PedsQL-Total Score for Healthy Children and Children with Other Morbidities
QUALITY OF LIFE IN CHILDREN WITH HEMOPHILIA A -Comparable to or better than U.S. healthy population and
better than that in other chronic disease populations1
20
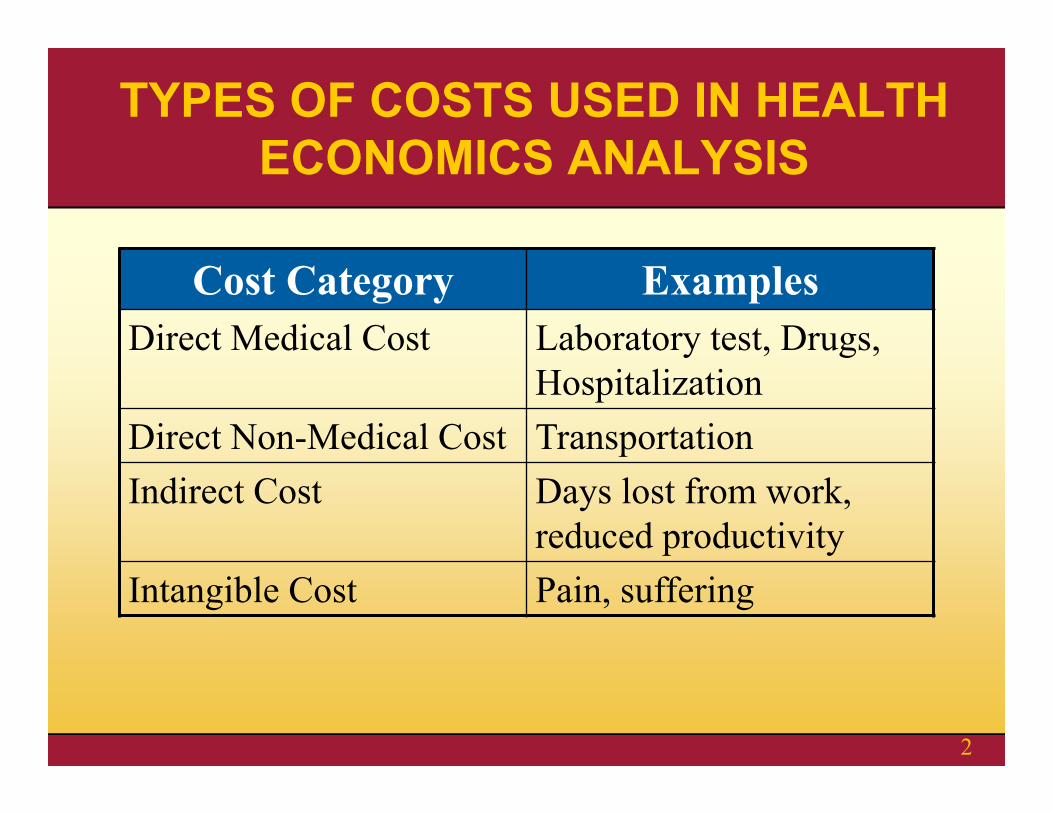
TYPES OF COSTS USED IN HEALTH ECONOMICS ANALYSIS
Cost Category ExamplesDirect Medical Cost Laboratory test, Drugs,
HospitalizationDirect Non-Medical Cost TransportationIndirect Cost Days lost from work,
reduced productivityIntangible Cost Pain, suffering
2
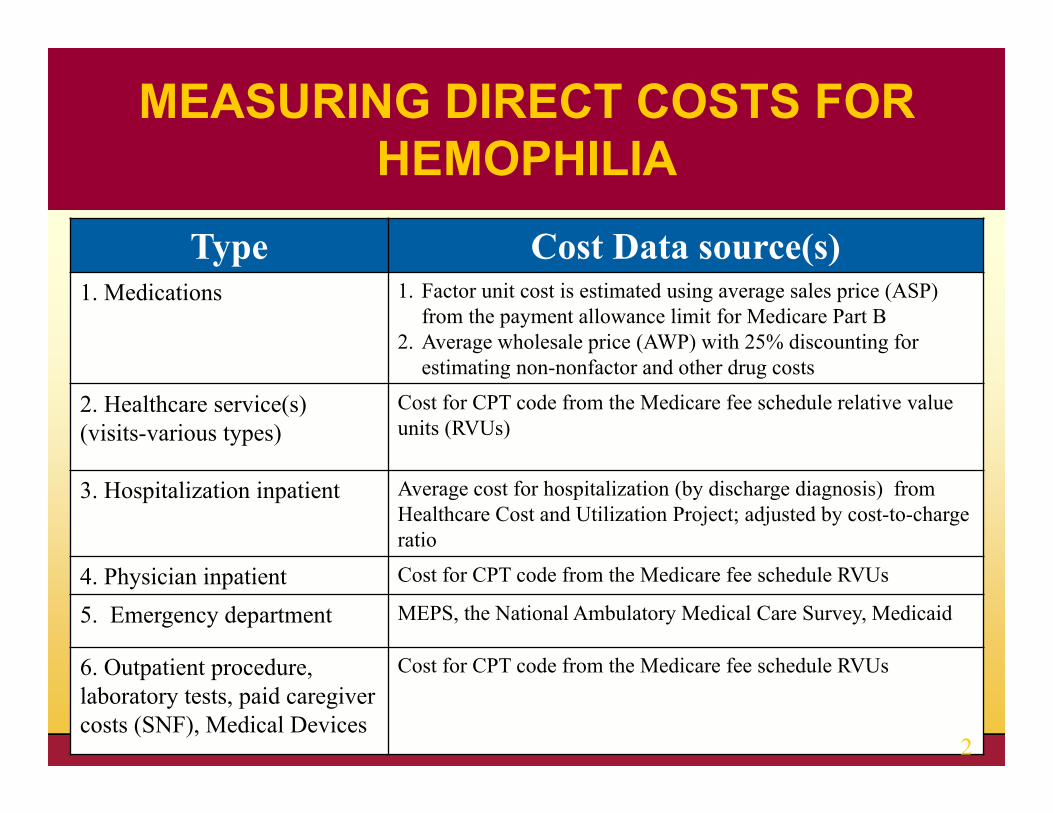
Type Cost Data source(s)1. Medications 1. Factor unit cost is estimated using average sales price (ASP)
from the payment allowance limit for Medicare Part B2. Average wholesale price (AWP) with 25% discounting for
estimating non-nonfactor and other drug costs
2. Healthcare service(s) (visits-various types)
Cost for CPT code from the Medicare fee schedule relative value units (RVUs)
3. Hospitalization inpatient Average cost for hospitalization (by discharge diagnosis) from Healthcare Cost and Utilization Project; adjusted by cost-to-charge ratio
4. Physician inpatient Cost for CPT code from the Medicare fee schedule RVUs
5. Emergency department MEPS, the National Ambulatory Medical Care Survey, Medicaid
6. Outpatient procedure, laboratory tests, paid caregiver costs (SNF), Medical Devices
Cost for CPT code from the Medicare fee schedule RVUs
MEASURING DIRECT COSTS FOR HEMOPHILIA
2
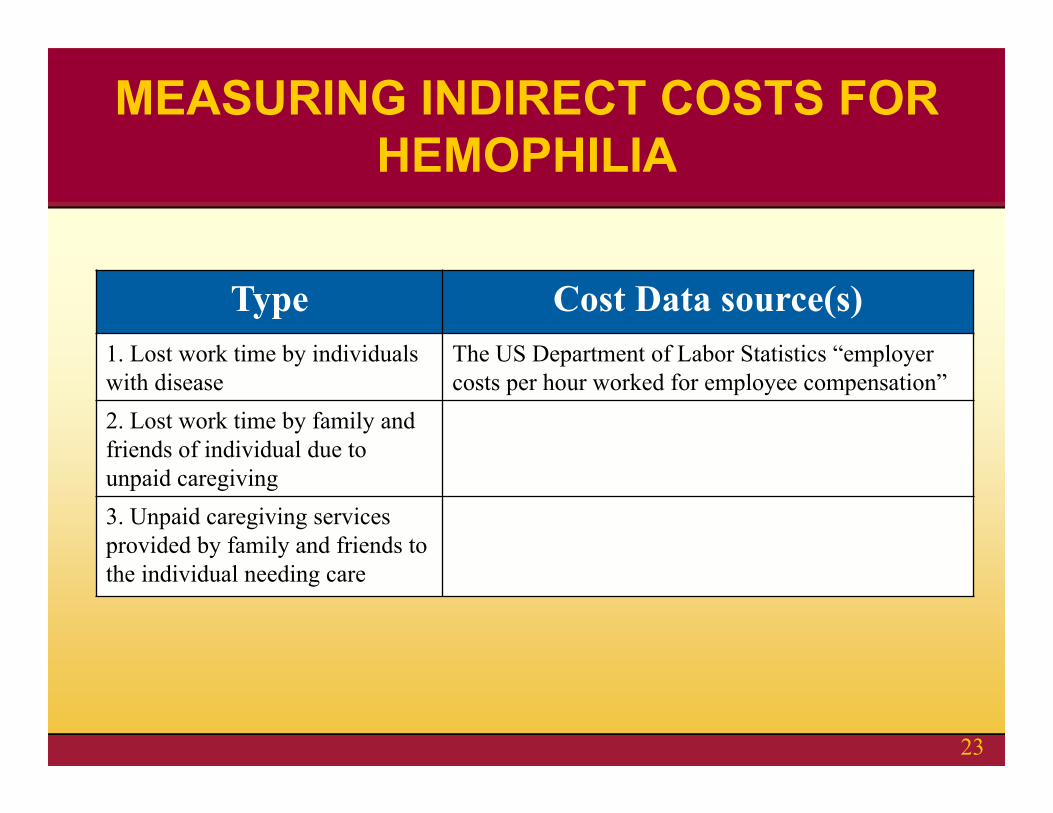
Type Cost Data source(s)1. Lost work time by individuals with disease
The US Department of Labor Statistics “employer costs per hour worked for employee compensation”
2. Lost work time by family and friends of individual due to unpaid caregiving3. Unpaid caregiving services provided by family and friends to the individual needing care
MEASURING INDIRECT COSTS FOR HEMOPHILIA
23
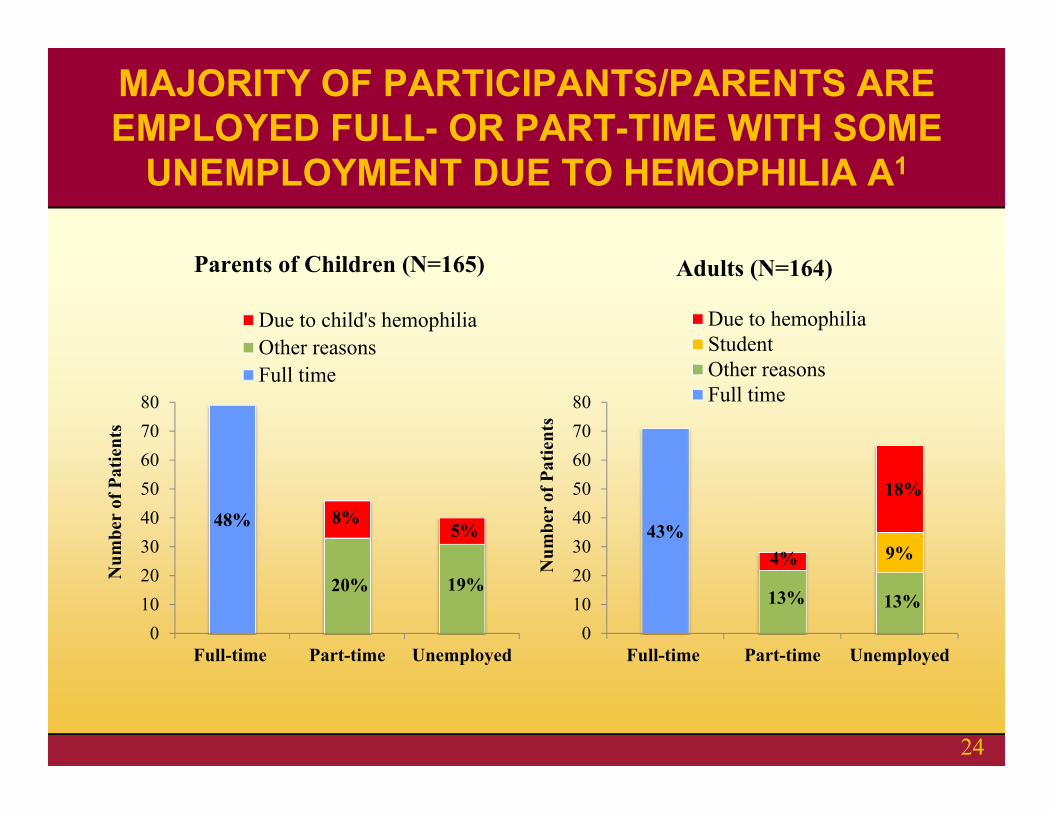
MAJORITY OF PARTICIPANTS/PARENTS ARE EMPLOYED FULL- OR PART-TIME WITH SOME
UNEMPLOYMENT DUE TO HEMOPHILIA A1
48% 8%5%
20% 19%
01020304050607080
Full-time Part-time Unemployed
Num
ber
of P
atie
nts
Due to child's hemophiliaOther reasonsFull time
43%4%
18%
9%
13% 13%
01020304050607080
Full-time Part-time Unemployed
Num
ber
of P
atie
nts
Due to hemophiliaStudentOther reasonsFull time
Parents of Children (N=165) Adults (N=164)
24
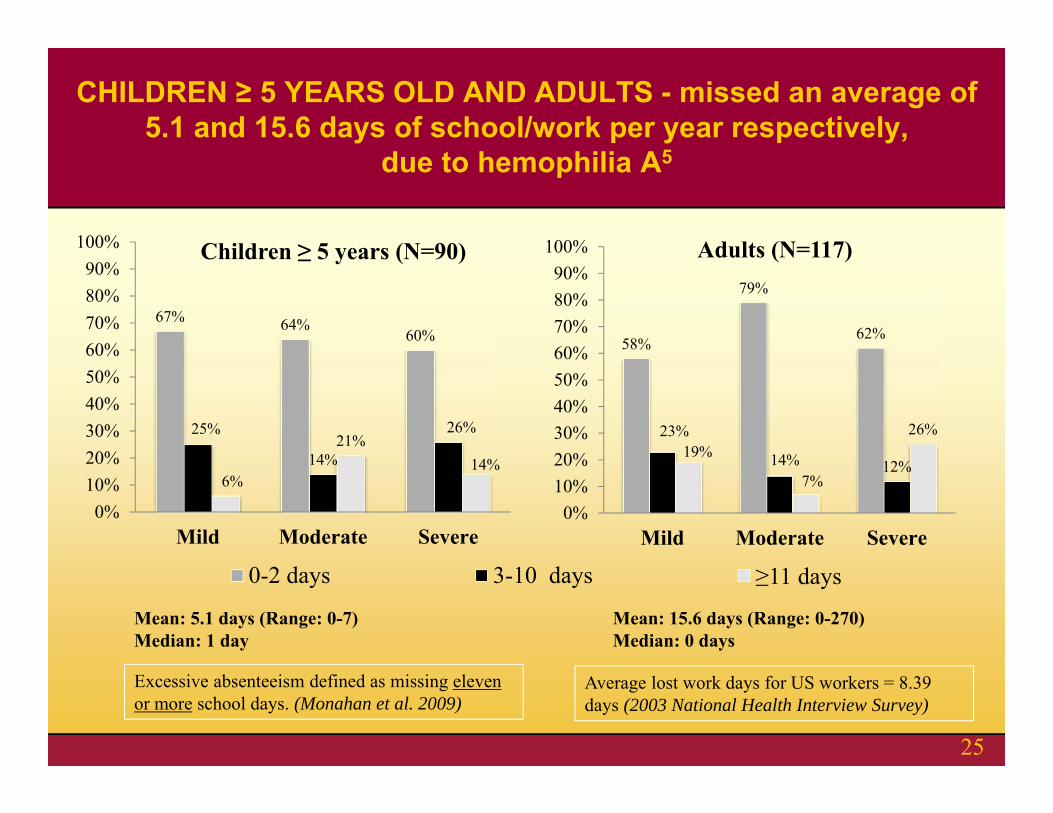
67% 64%60%
25%
14%
26%
6%
21%14%
0%10%20%30%40%50%60%70%80%90%
100%
Mild Moderate Severe
Children ≥ 5 years (N=90)
0-2 days 3-10 days ≥11 days
Mean: 5.1 days (Range: 0-7)Median: 1 day
58%
79%
62%
23%
14% 12%19%
7%
26%
0%10%20%30%40%50%60%70%80%90%
100%
Mild Moderate Severe
Adults (N=117)
Mean: 15.6 days (Range: 0-270)Median: 0 days
Excessive absenteeism defined as missing eleven or more school days. (Monahan et al. 2009)
Average lost work days for US workers = 8.39 days (2003 National Health Interview Survey)
CHILDREN ≥ 5 YEARS OLD AND ADULTS - missed an average of 5.1 and 15.6 days of school/work per year respectively,
due to hemophilia A5
25
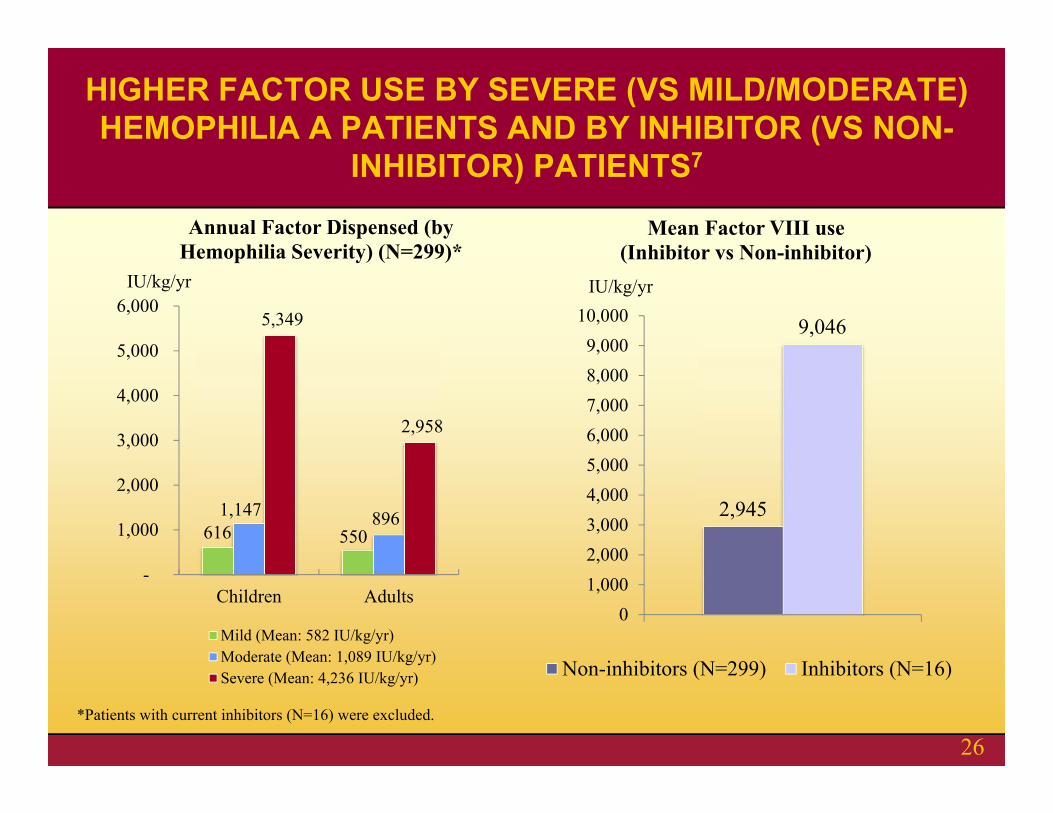
616 550 1,147 896
5,349
2,958
-
1,000
2,000
3,000
4,000
5,000
6,000
Children Adults
IU/kg/yr
Annual Factor Dispensed (by Hemophilia Severity) (N=299)*
Mild (Mean: 582 IU/kg/yr)Moderate (Mean: 1,089 IU/kg/yr)Severe (Mean: 4,236 IU/kg/yr)
2,945
9,046
01,0002,0003,0004,0005,0006,0007,0008,0009,000
10,000
Mean Factor VIII use (Inhibitor vs Non-inhibitor)
Non-inhibitors (N=299) Inhibitors (N=16)
IU/kg/yr
*Patients with current inhibitors (N=16) were excluded.
HIGHER FACTOR USE BY SEVERE (VS MILD/MODERATE) HEMOPHILIA A PATIENTS AND BY INHIBITOR (VS NON-
INHIBITOR) PATIENTS7
26
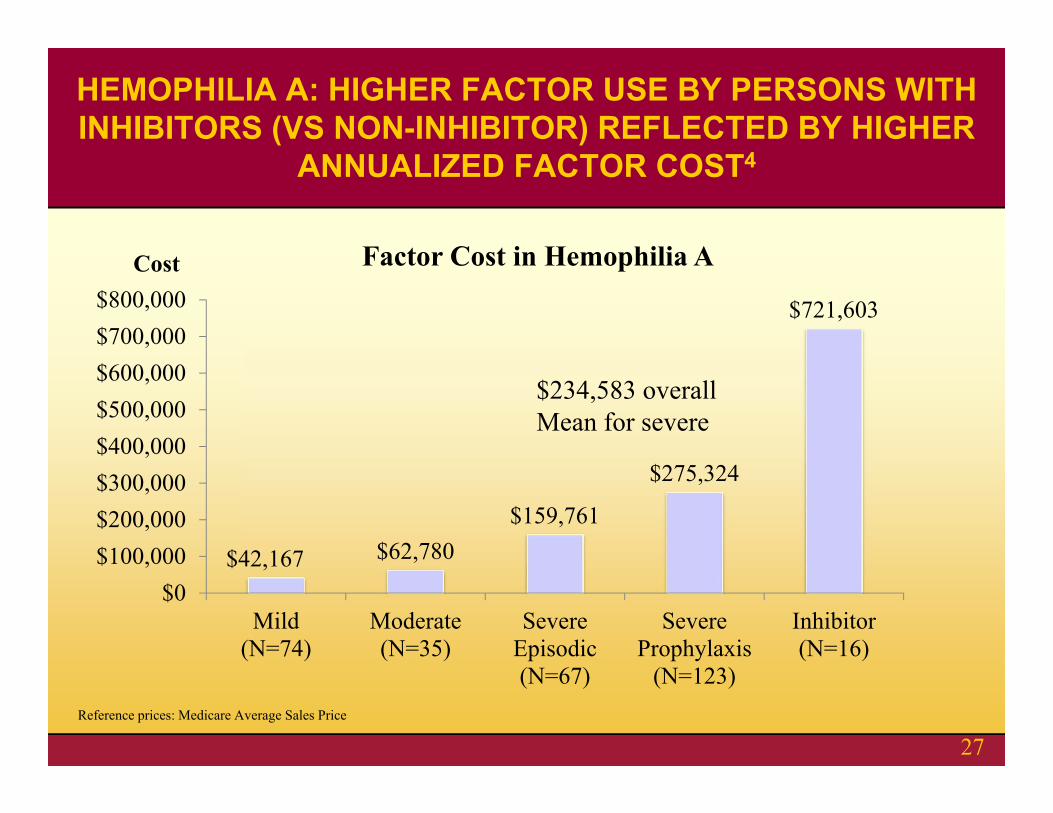
$42,167 $62,780$159,761
$275,324
$721,603
$0$100,000$200,000$300,000$400,000$500,000$600,000$700,000$800,000
Mild(N=74)
Moderate(N=35)
SevereEpisodic(N=67)
SevereProphylaxis
(N=123)
Inhibitor(N=16)
Cost Factor Cost in Hemophilia A
Reference prices: Medicare Average Sales Price
HEMOPHILIA A: HIGHER FACTOR USE BY PERSONS WITH INHIBITORS (VS NON-INHIBITOR) REFLECTED BY HIGHER
ANNUALIZED FACTOR COST4
27
$234,583 overall Mean for severe
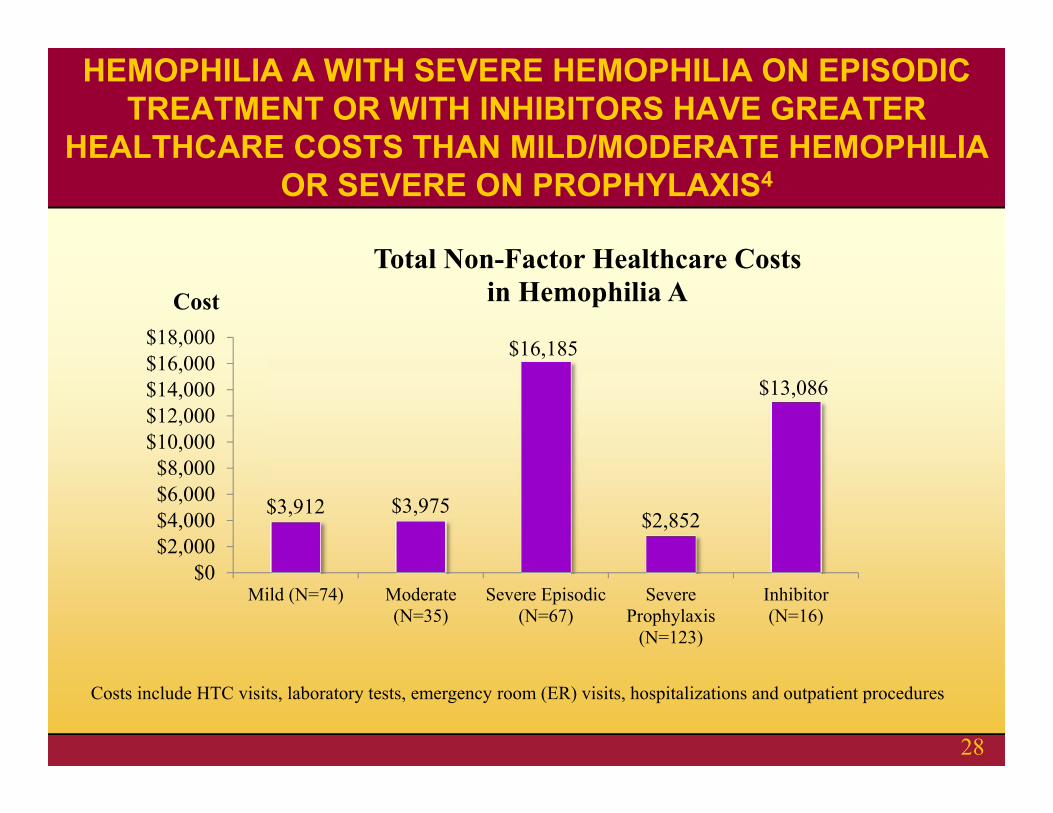
$3,912 $3,975
$16,185
$2,852
$13,086
$0$2,000$4,000$6,000$8,000
$10,000$12,000$14,000$16,000$18,000
Mild (N=74) Moderate(N=35)
Severe Episodic(N=67)
SevereProphylaxis
(N=123)
Inhibitor(N=16)
Cost
Total Non-Factor Healthcare Costs in Hemophilia A
Costs include HTC visits, laboratory tests, emergency room (ER) visits, hospitalizations and outpatient procedures
HEMOPHILIA A WITH SEVERE HEMOPHILIA ON EPISODIC TREATMENT OR WITH INHIBITORS HAVE GREATER
HEALTHCARE COSTS THAN MILD/MODERATE HEMOPHILIA OR SEVERE ON PROPHYLAXIS4
28
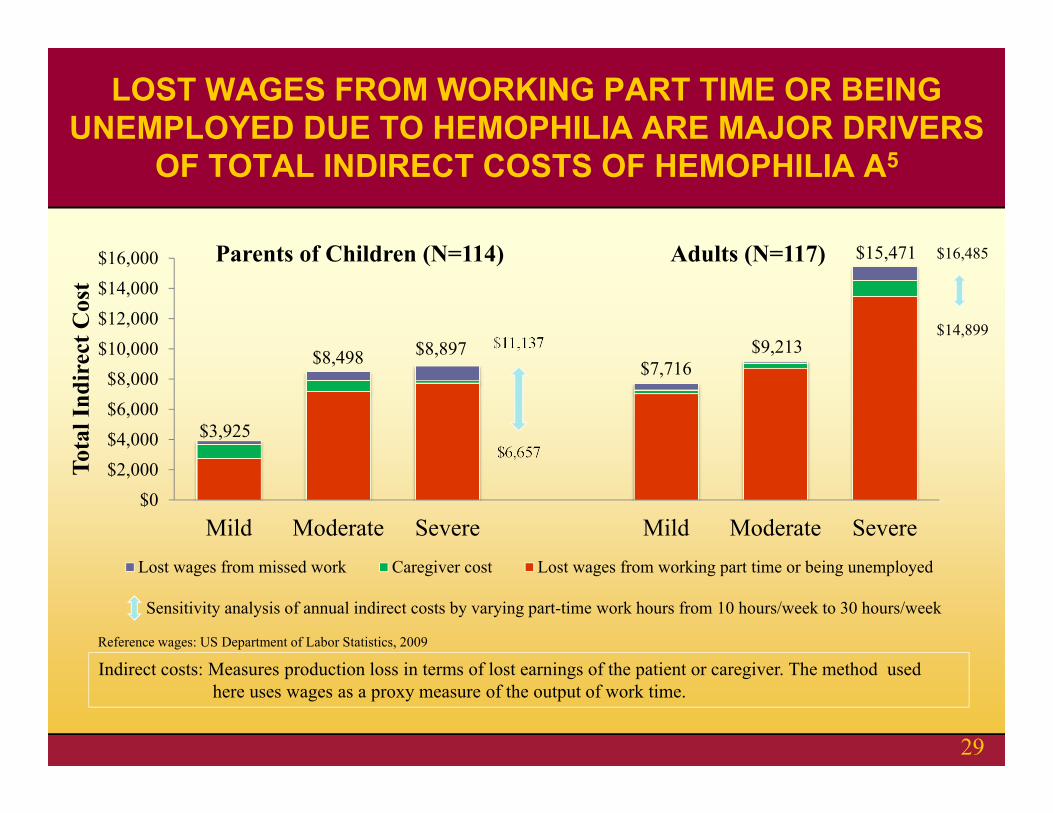
$16,485
$14,899$11,137
$6,657$3,925
$8,498 $8,897$7,716
$9,213
$15,471
$0$2,000$4,000$6,000$8,000
$10,000$12,000$14,000$16,000
Mild Moderate Severe Mild Moderate Severe
Tota
l Ind
irec
t Cos
t
Lost wages from missed work Caregiver cost Lost wages from working part time or being unemployed
Parents of Children (N=114) Adults (N=117)
Sensitivity analysis of annual indirect costs by varying part-time work hours from 10 hours/week to 30 hours/week
Reference wages: US Department of Labor Statistics, 2009
Indirect costs: Measures production loss in terms of lost earnings of the patient or caregiver. The method used here uses wages as a proxy measure of the output of work time.
LOST WAGES FROM WORKING PART TIME OR BEING UNEMPLOYED DUE TO HEMOPHILIA ARE MAJOR DRIVERS
OF TOTAL INDIRECT COSTS OF HEMOPHILIA A5
29

$42,167 $62,780 $159,761$275,324
$721,603
$3,912 $3,975$16,185
$2,852
$13,086
$0
$100,000
$200,000
$300,000
$400,000
$500,000
$600,000
$700,000
$800,000
Mild(N=74)
Moderate(N=35)
SevereEpisodic(N=67)
SevereProphylaxis
(N=123)
Inhibitor(N=16)
Cos
t
Factor cost Non-factor Healthcare cost
TOTAL HEALTHCARE COSTS IN HEMOPHILIA A4
30
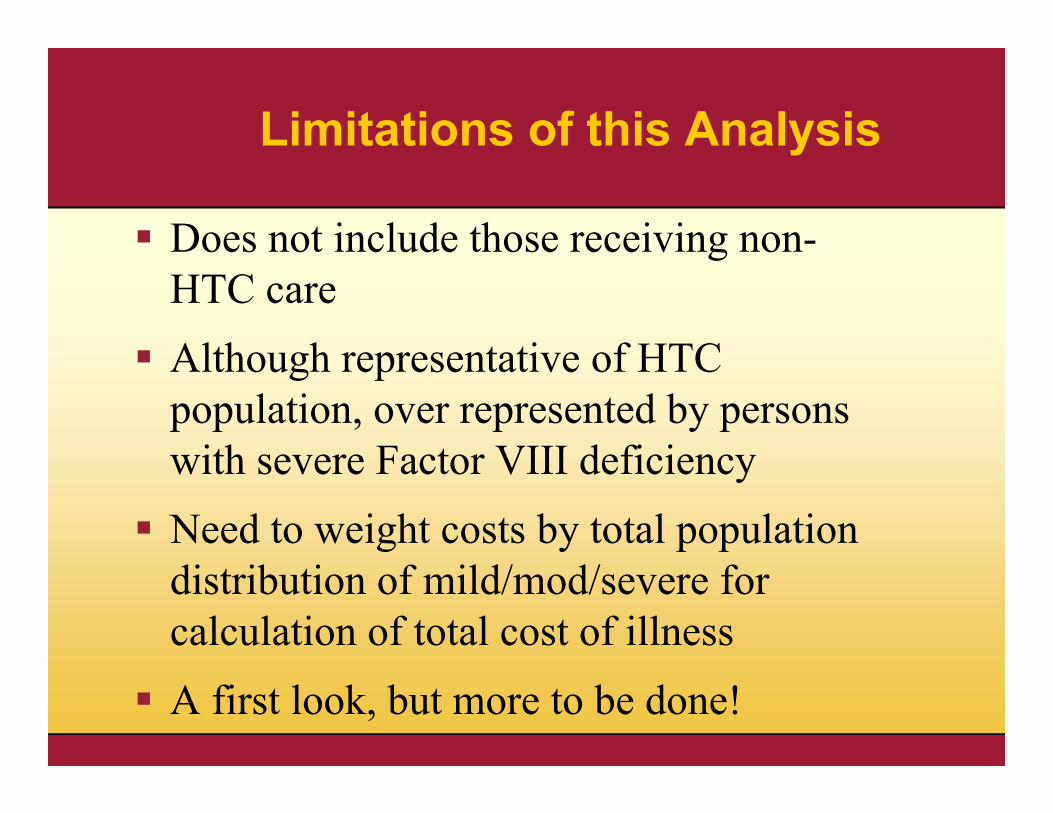
Does not include those receiving non-HTC care Although representative of HTC
population, over represented by persons with severe Factor VIII deficiency Need to weight costs by total population
distribution of mild/mod/severe for calculation of total cost of illness A first look, but more to be done!
Limitations of this Analysis
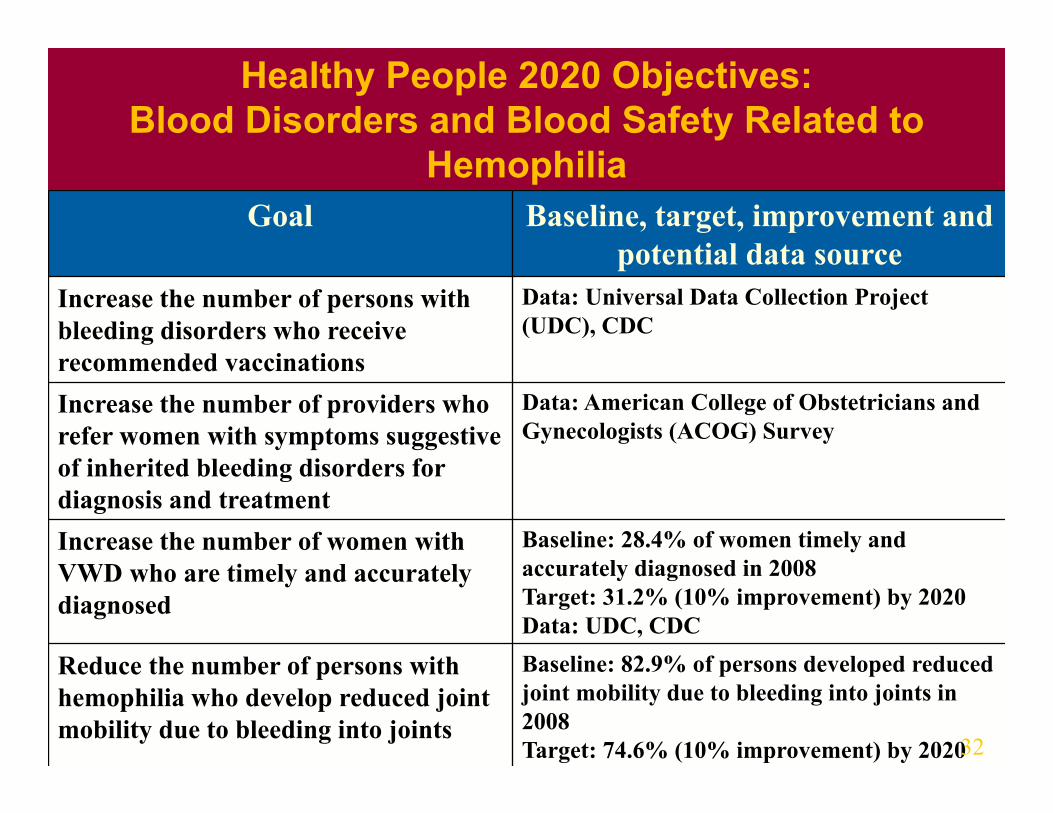
Goal Baseline, target, improvement and potential data source
Increase the number of persons with bleeding disorders who receive recommended vaccinations
Data: Universal Data Collection Project (UDC), CDC
Increase the number of providers who refer women with symptoms suggestive of inherited bleeding disorders for diagnosis and treatment
Data: American College of Obstetricians and Gynecologists (ACOG) Survey
Increase the number of women with VWD who are timely and accurately diagnosed
Baseline: 28.4% of women timely and accurately diagnosed in 2008Target: 31.2% (10% improvement) by 2020Data: UDC, CDC
Reduce the number of persons with hemophilia who develop reduced joint mobility due to bleeding into joints
Baseline: 82.9% of persons developed reduced joint mobility due to bleeding into joints in 2008Target: 74.6% (10% improvement) by 2020
Healthy People 2020 Objectives: Blood Disorders and Blood Safety Related to
Hemophilia
32
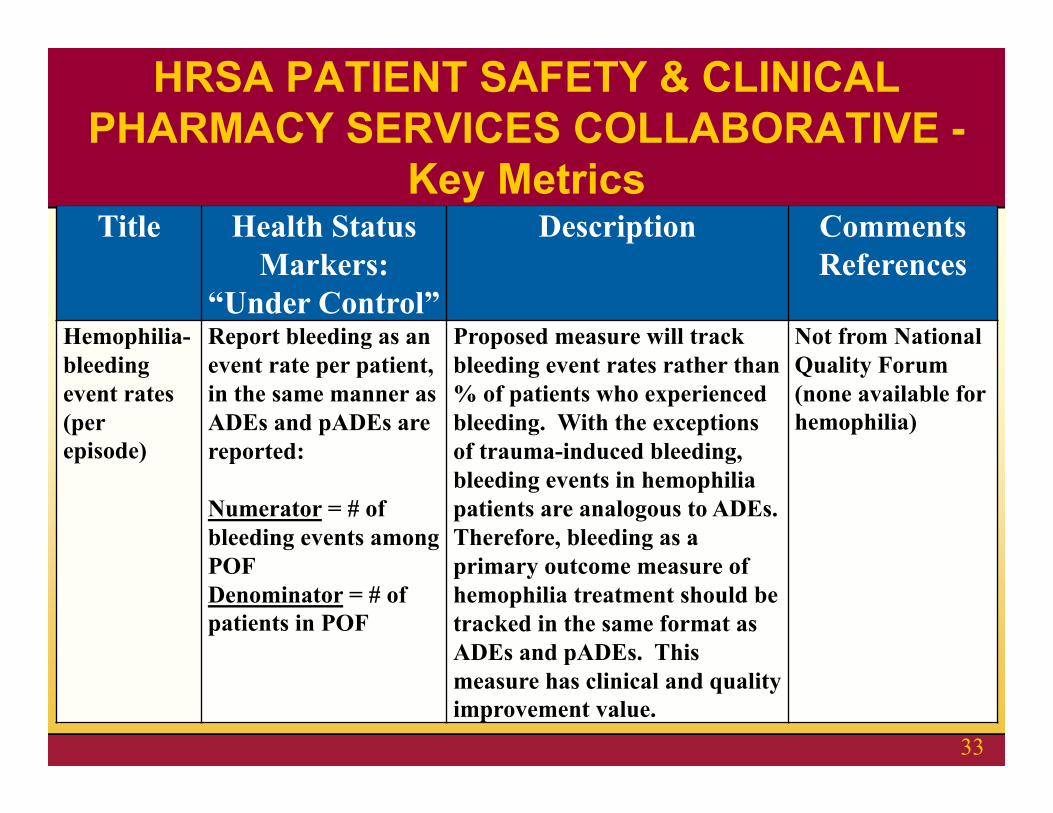
Title Health Status Markers:
“Under Control”
Description Comments References
Hemophilia-bleeding event rates (per episode)
Report bleeding as an event rate per patient, in the same manner as ADEs and pADEs are reported:
Numerator = # of bleeding events among POFDenominator = # of patients in POF
Proposed measure will track bleeding event rates rather than % of patients who experienced bleeding. With the exceptions of trauma-induced bleeding, bleeding events in hemophilia patients are analogous to ADEs. Therefore, bleeding as a primary outcome measure of hemophilia treatment should be tracked in the same format as ADEs and pADEs. This measure has clinical and quality improvement value.
Not from National Quality Forum (none available for hemophilia)
HRSA PATIENT SAFETY & CLINICAL PHARMACY SERVICES COLLABORATIVE -
Key Metrics
33
We thank our sponsors: CSL Behring, Baxter Healthcare Corporation, Bayer Foundation, Novo Nordisk for funding the HUGS Vaproject and Pfizer (formerly Wyeth) for funding the HUGS Va and Vb projects. Additional financial support was obtained from the Federal Hemophilia Treatment Centers/Region IX, Grifols, Red Chip, and CHOC at Home.
The Hemophilia Utilization Group Study Part-V: University of Southern California: Kathleen A. Johnson, PharmD, MPH, PhD (Principal Investigator), Mimi Lou, MS, Zheng-Yi
Zhou, MS, Jiat Ling Poon, Xiaoli Niu, Jason Doctor, PhD, Joanne Wu, MS, Michael Goode (Programmer); Children’s Hospital Los Angeles, Hemostasis and Thrombosis Center: Robert Miller (Site Principal Investigator), Jennifer
Hanley; Children's Hospital of Orange County, Hemophilia Treatment Center: Heather Huszti, PhD (Site Principal Investigator), Brandy
Fitzhenry, James Fabella; University of Colorado Denver: Brenda Riske, MS, MBA, MPA (Site Principal Investigator), Cassie Ross, Carissa Smith, Julie
Smith, Deirdre Cooper-Blacketer; Indiana Hemophilia & Thrombosis Center, Hemophilia Treatment Center: Amy Shapiro, MD (Site Principal Investigator),
Natalie Duncan, MPH, Melissa Meyer, Brandy Trawinski, Jayme Harvey; UMASS Memorial Hospital, New England Hemophilia Center: Ann D. Forsberg, MA, MPH (Site Principal Investigator), Patricia
Forand, RN; University of Texas at Houston, Gulf States Hemophilia and Thrombophilia Center: Megan M. Ullman, MA, MPH (Site
Principal Investigator); Akron Children’s Hospital Medical Center, Ohio: Erin Cockrell, DO (Site Principal Investigator), Dawn Ali, Janice Kakish; Michigan State University, Center for Bleeding and Clotting Disorders: Roshni Kulkarni, MD (Site Principal Investigator),
Cheryl Robins, Laura Carlson; Hemophilia Program, Puget Sound Blood Center, Washington: Barbara A. Konkle, MD (Site Principal Investigator), Michelleann
Bonoan, Sarah Ruuska, Sarah Galdzicka, Steve Grantham. (HUGS Vb recruitment commenced October 2011, no patients represented in this data)
The authors thank the HUGS Steering Committee: Randall G. Curtis, MBA, Shelby L. Dietrich, MD and Marion A. Koerper, MD, and Consultants Judith R. Baker, MHSA, Kathy Parish, PhD and Femida Gwadry-Sridhar, BSPhm, MS, PhD, Denise R. Globe, PhD.
ACKNOWLEDGEMENTS
34
Published papers:1. Zhou ZY, Wu J, Baker J, Curtis R, Forsberg A, Huszti H, Koerper M, Lou M, Miller M, Parish K, Riske B, Shapiro A, Ullman M,
Johnson K. Hemophilia Utilization Group Study - Part Va (HUGS Va): Design, Methods and Baseline Data. Haemophilia. 2011 Sep 17(5):729-736
2. Zhou ZY, Riske B, Forsberg A, Ullman M, Baker J, Koerper M, Curtis R, Lou M, Wu J, Johnson K. Self-reported Barriers to Hemophilia Care in Persons with Factor VIII Deficiency. American Journal of Preventive Medicine. 2011 Dec
Posters:3. Zhou ZY, Ullman M, Koerper M, Globe D, Baker J, Miller B, Riske B, Smith C, Forsberg A, Wu J, Curtis R, Shapiro A, Johnson K.
Health Insurance Coverage for Adults and Children with Hemophilia - Hemophilia Utilization Group Study (HUGS-Va). NHF’s 60th Annual Meeting, Denver, Colorado. 2008 Nov.
4. Zhou ZY, Johnson K, Koerper M, Wu J, Curtis R, Riske B, Forsberg A, Ullman M, Lou M, Parish K. Association of Self-reported Joint Pain and Motion Limitation with Clinical Range of Motion Assessment in Patients with Hemophilia A. Hemophilia 2010 World Congress, Buenos Aires, Argentina. 2010 July
5. Zhou ZY, Baker J, Riske B, Ullman M, Forsberg A, Gwadry-Sridhar F, Koerper M, Johnson K. Bleeding Episodes and Indirect Costs among Patients with Hemophilia A - the Hemophilia Utilization Group Study Part Va (HUGS Va). NHF’s 62nd Annual Meeting, New Orleans, Louisiana. 2010 Nov.
6. Zhou ZY, Ullman M, Riske B, Forsberg A, Shapiro A, Koerper M, Johnson K. Health Care Utilization in Patients with HemophiliaA - First Year Data of HUGS-Va. 1st National Conference on Blood Disorders in Public Health, Atlanta, Georgia. 2010 Mar.
7. Zhou ZY, Johnson K, Riske B, Ullman M, Judith Baker, Koerper M, Forsberg A, Miller B, Shapiro A, Huszti H. Health Care Utilization and Cost in Persons with Factor VIII Deficiency: Results of the HUGS Va Study. Hemophilia 2010 World Congress, Buenos Aires, Argentina. 2010 July
8. Zhou ZY, Ullman M, Koerper M, Baker J, Smith C, Poon JL, Lou M, Johnson K. Characterizing Direct Costs Associated with Hemophilia a: a Resource-Based Cost Analysis. ISPOR 16th Annual International Meeting, Baltimore, Maryland. 2011 May.
REFERENCES
35