Embed Size (px)
Citation preview
Hemophilia Disease Management in Florida
Final report to
Florida Agency for Health Care Administration
Prepared and Submitted
by
Abraham G. Hartzema PharmD, MSPH, PhD, FISPE
Richard Segal, PhD
Jinghua He, MSc, PhD candidate
Dawn Alayon, MPH, CPH
Department of Pharmaceutical Outcomes and Policy
College of Pharmacy, University of Florida
And
Heather Steingraber
Florida Center for Medicaid and the Uninsured
College of Public Health and Health Professions
Table of Contents Executive Summary ...................................................................................................................................... 4
Background ................................................................................................................................................... 5
Agency for Health Care Administration Disease Management Program................................................. 5
Epidemiology of Hemophilia .................................................................................................................... 5
Hemophilia Overview ........................................................................................................................... 5
Disease Progression and Outcomes ......................................................................................................... 6
Severity Levels of Hemophilia .................................................................................................................. 6
Treatment Options .................................................................................................................................... 6
Prophylactic Treatment......................................................................................................................... 6
On-Demand Treatment ......................................................................................................................... 8
Inhibitors ............................................................................................................................................... 8
Economic Factors in the Treatment of Hemophilia .................................................................................. 9
Costs and Economic Data ..................................................................................................................... 9
Patient Adherence to Treatment Plans .................................................................................................. 10
Interdisciplinary Provider Team............................................................................................................ 11
Comprehensive Hemophilia Disease Management Program in Florida ................................................ 11
Methods ...................................................................................................................................................... 11
Data Sources ........................................................................................................................................... 11
Analysis ................................................................................................................................................... 12
Descriptive Analysis ............................................................................................................................ 12
Evaluation of the Overall DMP .......................................................................................................... 13
Evaluation of the DMP Vendor ........................................................................................................... 13
Statistical Analysis Plan...................................................................................................................... 13
Findings ...................................................................................................................................................... 13
Part I. Descriptive Analysis .................................................................................................................... 13
Demographic Characteristics ............................................................................................................. 13
Health Care Resource Utilization ....................................................................................................... 17
Part II. Overall DMP Evaluation ........................................................................................................... 24
Demographics Characteristics ........................................................................................................... 24
Health Care Resource Utilization ....................................................................................................... 25
Health Care Expenditures ................................................................................................................... 28
Part III. Between-Vendor Comparison ................................................................................................... 30
Demographic Characteristics ............................................................................................................. 30
Health Care Resource Utilization ....................................................................................................... 32
Health Care Expenditures ................................................................................................................... 35
Discussion .................................................................................................................................................. 39
Results ..................................................................................................................................................... 39
Conclusion .................................................................................................................................................. 40
References ................................................................................................................................................... 41
Appendices ..................................................................................................................................................... i
Appendix A ................................................................................................................................................. i
ICD-9-CM diagnosis codes used for outcomes and baseline characteristics identification. ................ i
Appendix B ................................................................................................................................................ ii
NDC Codes Used For Factor Product Identification ........................................................................... ii
Appendix C ............................................................................................................................................... iv
Coding Algorithms for Health Care Resource Utilization and Cost Identification ............................. iv
Appendix D............................................................................................................................................... vi
Appendix E .............................................................................................................................................. vii
Cost per category without outlier exclusion (bucket code) ($) ........................................................... vii
Appendix F ............................................................................................................................................. viii
4
Executive Summary
A contract between the Agency for Health Care Administration and two Hemophilia
Vendors was executed on January 1, 2008. Due to contract implementation, fiscal agent activities,
and recipient choice periods, the program became fully operational on June 1, 2008. Florida
Medicaid started the two-year Comprehensive Hemophilia Disease Management Program (DMP)
which is mandatory for all Florida Medicaid non-HMO recipients with at least one pharmacy
record for factor products. Participants in the DMP chose either Caremark or CuraScript as their
service provider for comprehensive care, including disease management services, patient
education, and specialty pharmaceutical care for factor products. This study is an evaluation of
the first year of the DMP implementation. The observation period was one year prior to DMP
implementation (June 1, 2007 – May 31, 2008) and the first year of the DMP (June 1, 2008 –
May 31, 2009). The objectives of the program evaluation are to (1) describe the DMP population;
(2) evaluate the impact of the DMP on health care resource utilization and expenditures; and (3)
compare and contrast the two DMP vendors.
A total of 288 Florida Medicaid non-HMO recipients were identified as having
hemophilia or von Willebrand disease (vWD). Of the 288 members, 281 recipients were
receiving factor products through Medicaid during the pre-DMP period (2,880 member-months).
During the DMP period, there were 241 participants (2,126 member-months). The population
included mainly young men with varying racial/ethnic backgrounds, and few were identified
with HIV/AIDS or Hepatitis infections. Most were diagnosed with Hemophilia A or B, followed
by vWD and Factor X. This population was costly to Florida Medicaid: the average monthly
total cost was $18,316 PMPM, ranging from $3 PMPM to $335,030 PMPM. Hemophilia-related
costs accounted for 94.0% of the total cost, and the factor product cost accounted for 92.9% of
the total cost.
The DMP program was evaluated among 117 hemophilia participants with continuous
Florida Medicaid enrollment over the two-year observation period. The number of hemophilia-
related emergency and hematologist visits increased during the DMP period, while the number of
home health services and orthopedic surgeon visits decreased. These changes had little influence
on the total health care expenditure. After excluding outliers, the amount of dispensed factor
products increased approximately six percent during the DMP period compared to the pre-DMP
period. This result may be due to the increased body weight of this young population as they
mature and Medical and Scientific Advisory Council (MASAC) guidelines issued that promote
increased use of prophylactic dosing; however, the associated expenditures remained nearly
unchanged, presumably due to the discounted contract price. Mainly influenced by the factor
product cost, the total health care expenditure of the DMP period remained nearly the same as
compared to the pre-DMP period. The two vendors were also compared. The results showed no
difference in utilization or expenditures.
Overall, the comprehensive disease management program appears to have little impact on
health care resource utilization except for reducing home health service. The expenditure of
factor products is the major cost driver for the Florida Medicaid hemophilia recipients. The
discounted factor product price appears to offset the cost associated with the increased factor
product use.
5
Background
Agency for Health Care Administration Disease Management Program
The Florida Agency for Health Care Administration (AHCA) implements and manages
the Florida Medicaid Program. Florida Medicaid is a state and federal partnership that provides
health coverage for selected categories of people with low incomes and disabilities. Since 1970,
its purpose is to improve the health of people who might otherwise go without medical care for
themselves and their children. (AHCA, 2009)
In 1998, Florida legislature passed the Medicaid Disease Management Initiative. This
initiative offers systematic approaches for managing the health care needs of recipients who are
at risk of or diagnosed with a specific disease, using various methods – such as best practices,
prevention strategies, and outcomes research – to reduce overall costs and improve measurable
outcomes. This study focuses on the Comprehensive Hemophilia Disease Management Program
(DMP). In 1997, the Medicaid Reform Task Force found that approximately 10% of all Medicaid
recipients accounted for more than 60% of program expenditures. They found that the average
annual cost for a MediPass recipient with hemophilia exceeded $75,000. (Note: MediPass is the
care case management program for Medicaid recipients.) (AHCA, 2009) Key components of the
DMP are (AHCA, 2000):
clinical practice guidelines;
provider and recipient profiling;
specialized (disease-specific) physician and other practitioner care;
intensive care management;
provider education;
recipient education;
claims analyses;
quarterly and yearly outcome measurement and reporting.
Medicaid identifies eligible recipients for disease management which include all
Medicaid eligible recipients who have been prescribed factor replacement products and are
enrolled in MediPass , a Minority Physician Network, a Provider Service Network, or Fee-For-
Service. Eligible recipients are notified by Medicaid for participation in the program. Eligible
recipients must choose one of the two contracted hemophilia disease management providers, but
may change between the two providers at any time. Approximately 200 recipients receive
services each month from the Hemophilia DMPs. (AHCA, 2009)
Epidemiology of Hemophilia
Hemophilia Overview
Hemophilia is a rare X- linked hereditary bleeding disorder, primarily occurring in males.
It has two main types: Hemophilia A (Factor VIII Deficiency) and Hemophilia B, also known as
the Christmas Disease (Factor IX Deficiency), both of which can be classified as severe,
6
moderate and mild depending on the coagulation factor activity level. Hemophilia A is more
prevalent than Hemophilia B. As a result, there are more studies on the treatment of the former.
The incidence of hemophilia is about 1 in 5,000 live male births in the United States. All races
and economic groups are affected equally. The national population of people living with
hemophilia in the United States has been estimated to be 18,000, and 400 children are born each
year with the disease (Blankenship, 2008).
Disease Progression and Outcomes
Hemophilia has a significant negative impact on patient health. Its complications include
excessive bleeding, joint disease, severe pain due to bleeding into joints, and risk of infectious
diseases transmitted through blood products. If left untreated, health consequences include nerve
damage, loss of musculoskeletal function and death (Shapiro, 2007). Children may experience
internal bleeding into the joints, muscles and soft tissues as well as nose and mouth bleeds (The
Haemophilia Society, 2008). von Willebrand's Disease (vWD) is related to hemophilia (Miners
et al, 2009) and mimics Hemophilia A. This is an autosomal inherited disorder in which there is
deficiency or dysfunction of von Willebrand factor (vWF). (Treatment of Hemophilia, 2008).
Historically, people with hemophilia did not survive past their third decade. Currently, advanced
medical care, particularly the introduction of factor replacement therapy, has significantly
prolonged life expectancy of people with hemophilia (Soucie et al, 1998).
Severity Levels of Hemophilia
The three categories for hemophilia severity are based on clotting levels: severe,
moderate and mild. The severe form is defined as frequent spontaneous bleedings predominantly
associated with the joints and muscles (World Federation, 2005). Specifically, for people with
severe hemophilia there is a greater chance of internal bleeding into the joints, muscles and soft
tissues (The Haemophilia Society, 2008), which is associated with high expenditures for
managing these patients. The moderate form involves occasional spontaneous bleeding although
severe bleeding may occur from surgery or trauma; while the mild form can also be associated
with severe bleeding from surgery or trauma, but does not incur the other problems noted with
severe disease due to better clotting factors. As a result, patients with moderate and mild disease
may not be diagnosed until later in life (The Haemophilia Society, 2008). (Note: For the
Hemophilia DMP, clotting levels are not used to set severity; severity is associated with frequent
bleeding).
Treatment Options
Prophylactic Treatment
In 1952, Professor Nillson in Sweden was one of the first to introduce prophylactic
treatments to hemophilia patients (Fischer et al, 2002). Prophylactic treatments are preventive,
while on-demand or episodic treatments are administered when bleeding occurs or bruises are
7
observed (Berntorp, 2009). Prophylactic treatments appear helpful in preventing joint bleeding
and hemophiliac arthropathy. These treatments are mostly administered to those with severe
cases of hemophilia to maintain factor levels in the blood and to decrease the incidence of
spontaneous bleeding. Mild and moderate hemophilia patient’s factor levels are not as critical as
severe cases and usually only require on-demand treatments. Prophylactic treatments assist in
maintaining factor levels in the blood (Kern et al, 2004), and they have been shown to reduce
bleeds and prevent severe joint damage. As a result, timing of prophylactic treatment is critical;
however, no age has been specified as the gold standard of care for initiating therapy. Berntorp
(2009) followed-up with a group of boys with severe hemophilia and found that those who
started prophylactic treatment between the ages of one and two developed normal joints and led
normal lives. Other studies agree that treatment initiation should be at a young age based on
diagnosis (Fischer et al (2002a), Berntrop (2009), Kern et al (2004)). Prophylactic dosages are
based on weight. Berntorp et al (2009) recommends for Hemophilia A, 25-40 IU of factor VIII
per kg body weight and administered three times weekly, and for Hemophilia B, 25-40 IU of
factor IX two times weekly.
Prophylactic treatment is strongly encouraged for severe hemophilia patients by the U.S.
National Hemophilia Foundation Medical and Scientific Advisory Committee and the World
Health Organization (Fischer et al, 2002b). The World Federation of Hemophilia (WFH) created
a comprehensive guide based on published consensus guidelines which encourages the
prevention of bleeding and the use of prophylactic treatment. Moderate cases for hemophilia may
require prophylactic treatment based on the level of factor present in the blood (WFH, 2005).
Mild and moderate cases of hemophilia do not necessarily need prophylactic treatment according
to these organizations. For those cases, desmopression (DDVAP) is administered when a
bleeding event occurs (on-demand therapy) (NHLBI); this is a hormone that releases the stored
factor already present in the blood stream. DDAVP is provided to those who have five percent or
greater FVIII and are responsive to pre-tests (WFH, 2005). Further, general consensus among
studies indicates that prophylactic treatments are effective in ameliorating the effects of
hemophilia. Manco-Johnson conducted a multi-center, randomized study, observing the effects
of prophylactic treatment versus on-demand care. The study followed boys with Hemophilia A
from the ages of less than 30 months to six years of age, comparing prophylactic and on-demand
treatment. The study found boys treated with prophylactic treated experienced less joint and total
hemorrhages as compared to the on-demand group.
Fischer et al (2002) analyzed data from two retrospective studies involving patients with
severe disease: on-demand treatment in France and prophylactic treatment in the Netherlands.
The findings demonstrated that those with prophylaxis had better health outcomes such as fewer
incidents of joint bleeds per year, arthropathy and history of orthopedic surgery. The on-demand
group has a greater number of incidents of bodily pain and limited physical functioning and
social functioning.
Despite the advances in prophylactic treatments, the majority of severe hemophilia
patients do not take advantage of this therapy. In 1995, only 33% of all children with hemophilia
in the United States received prophylactic treatments (Manco-Johnson, 2007). In 2004, 51.5%
children under six years old with severe hemophilia received prophylaxis (Manco-Johnson,
2007).
Prophylaxis has been shown to decrease the likelihood of the development of inhibitors
in patients compared to patients treated with on-demand treatment (Petrini, 2007); regardless of
8
whether plasma-derived or recombinant derived factors are used (Goew et al, 2007). An inhibitor
is a type of antibody which attempts to destroy substances, such as following treatment to
replenish factor XIII or IX, they do not recognize. The antibody attaches to the factor VIII or IX
and inhibits its ability to stop bleeding (WHF, 2009).
Now, that so many children with hemophilia have become adults, one argument is to
whether or not to continue prophylactic treatment into adulthood in terms of effectiveness. For
adults, the prophylactic interventions are secondary rather than primary treatments; the results
are better with children from ages 9 to 12 (Tagliaferri et al, 2008). Finally, regardless of whether
a patient is treated with prophylactic treatment, occasionally on-demand treatments are necessary
for emergent bleeds.
On-Demand Treatment
Currently, there is more literature on the efficacy of prophylactic treatments than on-
demand treatments alone for severe hemophilia patients. This form of treatment is commonly
given when the clotting factor concentrate is administered before surgical procedures, after an
injury, or once a bleed has started (Haemophilia Society, 2008), or when a bruise is observed,
and for mild or moderate cases (NHLBI). On-demand is an acute form of therapy, managing,
rather than preventing Hemophilia associated health problems. Among its disadvantages is that
one waits until the patient experiences a bleeding event before administering the treatment. Thus
patients may have repeated bleeding, which could lead to orthopedic problems such as muscular
atrophy and hemophilic arthropathy. (Miners et al, 2009). In the Manco-Johnson study, the on-
demand, episodic care group developed life-threatening hemorrhages, including intracranial and
gastrointestinal; the prophylactic treated patients did not experience those adverse events. Other,
common health problems associated with on-demand treatment are central nervous system
(CNS) hemorrhages (Hoots WK, 2007).
Inhibitors
A major consequence of prophylactic treatment is the development of inhibitors, which is
common among Hemophilia A patients (20-30% of severe cases), and occurs in Hemophilia B at
five percent or less (Tjønnfjord et al, 2007; The Hemophilia Society, 2008). Antibodies are
created against the factor treatment, and may render this form of treatment ineffective. Inhibitors
manifest early, approximately within 10 to 20 days of exposure. Causes for inhibitors
development include gene mutations, ethnicity, and family history (Abshire, 2007).
Upon developing higher inhibitor levels, therapy changes may be made to either provide
higher doses of a given product or use of a more expensive activated clotting factor. When high
inhibitor levels occur, alternative therapies are available, including NovoSeven, FEIBA, and
immune tolerance induction (ITI). NovoSeven, recombinant factor VIIa (rfVIIa), is a genetically
engineered clotting factor that was introduced in the early 1990s (The Haemophilia Society,
2008; Tjønnfjord et al, 2007). FEIBA is a factor eight inhibitor bypassing agent, plasma-derived
treatment. Currently, bloodborne pathogens have not been reported with FEIBA (Tjønnfjord et
al, 2007). Both of these treatments have been shown to be effective in preventing bleeds but not
as effective as non-inhibitor treatments (Tjønnfjord et al, 2007). Immune tolerance induction
(ITI), or immune tolerance therapy (ITT) (The Haemophilia Society, 2008), is an alternative
treatment option to rid inhibitors. For those with FIX inhibitors, ITI is difficult to implement
9
(Mannucci, 2008). This therapy would last for long periods of time, ranging from 9 to 24 months
with an 80% success rate (Hemophilia Society, 2008). Generations of recombinant factor
therapies have evolved. One of the newer treatment options is recombinant plasma/albubin-free
FVIII concentrate (rAHF-PFM, Advate). Advate was developed from Chinese hamster ovaries
(CHO), thus there may be a risk of inducing antigenicity from non-human (trans-species)
sourced products develop inhibitors (Shapiro, 2007).
Economic Factors in the Treatment of Hemophilia1
Hemophilia has become a costly chronic disease because of the life-time dependence on
expensive factor products and extra demands for health care resources. It has been reported that
the total annual cost of hemophilia care in 1998 was $30,820 for those patients receiving on-
demand treatment and $87,865 for patients receiving prophylactic treatment (Globe et al, 2004).
The factor prices have not decreased over time. In 2004, the reported median cost for factor
prophylactic inhibitor treatments was $55,853/year and non-inhibitor treatments $2,760 per year
less (Bohn et al, 2004). Please note that there is no comparison price for prophylactic treatment
reported. This study consisted of twelve patients with inhibitors to FVII to FIX (cases) identified
in the hemophilia surveillance system (HSS) at two centers were matched on age, severity of
hemophilia descriptive matched analysis was conducted to examine the annual differences in
cost of product used and hospitalizations. Thus, factor product utilization is the major cost driver,
accounting for approximately 45 to 93% of the total health care costs in the treatment of people
with hemophilia. Further, the total health care cost of people with hemophilia is influenced by
disease severity, inhibitor history, HIV and Hepatitis viral infection, and route of factor product
administration (intravenous infusion vs. through a port) (Globe et al, 2003).
Costs and Economic Data
All hemophilia treatments are costly and represent a significant financial burden for the
payers. Different countries have conducted cost analyses to explore the relative total costs of
treating patients with prophylactic versus on-demand therapy. Though prophylactic treatment is
more costly in terms of drug costs, the overall health of the people with hemophilia appears to be
better compared to patients given on-demand treatment, and thus may reduce long-term health
care costs.
In the United Kingdom, Miners et al. (2009) conducted a cost effectiveness study for
prophylactic treatment compared to on-demand treatment for severe Hemophilia A. The analysis
showed a mean expected life-time cost of £644,000 ($1,037,677.19 USD) for on-demand
treatment and £858,000 ($1,382,495.39) for prophylactic therapy, respectively. Quality of
Adjusted Life Years (QALY) was reviewed as well, which showed that on-demand therapy was
13.95 QALY, whereas for prophylactic therapy was 19.58, thus a 5.63 QALY increase.
In Canada, a cost study was conducted involving Canadian boys with severe Hemophilia
A for a year prior to, and a year after target joint bleeding (Kerns et al, 2004). Target joint
bleeding may lead to chronic deformities, leading to severe pain along the joint. Specifically, the
1 Unable to find studies about the Medicaid hemophilia population.
10
study focused on the pre- and post-target joint (TJ) to review costs incurred by the patient once
TJ occurs when administered prophylactic treatment. The study defined TJ as three bleeds into
any single joint within a consecutive three-month period. The enrolled population had an average
age of 54 months (range, 15–94 months), with ankles being most often affected, followed by
elbows and knees (46% vs. 28% and 23%, respectively). Each of the boys in the study developed
TJ bleeding, as defined by the study protocol, which then increased cost of care. The time period
was one year before and after treatment. The pre-TJ mean overall cost, included the infusion
costs, clinic visits, diagnostic tests/blood work, per boy was $20,091 Canadian Dollar vs.
$42,612 (CND) vs. the post-TJ, the mean cost was $43,891. Factor VIII use accounted for 87%
of the total cost the year before development of a target joint and 93% the year after the target
joint was affected. The factor cost was $18,381 pre-treatment vs. $38,538 post-treatment.
In the United States, a cost utilization study was performed for 336 Hemophilia A
patients, recruited from five comprehensive Hemophilia treatment centers during 1995. Nearly
half of the study sample was covered by Medicaid, while the others had commercial insurance.
(Globe et al, 2004). The study took into account the different cost components of care (e.g.
physician visits, factor VIII concentrate, emergency room, hospitalization), and found the total
annual cost of care was $139,102, with a mean cost of factor VIII of $130,438 for the entire
study sample, in 1995. The same study also found annual on-demand costs to be $69,656 for
severe and $18,890 per patient for mild and moderate hemophilia.
In another U.S. study, Manco-Johnson performed a randomized, clinical, multi-center
trial to discover an effective way to prevent arthropathy in people with severe hemophilia in the
United States (Manco-Johnson et al, 2007). During the course of this trial, Manco-Johnson found
that at a price of $1 per unit of recombinant factor VIII, the cost of prophylaxis for a child
weighing 50 kg (110 pounds) could reach $300,000 per year.
Patient Adherence to Treatment Plans
The patient’s ability to follow prescribed plans is a contributing factor to the
effectiveness of the treatment. Bentrop et al conducted a study for the hemophilia population in
Sweden, based on data from randomized, controlled trials comparing prophylaxis with on-
demand treatment. For those who use prophylactic treatment, 90% of patients, ages of 12 and
under follow the treatment plans and the percentage drops considerably to 36% for ages 19 to 29
(Berntrop, 2009). Physicians’ decisions to prescribe the treatments are based on patient’s ability
to adhere. An option is to ensure patient adherence by tailoring the treatment to individual needs.
Additional suggestions include psychosocial training for people with hemophilia to become more
independent, and to engage in physical activity.
11
Interdisciplinary Provider Team
According to the World Federation of Hemophilia, successful treatment of patients with
hemophilia involves a team of health care professionals, not just physician contacts. It is
recommended by the World Federation of Hemophilia (WFH) that a comprehensive team would
include professionals well-versed in bleeding disorders such as hematologists, nurse
coordinators, physiotherapists and social workers. In the United States alone, there are 142
federally funded hemophilia treatment centers (HTC) (Linney, 2010). According to Linney, there
is a 40% higher mortality rate among those who do not seek treatment from HTCs for the study
period 1993-1995 as observed in records on 2,950 males reviewed in the study. Treatment plans
improve the life expectancy of Hemophilia patients and reduce costs.
Comprehensive Hemophilia Disease Management Program in Florida
A contract between the Agency for Health Care Administration and two Hemophilia
Vendors was executed on January 1, 2008. Due to contract implementation, fiscal agent activities,
and recipient choice periods, the program became fully operational on June 1, 2008. Florida
Medicaid started the two-year Comprehensive Hemophilia Disease Management Program (DMP)
which was mandatory for all Florida Medicaid non-HMO recipients with at least one pharmacy
record for a factor product within the 18 month period prior to identification of eligibility for the
program. Florida non-HMO Medicaid recipients with vWD were also eligible for enrollment in
the DMP. Florida Medicaid HMO recipients were excluded from the program, and dual eligible
recipients (Medicaid and Medicare) were enrolled voluntarily. Participants in the DMP chose
either Caremark or CuraScript as their service provider for comprehensive care, including
disease management services, care management, 24/7 toll-free access to a nurse/pharmacist
helpline, physician and recipient education, and dispensing/home delivery of factor products.
Florida Medicaid reimburses both providers at Average Wholesale Price minus 39% (AWP-39%)
for the factor products they dispense to DMP participants. The care management component of
the program is provided by the vendors at no cost to the state or recipients.
Methods
Data Sources
Two data sources were used in the data analysis: (1) participant records provided by the
DMP vendors; and (2) Florida Medicaid claims database. Vendor-provided participant records
were available for the DMP period which were used to identify disease type and disease severity.
The Florida Medicaid claims database provides comprehensive data including health care
resource utilization and associated costs during both the pre-DMP and DMP periods. The pre-
DMP period was defined as the one-year period immediately prior to the DMP program
implementation (June 1, 2007 to May 31, 2008). The DMP period was defined as the one-year
period that participants actually received DMP interventions following the completion of their
enrollment (June 1, 2008 to May 31, 2009). The demographic information was summarized for
12
age, gender, race, disease type and co-infections of HIV/AIDS or Hepatitis. Based on the
information available in the claims data, the following utilization and cost categories were
examined:
Total health care resource utilization and cost for the following categories:
hospital inpatient (hospital admission and length of hospitalization)
emergency room visit
outpatient visit
physician office service
home health service
pharmacy (number of prescription fillings regardless of type of medications)
other health care service (health care service that did not belong to any categories above,
such as dental, laboratory, physical therapy, etc).
Hemophilia-related health care resource utilization and cost for the following categories:
hospital inpatient (hospital admission and length of hospitalization)
emergency room visit
outpatient visit
physician office visit
home health service
factor product amount dispensed
See Appendix A for the ICD-9-CM codes for hemophilia claims and co-infections.
See Appendix B for NDC codes used for factor product identification (MOE or MOF classes).
See Appendix C for the detailed coding algorithms for each outcome of interest.
Analysis
Descriptive analyses were conducted to characterize the Florida Medicaid hemophilia
population with regard to the patterns and frequencies of health care events and expenditures.
Next, the overall DMP program was evaluated by using a pre-post study design. Finally, the, two
DMP vendors were compared against each other.
Descriptive Analysis
The primary descriptive analyses consisted of all recipients with hemophilia enrolled in
Florida Medicaid non-HMO program for at least one month between June 1, 2007 and May 31,
2009. The recipients with hemophilia were identified by AHCA according to pharmacy claims of
factor products (MOE or MOF classes). Findings from the claims data are presented for the two-
year study period, as well as the one-year pre-DMP period (June 1, 2007 to May 31, 2008) and
the one-year DMP period (June 1, 2008 to May 31, 2009). Since Florida Medicaid recipients
could drop in and out of the Medicaid program at any time during the observation period, the
findings for both utilization and costs were summarized on the basis of the annual total and per
member per month (PMPM), (i.e. 20,000 factor product units PMPM and $2,000 PMPM for
factor product costs). All cost values were adjusted to the Florida Medicaid fiscal year 2008-
2009, based on the Florida Medicaid specific inflation factors provided by AHCA.
13
Evaluation of the Overall DMP
A pre-post design was implemented to evaluate the DMP program. Each patient served as
his/her own control (self-controlled, case series design), which helped to adjust for factors that
did not change over time, such as disease severity and chronic co-morbid conditions. Another
advantage of this design is its capability to answer questions about changes over time for the
outcomes of interest.
Florida Medicaid non-HMO Hemophilia enrollees were included in this analysis only if
they had
Continuous Florida Medicaid non-HMO enrollment for at least 12 months immediately
prior to the DMP period (June 1, 2007 – May 31, 2008), and
Continuous Florida Medicaid non-HMO DMP enrollment for 12 months during the DMP
period (June 1, 2008 – May 31, 2009).
Evaluation of the DMP Vendor
A concurrent, non-equivalent comparison group design was used to compare the two
DMP vendors, Caremark and CuraScript. Florida Medicaid non-HMO Hemophilia participants
were included if they had
Continuous Florida Medicaid DMP enrollment for 12 months during the DMP period
(June 1, 2008 – May 31, 2009).
No vendor switching during the DMP period (June 1, 2008 – May 31, 2009).
Continuous Florida Medicaid non-HMO enrollment for one year immediately prior to the
DMP period (June 1, 2007 – May 31, 2008). The purpose of this criterion is to collect
baseline demographic and clinical characteristics.
Statistical Analysis Plan
See Appendix D for descriptions of the statistical testing procedures used for the DMP
evaluation.
Findings
Part I. Descriptive Analysis
This section describes all identified recipients with hemophilia who enrolled in the
Florida Medicaid non-HMO program for at least one month between June 1, 2007 and May 31,
2009 in terms of their demographic characteristics, health care resource utilization, and cost.
Demographic Characteristics
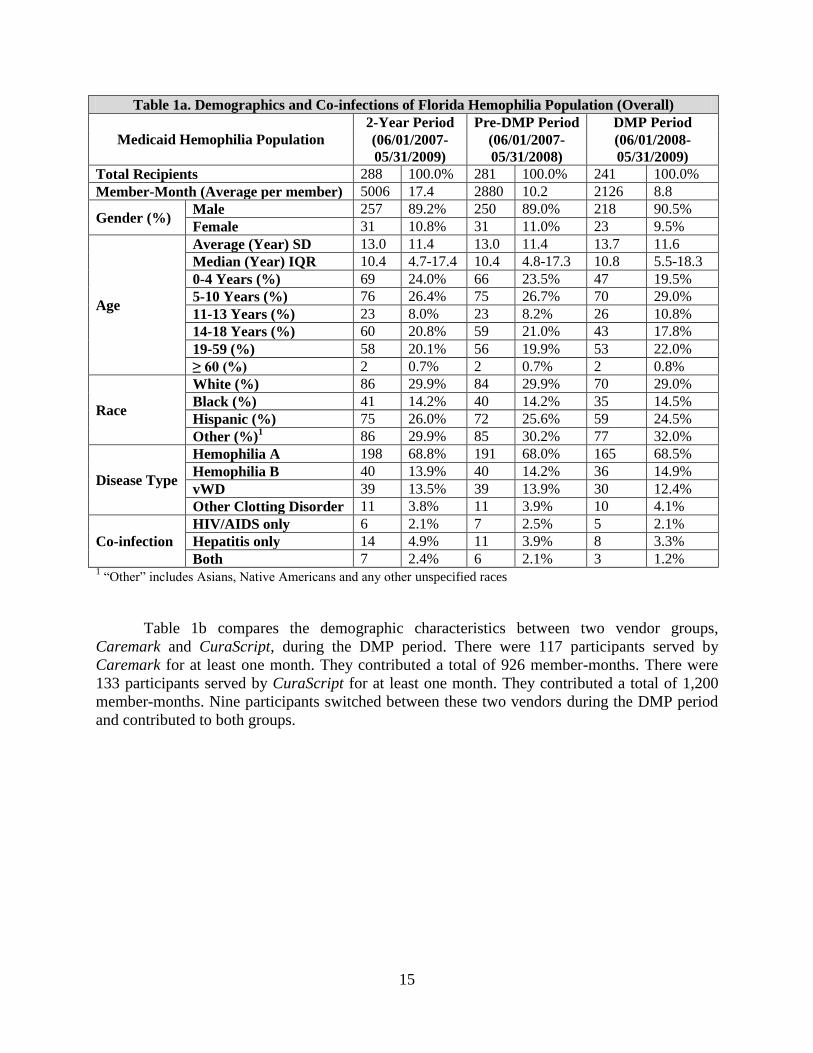
The demographic characteristics of the study population are summarized in Table 1a. A
total of 288 Florida Medicaid recipients were included in the descriptive analysis. These
individuals contributed a total of 5,006 member-months of observation during the two-year study
period. Analyses were also conducted for the pre-DMP and DMP periods, separately. Of the 288
recipients, 281 of these recipients received care during the pre-DMP period between June 1,
2007 and May 31, 2008, (2,880 member-months). These recipients would have participated in
14
the DMP had the program been available. Further, 241 recipients (2,126 member-months) of the
288 recipients were provided care during the DMP period. They were the actual DMP
participants.
Gender:
Most enrollees were male in the entire population. The proportion was similar for both
the pre-DMP (89.0%) and DMP period (90.5%).
Age:
The average age in the entire population was 13.0 years old (SD=11.4). The median age
was 10.4 years old (IQR=10.4). Approximately 80% recipients were 18 years old or
younger. The age distribution was similar for both the pre-DMP and DMP period.
Race:
In the entire population, Whites accounted for 29.9%, Blacks accounted for 14.2%,
Hispanics counted for 26.0%, and other races accounted for 29.9%. The race distributions
were similar for both the pre-DMP and DMP periods.
Disease Type:
Hemophilia A was the most prevalent disease type, accounting for 68.8% in the two year
period for the entire population. The prevalence rates of Hemophilia B and vWD were
13.9% and 13.5%, respectively. Only 3.8% recipients had other clotting disorders, such
as factor X deficiency. The disease type distributions were similar for both the pre-DMP
and DMP period.
Co-infections:
A small proportion of the recipients had infection history of HIV/AIDS (2.1%), Hepatitis
4.9%), or both (2.4%). The distributions were similar for both the pre-DMP and DMP
period.
15
Table 1a. Demographics and Co-infections of Florida Hemophilia Population (Overall)
Medicaid Hemophilia Population
2-Year Period Pre-DMP Period DMP Period
(06/01/2007-
05/31/2009)
(06/01/2007-
05/31/2008)
(06/01/2008-
05/31/2009)
Total Recipients 288 100.0% 281 100.0% 241 100.0%
Member-Month (Average per member) 5006 17.4 2880 10.2 2126 8.8
Gender (%) Male 257 89.2% 250 89.0% 218 90.5%
Female 31 10.8% 31 11.0% 23 9.5%
Age
Average (Year) SD 13.0 11.4 13.0 11.4 13.7 11.6
Median (Year) IQR 10.4 4.7-17.4 10.4 4.8-17.3 10.8 5.5-18.3
0-4 Years (%) 69 24.0% 66 23.5% 47 19.5%
5-10 Years (%) 76 26.4% 75 26.7% 70 29.0%
11-13 Years (%) 23 8.0% 23 8.2% 26 10.8%
14-18 Years (%) 60 20.8% 59 21.0% 43 17.8%
19-59 (%) 58 20.1% 56 19.9% 53 22.0%
≥ 60 (%) 2 0.7% 2 0.7% 2 0.8%
Race
White (%) 86 29.9% 84 29.9% 70 29.0%
Black (%) 41 14.2% 40 14.2% 35 14.5%
Hispanic (%) 75 26.0% 72 25.6% 59 24.5%
Other (%)1 86 29.9% 85 30.2% 77 32.0%
Disease Type
Hemophilia A 198 68.8% 191 68.0% 165 68.5%
Hemophilia B 40 13.9% 40 14.2% 36 14.9%
vWD 39 13.5% 39 13.9% 30 12.4%
Other Clotting Disorder 11 3.8% 11 3.9% 10 4.1%
Co-infection
HIV/AIDS only 6 2.1% 7 2.5% 5 2.1%
Hepatitis only 14 4.9% 11 3.9% 8 3.3%
Both 7 2.4% 6 2.1% 3 1.2% 1 “Other” includes Asians, Native Americans and any other unspecified races
Table 1b compares the demographic characteristics between two vendor groups,
Caremark and CuraScript, during the DMP period. There were 117 participants served by
Caremark for at least one month. They contributed a total of 926 member-months. There were
133 participants served by CuraScript for at least one month. They contributed a total of 1,200
member-months. Nine participants switched between these two vendors during the DMP period
and contributed to both groups.
16
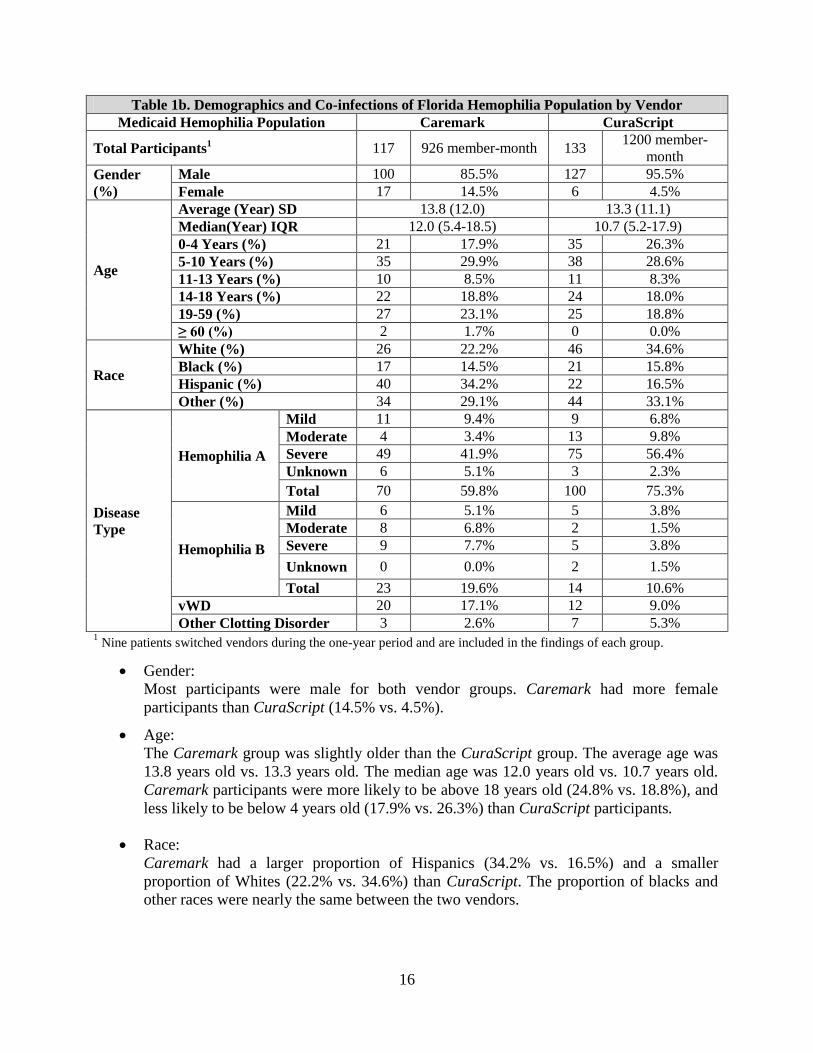
Table 1b. Demographics and Co-infections of Florida Hemophilia Population by Vendor
Medicaid Hemophilia Population Caremark CuraScript
Total Participants1 117 926 member-month 133
1200 member-
month
Gender
(%)
Male 100 85.5% 127 95.5%
Female 17 14.5% 6 4.5%
Age
Average (Year) SD 13.8 (12.0) 13.3 (11.1)
Median(Year) IQR 12.0 (5.4-18.5) 10.7 (5.2-17.9)
0-4 Years (%) 21 17.9% 35 26.3%
5-10 Years (%) 35 29.9% 38 28.6%
11-13 Years (%) 10 8.5% 11 8.3%
14-18 Years (%) 22 18.8% 24 18.0%
19-59 (%) 27 23.1% 25 18.8%
≥ 60 (%) 2 1.7% 0 0.0%
Race
White (%) 26 22.2% 46 34.6%
Black (%) 17 14.5% 21 15.8%
Hispanic (%) 40 34.2% 22 16.5%
Other (%) 34 29.1% 44 33.1%
Disease
Type
Hemophilia A
Mild 11 9.4% 9 6.8%
Moderate 4 3.4% 13 9.8%
Severe 49 41.9% 75 56.4%
Unknown 6 5.1% 3 2.3%
Total 70 59.8% 100 75.3%
Hemophilia B
Mild 6 5.1% 5 3.8%
Moderate 8 6.8% 2 1.5%
Severe 9 7.7% 5 3.8%
Unknown 0 0.0% 2 1.5%
Total 23 19.6% 14 10.6%
vWD 20 17.1% 12 9.0%
Other Clotting Disorder 3 2.6% 7 5.3% 1 Nine patients switched vendors during the one-year period and are included in the findings of each group.
Gender:
Most participants were male for both vendor groups. Caremark had more female
participants than CuraScript (14.5% vs. 4.5%).
Age:
The Caremark group was slightly older than the CuraScript group. The average age was
13.8 years old vs. 13.3 years old. The median age was 12.0 years old vs. 10.7 years old.
Caremark participants were more likely to be above 18 years old (24.8% vs. 18.8%), and
less likely to be below 4 years old (17.9% vs. 26.3%) than CuraScript participants.
Race:
Caremark had a larger proportion of Hispanics (34.2% vs. 16.5%) and a smaller
proportion of Whites (22.2% vs. 34.6%) than CuraScript. The proportion of blacks and
other races were nearly the same between the two vendors.
17
Disease Type and Severity:
Hemophilia A was the most prevalent disease type for both vendor groups. The prevalent
rate of Hemophilia A was relatively lower in the Caremark group than the CuraScript
group (59.8% vs. 75.3 %). Caremark had relatively higher prevalent rates of Hemophilia
B (19.6% vs. 10.6%) and vWD (17.1% vs. 9.0%) than CuraScript. Taking both
hemophilia types together, 49.6% Caremark and 60.2% CuraScript participants had
diseases at severe level.
Health Care Resource Utilization
The total and hemophilia-related health care resource utilizations were examined for all
recipients with hemophilia who were enrolled in Florida Medicaid non-HMO program for at
least one month between June 1, 2007 and May 31, 2009. The analyses were performed for the
two year study period as a whole, as well as the pre-DMP period (June 1, 2007 – May 31, 2008)
and the DMP period (June 1, 2008 – May 31, 2009) separately.
Total health care resource utilization
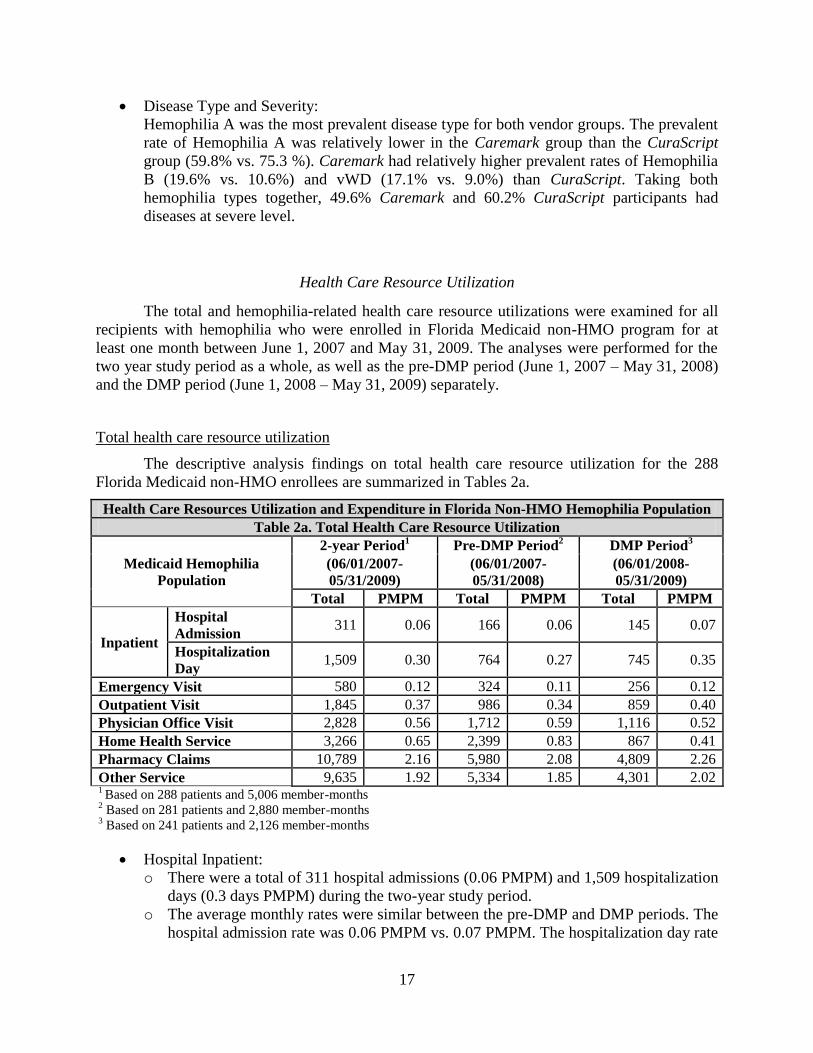
The descriptive analysis findings on total health care resource utilization for the 288
Florida Medicaid non-HMO enrollees are summarized in Tables 2a.
Health Care Resources Utilization and Expenditure in Florida Non-HMO Hemophilia Population
Table 2a. Total Health Care Resource Utilization
Medicaid Hemophilia
Population
2-year Period1 Pre-DMP Period
2 DMP Period
3
(06/01/2007-
05/31/2009)
(06/01/2007-
05/31/2008)
(06/01/2008-
05/31/2009)
Total PMPM Total PMPM Total PMPM
Inpatient
Hospital
Admission 311 0.06 166 0.06 145 0.07
Hospitalization
Day 1,509 0.30 764 0.27 745 0.35
Emergency Visit 580 0.12 324 0.11 256 0.12
Outpatient Visit 1,845 0.37 986 0.34 859 0.40
Physician Office Visit 2,828 0.56 1,712 0.59 1,116 0.52
Home Health Service 3,266 0.65 2,399 0.83 867 0.41
Pharmacy Claims 10,789 2.16 5,980 2.08 4,809 2.26
Other Service 9,635 1.92 5,334 1.85 4,301 2.02 1 Based on 288 patients and 5,006 member-months
2 Based on 281 patients and 2,880 member-months
3 Based on 241 patients and 2,126 member-months
Hospital Inpatient:
o There were a total of 311 hospital admissions (0.06 PMPM) and 1,509 hospitalization
days (0.3 days PMPM) during the two-year study period.
o The average monthly rates were similar between the pre-DMP and DMP periods. The
hospital admission rate was 0.06 PMPM vs. 0.07 PMPM. The hospitalization day rate
18
was slightly lower in the pre-DMP period than the DMP period, which was 0.27
PMPM vs. 0.35 PMPM.
Emergency Room Visits:
o There were 580 emergency room visits during the two-year study period. The overall
average monthly rate was 0.12 PMPM.
o The average rate monthly was similar for the pre-DMP and DMP periods, which was
0.11 PMPM vs. 0.12 PMPM.
Outpatient Visits:
o There were 1,845 Outpatient visits during the two-year study period. The overall
average monthly rate was 0.37 PMPM.
o The average monthly rate was slightly lower for the pre-DMP period than the DMP
period (0.34 PMPM vs. 0.40 PMPM).
Physician Office Visit:
o There were 2,828 physician office visits during the two-year study period. The overall
average monthly rate was 0.56 PMPM.
o The average monthly rate was similar between the pre-DMP and DMP periods, 0.59
PMPM vs. 0.52 PMPM.
Home Health Services:
o There were a total of 3,266 home health services provided to the study population
during the two-year period. The overall average monthly rate was 0.65 PMPM.
o The total home health service utilization reduced significantly, from 2,399 events in
the pre-DMP period to 867 events in the DMP period. The average monthly rate
dropped approximately 50% from 0.83 PMPM to 0.41 PMPM.
Pharmacy:
o There were 10,789 prescription claims during the two-year study period. The overall
average monthly rate was 2.16 PMPM.
o The average monthly rate was similar between the pre-DMP and DMP period, which
was 2.08 PMPM vs. 2.26 PMPM.
Other Services:
o There were 9,635 other health care services provided during the two-year study
period, which did not belong to any categories above. The overall average monthly
rate was 1.92 PMPM.
o The average monthly rates were 1.85 PMPM in the pre-DMP period and 2.02 PMPM
in the DMP period.
19
Hemophilia-related health care resource utilization
The descriptive analysis findings on hemophilia-related health care resource utilization were
summarized in Table 2b. Medical claims were included only if the primary diagnosis codes were
related to hemophilia, vWD or bleeding disorders. Pharmacy claims were included for analysis only
if the prescribed medications were for factor products.
Health Care Resources Utilization and Expenditure in Florida Non-HMO Hemophilia Population
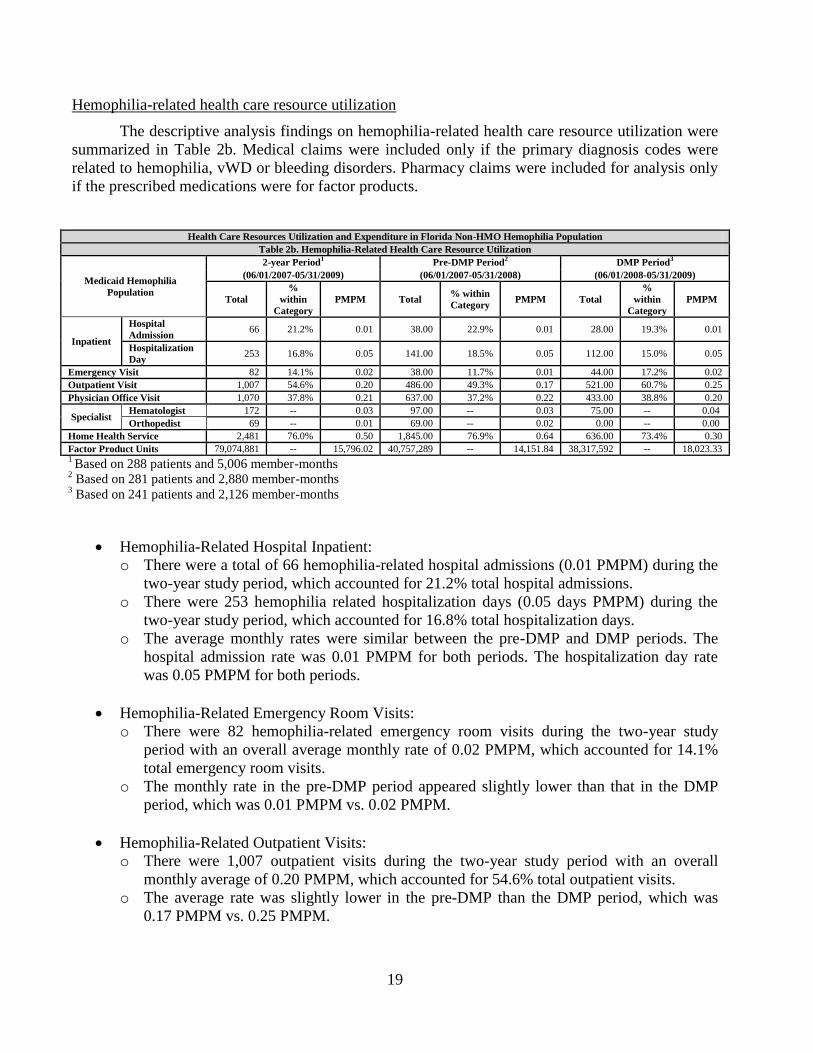
Table 2b. Hemophilia-Related Health Care Resource Utilization
Medicaid Hemophilia
Population
2-year Period1 Pre-DMP Period
2 DMP Period
3
(06/01/2007-05/31/2009) (06/01/2007-05/31/2008) (06/01/2008-05/31/2009)
Total
%
within
Category
PMPM Total % within
Category PMPM Total
%
within
Category
PMPM
Inpatient
Hospital
Admission 66 21.2% 0.01 38.00 22.9% 0.01 28.00 19.3% 0.01
Hospitalization
Day 253 16.8% 0.05 141.00 18.5% 0.05 112.00 15.0% 0.05
Emergency Visit 82 14.1% 0.02 38.00 11.7% 0.01 44.00 17.2% 0.02
Outpatient Visit 1,007 54.6% 0.20 486.00 49.3% 0.17 521.00 60.7% 0.25
Physician Office Visit 1,070 37.8% 0.21 637.00 37.2% 0.22 433.00 38.8% 0.20
Specialist Hematologist 172 -- 0.03 97.00 -- 0.03 75.00 -- 0.04
Orthopedist 69 -- 0.01 69.00 -- 0.02 0.00 -- 0.00
Home Health Service 2,481 76.0% 0.50 1,845.00 76.9% 0.64 636.00 73.4% 0.30
Factor Product Units 79,074,881 -- 15,796.02 40,757,289 -- 14,151.84 38,317,592 -- 18,023.33 1 Based on 288 patients and 5,006 member-months
2 Based on 281 patients and 2,880 member-months
3 Based on 241 patients and 2,126 member-months
Hemophilia-Related Hospital Inpatient:
o There were a total of 66 hemophilia-related hospital admissions (0.01 PMPM) during the
two-year study period, which accounted for 21.2% total hospital admissions.
o There were 253 hemophilia related hospitalization days (0.05 days PMPM) during the
two-year study period, which accounted for 16.8% total hospitalization days.
o The average monthly rates were similar between the pre-DMP and DMP periods. The
hospital admission rate was 0.01 PMPM for both periods. The hospitalization day rate
was 0.05 PMPM for both periods.
Hemophilia-Related Emergency Room Visits:
o There were 82 hemophilia-related emergency room visits during the two-year study
period with an overall average monthly rate of 0.02 PMPM, which accounted for 14.1%
total emergency room visits.
o The monthly rate in the pre-DMP period appeared slightly lower than that in the DMP
period, which was 0.01 PMPM vs. 0.02 PMPM.
Hemophilia-Related Outpatient Visits:
o There were 1,007 outpatient visits during the two-year study period with an overall
monthly average of 0.20 PMPM, which accounted for 54.6% total outpatient visits.
o The average rate was slightly lower in the pre-DMP than the DMP period, which was
0.17 PMPM vs. 0.25 PMPM.
20
Hemophilia-Related Physician Office Visits:
o There were 1,070 physician office visits during the two-year study period with an overall
average monthly rate of 0.21 PMPM, which accounted for 37.8% total physician office
visits.
o The average rate was similar between the pre-DMP and the DMP period, which was 0.22
PMPM vs. 0.20 PMPM.
Specialist Visits:
o There were 172 hematologist visits during the two-year study period with an overall
average monthly rate of 0.03 PMPM in the pre-DMP and 0.04 PMPM in the DMP
periods.
o There were 69 orthopedic surgeon visits during the two-year observation period. These
visits all occurred during the pre-DMP period. No such visits occurred during the DMP
period.
Hemophilia-Related Home Health Services:
o There were 2,481 hemophilia related home health services during the two-year study
period with an overall average monthly rate of 0.5 PMPM, which accounted for 76.0% of
total home health services.
o The average rate decreased approximately 50% from 0.64 PMPM in the pre-DMP to 0.30
PMPM in the DMP period.
Factor Product:
o More than 79 million factor product units were dispensed during the two year study
period with an overall average rate of 15,796 units PMPM.
o The average rates were lower in the pre-DMP than that in the DMP period, which was
14,151 units PMPM vs. 18,023 units PMPM.
Health Care Expenditures
The total and hemophilia-related health care expenditures were examined. All expenditures
were adjusted to fiscal year 2008-2009 values based the Florida Medicaid inflation factors that
AHCA provided.
21
Total health care expenditure
The descriptive analysis findings on total health care expenditures are summarized in Table
2c.
Health Care Resources Utilization and Expenditure in Florida Non-HMO Hemophilia Population
Table 2c. Total Health Care Expenditure ($)1
Medicaid
Hemophilia
Population
2-year Period2 Pre-DMP Period
3 DMP Period
4
(06/01/2007-05/31/2009) (06/01/2007-05/31/2008) (06/01/2008-05/31/2009)
Total % Total
Cost
PMPM
Cost Total
% Total
Cost
PMPM
Cost Total
%
Total
Cost
PMPM
Total 91,688,149 100.0% 18,316 49,985,331 100.0% 17,356 41,702,818 100.0% 19,616
Inpatient
2,880,867 3.1% 575 1,467,718 2.9% 510 1,413,149 3.3% 665
Emergency
Visit 233,029 0.3% 47 138,177 0.3% 48 94,852 0.2% 45
Outpatient
Visit 527,781 0.6% 105 289,595 0.6% 101 238,185 0.6% 112
Physician
Office Visit 173,811 0.2% 35 107,119 0.2% 37 66,692 0.2% 31
Home Health
Service 181,253 0.2% 36 129,230 0.3% 45 52,023 0.1% 24
Pharmacy
86,124,598 93.9% 17,204 46,945,394 93.9% 16,300 39,179,204 92.6% 18,429
Other Service 1,273,796 1.4% 254 728,011 1.5% 253 545,786 1.3% 257
Cost Per
Bucket
Category
See Appendix E
1. 1All expenditures were adjusted to fiscal year 2008-2009 values
2. 2 Based on 288 patients and 5,006 member-months
3. 3 Based on 281 patients and 2,880 member-months
4. 4 Based on 241 patients and 2,126 member-months
Total Health Care Cost:
o Approximately, $91.7 million were spent for the 288 recipients during the two-year study
period with an overall average monthly cost of $18,316 PMPM, ranging from $3 PMPM
to $335,030 PMPM.
o The average monthly cost was approximately $2,000 lower during the pre-DMP than the
DMP period, which was $17,356 PMPM vs. $19,616 PMPM
Pharmacy Cost:
o Pharmacy cost was the largest cost category in this hemophilia population. A total of
$86.6 million were spent during the two-year study period, accounting for about 94% of
the total health care cost.
o The average monthly total cost was also lower in the pre-DMP than the DMP period,
which was $16,300 PMPM vs. $18,429 PMPM.
Hospital Inpatient Cost:
22
o Hospital inpatient cost was the second largest cost category, accounting for 3.1% of the
total health care cost. Approximately, $2.9 million were spent for hospital inpatient
services in this population during the two-year study period.
o The average monthly cost was $510 PMPM for the pre-DMP and $665 PMPM for the
DMP period.
Other Cost Categories:
o The other cost categories collectively accounted for only about 4% of the total health care
cost, including emergency visits, outpatient visits, physician office visits, home health
services, and other services.
Hemophilia-related health care expenditure
The descriptive analysis findings on hemophilia-related health care expenditures are summarized in
Tables 2d.
Total Hemophilia-Related Health Care Cost:
o More than 94% of the total health care costs were hemophilia-related.
o The average monthly cost was $16,380 during the pre-DMP and $18,534 during the DMP
period.
Factor Product Cost:
o Factor product cost was the main cost driver for this hemophilia population. A total of
$86.6 million were spent during the two-year study period, accounting for about 92.9% of
the total health care cost, 98.5% of the total hemophilia-related health care costs, and 99.0%
of the total pharmacy cost.
o The average monthly cost was $16,131 PMPM in the pre-DMP and $18,233 PMPM in
the DMP period.
Other Hemophilia-Related Cost Categories:
The other hemophilia related cost categories collectively accounted for only
approximately 1.5% of the total hemophilia-related health care cost, including hemophilia
related hospital inpatient, emergency visit, outpatient visit, physician office visits, home
health service, hematologist visits, orthopedic surgeon visits, and others.
23
Health Care Resources Utilization and Expenditure in Florida Non-HMO Hemophilia Population1
Table 2d. Hemophilia-Related Health Care Expenditure ($)
Medicaid Hemophilia
Population
2-year Period2 Pre-DMP Period
3 DMP Period
4
(06/01/2007-05/31/2009) (06/01/2007-05/31/2008) (06/01/2008-05/31/2009)
Total
% Total
Hemo
Cost
% within
Category PMPM Total
% Total
Hemo
Cost
% within
Category PMPM Total
% Total
Hemo
Cost
% within
Category PMPM
Total 86,577,929 100.0% 94.4% 17,295 47,174,964 100.0% 94.4% 16,380 39,402,965 100.0% 94.5% 18,534
Inpatient 517,037 0.6% 17.9% 103 272,691 0.6% 18.6% 95 244,346 0.6% 17.3% 115
Emergency Visit 26,732 0.0% 11.5% 5 12,132 0.0% 8.8% 4 14,599 0.0% 15.4% 7
Outpatient Visit 268,259 0.3% 50.8% 54 131,100 0.3% 45.3% 46 137,159 0.3% 57.6% 65
Physician Office Visit 63,966 0.1% 36.8% 13 37,499 0.1% 35.0% 13 26,466 0.1% 39.7% 12
Home Health Service 101,776 0.1% 56.2% 20 78,102 0.2% 60.4% 27 23,675 0.1% 45.5% 11
Specialist Hematologist 1,143,265 1.3% -- 228 403,165 0.9% -- 140 740,100 1.9% -- 348
Orthopedist 8,610 0.0% -- 2 8,610 0.0% -- 3 0 0.0% -- 0
Factor Product 85,220,835 98.4% 99.0% 17,024 46,458,264 98.5% 99.0% 16,131 38,762,571 98.4% 98.9% 18,233
5. 1All expenditures were adjusted to fiscal year 2008-2009 values 6. 2 Based on 288 patients and 5,006 member-months
7. 3 Based on 281 patients and 2,880 member-months 4 Based on 241 patients and 2,126 member-months
24
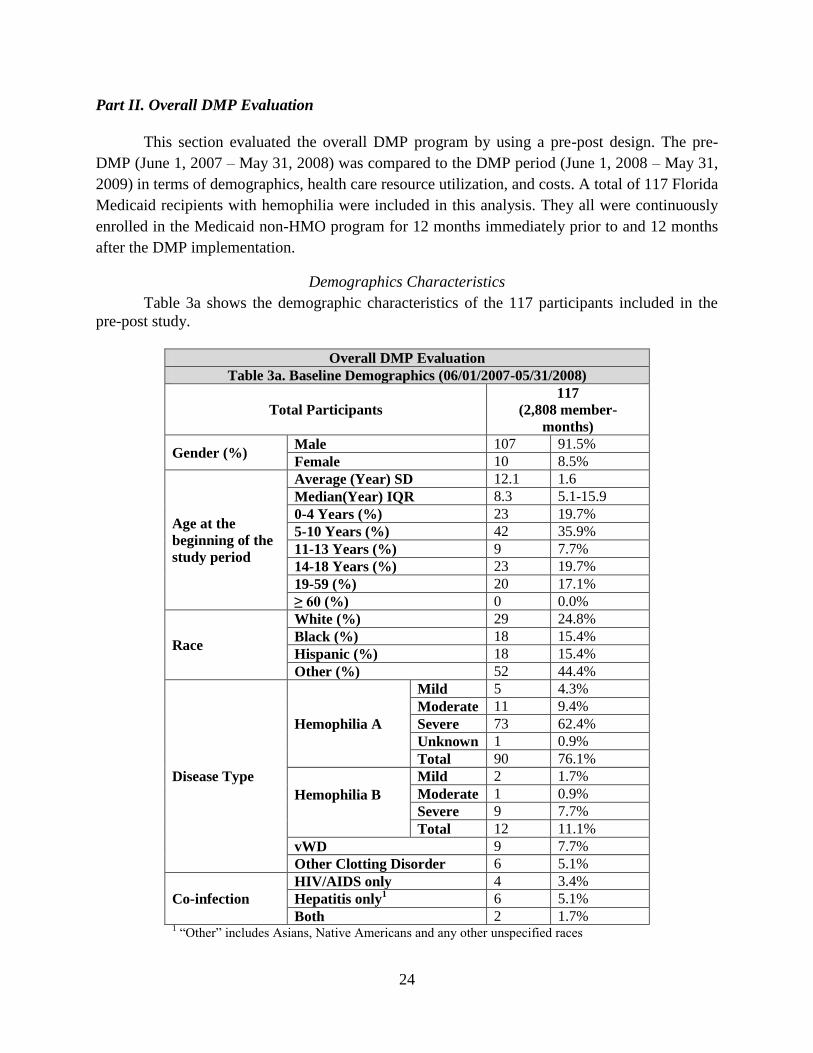
Part II. Overall DMP Evaluation
This section evaluated the overall DMP program by using a pre-post design. The pre-
DMP (June 1, 2007 – May 31, 2008) was compared to the DMP period (June 1, 2008 – May 31,
2009) in terms of demographics, health care resource utilization, and costs. A total of 117 Florida
Medicaid recipients with hemophilia were included in this analysis. They all were continuously
enrolled in the Medicaid non-HMO program for 12 months immediately prior to and 12 months
after the DMP implementation.
Demographics Characteristics
Table 3a shows the demographic characteristics of the 117 participants included in the
pre-post study.
Overall DMP Evaluation
Table 3a. Baseline Demographics (06/01/2007-05/31/2008)
Total Participants
117
(2,808 member-
months)
Gender (%) Male 107 91.5%
Female 10 8.5%
Age at the
beginning of the
study period
Average (Year) SD 12.1 1.6
Median(Year) IQR 8.3 5.1-15.9
0-4 Years (%) 23 19.7%
5-10 Years (%) 42 35.9%
11-13 Years (%) 9 7.7%
14-18 Years (%) 23 19.7%
19-59 (%) 20 17.1%
≥ 60 (%) 0 0.0%
Race
White (%) 29 24.8%
Black (%) 18 15.4%
Hispanic (%) 18 15.4%
Other (%) 52 44.4%
Disease Type
Hemophilia A
Mild 5 4.3%
Moderate 11 9.4%
Severe 73 62.4%
Unknown 1 0.9%
Total 90 76.1%
Hemophilia B
Mild 2 1.7%
Moderate 1 0.9%
Severe 9 7.7%
Total 12 11.1%
vWD 9 7.7%
Other Clotting Disorder 6 5.1%
Co-infection
HIV/AIDS only 4 3.4%
Hepatitis only1 6 5.1%
Both 2 1.7% 1 “Other” includes Asians, Native Americans and any other unspecified races
25
Gender
Most included participants were male (91.5%)
Age:
The average age was 12.1 years old (SD=1.6) and a median age was 8.3 years old
(IQR=5.1-15.9). Most participants were 18 years old or younger (82.9%).
Race
White, Black, Hispanic and other races accounted for 24.8%, 15.4%, 15.4%, and 44.4%,
respectively.
Disease Type:
Hemophilia A was the most prevalent disease type, accounting for 76.1%. Hemophilia B,
vWD and other clotting disorders accounted for 11.1%, 7.7%, and 5.1%, respectively.
Co-infections
10.1% of the participants had claims containing diagnosis codes of HIV/AIDS or
Hepatitis or both. All these diagnosis codes first appeared during the pre-DMP period
except for one Hepatitis case, which first appeared in the DMP period.
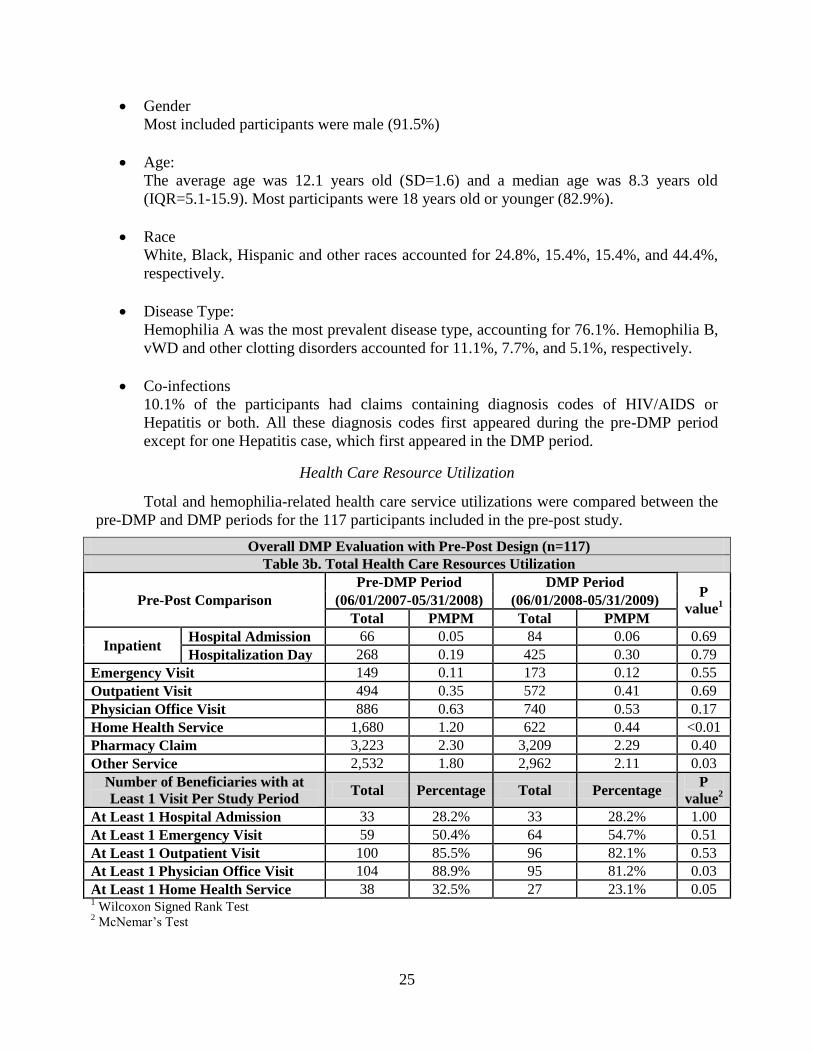
Health Care Resource Utilization
Total and hemophilia-related health care service utilizations were compared between the
pre-DMP and DMP periods for the 117 participants included in the pre-post study.
Overall DMP Evaluation with Pre-Post Design (n=117)
Table 3b. Total Health Care Resources Utilization
Pre-Post Comparison
Pre-DMP Period DMP Period P
value1
(06/01/2007-05/31/2008) (06/01/2008-05/31/2009)
Total PMPM Total PMPM
Inpatient Hospital Admission 66 0.05 84 0.06 0.69
Hospitalization Day 268 0.19 425 0.30 0.79
Emergency Visit 149 0.11 173 0.12 0.55
Outpatient Visit 494 0.35 572 0.41 0.69
Physician Office Visit 886 0.63 740 0.53 0.17
Home Health Service 1,680 1.20 622 0.44 <0.01
Pharmacy Claim 3,223 2.30 3,209 2.29 0.40
Other Service 2,532 1.80 2,962 2.11 0.03
Number of Beneficiaries with at
Least 1 Visit Per Study Period Total Percentage Total Percentage
P
value2
At Least 1 Hospital Admission 33 28.2% 33 28.2% 1.00
At Least 1 Emergency Visit 59 50.4% 64 54.7% 0.51
At Least 1 Outpatient Visit 100 85.5% 96 82.1% 0.53
At Least 1 Physician Office Visit 104 88.9% 95 81.2% 0.03
At Least 1 Home Health Service 38 32.5% 27 23.1% 0.05 1 Wilcoxon Signed Rank Test
2 McNemar’s Test
26
Total health care resource utilization
Table 3b summarizes the results for the pre-post comparisons for total health care
resource utilization in the 117 hemophilia participants.
No statistically significant differences were found for hospital admission, hospitalization
day, outpatient visit, or pharmacy claims between the pre-DMP and DMP periods.
The proportion of participants that visited physician offices decreased from 88.9% during
the pre-DMP to 81.2% during the DMP period (P=0.03). The number of physician office
visits also decreased from 0.63 PMPM to 0.53 PMPM, although difference was not
statistically significant (P=0.17).
There was a statistically significant decrease in the utilization of home health services.
During the pre-DMP period, 38 participants (32.5%) had 1,680 home health services. The
numbers decreased to 27 participants and 622 home health services during the DMP
period. The differences were statistically significant for both the number of home health
services (P<0.01) and the proportion of participants that ever had home health service
(P=0.05).
The number of “other service” increased from 1.80 PMPM in the pre-DMP to 2.11
PMPM in the DMP period (P=0.03).
Hemophilia-related health care resource utilization
The hemophilia-related health care resource utilization was also compared in the 117
participants by including only claims with a primary diagnosis code for hemophilia. The results
are presented in Table 3c.
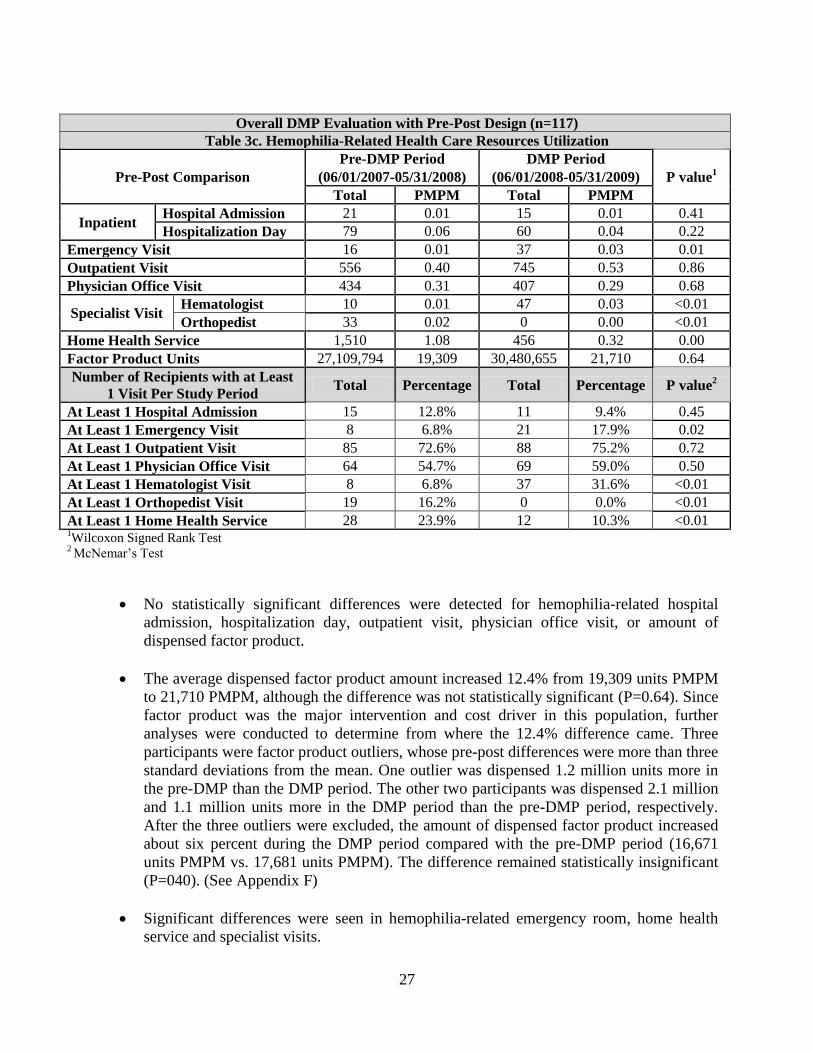
27
Overall DMP Evaluation with Pre-Post Design (n=117)
Table 3c. Hemophilia-Related Health Care Resources Utilization
Pre-Post Comparison
Pre-DMP Period DMP Period
P value1 (06/01/2007-05/31/2008) (06/01/2008-05/31/2009)
Total PMPM Total PMPM
Inpatient Hospital Admission 21 0.01 15 0.01 0.41
Hospitalization Day 79 0.06 60 0.04 0.22
Emergency Visit 16 0.01 37 0.03 0.01
Outpatient Visit 556 0.40 745 0.53 0.86
Physician Office Visit 434 0.31 407 0.29 0.68
Specialist Visit Hematologist 10 0.01 47 0.03 <0.01
Orthopedist 33 0.02 0 0.00 <0.01
Home Health Service 1,510 1.08 456 0.32 0.00
Factor Product Units 27,109,794 19,309 30,480,655 21,710 0.64
Number of Recipients with at Least
1 Visit Per Study Period Total Percentage Total Percentage P value
2
At Least 1 Hospital Admission 15 12.8% 11 9.4% 0.45
At Least 1 Emergency Visit 8 6.8% 21 17.9% 0.02
At Least 1 Outpatient Visit 85 72.6% 88 75.2% 0.72
At Least 1 Physician Office Visit 64 54.7% 69 59.0% 0.50
At Least 1 Hematologist Visit 8 6.8% 37 31.6% <0.01
At Least 1 Orthopedist Visit 19 16.2% 0 0.0% <0.01
At Least 1 Home Health Service 28 23.9% 12 10.3% <0.01 1Wilcoxon Signed Rank Test
2 McNemar’s Test
No statistically significant differences were detected for hemophilia-related hospital
admission, hospitalization day, outpatient visit, physician office visit, or amount of
dispensed factor product.
The average dispensed factor product amount increased 12.4% from 19,309 units PMPM
to 21,710 PMPM, although the difference was not statistically significant (P=0.64). Since
factor product was the major intervention and cost driver in this population, further
analyses were conducted to determine from where the 12.4% difference came. Three
participants were factor product outliers, whose pre-post differences were more than three
standard deviations from the mean. One outlier was dispensed 1.2 million units more in
the pre-DMP than the DMP period. The other two participants was dispensed 2.1 million
and 1.1 million units more in the DMP period than the pre-DMP period, respectively.
After the three outliers were excluded, the amount of dispensed factor product increased
about six percent during the DMP period compared with the pre-DMP period (16,671
units PMPM vs. 17,681 units PMPM). The difference remained statistically insignificant
(P=040). (See Appendix F)
Significant differences were seen in hemophilia-related emergency room, home health
service and specialist visits.
28
o A total of 8 (6.8%) participants had 16 emergency room visits during the pre-DMP,
which increased to 21 participants (17.9%) and 37 visits during the DMP period.
o A total of 8 participants (6.8%) had 10 hematologist visits during the pre-DMP,
which increased to 37 participants (31.6%) and 47 visits.
o A total of 19 participants (16.2%) had 33 orthopedic surgeon visits during the pre-
DMP period, which decreased to 0 during the DMP period. Please recheck the figures
in this bullet – they don’t seem to match the table.
o A total of 28 participants (23.9%) had 1,510 home health services during the pre-
DMP period, which decreased to 12 (10.3%) participants and 456 services.
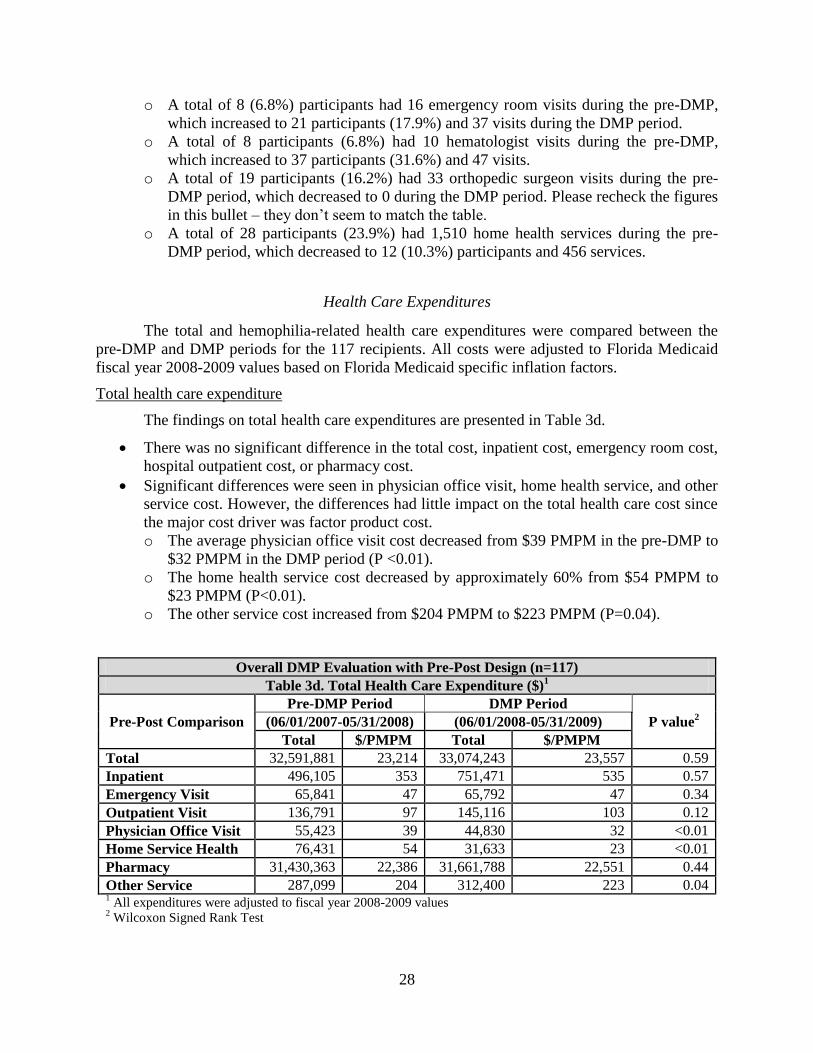
Health Care Expenditures
The total and hemophilia-related health care expenditures were compared between the
pre-DMP and DMP periods for the 117 recipients. All costs were adjusted to Florida Medicaid
fiscal year 2008-2009 values based on Florida Medicaid specific inflation factors.
Total health care expenditure
The findings on total health care expenditures are presented in Table 3d.
There was no significant difference in the total cost, inpatient cost, emergency room cost,
hospital outpatient cost, or pharmacy cost.
Significant differences were seen in physician office visit, home health service, and other
service cost. However, the differences had little impact on the total health care cost since
the major cost driver was factor product cost.
o The average physician office visit cost decreased from $39 PMPM in the pre-DMP to
$32 PMPM in the DMP period (P <0.01).
o The home health service cost decreased by approximately 60% from $54 PMPM to
$23 PMPM (P<0.01).
o The other service cost increased from $204 PMPM to $223 PMPM (P=0.04).
Overall DMP Evaluation with Pre-Post Design (n=117)
Table 3d. Total Health Care Expenditure ($)1
Pre-Post Comparison
Pre-DMP Period DMP Period
P value2 (06/01/2007-05/31/2008) (06/01/2008-05/31/2009)
Total $/PMPM Total $/PMPM
Total 32,591,881 23,214 33,074,243 23,557 0.59
Inpatient 496,105 353 751,471 535 0.57
Emergency Visit 65,841 47 65,792 47 0.34
Outpatient Visit 136,791 97 145,116 103 0.12
Physician Office Visit 55,423 39 44,830 32 <0.01
Home Service Health 76,431 54 31,633 23 <0.01
Pharmacy 31,430,363 22,386 31,661,788 22,551 0.44
Other Service 287,099 204 312,400 223 0.04 1 All expenditures were adjusted to fiscal year 2008-2009 values
2 Wilcoxon Signed Rank Test
29
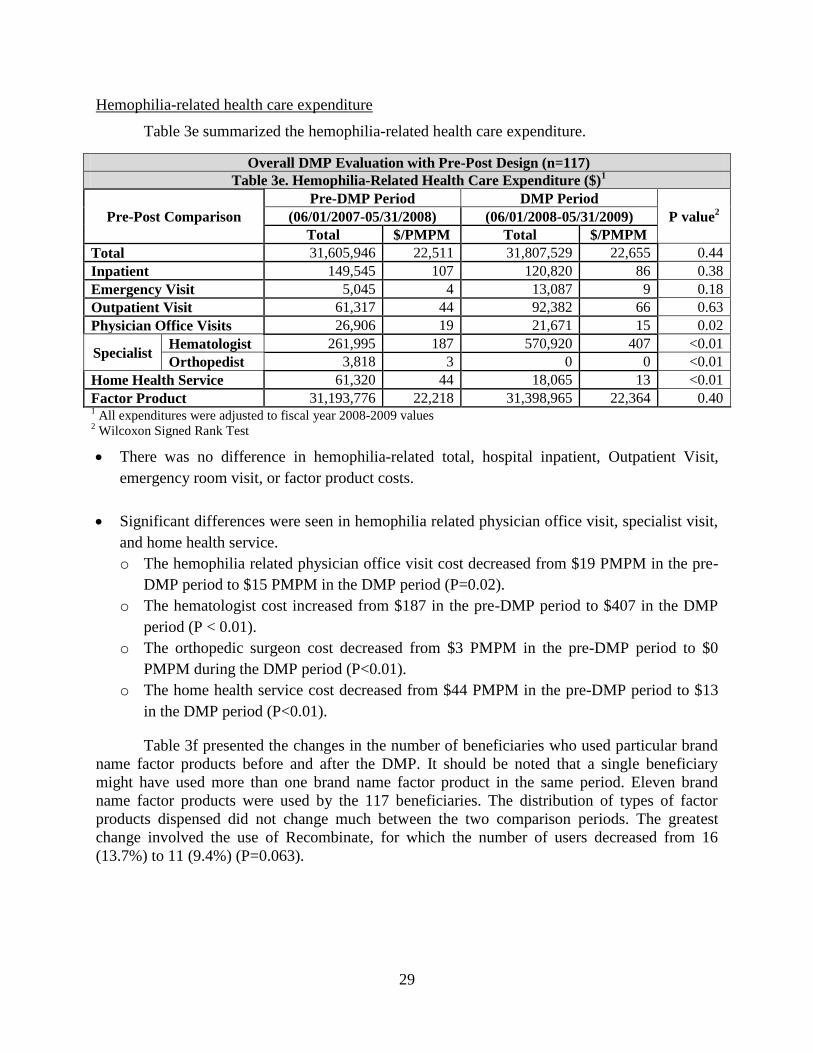
Hemophilia-related health care expenditure
Table 3e summarized the hemophilia-related health care expenditure.
Overall DMP Evaluation with Pre-Post Design (n=117)
Table 3e. Hemophilia-Related Health Care Expenditure ($)1
Pre-Post Comparison
Pre-DMP Period DMP Period
P value2 (06/01/2007-05/31/2008) (06/01/2008-05/31/2009)
Total $/PMPM Total $/PMPM
Total 31,605,946 22,511 31,807,529 22,655 0.44
Inpatient 149,545 107 120,820 86 0.38
Emergency Visit 5,045 4 13,087 9 0.18
Outpatient Visit 61,317 44 92,382 66 0.63
Physician Office Visits 26,906 19 21,671 15 0.02
Specialist Hematologist 261,995 187 570,920 407 <0.01
Orthopedist 3,818 3 0 0 <0.01
Home Health Service 61,320 44 18,065 13 <0.01
Factor Product 31,193,776 22,218 31,398,965 22,364 0.40 1 All expenditures were adjusted to fiscal year 2008-2009 values
2 Wilcoxon Signed Rank Test
There was no difference in hemophilia-related total, hospital inpatient, Outpatient Visit,
emergency room visit, or factor product costs.
Significant differences were seen in hemophilia related physician office visit, specialist visit,
and home health service.
o The hemophilia related physician office visit cost decreased from $19 PMPM in the pre-
DMP period to $15 PMPM in the DMP period (P=0.02).
o The hematologist cost increased from $187 in the pre-DMP period to $407 in the DMP
period (P < 0.01).
o The orthopedic surgeon cost decreased from $3 PMPM in the pre-DMP period to $0
PMPM during the DMP period (P<0.01).
o The home health service cost decreased from $44 PMPM in the pre-DMP period to $13
in the DMP period (P<0.01).
Table 3f presented the changes in the number of beneficiaries who used particular brand
name factor products before and after the DMP. It should be noted that a single beneficiary
might have used more than one brand name factor product in the same period. Eleven brand
name factor products were used by the 117 beneficiaries. The distribution of types of factor
products dispensed did not change much between the two comparison periods. The greatest
change involved the use of Recombinate, for which the number of users decreased from 16
(13.7%) to 11 (9.4%) (P=0.063).
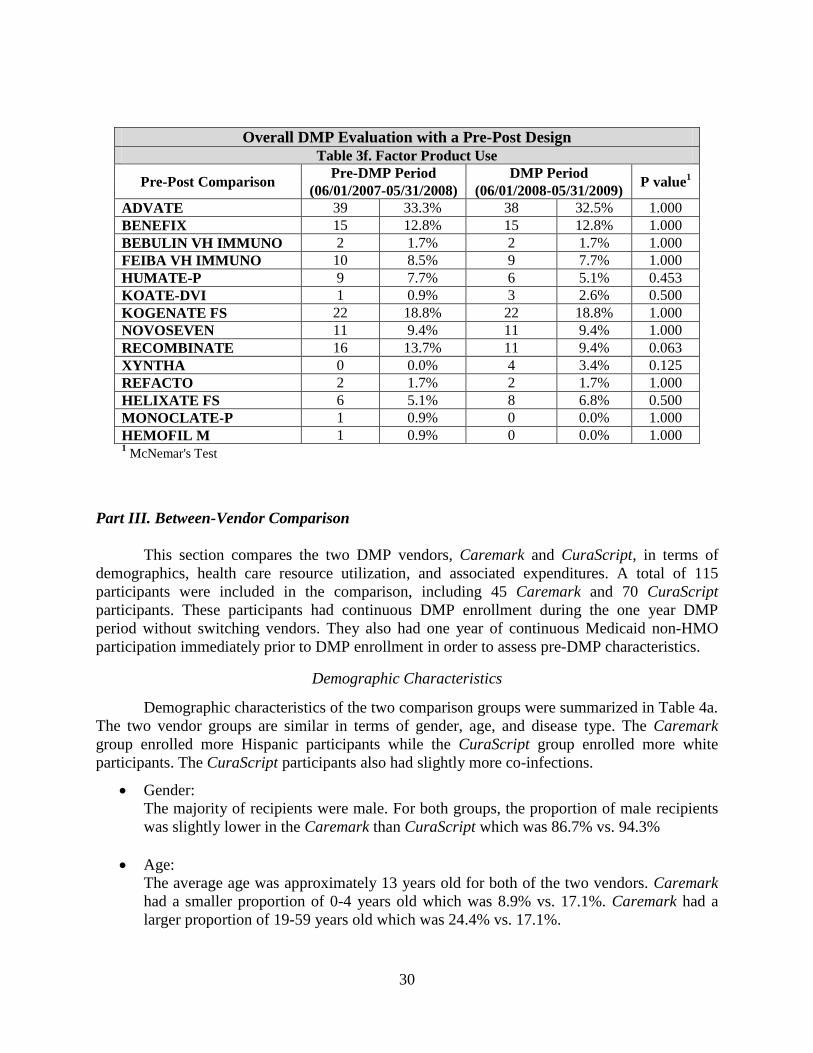
30
Overall DMP Evaluation with a Pre-Post Design
Table 3f. Factor Product Use
Pre-Post Comparison Pre-DMP Period DMP Period
P value1
(06/01/2007-05/31/2008) (06/01/2008-05/31/2009)
ADVATE 39 33.3% 38 32.5% 1.000
BENEFIX 15 12.8% 15 12.8% 1.000
BEBULIN VH IMMUNO 2 1.7% 2 1.7% 1.000
FEIBA VH IMMUNO 10 8.5% 9 7.7% 1.000
HUMATE-P 9 7.7% 6 5.1% 0.453
KOATE-DVI 1 0.9% 3 2.6% 0.500
KOGENATE FS 22 18.8% 22 18.8% 1.000
NOVOSEVEN 11 9.4% 11 9.4% 1.000
RECOMBINATE 16 13.7% 11 9.4% 0.063
XYNTHA 0 0.0% 4 3.4% 0.125
REFACTO 2 1.7% 2 1.7% 1.000
HELIXATE FS 6 5.1% 8 6.8% 0.500
MONOCLATE-P 1 0.9% 0 0.0% 1.000
HEMOFIL M 1 0.9% 0 0.0% 1.000 1 McNemar's Test
Part III. Between-Vendor Comparison
This section compares the two DMP vendors, Caremark and CuraScript, in terms of
demographics, health care resource utilization, and associated expenditures. A total of 115
participants were included in the comparison, including 45 Caremark and 70 CuraScript
participants. These participants had continuous DMP enrollment during the one year DMP
period without switching vendors. They also had one year of continuous Medicaid non-HMO
participation immediately prior to DMP enrollment in order to assess pre-DMP characteristics.
Demographic Characteristics
Demographic characteristics of the two comparison groups were summarized in Table 4a.
The two vendor groups are similar in terms of gender, age, and disease type. The Caremark
group enrolled more Hispanic participants while the CuraScript group enrolled more white
participants. The CuraScript participants also had slightly more co-infections.
Gender:
The majority of recipients were male. For both groups, the proportion of male recipients
was slightly lower in the Caremark than CuraScript which was 86.7% vs. 94.3%
Age:
The average age was approximately 13 years old for both of the two vendors. Caremark
had a smaller proportion of 0-4 years old which was 8.9% vs. 17.1%. Caremark had a
larger proportion of 19-59 years old which was 24.4% vs. 17.1%.
31
Race:
Significant differences were observed between the two vendors. Caremark served more
Hispanic recipients which was 24.4% vs. 8.6%. CuraScript served more White recipients
which was 31.4% vs. 13.3%.
Disease Type:
Hemophilia A was the most prevalent disease for both vendors which was 69.0% for
Caremark and 80% for CuraScript. Caremark had a higher proportion of Hemophilia B
than CuraScript which was 17.8% vs. 7.1%. Caremark also had a higher proportion of
vWD than CuraScript which was 11.1% vs. 5.7%. CuraScript had a relatively higher
proportion of other clotting disorders than Caremark which was 2.2% vs. 7.1%. The
disease severity distribution was similar between the two vendors. Recipients with severe
hemophilia accounted for approximately 70% of participants for both vendors.
Co-Infections:
HIV/AIDS and Hepatitis were slightly lower for Caremark than CuraScript which was
6.6% vs. 12.9% These diagnoses first appeared during the pre-DMP period except for one
Caremark participant, who had Hepatitis diagnosis code in the DMP but not the pre-DMP
period.
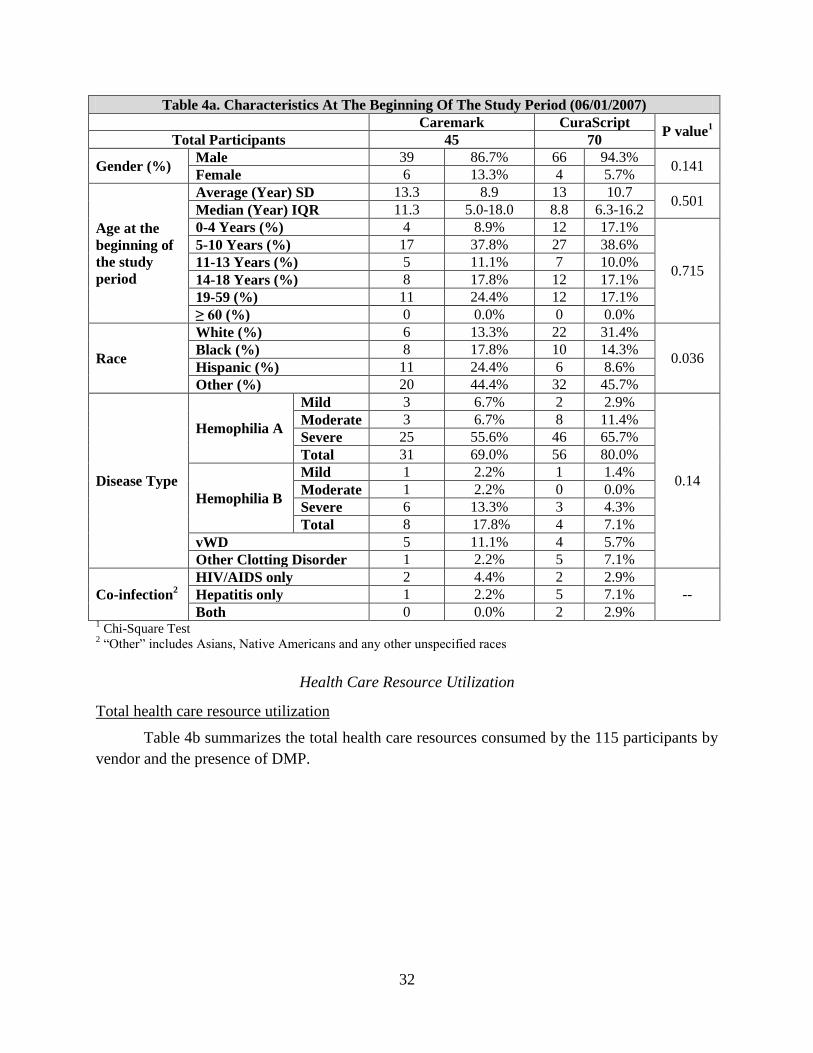
32
Table 4a. Characteristics At The Beginning Of The Study Period (06/01/2007)
Caremark CuraScript P value
1
Total Participants 45 70
Gender (%) Male 39 86.7% 66 94.3%
0.141 Female 6 13.3% 4 5.7%
Age at the
beginning of
the study
period
Average (Year) SD 13.3 8.9 13 10.7 0.501
Median (Year) IQR 11.3 5.0-18.0 8.8 6.3-16.2
0-4 Years (%) 4 8.9% 12 17.1%
0.715
5-10 Years (%) 17 37.8% 27 38.6%
11-13 Years (%) 5 11.1% 7 10.0%
14-18 Years (%) 8 17.8% 12 17.1%
19-59 (%) 11 24.4% 12 17.1%
≥ 60 (%) 0 0.0% 0 0.0%
Race
White (%) 6 13.3% 22 31.4%
0.036 Black (%) 8 17.8% 10 14.3%
Hispanic (%) 11 24.4% 6 8.6%
Other (%) 20 44.4% 32 45.7%
Disease Type
Hemophilia A
Mild 3 6.7% 2 2.9%
0.14
Moderate 3 6.7% 8 11.4%
Severe 25 55.6% 46 65.7%
Total 31 69.0% 56 80.0%
Hemophilia B
Mild 1 2.2% 1 1.4%
Moderate 1 2.2% 0 0.0%
Severe 6 13.3% 3 4.3%
Total 8 17.8% 4 7.1%
vWD 5 11.1% 4 5.7%
Other Clotting Disorder 1 2.2% 5 7.1%
Co-infection2
HIV/AIDS only 2 4.4% 2 2.9%
-- Hepatitis only 1 2.2% 5 7.1%
Both 0 0.0% 2 2.9% 1 Chi-Square Test
2 “Other” includes Asians, Native Americans and any other unspecified races
Health Care Resource Utilization
Total health care resource utilization
Table 4b summarizes the total health care resources consumed by the 115 participants by
vendor and the presence of DMP.
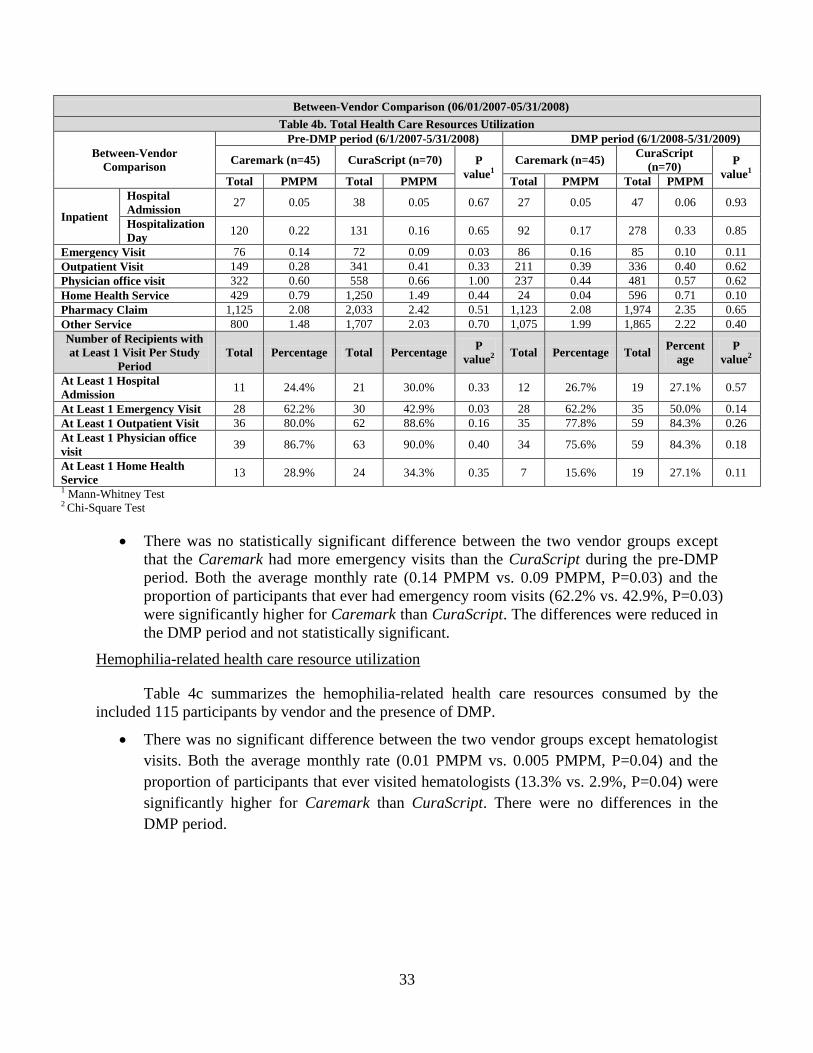
33
Between-Vendor Comparison (06/01/2007-05/31/2008)
Table 4b. Total Health Care Resources Utilization
Between-Vendor
Comparison
Pre-DMP period (6/1/2007-5/31/2008) DMP period (6/1/2008-5/31/2009)
Caremark (n=45) CuraScript (n=70) P
value1
Caremark (n=45) CuraScript
(n=70) P
value1 Total PMPM Total PMPM Total PMPM Total PMPM
Inpatient
Hospital
Admission 27 0.05 38 0.05 0.67 27 0.05 47 0.06 0.93
Hospitalization
Day 120 0.22 131 0.16 0.65 92 0.17 278 0.33 0.85
Emergency Visit 76 0.14 72 0.09 0.03 86 0.16 85 0.10 0.11
Outpatient Visit 149 0.28 341 0.41 0.33 211 0.39 336 0.40 0.62
Physician office visit 322 0.60 558 0.66 1.00 237 0.44 481 0.57 0.62
Home Health Service 429 0.79 1,250 1.49 0.44 24 0.04 596 0.71 0.10
Pharmacy Claim 1,125 2.08 2,033 2.42 0.51 1,123 2.08 1,974 2.35 0.65
Other Service 800 1.48 1,707 2.03 0.70 1,075 1.99 1,865 2.22 0.40
Number of Recipients with
at Least 1 Visit Per Study
Period
Total Percentage Total Percentage P
value2 Total Percentage Total
Percent
age
P
value2
At Least 1 Hospital
Admission 11 24.4% 21 30.0% 0.33 12 26.7% 19 27.1% 0.57
At Least 1 Emergency Visit 28 62.2% 30 42.9% 0.03 28 62.2% 35 50.0% 0.14
At Least 1 Outpatient Visit 36 80.0% 62 88.6% 0.16 35 77.8% 59 84.3% 0.26
At Least 1 Physician office
visit 39 86.7% 63 90.0% 0.40 34 75.6% 59 84.3% 0.18
At Least 1 Home Health
Service 13 28.9% 24 34.3% 0.35 7 15.6% 19 27.1% 0.11
1 Mann-Whitney Test 2 Chi-Square Test
There was no statistically significant difference between the two vendor groups except
that the Caremark had more emergency visits than the CuraScript during the pre-DMP
period. Both the average monthly rate (0.14 PMPM vs. 0.09 PMPM, P=0.03) and the
proportion of participants that ever had emergency room visits (62.2% vs. 42.9%, P=0.03)
were significantly higher for Caremark than CuraScript. The differences were reduced in
the DMP period and not statistically significant.
Hemophilia-related health care resource utilization
Table 4c summarizes the hemophilia-related health care resources consumed by the
included 115 participants by vendor and the presence of DMP.
There was no significant difference between the two vendor groups except hematologist
visits. Both the average monthly rate (0.01 PMPM vs. 0.005 PMPM, P=0.04) and the
proportion of participants that ever visited hematologists (13.3% vs. 2.9%, P=0.04) were
significantly higher for Caremark than CuraScript. There were no differences in the
DMP period.
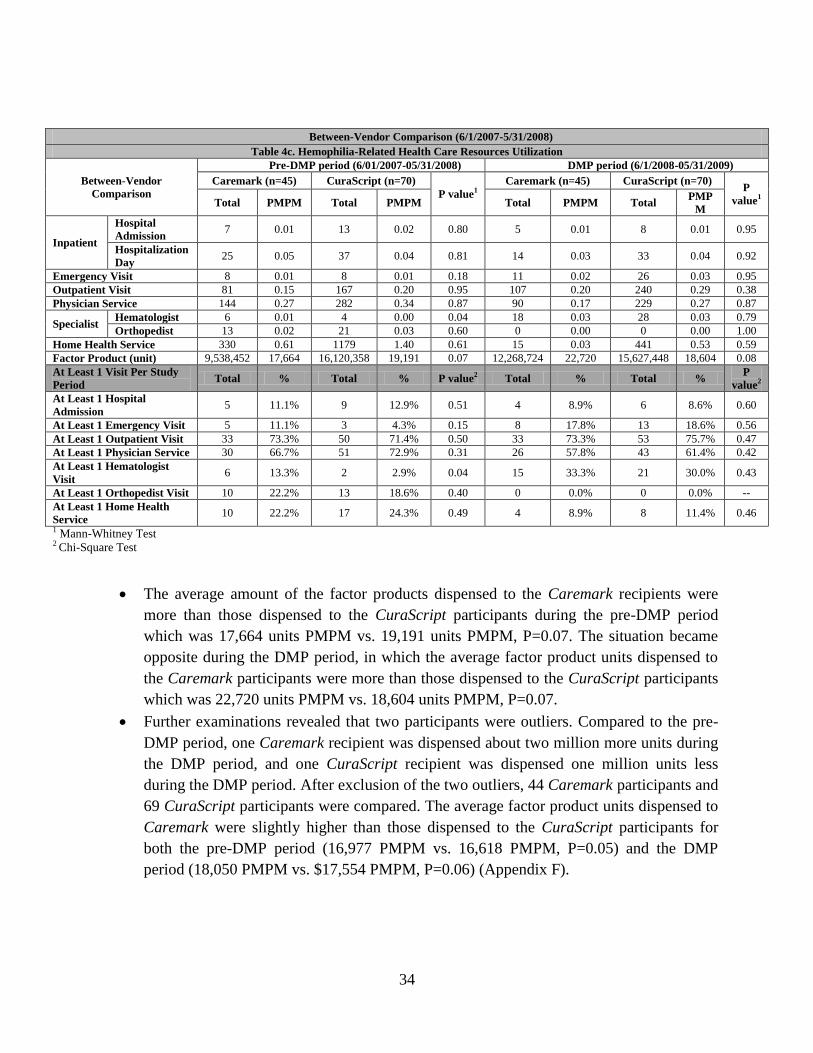
34
Between-Vendor Comparison (6/1/2007-5/31/2008)
Table 4c. Hemophilia-Related Health Care Resources Utilization
Between-Vendor
Comparison
Pre-DMP period (6/01/2007-05/31/2008) DMP period (6/1/2008-05/31/2009)
Caremark (n=45) CuraScript (n=70)
P value1
Caremark (n=45) CuraScript (n=70) P
value1 Total PMPM Total PMPM Total PMPM Total
PMP
M
Inpatient
Hospital
Admission 7 0.01 13 0.02 0.80 5 0.01 8 0.01 0.95
Hospitalization
Day 25 0.05 37 0.04 0.81 14 0.03 33 0.04 0.92
Emergency Visit 8 0.01 8 0.01 0.18 11 0.02 26 0.03 0.95
Outpatient Visit 81 0.15 167 0.20 0.95 107 0.20 240 0.29 0.38
Physician Service 144 0.27 282 0.34 0.87 90 0.17 229 0.27 0.87
Specialist Hematologist 6 0.01 4 0.00 0.04 18 0.03 28 0.03 0.79
Orthopedist 13 0.02 21 0.03 0.60 0 0.00 0 0.00 1.00
Home Health Service 330 0.61 1179 1.40 0.61 15 0.03 441 0.53 0.59
Factor Product (unit) 9,538,452 17,664 16,120,358 19,191 0.07 12,268,724 22,720 15,627,448 18,604 0.08
At Least 1 Visit Per Study
Period Total % Total % P value
2 Total % Total %
P
value2
At Least 1 Hospital
Admission 5 11.1% 9 12.9% 0.51 4 8.9% 6 8.6% 0.60
At Least 1 Emergency Visit 5 11.1% 3 4.3% 0.15 8 17.8% 13 18.6% 0.56
At Least 1 Outpatient Visit 33 73.3% 50 71.4% 0.50 33 73.3% 53 75.7% 0.47
At Least 1 Physician Service 30 66.7% 51 72.9% 0.31 26 57.8% 43 61.4% 0.42
At Least 1 Hematologist
Visit 6 13.3% 2 2.9% 0.04 15 33.3% 21 30.0% 0.43
At Least 1 Orthopedist Visit 10 22.2% 13 18.6% 0.40 0 0.0% 0 0.0% --
At Least 1 Home Health
Service 10 22.2% 17 24.3% 0.49 4 8.9% 8 11.4% 0.46
1 Mann-Whitney Test 2 Chi-Square Test
The average amount of the factor products dispensed to the Caremark recipients were
more than those dispensed to the CuraScript participants during the pre-DMP period
which was 17,664 units PMPM vs. 19,191 units PMPM, P=0.07. The situation became
opposite during the DMP period, in which the average factor product units dispensed to
the Caremark participants were more than those dispensed to the CuraScript participants
which was 22,720 units PMPM vs. 18,604 units PMPM, P=0.07.
Further examinations revealed that two participants were outliers. Compared to the pre-
DMP period, one Caremark recipient was dispensed about two million more units during
the DMP period, and one CuraScript recipient was dispensed one million units less
during the DMP period. After exclusion of the two outliers, 44 Caremark participants and
69 CuraScript participants were compared. The average factor product units dispensed to
Caremark were slightly higher than those dispensed to the CuraScript participants for
both the pre-DMP period (16,977 PMPM vs. 16,618 PMPM, P=0.05) and the DMP
period (18,050 PMPM vs. $17,554 PMPM, P=0.06) (Appendix F).
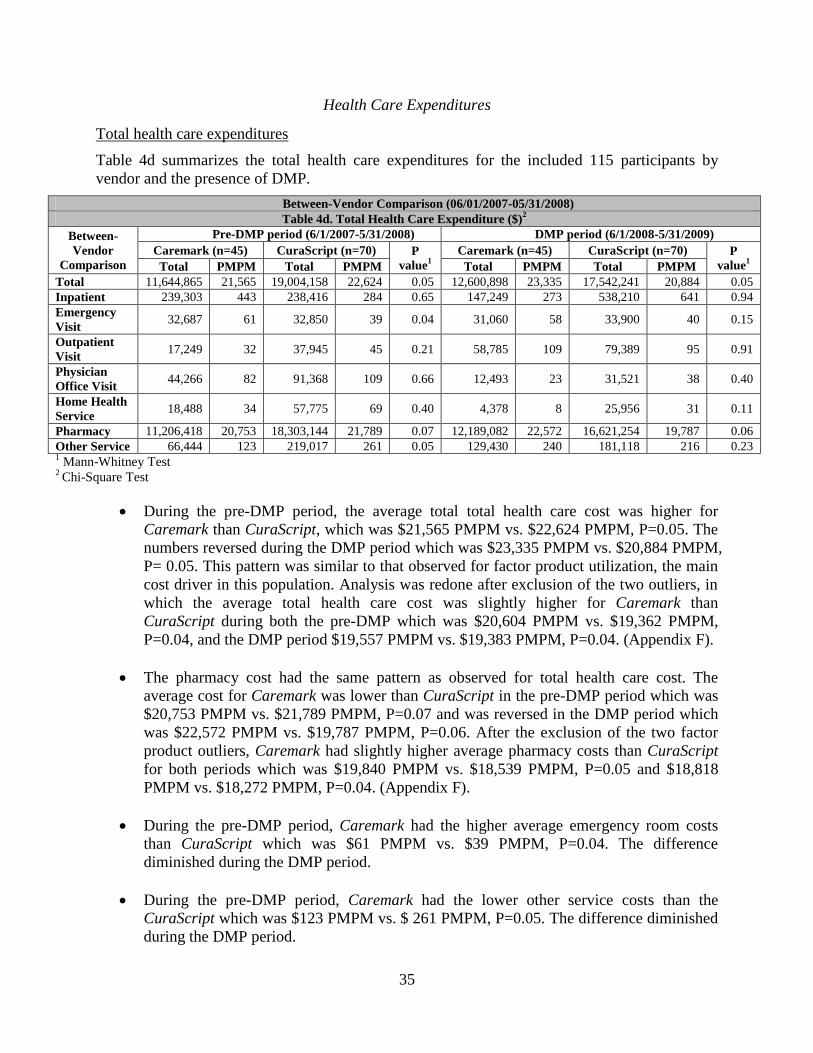
35
Health Care Expenditures
Total health care expenditures
Table 4d summarizes the total health care expenditures for the included 115 participants by
vendor and the presence of DMP.
Between-Vendor Comparison (06/01/2007-05/31/2008)
Table 4d. Total Health Care Expenditure ($)2
Between-
Vendor
Comparison
Pre-DMP period (6/1/2007-5/31/2008) DMP period (6/1/2008-5/31/2009)
Caremark (n=45) CuraScript (n=70) P
value1
Caremark (n=45) CuraScript (n=70) P
value1 Total PMPM Total PMPM Total PMPM Total PMPM
Total 11,644,865 21,565 19,004,158 22,624 0.05 12,600,898 23,335 17,542,241 20,884 0.05
Inpatient 239,303 443 238,416 284 0.65 147,249 273 538,210 641 0.94
Emergency
Visit 32,687 61 32,850 39 0.04 31,060 58 33,900 40 0.15
Outpatient
Visit 17,249 32 37,945 45 0.21 58,785 109 79,389 95 0.91
Physician
Office Visit 44,266 82 91,368 109 0.66 12,493 23 31,521 38 0.40
Home Health
Service 18,488 34 57,775 69 0.40 4,378 8 25,956 31 0.11
Pharmacy 11,206,418 20,753 18,303,144 21,789 0.07 12,189,082 22,572 16,621,254 19,787 0.06
Other Service 66,444 123 219,017 261 0.05 129,430 240 181,118 216 0.23 1 Mann-Whitney Test
2 Chi-Square Test
During the pre-DMP period, the average total total health care cost was higher for
Caremark than CuraScript, which was $21,565 PMPM vs. $22,624 PMPM, P=0.05. The
numbers reversed during the DMP period which was $23,335 PMPM vs. $20,884 PMPM,
P= 0.05. This pattern was similar to that observed for factor product utilization, the main
cost driver in this population. Analysis was redone after exclusion of the two outliers, in
which the average total health care cost was slightly higher for Caremark than
CuraScript during both the pre-DMP which was $20,604 PMPM vs. $19,362 PMPM,
P=0.04, and the DMP period $19,557 PMPM vs. $19,383 PMPM, P=0.04. (Appendix F).
The pharmacy cost had the same pattern as observed for total health care cost. The
average cost for Caremark was lower than CuraScript in the pre-DMP period which was
$20,753 PMPM vs. $21,789 PMPM, P=0.07 and was reversed in the DMP period which
was $22,572 PMPM vs. $19,787 PMPM, P=0.06. After the exclusion of the two factor
product outliers, Caremark had slightly higher average pharmacy costs than CuraScript
for both periods which was $19,840 PMPM vs. $18,539 PMPM, P=0.05 and $18,818
PMPM vs. $18,272 PMPM, P=0.04. (Appendix F).
During the pre-DMP period, Caremark had the higher average emergency room costs
than CuraScript which was $61 PMPM vs. $39 PMPM, P=0.04. The difference
diminished during the DMP period.
During the pre-DMP period, Caremark had the lower other service costs than the
CuraScript which was $123 PMPM vs. $ 261 PMPM, P=0.05. The difference diminished
during the DMP period.
36
No significant statistical differences were detected for hospital inpatient, hospital
outpatient, physician office visits, and home health service costs.
Hemophilia-related health care expenditure
Table 4e summarizes the hemophilia-related health care expenditures for the included
115 participants by vendor and the presence of DMP. No statistically significant differences were
detected for any of the categories.
The total hemophilia-related health care cost was lower for Caremark than CuraScript in
the pre-DMP period which was $20,848 PMPM vs. 21,914 PMPM, P=0.06. In the DMP
period, the numbers reversed which was $22,729 PMPM vs. $19,828 PMPM, P=0.07.
The same pattern was observed for factor product cost which was $20,646 vs. $21,591,
P=0.08 for the pre-DMP and $22,421 vs. $19,573, P=0.07 for the DMP period. These
findings were similar to the previously reported observations on total health care and
pharmacy costs; these categories were mainly driven by factor product costs.
After exclusion of the two factor product outliers, these two cost categories were
consistently higher for Caremark than CuraScript participants in both the pre-DMP and
DMP periods. The total hemophilia-related health care cost was $19,913 PMPM vs.
$18,647 PMPM (P=0.05) in the pre-DMP period, and $18,941 PMPM vs. $18,314
PMPM (P=0.05) in the DMP period. The factor product cost was $19,710 PMPM vs.
$18,339 PMPM (P=0.06) in the pre-DMP period, and $18,664 PMPM vs. $18,055
PMPM in the DMP period (P=0.05) (Appendix F).
No statistically significant differences were detected for hemophilia-related hospital
inpatient, emergency room, hospital outpatient, physician office, and home health service
costs.
Caremark had higher hematologist costs than CuraScript during the pre-DMP period
which was $485 PMPM vs. $17 PMPM. The difference diminished during the DMP
period.
37
Between-Vendor Comparison (6/1/2007-5/31/2008)
Table 4e. Hemophilia-Related Health Care Expenditure ($)1
Between-Vendor
Comparison
Pre-DMP period (6/1/2007-5/31/2008) DMP period (6/1/2008-5/31/2009)
Caremark (n=45) CuraScript (n=70) P
value1
Caremark (n=45) CuraScript (n=70) P value
2
Total PMPM Total PMPM Total PMPM Total PMPM
Total 11,258,162 20,848 18,407,410 21,914 0.06 12,273,783 22,729 16,655,452 19,828 0.07
Inpatient 56,283 104 74,876 89 0.64 29,111 54 67,467 80 0.56
Emergency Visit 2,777 5 2,267 3 0.25 3,388 6 9,699 12 0.86
Outpatient Visit 16,032 30 44,128 53 0.29 37,957 70 49,754 59 0.71
Physician Office Visit 6,227 12 20,617 25 1.00 4,086 8 16,938 20 0.92
Specialist Hematologist 247,469 458 14,526 17 0.03 272,778 505 298,008 355 0.72
Orthopedist 1,901 4 1,792 2 0.61 0 0 0 1.00 1.00
Home Health Service 13,674 25 47,477 57 0.58 3,622 7 14,444 17 0.65
Factor Product 11,136,913 20,624 18,136,362 21,591 0.08 12,107,540 22,421 16,441,402 19,573 0.07 1 All expenditures were adjusted to fiscal year 2008-2009 values
2 Mann-Whitney Test
Pre-post change comparison
For variables different between vendors during the pre-DMP period, the changes over the
two-year period were further compared to adjust for baseline differences. The pre-post changes
were calculated as the DMP minus the pre-DMP value. The results were presented in Table 4f.
No statistically significant differences were detected. The results do not change after exclusion of
the two factor product outliers (Appendix F).
Between-Vendor Comparison (6/1/2007-5/31/2008)
Table 4f. Comparison of Changes in Health Care Resources Utilization And Expenditures Between The
Two Vendor
Between-Vendor Comparison
Caremark (n=45) CuraScript (n=70)
P
value1
pre-post
change
pre-post
change
PMPM
pre-post
change
pre-post
change
PMPM
Health Care
Resource
Utilization
Total Emergency Visit 10 0.02 13 0.02 0.71
Hemophilia-Related
Emergency Visit 3
0.01 18
0.02 0.29
Hematologist Visit 12 0.02 24 0.03 0.57
Factor Product (unit) 2,730,272 5,056.06 -492,910 -586.80 0.74
Health Care
Expenditure ($)2
Total Health Care Cost 956,032 1,770
-
1,461,917 -1,740 0.68
Total Emergency Cost -1,627 -3 1049 1 0.33
Pharmacy Cost 982,664 1,820
-
1,681,890 -2,002 0.96
Total Other Cost 62,986 117 -37,899 -45 0.17
Total Hemophilia-Related
Cost 1,015,620 1,881
-
1,751,958 -2,086 0.78
Hemophilia-Related
Emergency Cost 611 1 7,431 9 0.26
Hematologist Cost 25,310 47 283,482 337 0.75
Factor Product Cost 970,627 1,797
-
1,694,960 -2,018 0.87
1 Mann-Whitney Test
2 All expenditures were adjusted to fiscal year 2008-2009 values
38
Figures 1 and 2 below show the major cost categories discussed above by vendor and
DMP time periods before and after factor product outlier exclusion.
Figure 1. Major health care expenditure categories by vendor and comparison period before outlier exclusion
Figure 2. Major health care expenditure categories by vendor and comparison period after outlier exclusion
$0
$5,000
$10,000
$15,000
$20,000
$25,000
Total all-causehealth care cost
Totalhemophiliarelated cost
Total pharmacycost
Total FactorProduct Cost
Total all-causehealth care cost
Totalhemophiliarelated cost
Total pharmacycost
Total FactorProduct Cost
Pre-DMP DMP
PMPM
CareMark
CuraSCript
$0
$5,000
$10,000
$15,000
$20,000
$25,000
Total all-causehealth care cost
Totalhemophiliarelated cost
Total pharmacycost
Total FactorProduct Cost
Total all-causehealth care cost
Totalhemophiliarelated cost
Total pharmacycost
Total FactorProduct Cost
Pre-DMP DMP
PMPM
CareMark
CuraSCript
39
Discussion
Results
This study evaluated the impact of the Comprehensive Hemophilia Disease Management
Program (DMP) for the Florida Medicaid recipients who need factor product treatments for
hemophilia, vWD or other bleeding disorders. The study period was for a two year period: one
year immediately prior to the DMP implementation (June 1, 2007 to May 31, 2008) and one year
after the DMP implementation (June 1, 2008 to May 31, 2009). Analyses were conducted to
describe the target population eligible for this program. This population included predominantly
young males under the age of 18 and all races were represented. These characteristics are
representative of the broader population of persons who have Hemophilia A or B, which
primarily occurs in male children equally across all races. Despite the small size of 288 enrollees,
Florida Medicaid recipients with hemophilia consumed considerable resources which largely
reflected the cost of factor products. More than half of the Medicaid hemophilia recipients have
severe disease, which explains the large amount of factor product dispensed. The per member per
month expenditure (PMPM) for the factor product during the DMP period was more than
$17,000, accounting for more than 90% of the total health care expenditures.
To further examine the impact of the DMP on health care resource utilization and
expenditures, a pre-post design was used for 117 recipients who had continuous enrollment over
the two-year observation period. Notably, the total factor product units dispensed to this group
increased by about six percent after exclusion of three outliers. This increase was not surprising
because factor product doses are proportional to weight. Most recipients were below 18 years of
age, in an age group who tends to have an annual weight gain of 10%. Despite the increase in the
dispensed factor product units, the total amount of dollars that Florida Medicaid paid remained
nearly unchanged, after all numbers were adjusted to fiscal year 2008-2009 values based on the
Florida Medicaid inflation factor provided by AHCA. This cost savings may result from the new
contract DMP pricing on factor product, which was 39% of the AWP price. Dominated by the
factor product costs, the total expenditures for this patient population remained about the same
between the two comparison periods.
The utilization of some services increased during the DMP period. The number of
hemophilia-related emergency room (ER) visits was higher with seven percent of the recipients
having at least one ER encounter during the pre-DMP period compared to 18% during the DMP
period. Based on the information provided, the reasons for the increased number of ER visits
could not be identified. Importantly, the number of home health services billed to Medicaid
decreased by approximately 60% when participants were served by the vendors, and hemophilia-
related home health service decreased by about 70%. This finding was not surprising since the
vendors provided home health visits for infusion at their own cost. Another possible explanation
for the lower number of claims for home health service is that the participants may have been
more likely to administer the blood factor infusion themselves rather than relying on nurses
during the DMP period. This result was expected due to vendor-provided, self-care training to
program enrollees. Despite this substantial decrease, the impact of this reduction on total
Medicaid expenditures was relatively small, accounting for only 0.2% of the total health care
cost. More hematologist visits were observed during the DMP period and concentrated within
one month immediately following DMP enrollment. These visits appeared to be purposeful for
treatment planning and allowed the vendors to conduct an accurate assessment of the new
40
patients. There were few orthopedic surgeon visits during the DMP period; this type of visit
occurred only in the pre-DMP period.
Because two different vendors, Caremark and CuraScript, provided services to this
population, they were compared against each other in terms of resource utilization by recipients
enrolled with Hemophilia and expenditures. The final comparison included 45 Caremark and 70
CuraScript participants who were continuously enrolled one year prior and one year after the
implementation of DMP without switching vendors. After removing two factor-product outliers,
Caremark recipients were dispensed slightly more factor products than CuraScript. Since factor
product was the main cost driver, the total health care, pharmacy, and hemophilia-related total
health care costs were also higher for Caremark than CuraScript. Considering the fact that the
Caremark recipients also received more factor product in the pre-DMP period and the
incremental changes were not different between the two vendors, the higher factor product
consumption and cost of Caremark was likely due to the nature of the participants cared for
rather than the interventions provided. These two vendors did not appear to affect the health care
utilization or expenditures differently.
Conclusion
Overall, the Comprehensive Hemophilia Disease Management Program did not appear to
change the utilization of health resources for this population, with the exception of the finding of
a lower use of home health services which could particularly be due to cost shifting to the vendor
and not a true reduction in the use of home health services. There was a trend towards an
increased number of hemophilia-related emergency room visits, during the DMP period but this
difference had little impact on the total costs for caring for these patients. The expenditure of
factor products is the major cost driver for the Florida Medicaid hemophilia population. Any
future cost saving interventions will likely be driven by strategies to lower the cost of factor
products. Finally, there were no discernable differences between the two vendors in terms of the
heath care resources consumed by the participants served.
41
References
1. Abshire, T. Inhibitors in hemophilia: nature or nurture? Blood. 2007 June 1;109(11):4596.
2. An Introduction to Haemophilia. The Haemophilia Society. 2008 Retrieved on 15 Jan 2009.
http://www.haemophilia.org.uk/UserFiles/An%20Introduction%20to%20Haemophilia%20.p
df
3. Bohn RL, Aledort LM, Putnam KG, Ewenstein BM, Mogun H, Avorn J. The economic
impact of factor VIII inhibitors in patients with haemophilia. Haemophilia. 2004
Jan;10(1):63-8.
4. Berntorp, E. Joint outcomes in patients with haemophilia: the importance of adherence to
preventive regimens. Haemophilia (2009), 15, 1219–1227
5. Blankenship C. To Manage Costs of Hemophilia, Patients Need More Than Clotting Factor.
Accredo Health Services. Biotechnol Healthc. 2008 Nov–Dec; 5(4): 37–40.
6. Disease Management. Florida Agency for Healthcare Administration. 2009. Retrieved on 31
May 2010. http://ahca.myflorida.com/medicaid/disease_management/index.shtml
7. Factor eight inhibitor bypass activity (FEIBA) in the management of bleeds in hemophilia
patients with high-titer inhibitors. Vasc Health Risk Manag. 2007;3(4):527-31.What Are
Inhibitors? World Federation of Hemophilia. 2009 Retrieved on 30 Jan 2010.
http://www.wfh.org/2/docs/Publications/Inhibitors/Inhibitors_booklet_ENG.pdf
8. Fischer K, van der Bom JG, Mauser-Bunschoten EP, Roosendaal G, Prejs R, de Kleijn P,
Grobbee DE, van den Berg M. The effects of postponing prophylactic treatment on long-term
outcome in patients with severe hemophilia. Blood. 2002(a) Apr 1;99(7):2337-41.
9. Fischer K, van der Bom JG, Molho P, Negrier C, Mauser-Bunschoten EP, Roosendaal G, De
Kleijn P, Grobbee DE, van den Berg HM. Prophylactic versus on-demand treatment
strategies for severe haemophilia: a comparison of costs and long-term outcome.
Haemophilia. 2002(b) Nov;8(6):745-52.
10. Florida Medicaid. Florida Agency for Healthcare Administration. 2009. Retrieved on 31 May
2010. http://ahca.myflorida.com/Medicaid/flmedicaid.shtml
11. Globe DR, Cunningham WE, Andersen R, Dietrich SL, Curtis RG, Parish KL, Miller RT,
Sanders NL, Kominski G; Hemophilia Utilization Group Study.The Hemophilia Utilization
Group Study (HUGS): determinants of costs of care in persons with haemophilia A.
Haemophilia. 2003 May;9(3):325-31.
12. Globe DR, Curtis RG, Koerper MA; HUGS Steering Committee. Utilization of care in
haemophilia: a resource-based method for cost analysis from the Haemophilia Utilization
Group Study (HUGS).Haemophilia. 2004 Mar;10 Suppl 1:63-70.
13. Gouw SC, van der Bom JG, Auerswald G, Ettinghausen CE, Tedgård U, van den Berg HM.
Recombinant versus plasma-derived factor VIII products and the development of inhibitors
in previously untreated patients with severe Hemophilia A: the CANAL cohort study. Blood.
2007 Jun 1;109(11):4693-7. Epub 2007 Jan 11.
14. Guidelines for the Management of Hemophilia. World Federation of Hemophilia. 2005.
Retrieved on 23 Jan 2010.
http://www.ehc.eu/fileadmin/dokumente/Gudelines_Mng_Hemophilia.pdf
15. Hemophilia of Georgia (USA). Protocols for the Treatment of Hemophilia and Von
Willebrand Disease. Treatment of Hemophilia. 2008 Apr; 14. Retrieved on 23 Jan 2010.
42
http://www.wfh.org/2/docs/Publications/Diagnosis_and_Treatment/TOH-
14_English_von_Willebrand.pdf
16. Hoots, KW. Emergency Care Issues in Hemophilia. Treatment of Hemophilia. 2007 Nov; 43.
Retrieved on 23 Jan 2010.
http://www.wfh.org/2/docs/Publications/Diagnosis_and_Treatment/TOH-43-Emergency-
Care.pdf
17. Invitation To Negotiate: For Participation In The Hemophilia Disease Management Initiative
Of The Florida Medicaid Program. Florida Agency for Healthcare Administration. 24 August
1998
18. Kern M, Blanchette V, Stain AM, Einarson TR, Feldman BM. Clinical And Cost
Implications Of Target Joints In Canadian Boys With Severe Hemophilia A. J Pediatr. 2004
Nov;145(5):628-34.
19. Linney, D. Medical And Pharmacy Cost Management Of The Patient With Hemophilia And
Utilization Of Federally-Funded Hemophilia Treatment Center. Great Lakes Hemophilia
Foundations. Retrieved on 26 Jan 2010.
http://www.glhf.org/Advocacy%20Articles/Cost%20management.htm
20. Mannucci, P.M. Back to the future: a recent history of haemophilia treatment. Haemophilia
(2008), 14 (Suppl. 3), 10–18
21. Medipass Overview. Florida Agency for Healthcare Administration. 2009. Retrieved 31 May
2010. http://ahca.myflorida.com/Medicaid/MediPass/index.shtml
22. Miners A. Revisiting the cost-effectiveness of primary prophylaxis with clotting factor for
the treatment of severe haemophilia A. Haemophilia (2009), 15, 881–887
23. National Heart Lung and Blood Institute: Diseases and Conditions Index. How is Hemophilia
Treated? Retrieved on 30 Jan 2010.
http://www.nhlbi.nih.gov/health/dci/Diseases/hemophilia/hemophilia_treatments.html
24. National Institute of Neurological Disorders and Stroke (NINDS). Creutzfeldt-Jakob Disease
Fact Sheet. Retrieved on 25 Jan 2010. http://www.ninds.nih.gov/disorders/cjd/detail_cjd.htm
25. Oldenburg J, Dolan G, Lemm G. Haemophilia care then, now and in the future. Haemophilia.
2009 Jan;15 Suppl 1:2-7. Review.
26. Petrini, P. Identifying and overcoming barriers to prophylaxis in the management of
haemophilia. Haemophilia (2007), 13 (Suppl. 2), 16–22
27. Pipe S. Antihemophilic factor (recombinant) plasma/albumin-free method for the
management and prevention of bleeding episodes in patients with Hemophilia A. Biologics.
2009;3:117-25. Epub 2009 Jul 13.
28. Shapiro, A. Anti-hemophilic factor (recombinant), plasma/albumin-free method (octocog-
alpha; ADVATE®
) in the management of Hemophilia A. Vasc Health Risk Manag. 2007
October; 3(5): 555–565. Published online 2007 October.
29. Soucie JM, Evatt B, Jackson D. Occurrence of hemophilia in the United States. The
Hemophilia Surveillance System Project Investigators.Am J Hematol. 1998 Dec;59(4):288-
94.
30. Specialty Pharmacy: Specialty Pharmacies Seek Ways to Deliver Financial and Clinical
Outcomes to Payers. The AIS Guide to Medicare Compliance Risks & Strategies. 2005 July.
Retrieved on 23 Jan 2020.
http://www.aishealth.com/DrugCosts/specialty/SPN_SPs_Seek_Ways_to_Deliver_Outcomes
.html
43
31. Tjønnfjord GE, Holme PA. Factor eight inhibitor bypass activity (FEIBA) in the
management of bleeds in hemophilia patients with high-titer inhibitors. Vascular health and
risk management. 2007;3(4):527-31.
32. Tagliaferri A, Di Perna C, Rivolta GF. Secondary prophylaxis in adolescent and adult
haemophiliacs. Blood Transfus. 2008 Sep;6 Suppl 2:s17-20.
33. The Florida Medicaid Disease Management Initiative: A Report on the Florida Medicaid
Disease Management Program – Historical Perspective, Start–Up Activities, Current
Operations, Future Operations and Expectations. Florida Agency for Healthcare
Administration. 2000 February
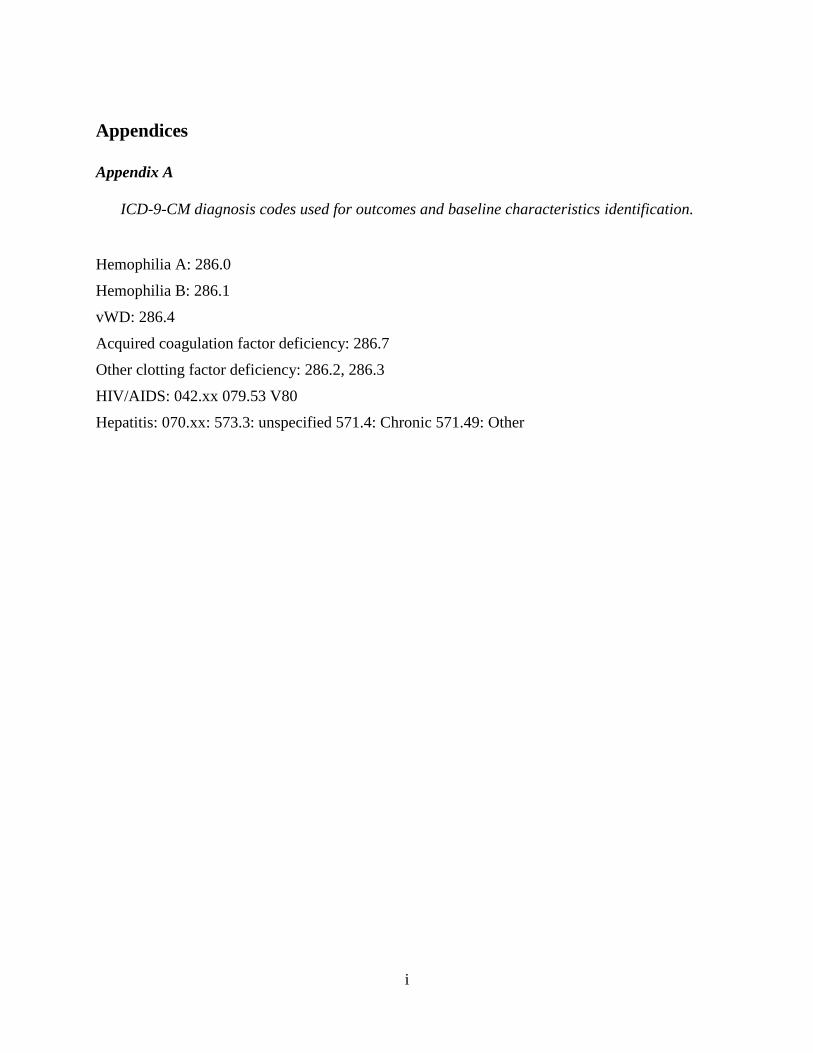
i
Appendices
Appendix A
ICD-9-CM diagnosis codes used for outcomes and baseline characteristics identification.
Hemophilia A: 286.0
Hemophilia B: 286.1
vWD: 286.4
Acquired coagulation factor deficiency: 286.7
Other clotting factor deficiency: 286.2, 286.3
HIV/AIDS: 042.xx 079.53 V80
Hepatitis: 070.xx: 573.3: unspecified 571.4: Chronic 571.49: Other
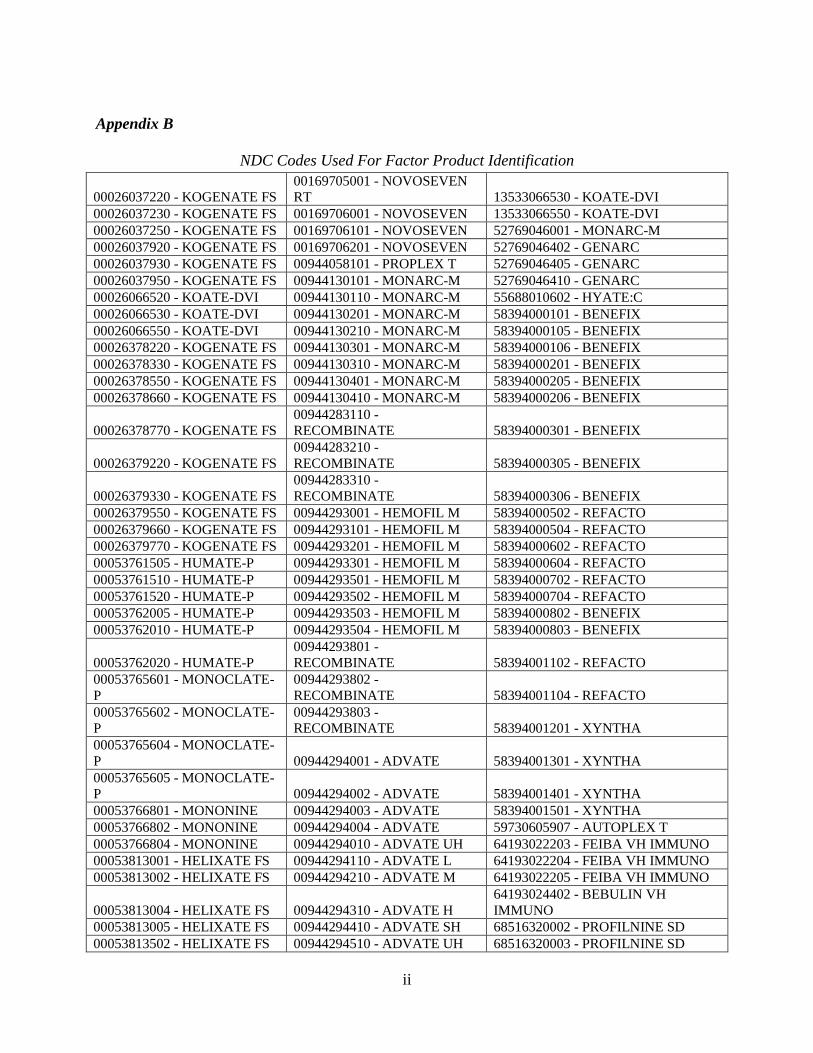
ii
Appendix B
NDC Codes Used For Factor Product Identification
00026037220 - KOGENATE FS
00169705001 - NOVOSEVEN
RT 13533066530 - KOATE-DVI
00026037230 - KOGENATE FS 00169706001 - NOVOSEVEN 13533066550 - KOATE-DVI
00026037250 - KOGENATE FS 00169706101 - NOVOSEVEN 52769046001 - MONARC-M
00026037920 - KOGENATE FS 00169706201 - NOVOSEVEN 52769046402 - GENARC
00026037930 - KOGENATE FS 00944058101 - PROPLEX T 52769046405 - GENARC
00026037950 - KOGENATE FS 00944130101 - MONARC-M 52769046410 - GENARC
00026066520 - KOATE-DVI 00944130110 - MONARC-M 55688010602 - HYATE:C
00026066530 - KOATE-DVI 00944130201 - MONARC-M 58394000101 - BENEFIX
00026066550 - KOATE-DVI 00944130210 - MONARC-M 58394000105 - BENEFIX
00026378220 - KOGENATE FS 00944130301 - MONARC-M 58394000106 - BENEFIX
00026378330 - KOGENATE FS 00944130310 - MONARC-M 58394000201 - BENEFIX
00026378550 - KOGENATE FS 00944130401 - MONARC-M 58394000205 - BENEFIX
00026378660 - KOGENATE FS 00944130410 - MONARC-M 58394000206 - BENEFIX
00026378770 - KOGENATE FS
00944283110 -
RECOMBINATE 58394000301 - BENEFIX
00026379220 - KOGENATE FS
00944283210 -
RECOMBINATE 58394000305 - BENEFIX
00026379330 - KOGENATE FS
00944283310 -
RECOMBINATE 58394000306 - BENEFIX
00026379550 - KOGENATE FS 00944293001 - HEMOFIL M 58394000502 - REFACTO
00026379660 - KOGENATE FS 00944293101 - HEMOFIL M 58394000504 - REFACTO
00026379770 - KOGENATE FS 00944293201 - HEMOFIL M 58394000602 - REFACTO
00053761505 - HUMATE-P 00944293301 - HEMOFIL M 58394000604 - REFACTO
00053761510 - HUMATE-P 00944293501 - HEMOFIL M 58394000702 - REFACTO
00053761520 - HUMATE-P 00944293502 - HEMOFIL M 58394000704 - REFACTO
00053762005 - HUMATE-P 00944293503 - HEMOFIL M 58394000802 - BENEFIX
00053762010 - HUMATE-P 00944293504 - HEMOFIL M 58394000803 - BENEFIX
00053762020 - HUMATE-P
00944293801 -
RECOMBINATE 58394001102 - REFACTO
00053765601 - MONOCLATE-
P
00944293802 -
RECOMBINATE 58394001104 - REFACTO
00053765602 - MONOCLATE-
P
00944293803 -
RECOMBINATE 58394001201 - XYNTHA
00053765604 - MONOCLATE-
P 00944294001 - ADVATE 58394001301 - XYNTHA
00053765605 - MONOCLATE-
P 00944294002 - ADVATE 58394001401 - XYNTHA
00053766801 - MONONINE 00944294003 - ADVATE 58394001501 - XYNTHA
00053766802 - MONONINE 00944294004 - ADVATE 59730605907 - AUTOPLEX T
00053766804 - MONONINE 00944294010 - ADVATE UH 64193022203 - FEIBA VH IMMUNO
00053813001 - HELIXATE FS 00944294110 - ADVATE L 64193022204 - FEIBA VH IMMUNO
00053813002 - HELIXATE FS 00944294210 - ADVATE M 64193022205 - FEIBA VH IMMUNO
00053813004 - HELIXATE FS 00944294310 - ADVATE H
64193024402 - BEBULIN VH
IMMUNO
00053813005 - HELIXATE FS 00944294410 - ADVATE SH 68516320002 - PROFILNINE SD
00053813502 - HELIXATE FS 00944294510 - ADVATE UH 68516320003 - PROFILNINE SD
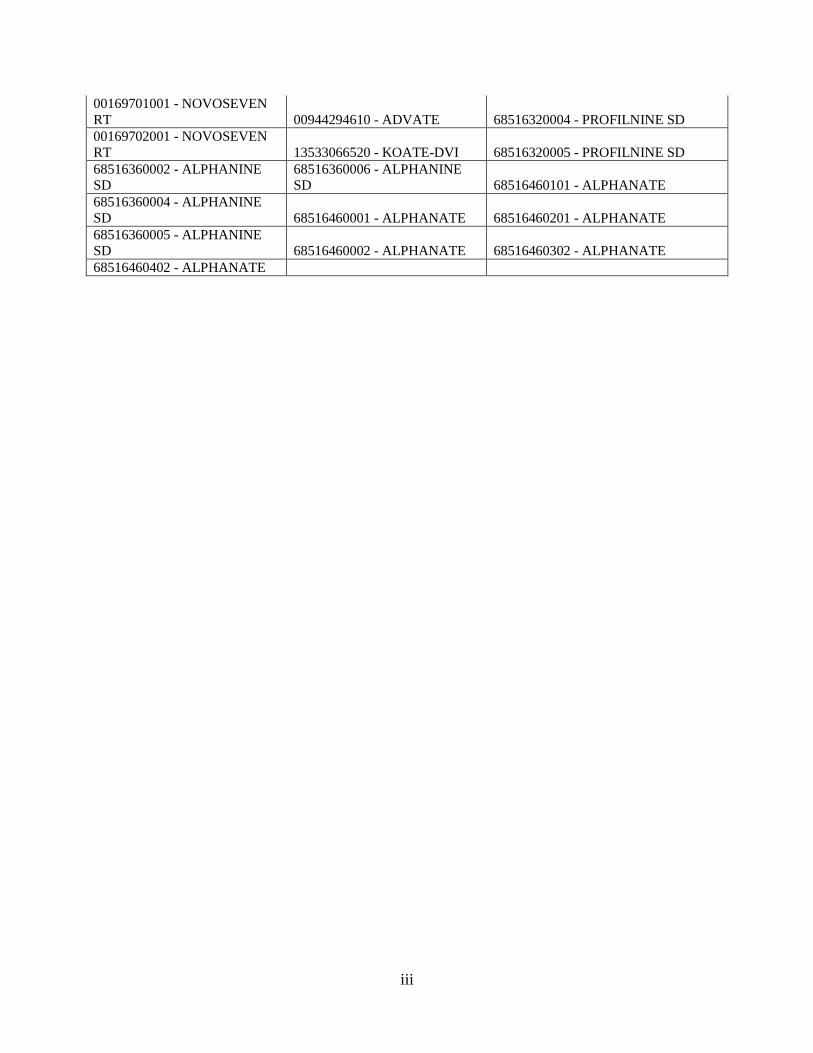
iii
00169701001 - NOVOSEVEN
RT 00944294610 - ADVATE 68516320004 - PROFILNINE SD
00169702001 - NOVOSEVEN
RT 13533066520 - KOATE-DVI 68516320005 - PROFILNINE SD
68516360002 - ALPHANINE
SD
68516360006 - ALPHANINE
SD 68516460101 - ALPHANATE
68516360004 - ALPHANINE
SD 68516460001 - ALPHANATE 68516460201 - ALPHANATE
68516360005 - ALPHANINE
SD 68516460002 - ALPHANATE 68516460302 - ALPHANATE
68516460402 - ALPHANATE
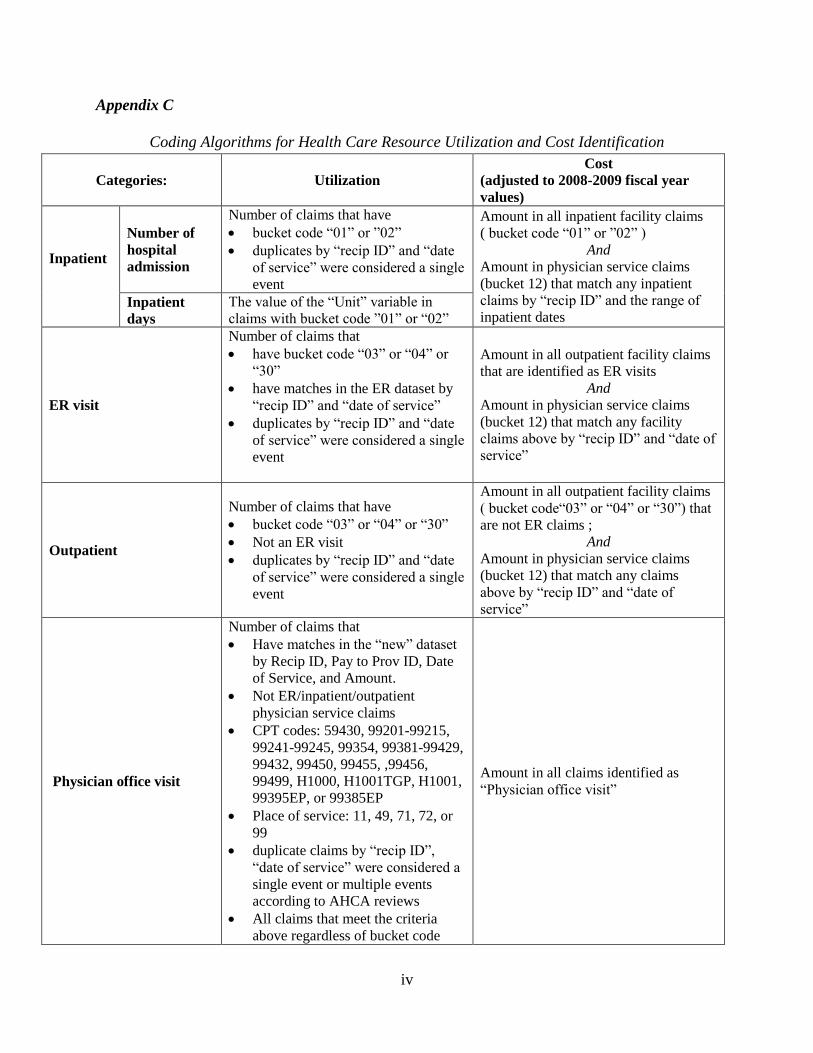
iv
Appendix C
Coding Algorithms for Health Care Resource Utilization and Cost Identification
Categories: Utilization
Cost
(adjusted to 2008-2009 fiscal year
values)
Inpatient
Number of
hospital
admission
Number of claims that have
bucket code “01” or ”02”
duplicates by “recip ID” and “date
of service” were considered a single
event
Amount in all inpatient facility claims
( bucket code “01” or ”02” )
And
Amount in physician service claims
(bucket 12) that match any inpatient
claims by “recip ID” and the range of
inpatient dates Inpatient
days
The value of the “Unit” variable in
claims with bucket code ”01” or “02”
ER visit
Number of claims that
have bucket code “03” or “04” or
“30”
have matches in the ER dataset by
“recip ID” and “date of service”
duplicates by “recip ID” and “date
of service” were considered a single
event
Amount in all outpatient facility claims
that are identified as ER visits
And
Amount in physician service claims
(bucket 12) that match any facility
claims above by “recip ID” and “date of
service”
Outpatient
Number of claims that have
bucket code “03” or “04” or “30”
Not an ER visit
duplicates by “recip ID” and “date
of service” were considered a single
event
Amount in all outpatient facility claims
( bucket code“03” or “04” or “30”) that
are not ER claims ;
And
Amount in physician service claims
(bucket 12) that match any claims
above by “recip ID” and “date of
service”
Physician office visit
Number of claims that
Have matches in the “new” dataset
by Recip ID, Pay to Prov ID, Date
of Service, and Amount.
Not ER/inpatient/outpatient
physician service claims
CPT codes: 59430, 99201-99215,
99241-99245, 99354, 99381-99429,
99432, 99450, 99455, ,99456,
99499, H1000, H1001TGP, H1001,
99395EP, or 99385EP
Place of service: 11, 49, 71, 72, or
99
duplicate claims by “recip ID”,
“date of service” were considered a
single event or multiple events
according to AHCA reviews
All claims that meet the criteria
above regardless of bucket code
Amount in all claims identified as
“Physician office visit”
v
Specialist visit
Number of hematologist visits:
Claims that have TRSPEC="15"
Number of orthopedic surgeon
claims:
Claims that have TRSPEC="58”
duplicates by “recip ID” and “date
of service” were considered a single
event
Amount in claims that have
TRSPEC="15"
Amount in claims that have
TRSPEC="58”
Home health service
Number of claims that have
Bucket code “20” and “21”
duplicates on “recip ID” and “date
of service” were considered a single
event
Amount in all home health service
claims ( bucket code “20” and “21”)
Factor product Total units of claims with NDC
codes for factor products
Amount in all claims with NDC codes
for factor products
Pharmacy Number of claims that have bucket
code “14”
Amount in all pharmacy claims (bucket
code “14”)
All other type
All other claims that do not belong
to any outcome categories above
duplicates by “bucket code”, “recip
ID” and “date of service” were
considered a single event
Amount in all other type claims that do
not belong to any outcome categories
above
vi
Appendix D
Data Analyses:
Non-parametric statistical methods were used, which did not require data distribution
assumptions and the results were robust to outliers. A p-value of 0.05 or less was considered
statistically significant.
Overall DMP Evaluation
A descriptive data analysis was performed to show the trend of outcome change over
time on a monthly basis (PMPM). Outcome variables were compared before and after
implementation of the DMP. Since the pre-post samples were dependent, McNemar’s test was
used to compare categorical variables and two-tailed paired t-test was used to compare
continuous variables that were approximately normally distributed. Two-tailed Wilcoxon signed
ranks test was used for continuous variables that were not normally distributed. A p-value of
0.05 or less was considered statistically significant. All expenditures were adjusted to fiscal year
2008-2009 values based on the Florida Medicaid inflation factor provided by AHCA. Outliers
for factor product dispensed were determined as ± 3 standard deviations away from the mean.
Between Vendor Comparison
Univariate analysis was performed to compare the baseline characteristics and outcome
variables between the two groups. Chi-square statistic was used for categorical variables.
Fisher’s exact test was used when any expected frequency was less than 5. Two-tailed t-test was
used for continuous variables that were approximately normally distributed. Two-tailed
Wilcoxon Rank Sum test was used for continuous variables that are not normally distributed. For
variables that were found to be different during the pre-DMP period at a significance level of P <
0.20, the changes across the two-year period would be further compared between the two groups.
A p-value of 0.05 or less was considered statistically significant. All expenditures were adjusted
to fiscal year 2008-2009 values based on the Florida Medicaid inflation factor provided by
AHCA.
vii
Appendix E
Cost per category without outlier exclusion (bucket code) ($)
Bucket code Description Amount 1 Percentage Rank
14 PRESCRIBED MEDICINE 86124597.92 93.9% 1
1 HOSPITAL INPATIENT 2670124.24 2.9% 2
3 HOSPITAL OUTPATIENT 760739.07 0.8% 3
12 PHYSICIAN SERVICES 590210.06 0.6% 4
42 PERSONAL CARE SRVCES 362269.25 0.4% 5
63 PREPAID MH 259421.1 0.3% 6
20 HOME HEALTH SERVICS 181253.29 0.2% 7
43 PRIVATE DUTY NURSE 132105.27 0.1% 8
36 DEVELOPMENTAL SERVCS 127691.02 0.1% 9
7 INTRMD CARE LEVEL I 81204.38 0.1% 10
6 SKILLED NURSING HOME 56065.5 0.1% 11
23 CHILD DENTAL 30784.43 0.0% 12
11 ICF-MR PRIVATE FACLT 30538.02 0.0% 13
45 SPEECH THERAPY 30243.41 0.0% 14
49 FQHC 29761.47 0.0% 15
46 OCCUPATIONAL THERPY 24532.32 0.0% 16
15 LAB AND X-RAY 22296.8 0.0% 17
17 TRANSPORTATION 21050 0.0% 18
76 Unknown 20326.11 0.0% 19
40 RURAL HEALTH SERVICS 19527.94 0.0% 20
53 CLINIC SVCS 15696.14 0.0% 21
22 EPSDT SCREENING 14715.94 0.0% 22
37 AIDS WAIVER SERVICES 13148.08 0.0% 23
52 MEDIPASS 9684.01 0.0% 24
44 PHYSICAL THERAPY 9459.01 0.0% 25
47 RESPIRATORY THERAPY 7912.5 0.0% 26
29 ADULT HEARING 7538.75 0.0% 27
64 SCHOOL BASED SVCS 6303.08 0.0% 28
24 CHILD VISION 5024.88 0.0% 29
26 ADULT DENTAL 3922.71 0.0% 30
31 NURSE PRACTITIONER 3741.85 0.0% 31
19 FAMILY PLANNING 3366.79 0.0% 32
72 Unspecified 2861.76 0.0% 33
59 TFC COMM MENTL HLTH 2565.46 0.0% 34
99 Unspecified 1825.57 0.0% 35
27 ADULT VISION 1210.85 0.0% 37
68 PSN 945 0.0% 38
25 CHILD HEARING 893.1 0.0% 39
54 DS SLAMS 747.76 0.0% 40
8 INTRMD CARE LEVEL II 721.59 0.0% 41
62 PHYSICIAN ASSISTANT 547.45 0.0% 42
28 ADULT HEARING 442.44 0.0% 43
4 HOSPITAL OP CROSSVER 70.68 0.0% 44
57 DEVELOPMENT E & I 53.06 0.0% 45
74 Unspecified 9 0.0% 74 1 All expenditures were adjusted to fiscal year 2008-2009 values
viii
Appendix F
Evaluation Without Factor Product Outliers
Overall DMP Evaluation with Pre-Post Design (n=114) Without 3 Factor Product Outliers
Pre-Post Comparison
Pre-DMP Period DMP Period
P
value1
(06/01/2007-05/31/2008) (06/01/2008-
05/31/2009)
Total PMPM Total PMPM
Factor Product (Unit) 22,807,226 19,245 24,188,101 18,886 0.40
Total Health Care Cost3 27,019,526 18,471 26,516,040 17,948 0.47
Pharmacy Cost3 25,933,758 18,563 25,198,600 18,019 0.33
Hemophilia-Related Total Health Care Cost3 26,062,195 18,304 25,299,262 17,761 0.33
Factor Product Cost3 25,699,188 19,245 24,937,000 18,886 0.30
Pre-DMP Period Between-Vendor Comparison (06/01/2007-05/31/2008)
Between-Vendor Comparison Caremark (n=44) CuraScript (n=69) P
value2 Total PMPM Total PMPM
Factor Product (Unit) 8,963,856 16,977 13,759,704 16,618 0.05
Total Health Care Cost3 10,879,127 20,604 16,031,552 19,362 0.04
Pharmacy Cost3 10,475,652 19,840 15,350,427 18,539 0.05
Hemophilia-Related Total Health Care Cost3 10,514,296 19,913 15,43,9761 18,647 0.05
Factor Product Cost3 10,406,810 19,710 15,184,919 18,339 0.06
DMP Period Between-Vendor Comparison (06/01/2008-05/31/2009)
Between-Vendor Comparison Caremark (n=44) CuraScript (n=69) P
value2 Total PMPM Total PMPM
Factor Product (Unit) 9,530,400 18,050 9,268,512 17,554 0.06
Total Health Care Cost3 10,326,004 19,557 16,049,174 19,383 0.04
Pharmacy Cost3 9,936,125 18,818 15,12,9224 18,272 0.04
Hemophilia-Related Total Health Care Cost3 10,000,795 18,941 15,163,606 18,314 0.05
Factor Product Cost3 9,854,689 18,664 14,949,838 18,055 0.05
1 Wilcoxon Signed Rank Test
2 Mann-Whitney Test
3 All expenditures were adjusted to fiscal year 2008-2009 values
Incremental Health Care Resources Utilization And Expenditure Comparison Between The Two Vendor
Groups Period
Between-Vendor Comparison
Caremark (n=44) CuraScript (n=69)
P value1
Total
pre-post
change
pre-post
change/member
Total
pre-post
change
pre-post
change/mem
ber
Factor Product (unit) 566,895 47,241 775,233 64,603 0.99
Total Health Care Cost ($)2 -553,123 -1,024 17,622 21 0.93
Pharmacy Cost ($) -539,527 -999 -221,203 -263 0.78
Total Hemophilia-Related Cost ($) 2 -513,501 -951 -276,155 -329 0.96
Factor Product Cost ($)2 -552,121 -1,022 -235,081 -280 0.86
1 Mann-Whitney Test
2 All expenditures were adjusted to fiscal year 2008-2009 values